Project
GSE55662: Plasticity of transcriptional regulation under antibiotic stress
Navigation
Downloads
Results for PhoP
Z-value: 1.02
Transcription factors associated with PhoP
| Gene Symbol | Gene ID | Gene Info |
|---|---|---|
|
phoP
|
phoP | PhoP |
Activity-expression correlation:
| Gene | Promoter | Pearson corr. coef. | P-value | Plot |
|---|---|---|---|---|
| phoP | 0.04 | 9.3e-01 | Click! |
Activity profile of PhoP motif
Sorted Z-values of PhoP motif
| Promoter | Log-likelihood | Transcript | Gene | Gene Info |
|---|---|---|---|---|
| treR | 4.64 |
treR
|
TreR DNA-binding transcriptional repressor |
|
| iraM | 4.31 |
iraM
|
inhibitor of σS proteolysis |
|
| pagP | 1.79 |
pagP
|
palmitoyl transferase for Lipid A |
|
| dcuD | 1.69 |
dcuD
|
putative transport protein, C4-dicarboxylate uptake C family |
|
| safA-ydeO | 1.68 |
ydeO
safA
|
YdeO DNA-binding transcriptional dual regulator two-component system connector protein |
|
| ompT | 1.26 |
ompT
|
outer membrane protease VII (outer membrane protein 3b) |
|
| mgtLA | 1.22 |
mgtA
mgtL
|
Mg2+ / Ni2+ transporting ATPase predicted leader peptide |
|
| purHD | 1.01 |
purH
purD
|
AICAR transformylase/IMP cyclohydrolase phosphoribosylamine-glycine ligase |
|
| phoPQ | 0.83 |
phoQ
phoP
|
PhoQ sensory histidine kinase PhoP |
|
| malS | 0.75 |
malS
|
α-amylase |
|
| gadW | 0.60 |
gadW
|
GadW DNA-binding transcriptional dual regulator |
|
| rstAB | 0.36 |
rstA
rstB
|
RstA transcriptional regulator RstB sensory histidine kinase |
|
| rutABCDEFG | 0.18 |
rutC
rutB
rutA
rutG
rutF
rutE
rutD
|
predicted aminoacrylate peracid reductase peroxyureidoacrylate / ureidoacrylate amido hydrolase pyrimidine oxygenase uracil:H+ symporter RutG flavin reductase predicted malonic semialdehyde reductase predicted aminoacrylate hydrolase |
|
| ydeP | 0.16 |
ydeP
|
acid resistance protein |
|
| tolC-ygiABC | 0.11 |
ygiC
ygiB
ygiA
tolC
|
predicted enzyme with ATPase activity conserved outer membrane protein predicted protein TolC outer membrane channel |
|
| ybjG | 0.06 |
ybjG
|
undecaprenyl pyrophosphate phosphatase |
|
| gadE | 0.06 |
gadE
|
GadE DNA-binding transcriptional activator |
|
| argD | 0.01 |
argD
|
N-acetylornithine aminotransferase / N-succinyldiaminopimelate aminotransferase |
Network of associatons between targets according to the STRING database.

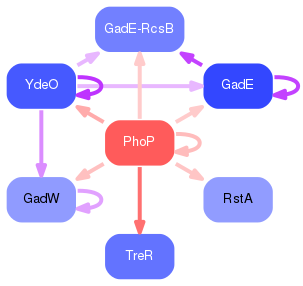
First level regulatory network of PhoP
Gene Ontology Analysis
Gene overrepresentation in biological process category:
| Log-likelihood per target | Total log-likelihood | Term | Description |
|---|---|---|---|
| 1.7 | 5.1 | GO:0010350 | cellular response to magnesium starvation(GO:0010350) |
| 0.3 | 0.8 | GO:0030980 | alpha-glucan metabolic process(GO:0030978) alpha-glucan catabolic process(GO:0030980) |
| 0.2 | 1.2 | GO:0031556 | transcriptional attenuation by ribosome(GO:0031556) |
| 0.2 | 1.7 | GO:0015740 | C4-dicarboxylate transport(GO:0015740) |
| 0.1 | 1.8 | GO:0046493 | lipid A biosynthetic process(GO:0009245) lipid A metabolic process(GO:0046493) |
| 0.1 | 1.0 | GO:0006164 | purine nucleotide biosynthetic process(GO:0006164) |
| 0.1 | 0.4 | GO:0018106 | peptidyl-histidine phosphorylation(GO:0018106) peptidyl-histidine modification(GO:0018202) |
| 0.1 | 4.6 | GO:1903507 | negative regulation of transcription, DNA-templated(GO:0045892) negative regulation of RNA biosynthetic process(GO:1902679) negative regulation of nucleic acid-templated transcription(GO:1903507) |
| 0.1 | 0.2 | GO:0006208 | pyrimidine nucleobase catabolic process(GO:0006208) pyrimidine nucleobase transport(GO:0015855) |
| 0.1 | 1.3 | GO:0006508 | proteolysis(GO:0006508) |
| 0.0 | 1.7 | GO:0051254 | positive regulation of transcription, DNA-templated(GO:0045893) positive regulation of RNA metabolic process(GO:0051254) positive regulation of RNA biosynthetic process(GO:1902680) positive regulation of nucleic acid-templated transcription(GO:1903508) |
| 0.0 | 0.1 | GO:0015891 | siderophore transport(GO:0015891) |
| 0.0 | 0.7 | GO:2001141 | regulation of transcription, DNA-templated(GO:0006355) regulation of nucleic acid-templated transcription(GO:1903506) regulation of RNA biosynthetic process(GO:2001141) |
Gene overrepresentation in cellular component category:
| Log-likelihood per target | Total log-likelihood | Term | Description |
|---|---|---|---|
| 0.3 | 1.2 | GO:0043231 | membrane-bounded organelle(GO:0043227) intracellular membrane-bounded organelle(GO:0043231) |
| 0.1 | 1.3 | GO:0031230 | intrinsic component of cell outer membrane(GO:0031230) |
| 0.0 | 3.8 | GO:0005887 | integral component of plasma membrane(GO:0005887) |
| 0.0 | 0.6 | GO:0030288 | outer membrane-bounded periplasmic space(GO:0030288) |
| 0.0 | 0.5 | GO:0016021 | integral component of membrane(GO:0016021) |
Gene overrepresentation in molecular function category:
| Log-likelihood per target | Total log-likelihood | Term | Description |
|---|---|---|---|
| 1.1 | 4.3 | GO:0043856 | anti-sigma factor antagonist activity(GO:0043856) |
| 0.3 | 1.0 | GO:0019238 | cyclohydrolase activity(GO:0019238) |
| 0.2 | 1.8 | GO:0008374 | O-acyltransferase activity(GO:0008374) |
| 0.2 | 1.2 | GO:0019829 | cation-transporting ATPase activity(GO:0019829) |
| 0.2 | 1.3 | GO:0004252 | serine-type endopeptidase activity(GO:0004252) |
| 0.1 | 0.8 | GO:0005509 | calcium ion binding(GO:0005509) |
| 0.1 | 6.9 | GO:0003700 | transcription factor activity, sequence-specific DNA binding(GO:0003700) |
| 0.1 | 1.2 | GO:0004673 | phosphorelay sensor kinase activity(GO:0000155) protein histidine kinase activity(GO:0004673) |
| 0.1 | 0.2 | GO:0004497 | monooxygenase activity(GO:0004497) pyrimidine nucleobase transmembrane transporter activity(GO:0005350) |
| 0.0 | 0.1 | GO:0050380 | undecaprenyl-diphosphatase activity(GO:0050380) |
| 0.0 | 0.1 | GO:0015562 | efflux transmembrane transporter activity(GO:0015562) |