Project
GSE55662: Plasticity of transcriptional regulation under antibiotic stress
Navigation
Downloads
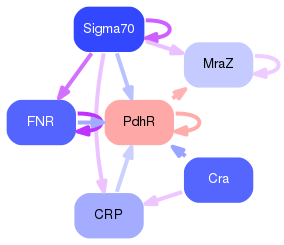
Results for PdhR
Z-value: 0.80
Transcription factors associated with PdhR
| Gene Symbol | Gene ID | Gene Info |
|---|---|---|
|
pdhR
|
pdhR | PdhR DNA-binding transcriptional dual regulator |
Activity-expression correlation:
| Gene | Promoter | Pearson corr. coef. | P-value | Plot |
|---|---|---|---|---|
| pdhR | 0.96 | 2.0e-04 | Click! |
Activity profile of PdhR motif
Sorted Z-values of PdhR motif
| Promoter | Log-likelihood | Transcript | Gene | Gene Info |
|---|---|---|---|---|
| hemL | 7.82 |
hemL
|
glutamate-1-semialdehyde aminotransferase |
|
| ndh | 1.18 |
ndh
|
NADH:quinone oxidoreductase II |
|
| pdhR-aceEF-lpd | 1.04 |
pdhR
lpd
aceF
aceE
|
PdhR DNA-binding transcriptional dual regulator lipoamide dehydrogenase pyruvate dehydrogenase, E2 subunit subunit of E1p component of pyruvate dehydrogenase complex |
|
| grcA | 0.97 |
grcA
|
stress-induced alternate pyruvate formate-lyase subunit |
|
| mraZ-rsmH-ftsLI-murEF-mraY-murD-ftsW-murGC-ddlB-ftsQAZ-lpxC | 0.79 |
murC
mraZ
ftsA
mraY
rsmH
ftsL
murD
murE
ftsI
murG
ftsW
murF
ftsQ
lpxC
ddlB
ftsZ
|
UDP-N-acetylmuramate-alanine ligase MraZ DNA-binding transcriptional repressor essential cell division protein FtsA phospho-N-acetylmuramoyl-pentapeptide transferase 16S rRNA m4C1402 methyltransferase essential cell division protein FtsL UDP-N-acetylmuramoyl-L-alanine:D-glutamate ligase UDP-N-acetylmuramoylalanyl-D-glutamate 2,6-diaminopimelate ligase essential cell division protein FtsI; penicillin-binding protein 3 N-acetylglucosaminyl transferase essential cell division protein FtsW; lipid II flippase D-alanyl-D-alanine-adding enzyme essential cell division protein FtsQ UDP-3-O-acyl-N-acetylglucosamine deacetylase D-alanine-D-alanine ligase B essential cell division protein FtsZ |
Network of associatons between targets according to the STRING database.

First level regulatory network of PdhR
Gene Ontology Analysis
Gene overrepresentation in biological process category:
| Log-likelihood per target | Total log-likelihood | Term | Description |
|---|---|---|---|
| 1.6 | 7.8 | GO:0006782 | protoporphyrinogen IX biosynthetic process(GO:0006782) |
| 0.3 | 1.0 | GO:0035383 | acyl-CoA metabolic process(GO:0006637) glycine decarboxylation via glycine cleavage system(GO:0019464) thioester metabolic process(GO:0035383) |
| 0.3 | 0.8 | GO:0015835 | peptidoglycan transport(GO:0015835) |
| 0.2 | 1.0 | GO:0006567 | threonine catabolic process(GO:0006567) |
| 0.1 | 0.7 | GO:0055076 | transition metal ion homeostasis(GO:0055076) |
Gene overrepresentation in cellular component category:
| Log-likelihood per target | Total log-likelihood | Term | Description |
|---|---|---|---|
| 0.1 | 0.8 | GO:0032153 | cell division site(GO:0032153) |
| 0.0 | 8.4 | GO:0005829 | cytosol(GO:0005829) |
| 0.0 | 1.2 | GO:0005737 | cytoplasm(GO:0005737) |
Gene overrepresentation in molecular function category:
| Log-likelihood per target | Total log-likelihood | Term | Description |
|---|---|---|---|
| 0.5 | 7.8 | GO:0016866 | intramolecular transferase activity(GO:0016866) |
| 0.4 | 1.2 | GO:0008137 | NADH dehydrogenase (ubiquinone) activity(GO:0008137) NADH dehydrogenase (quinone) activity(GO:0050136) |
| 0.3 | 0.8 | GO:0015647 | penicillin binding(GO:0008658) UDP-3-O-[3-hydroxymyristoyl] N-acetylglucosamine deacetylase activity(GO:0008759) phospho-N-acetylmuramoyl-pentapeptide-transferase activity(GO:0008963) peptidoglycan transporter activity(GO:0015647) |
| 0.2 | 1.0 | GO:0008861 | formate C-acetyltransferase activity(GO:0008861) |
| 0.2 | 1.0 | GO:0031405 | lipoic acid binding(GO:0031405) |