Project
GSE55662: Plasticity of transcriptional regulation under antibiotic stress
Navigation
Downloads
Results for IHF
Z-value: 0.50
Transcription factors associated with IHF
| Gene Symbol | Gene ID | Gene Info |
|---|---|---|
|
infA
|
infA | integration host factor subunit alpha |
|
infB
|
infB | integration host factor subunit beta |
Activity-expression correlation:
Activity profile of IHF motif
Sorted Z-values of IHF motif
| Promoter | Log-likelihood | Transcript | Gene | Gene Info |
|---|---|---|---|---|
| yadV-htrE | 2.86 |
htrE
yadV
|
putative outer membrane usher protein probable pilin chaperone similar to PapD |
|
| acs-yjcH-actP | 1.95 |
acs
actP
yjcH
|
acetyl-CoA synthetase (AMP-forming) acetate / glycolate : cation symporter conserved inner membrane protein |
|
| dcuD | 0.81 |
dcuD
|
putative transport protein, C4-dicarboxylate uptake C family |
|
| ilvLXG_1G_2MEDA | 0.77 |
ilvE
ilvX
ilvM
ilvL
ilvG_1
ilvD
ilvG_2
ilvA
|
branched-chain amino-acid aminotransferase small protein acetolactate synthase / acetohydroxybutanoate synthase, regulatory subunit ilvGEDA operon leader peptide acetolactate synthase II, large subunit, N-ter fragment (pseudogene) dihydroxy acid dehydratase acetolactate synthase II, large subunit, C-ter fragment (pseudogene) threonine deaminase |
|
| gcd | 0.70 |
gcd
|
quinoprotein glucose dehydrogenase |
|
| yeiL | 0.64 |
yeiL
|
YeiL DNA-binding transcriptional activator |
|
| hycABCDEFGHI | 0.62 |
hycD
hycE
hycF
hycG
hycA
hycB
hycC
hycH
hycI
|
hydrogenase 3, membrane subunit hydrogenase 3, large subunit formate hydrogenlyase complex iron-sulfur protein hydrogenase 3 and formate hydrogenlyase complex, HycG subunit regulator of the transcriptional regulator FhlA hydrogenase 3, Fe-S subunit hydrogenase 3, membrane subunit protein required for maturation of hydrogenase 3 hydrogenase 3 maturation protease |
|
| sufABCDSE | 0.61 |
sufB
sufC
sufA
sufD
sufE
sufS
|
SufB component of SufBCD Fe-S cluster scaffold complex SufC component of SufBCD Fe-S cluster scaffold complex Fe-S transport protein in Fe-S cluster assembly SufD component of SufBCD Fe-S cluster scaffold complex sulfur acceptor for SufS cysteine desulfurase L-cysteine desulfurase |
|
| ssuEADCB | 0.61 |
ssuE
ssuD
ssuA
ssuC
ssuB
|
NADPH-dependent FMN reductase alkanesulfonate monooxygenase, FMNH2-dependent aliphatic sulfonate ABC transporter - periplasmic binding protein aliphatic sulfonate ABC transporter - membrane subunit aliphatic sulfonate ABC transporter - ATP binding subunit |
|
| yiaKLMNO-lyxK-sgbHUE | 0.59 |
lyxK
sgbH
sgbE
sgbU
yiaK
yiaM
yiaL
yiaO
yiaN
|
L-xylulose kinase 3-keto-L-gulonate 6-phosphate decarboxylase L-ribulose-5-phosphate 4-epimerase predicted L-xylulose 5-phosphate 3-epimerase 2,3-diketo-L-gulonate reductase 2,3-diketo-L-gulonate:Na+ symporter - membrane subunit conserved protein 2,3-diketo-L-gulonate:Na+ symporter - periplasmic binding protein 2,3-diketo-L-gulonate:Na+ symporter - membrane subunit |
|
| dppABCDF | 0.59 |
dppA
dppB
dppC
dppD
dppF
|
dipeptide ABC transporter - periplasmic binding protein dipeptide ABC transporter - predicted membrane subunit dipeptide ABC transporter - predicted membrane subunit dipeptide ABC transporter - predicted ATP binding subunit dipeptide ABC transporter - predicted ATP binding subunit |
|
| tyrP | 0.50 |
tyrP
|
tyrosine:H+ symporter TyrP |
|
| carAB | 0.48 |
carB
carA
|
carbamoyl phosphate synthetase, β chain carbamoyl phosphate synthetase, α chain |
|
| yjbEFGH | 0.46 |
yjbG
yjbF
yjbE
yjbH
|
conserved protein predicted lipoprotein predicted protein predicted porin |
|
| rtcBA | 0.44 |
rtcB
rtcA
|
RNA-splicing ligase RtcB RNA 3'-terminal phosphate cyclase |
|
| patA | 0.42 |
patA
|
putrescine aminotransferase |
|
| osmE | 0.42 |
osmE
|
osmotically inducible protein OsmE |
|
| atoDAEB | 0.40 |
atoB
atoA
atoD
atoE
|
acetyl-CoA acetyltransferase acetyl-CoA:acetoacetyl-CoA transferase, β subunit acetyl-CoA:acetoacetyl-CoA transferase, α subunit predicted short chain fatty acid transporter |
|
| glcDEFGBA | 0.38 |
glcD
glcE
glcF
glcG
glcA
glcB
|
glycolate oxidase, predicted FAD-linked subunit glycolate oxidase, predicted FAD-binding subunit glycolate oxidase, predicted iron-sulfur subunit conserved protein glycolate / lactate:H+ symporter malate synthase G |
|
| proVWX | 0.37 |
proX
proW
proV
|
glycine betaine / proline ABC transporter - periplasmic binding protein glycine betaine / proline ABC transporter - membrane subunit glycine betaine / proline ABC transporter - ATP binding subunit |
|
| gltA | 0.36 |
gltA
|
citrate synthase |
|
| osmY | 0.34 |
osmY
|
periplasmic chaperone, osmotically induced |
|
| ubiCA | 0.32 |
ubiC
ubiA
|
chorismate lyase 4-hydroxybenzoate octaprenyltransferase |
|
| hipBA | 0.31 |
hipA
hipB
|
serine/threonine kinase HipA HipB antitoxin and DNA-binding transcriptional repressor |
|
| ulaG | 0.29 |
ulaG
|
L-ascorbate 6-phosphate lactonase |
|
| mtr | 0.29 |
mtr
|
tryptohan / indole:H+ symporter Mtr |
|
| nirBDC-cysG | 0.29 |
nirD
cysG
nirC
nirB
|
nitrite reductase, small subunit siroheme synthase subunit nitrite transporter NirC nitrite reductase, large subunit |
|
| glpTQ | 0.29 |
glpT
glpQ
|
glycerol-3-phosphate:phosphate antiporter glycerophosphoryl diester phosphodiesterase, periplasmic |
|
| paaZ | 0.27 |
paaZ
|
oxepin-CoA hydrolase/3-oxo-5,6-dehydrosuberyl-CoA semialdehyde dehydrogenase |
|
| ulaABCDEF | 0.26 |
ulaD
ulaE
ulaF
ulaA
ulaB
ulaC
|
3-keto-L-gulonate 6-phosphate decarboxylase L-xylulose 5-phosphate 3-epimerase L-ribulose 5-phosphate 4-epimerase L-ascorbate PTS permease - UlaA subunit L-ascorbate PTS permease - UlaB subunit L-ascorbate PTS permease - UlaC subunit |
|
| yjbE | 0.26 |
yjbE
|
predicted protein |
|
| csgDEFG | 0.25 |
csgG
csgF
csgE
csgD
|
curli secretion channel curli assembly component curli transport specificity factor CsgD DNA-binding transcriptional dual regulator |
|
| pstSCA | 0.23 |
pstS
pstC
pstA
|
phosphate ABC transporter - periplasmic binding protein phosphate ABC transporter - membrane subunit phosphate ABC transporter - membrane subunit |
|
| pspG | 0.20 |
pspG
|
phage shock protein G |
|
| pstSCAB-phoU | 0.18 |
pstS
pstC
pstA
phoU
pstB
|
phosphate ABC transporter - periplasmic binding protein phosphate ABC transporter - membrane subunit phosphate ABC transporter - membrane subunit negative regulator of the pho regulon phosphate ABC transporter - ATP binding subunit |
|
| rpoH | 0.18 |
rpoH
|
RNA polymerase, sigma 32 (sigma H) factor |
|
| paaABCDEFGHIJK | 0.16 |
paaB
paaC
paaA
paaF
paaG
paaD
paaE
paaJ
paaK
paaH
paaI
|
ring 1,2-phenylacetyl-CoA epoxidase subunit ring 1,2-phenylacetyl-CoA epoxidase, structural subunit ring 1,2-phenylacetyl-CoA epoxidase, monooxygenase subunit predicted 2,3-dehydroadipyl-CoA hydratase predicted ring 1,2-epoxyphenylacetyl-CoA isomerase (oxepin-CoA forming) phenylacetate degradation protein ring 1,2-phenylacetyl-CoA epoxidase, reductase subunit β-ketoadipyl-CoA thiolase phenylacetate-CoA ligase 3-hydroxyadipyl-CoA dehydrogenase (NAD+) phenylacetyl-CoA thioesterase |
|
| ompR-envZ | 0.13 |
envZ
ompR
|
EnvZ OmpR transcriptional dual regulator |
|
| norVW | 0.12 |
norW
norV
|
NADH:flavorubredoxin reductase flavorubredoxin |
|
| adiA | 0.12 |
adiA
|
arginine decarboxylase, degradative |
|
| pstS | 0.11 |
pstS
|
phosphate ABC transporter - periplasmic binding protein |
|
| aceBAK | 0.09 |
aceK
aceB
aceA
|
isocitrate dehydrogenase phosphatase / isocitrate dehydrogenase kinase malate synthase A isocitrate lyase |
|
| fimAICDFGH | 0.09 |
fimA
fimC
fimD
fimF
fimG
fimH
fimI
|
major type 1 subunit fimbrin (pilin) periplasmic chaperone, required for type 1 fimbriae outer membrane protein; export and assembly of type 1 fimbriae fimbrial morphology fimbrial morphology minor fimbrial subunit, D-mannose specific adhesin fimbrial protein |
|
| nrfABCDEFG | 0.06 |
nrfF
nrfG
nrfD
nrfE
nrfB
nrfC
nrfA
|
activator of formate-dependent nitrite reductase complex NrfG formate dependent nitrite reductase - NrfD subunit formate-dependent nitrite reductase; possible assembly function formate-dependent nitrite reductase - penta-heme cytochrome c formate-dependent nitrite reductase, 4Fe-4S subunit formate dependent nitrite reductase - NrfA subunit |
|
| hemF | 0.04 |
hemF
|
coproporphyrinogen III oxidase |
|
| narGHJI | 0.03 |
narG
narI
narH
narJ
|
nitrate reductase A, α subunit nitrate reductase A, γ subunit nitrate reductase A, β subunit molybdenum cofactor assembly chaperone subunit (δ subunit) of nitrate reductase 1 |
Network of associatons between targets according to the STRING database.

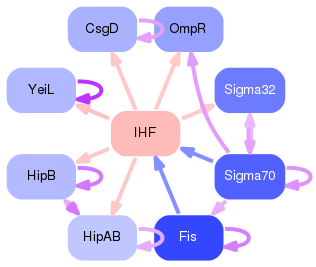
First level regulatory network of IHF
Gene Ontology Analysis
Gene overrepresentation in biological process category:
| Log-likelihood per target | Total log-likelihood | Term | Description |
|---|---|---|---|
| 0.7 | 3.0 | GO:0043711 | pilus organization(GO:0043711) |
| 0.7 | 2.0 | GO:0018394 | tellurite transport(GO:0015710) peptidyl-lysine acetylation(GO:0018394) post-translational protein modification(GO:0043687) |
| 0.2 | 0.7 | GO:0045226 | extracellular polysaccharide biosynthetic process(GO:0045226) extracellular polysaccharide metabolic process(GO:0046379) |
| 0.2 | 0.7 | GO:0006007 | glucose catabolic process(GO:0006007) |
| 0.2 | 0.6 | GO:0042908 | cellular response to sulfate starvation(GO:0009970) xenobiotic transport(GO:0042908) |
| 0.2 | 0.6 | GO:0019324 | L-lyxose metabolic process(GO:0019324) |
| 0.2 | 0.6 | GO:0015886 | heme transport(GO:0015886) |
| 0.2 | 0.8 | GO:0006549 | isoleucine metabolic process(GO:0006549) isoleucine biosynthetic process(GO:0009097) |
| 0.1 | 0.4 | GO:0010124 | phenylacetate catabolic process(GO:0010124) |
| 0.1 | 0.4 | GO:0019626 | short-chain fatty acid catabolic process(GO:0019626) |
| 0.1 | 0.4 | GO:0015838 | quaternary ammonium group transport(GO:0015697) amino-acid betaine transport(GO:0015838) |
| 0.1 | 0.6 | GO:0016485 | protein processing(GO:0016485) |
| 0.1 | 0.5 | GO:0046487 | glyoxylate metabolic process(GO:0046487) |
| 0.1 | 0.8 | GO:0015740 | C4-dicarboxylate transport(GO:0015740) |
| 0.1 | 0.4 | GO:0042245 | RNA repair(GO:0042245) |
| 0.1 | 0.5 | GO:0010921 | regulation of phosphatase activity(GO:0010921) |
| 0.1 | 0.6 | GO:0097428 | protein maturation by iron-sulfur cluster transfer(GO:0097428) |
| 0.1 | 0.3 | GO:0015827 | tryptophan transport(GO:0015827) |
| 0.1 | 0.5 | GO:0006207 | 'de novo' pyrimidine nucleobase biosynthetic process(GO:0006207) pyrimidine nucleobase biosynthetic process(GO:0019856) |
| 0.1 | 0.3 | GO:0022611 | dormancy process(GO:0022611) |
| 0.1 | 0.3 | GO:0015791 | polyol transport(GO:0015791) |
| 0.1 | 0.4 | GO:0009447 | polyamine catabolic process(GO:0006598) putrescine catabolic process(GO:0009447) |
| 0.1 | 0.3 | GO:0042181 | ubiquinone metabolic process(GO:0006743) ubiquinone biosynthetic process(GO:0006744) ketone biosynthetic process(GO:0042181) quinone metabolic process(GO:1901661) quinone biosynthetic process(GO:1901663) |
| 0.1 | 0.1 | GO:0017006 | protein-heme linkage(GO:0017003) protein-tetrapyrrole linkage(GO:0017006) cytochrome c-heme linkage(GO:0018063) |
| 0.1 | 1.2 | GO:0006970 | response to osmotic stress(GO:0006970) |
| 0.0 | 0.2 | GO:1900190 | regulation of multi-organism process(GO:0043900) regulation of single-species biofilm formation(GO:1900190) |
| 0.0 | 0.1 | GO:0046209 | nitric oxide metabolic process(GO:0046209) nitric oxide catabolic process(GO:0046210) cellular response to nitrogen compound(GO:1901699) cellular response to reactive nitrogen species(GO:1902170) |
| 0.0 | 0.1 | GO:0006527 | arginine catabolic process(GO:0006527) |
| 0.0 | 0.3 | GO:0051180 | vitamin transport(GO:0051180) |
| 0.0 | 0.2 | GO:0001121 | transcription from bacterial-type RNA polymerase promoter(GO:0001121) |
| 0.0 | 0.0 | GO:2001057 | reactive nitrogen species metabolic process(GO:2001057) |
| 0.0 | 0.3 | GO:0046365 | monosaccharide catabolic process(GO:0046365) |
Gene overrepresentation in cellular component category:
| Log-likelihood per target | Total log-likelihood | Term | Description |
|---|---|---|---|
| 0.1 | 1.2 | GO:0055052 | ATP-binding cassette (ABC) transporter complex, substrate-binding subunit-containing(GO:0055052) |
| 0.0 | 0.2 | GO:0031246 | intrinsic component of periplasmic side of cell outer membrane(GO:0031246) |
| 0.0 | 0.1 | GO:0045203 | integral component of cell outer membrane(GO:0045203) |
| 0.0 | 4.1 | GO:0005887 | integral component of plasma membrane(GO:0005887) |
| 0.0 | 0.1 | GO:0042995 | cell projection(GO:0042995) |
Gene overrepresentation in molecular function category:
| Log-likelihood per target | Total log-likelihood | Term | Description |
|---|---|---|---|
| 0.7 | 2.0 | GO:0015118 | tellurite transmembrane transporter activity(GO:0015118) tellurite uptake transmembrane transporter activity(GO:0015654) |
| 0.3 | 0.9 | GO:0008742 | L-ribulose-phosphate 4-epimerase activity(GO:0008742) |
| 0.3 | 0.8 | GO:0003984 | acetolactate synthase activity(GO:0003984) |
| 0.2 | 0.7 | GO:0016901 | oxidoreductase activity, acting on the CH-OH group of donors, quinone or similar compound as acceptor(GO:0016901) |
| 0.2 | 0.6 | GO:0004497 | monooxygenase activity(GO:0004497) |
| 0.2 | 0.6 | GO:0015198 | oligopeptide transporter activity(GO:0015198) oligopeptide transmembrane transporter activity(GO:0035673) |
| 0.2 | 0.4 | GO:0043879 | glycolate transmembrane transporter activity(GO:0043879) |
| 0.1 | 0.4 | GO:0008410 | CoA-transferase activity(GO:0008410) |
| 0.1 | 0.4 | GO:0005275 | amine transmembrane transporter activity(GO:0005275) transmembrane receptor activity(GO:0099600) |
| 0.1 | 0.5 | GO:0016884 | carbon-nitrogen ligase activity, with glutamine as amido-N-donor(GO:0016884) |
| 0.1 | 0.7 | GO:0015114 | phosphate ion transmembrane transporter activity(GO:0015114) |
| 0.1 | 0.3 | GO:0001047 | core promoter binding(GO:0001047) |
| 0.1 | 0.3 | GO:0015196 | L-tryptophan transmembrane transporter activity(GO:0015196) |
| 0.1 | 0.3 | GO:0004325 | ferrochelatase activity(GO:0004325) |
| 0.1 | 0.3 | GO:0016803 | hydrolase activity, acting on ether bonds(GO:0016801) ether hydrolase activity(GO:0016803) |
| 0.1 | 0.6 | GO:0008047 | enzyme activator activity(GO:0008047) |
| 0.1 | 0.3 | GO:0004659 | prenyltransferase activity(GO:0004659) |
| 0.1 | 0.2 | GO:0016289 | 3-hydroxyacyl-CoA dehydrogenase activity(GO:0003857) CoA hydrolase activity(GO:0016289) thiolester hydrolase activity(GO:0016790) |
| 0.0 | 0.1 | GO:0042301 | phosphate ion binding(GO:0042301) |
| 0.0 | 0.2 | GO:0000996 | transcription factor activity, core RNA polymerase binding(GO:0000990) core DNA-dependent RNA polymerase binding promoter specificity activity(GO:0000996) sigma factor activity(GO:0016987) |
| 0.0 | 0.1 | GO:0046912 | transferase activity, transferring acyl groups, acyl groups converted into alkyl on transfer(GO:0046912) |
| 0.0 | 0.3 | GO:0052689 | carboxylic ester hydrolase activity(GO:0052689) |
| 0.0 | 0.6 | GO:0004175 | endopeptidase activity(GO:0004175) |
| 0.0 | 0.4 | GO:0008483 | transaminase activity(GO:0008483) |
| 0.0 | 0.1 | GO:0000156 | phosphorelay response regulator activity(GO:0000156) |
| 0.0 | 0.1 | GO:0044183 | protein binding involved in protein folding(GO:0044183) |
| 0.0 | 0.2 | GO:0016661 | oxidoreductase activity, acting on other nitrogenous compounds as donors(GO:0016661) |
Gene overrepresentation in curated gene sets: REACTOME pathways category:
| Log-likelihood per target | Total log-likelihood | Term | Description |
|---|---|---|---|
| 0.0 | 0.4 | REACTOME METABOLISM OF CARBOHYDRATES | Genes involved in Metabolism of carbohydrates |