Results for YNR063W
Z-value: 0.56
Motif logo

Transcription factors associated with YNR063W
| Gene Symbol | Gene ID | Gene Info |
|---|---|---|
|
|
S000005346 | Putative zinc-cluster protein of unknown function |
Activity-expression correlation:
Activity profile of YNR063W motif
Sorted Z-values of YNR063W motif
| Promoter | Log-likelihood | Transcript | Gene | Gene Info |
|---|---|---|---|---|
| YHR094C | 8.59 |
HXT1
|
Low-affinity glucose transporter of the major facilitator superfamily, expression is induced by Hxk2p in the presence of glucose and repressed by Rgt1p when glucose is limiting |
|
| YFR055W | 4.62 |
IRC7
|
Putative cystathionine beta-lyase; involved in copper ion homeostasis and sulfur metabolism; null mutant displays increased levels of spontaneous Rad52p foci; expression induced by nitrogen limitation in a GLN3, GAT1-dependent manner |
|
| YFR056C | 4.02 |
Dubious open reading frame unlikely to encode a protein based on available experimental and comparative sequence data; partially overlaps the uncharacterized gene YFR055W |
||
| YOL086C | 3.99 |
ADH1
|
Alcohol dehydrogenase, fermentative isozyme active as homo- or heterotetramers; required for the reduction of acetaldehyde to ethanol, the last step in the glycolytic pathway |
|
| YKR075C | 3.35 |
Protein of unknown function; similar to YOR062Cp and Reg1p; expression regulated by glucose and Rgt1p; GFP-fusion protein is induced in response to the DNA-damaging agent MMS |
||
| YOR101W | 3.22 |
RAS1
|
GTPase involved in G-protein signaling in the adenylate cyclase activating pathway, plays a role in cell proliferation; localized to the plasma membrane; homolog of mammalian RAS proto-oncogenes |
|
| YJL115W | 3.15 |
ASF1
|
Nucleosome assembly factor, involved in chromatin assembly and disassembly, anti-silencing protein that causes derepression of silent loci when overexpressed; plays a role in regulating Ty1 transposition |
|
| YNL178W | 3.13 |
RPS3
|
Protein component of the small (40S) ribosomal subunit, has apurinic/apyrimidinic (AP) endonuclease activity; essential for viability; has similarity to E. coli S3 and rat S3 ribosomal proteins |
|
| YOR315W | 3.05 |
SFG1
|
Nuclear protein, putative transcription factor required for growth of superficial pseudohyphae (which do not invade the agar substrate) but not for invasive pseudohyphal growth; may act together with Phd1p; potential Cdc28p substrate |
|
| YGL209W | 2.97 |
MIG2
|
Protein containing zinc fingers, involved in repression, along with Mig1p, of SUC2 (invertase) expression by high levels of glucose; binds to Mig1p-binding sites in SUC2 promoter |
|
| YKL063C | 2.80 |
Putative protein of unknown function; green fluorescent protein (GFP)-fusion protein localizes to the Golgi |
||
| YLR301W | 2.74 |
Protein of unknown function that interacts with Sec72p |
||
| YHR141C | 2.64 |
RPL42B
|
Protein component of the large (60S) ribosomal subunit, identical to Rpl42Ap and has similarity to rat L44; required for propagation of the killer toxin-encoding M1 double-stranded RNA satellite of the L-A double-stranded RNA virus |
|
| YKL096W-A | 2.44 |
CWP2
|
Covalently linked cell wall mannoprotein, major constituent of the cell wall; plays a role in stabilizing the cell wall; involved in low pH resistance; precursor is GPI-anchored |
|
| YOR050C | 2.35 |
Hypothetical protein |
||
| YDR044W | 2.34 |
HEM13
|
Coproporphyrinogen III oxidase, an oxygen requiring enzyme that catalyzes the sixth step in the heme biosynthetic pathway; localizes to the mitochondrial inner membrane; transcription is repressed by oxygen and heme (via Rox1p and Hap1p) |
|
| YJR094W-A | 2.33 |
RPL43B
|
Protein component of the large (60S) ribosomal subunit, identical to Rpl43Ap and has similarity to rat L37a ribosomal protein |
|
| YBL063W | 2.25 |
KIP1
|
Kinesin-related motor protein required for mitotic spindle assembly and chromosome segregation; functionally redundant with Cin8p |
|
| YDR002W | 2.24 |
YRB1
|
Ran GTPase binding protein; involved in nuclear protein import and RNA export, ubiquitin-mediated protein degradation during the cell cycle; shuttles between the nucleus and cytoplasm; is essential; homolog of human RanBP1 |
|
| YKL110C | 2.17 |
KTI12
|
Protein that plays a role, with Elongator complex, in modification of wobble nucleosides in tRNA; involved in sensitivity to G1 arrest induced by zymocin; interacts with chromatin throughout the genome; also interacts with Cdc19p |
|
| YNR001W-A | 2.13 |
Dubious open reading frame unlikely to encode a functional protein; identified by homology |
||
| YKR041W | 2.08 |
Putative protein of unknown function; green fluorescent protein (GFP)-fusion protein localizes to the cytoplasm and nucleus |
||
| YJL162C | 2.02 |
JJJ2
|
Protein of unknown function, contains a J-domain, which is a region with homology to the E. coli DnaJ protein |
|
| YDL211C | 1.98 |
Putative protein of unknown function; green fluorescent protein (GFP)-fusion protein localizes to the vacuole |
||
| YGR052W | 1.97 |
FMP48
|
Putative protein of unknown function; the authentic, non-tagged protein is detected in highly purified mitochondria in high-throughput studies; induced by treatment with 8-methoxypsoralen and UVA irradiation |
|
| YDR037W | 1.96 |
KRS1
|
Lysyl-tRNA synthetase; also identified as a negative regulator of general control of amino acid biosynthesis |
|
| YFL015C | 1.96 |
Dubious open reading frame unlikely to encode a protein; partially overlaps dubious ORF YFL015W-A; YFL015C is not an essential gene |
||
| YFL015W-A | 1.95 |
Dubious open reading frame unlikely to encode a functional protein, based on available experimental and comparative sequence data |
||
| YDL241W | 1.92 |
Putative protein of unknown function; YDL241W is not an essential gene |
||
| YGR051C | 1.89 |
Dubious open reading frame unlikely to encode a protein, based on available experimental and comparative sequence data; YGR051C is not an essential gene |
||
| YLR432W | 1.89 |
IMD3
|
Inosine monophosphate dehydrogenase, catalyzes the first step of GMP biosynthesis, member of a four-gene family in S. cerevisiae, constitutively expressed |
|
| YDR345C | 1.86 |
HXT3
|
Low affinity glucose transporter of the major facilitator superfamily, expression is induced in low or high glucose conditions |
|
| YOR063W | 1.86 |
RPL3
|
Protein component of the large (60S) ribosomal subunit, has similarity to E. coli L3 and rat L3 ribosomal proteins; involved in the replication and maintenance of killer double stranded RNA virus |
|
| YOR342C | 1.78 |
Putative protein of unknown function; green fluorescent protein (GFP)-fusion protein localizes to the cytoplasm and the nucleus |
||
| YGR050C | 1.75 |
Dubious open reading frame unlikely to encode a protein, based on available experimental and comparative sequence data |
||
| YDR033W | 1.75 |
MRH1
|
Protein that localizes primarily to the plasma membrane, also found at the nuclear envelope; the authentic, non-tagged protein is detected in mitochondria in a phosphorylated state; has similarity to Hsp30p and Yro2p |
|
| YDL023C | 1.74 |
Dubious open reading frame, unlikely to encode a protein; not conserved in other Saccharomyces species; overlaps the verified gene GPD1; deletion confers sensitivity to GSAO; deletion in cyr1 mutant results in loss of stress resistance |
||
| YGR251W | 1.70 |
Putative protein of unknown function; deletion mutant has defects in pre-rRNA processing; green fluorescent protein (GFP)-fusion protein localizes to both the nucleus and the nucleolus; YGR251W is an essential gene |
||
| YKR038C | 1.66 |
KAE1
|
Putative glycoprotease proposed to be in transcription as a component of the EKC protein complex with Bud32p, Cgi121p, Pcc1p, and Gon7p; also identified as a component of the KEOPS protein complex |
|
| YOL101C | 1.63 |
IZH4
|
Membrane protein involved in zinc metabolism, member of the four-protein IZH family, expression induced by fatty acids and altered zinc levels; deletion reduces sensitivity to excess zinc; possible role in sterol metabolism |
|
| YLR154W-A | 1.60 |
Dubious open reading frame unlikely to encode a protein; encoded within the the 25S rRNA gene on the opposite strand |
||
| YOR163W | 1.58 |
DDP1
|
Polyphosphate phosphatase; hydrolyzes diphosphorylated inositol polyphosphates and diadenosine polyphosphates; has high specificity for diadenosine hexa- and pentaphosphates; member of the MutT family of nucleotide hydrolases |
|
| YMR001C-A | 1.55 |
Putative protein of unknown function |
||
| YDL022C-A | 1.53 |
Dubious open reading frame unlikely to encode a protein; partially overlaps the verified gene DIA3; identified by fungal homology and RT-PCR |
||
| YLR154C | 1.52 |
RNH203
|
Ribonuclease H2 subunit, required for RNase H2 activity |
|
| YDL055C | 1.49 |
PSA1
|
GDP-mannose pyrophosphorylase (mannose-1-phosphate guanyltransferase), synthesizes GDP-mannose from GTP and mannose-1-phosphate in cell wall biosynthesis; required for normal cell wall structure |
|
| YHR007C | 1.45 |
ERG11
|
Lanosterol 14-alpha-demethylase, catalyzes the C-14 demethylation of lanosterol to form 4,4''-dimethyl cholesta-8,14,24-triene-3-beta-ol in the ergosterol biosynthesis pathway; member of the cytochrome P450 family |
|
| YDR074W | 1.45 |
TPS2
|
Phosphatase subunit of the trehalose-6-phosphate synthase/phosphatase complex, which synthesizes the storage carbohydrate trehalose; expression is induced by stress conditions and repressed by the Ras-cAMP pathway |
|
| YNL231C | 1.45 |
PDR16
|
Phosphatidylinositol transfer protein (PITP) controlled by the multiple drug resistance regulator Pdr1p, localizes to lipid particles and microsomes, controls levels of various lipids, may regulate lipid synthesis, homologous to Pdr17p |
|
| YDR279W | 1.44 |
RNH202
|
Ribonuclease H2 subunit, required for RNase H2 activity |
|
| YDL022W | 1.44 |
GPD1
|
NAD-dependent glycerol-3-phosphate dehydrogenase, key enzyme of glycerol synthesis, essential for growth under osmotic stress; expression regulated by high-osmolarity glycerol response pathway; homolog of Gpd2p |
|
| YHR216W | 1.42 |
IMD2
|
Inosine monophosphate dehydrogenase, catalyzes the first step of GMP biosynthesis, expression is induced by mycophenolic acid resulting in resistance to the drug, expression is repressed by nutrient limitation |
|
| YLR154W-B | 1.42 |
Dubious open reading frame unlikely to encode a protein; encoded within the the 25S rRNA gene on the opposite strand |
||
| YMR290W-A | 1.41 |
Dubious open reading frame unlikely to encode a functional protein, based on available experimental and comparative sequence data; overlaps 5' end of essential HAS1 gene which encodes an ATP-dependent RNA helicase |
||
| YCL022C | 1.40 |
Dubious open reading frame unlikely to encode a protein, based on available experimental and comparative sequence data; completely overlaps verified gene KCC4/YCL024W |
||
| YOL085C | 1.37 |
Dubious open reading frame unlikely to encode a protein, based on experimental and comparative sequence data; partially overlaps the dubious gene YOL085W-A |
||
| YDL047W | 1.33 |
SIT4
|
Type 2A-related serine-threonine phosphatase that functions in the G1/S transition of the mitotic cycle; cytoplasmic and nuclear protein that modulates functions mediated by Pkc1p including cell wall and actin cytoskeleton organization |
|
| YLR411W | 1.32 |
CTR3
|
High-affinity copper transporter of the plasma membrane, acts as a trimer; gene is disrupted by a Ty2 transposon insertion in many laboratory strains of S. cerevisiae |
|
| YOR028C | 1.31 |
CIN5
|
Basic leucine zipper transcriptional factor of the yAP-1 family that mediates pleiotropic drug resistance and salt tolerance; localizes constitutively to the nucleus |
|
| YNL153C | 1.30 |
GIM3
|
Subunit of the heterohexameric cochaperone prefoldin complex which binds specifically to cytosolic chaperonin and transfers target proteins to it |
|
| YMR290C | 1.30 |
HAS1
|
ATP-dependent RNA helicase; localizes to both the nuclear periphery and nucleolus; highly enriched in nuclear pore complex fractions; constituent of 66S pre-ribosomal particles |
|
| YGR040W | 1.28 |
KSS1
|
Mitogen-activated protein kinase (MAPK) involved in signal transduction pathways that control filamentous growth and pheromone response; the KSS1 gene is nonfunctional in S288C strains and functional in W303 strains |
|
| YMR037C | 1.26 |
MSN2
|
Transcriptional activator related to Msn4p; activated in stress conditions, which results in translocation from the cytoplasm to the nucleus; binds DNA at stress response elements of responsive genes, inducing gene expression |
|
| YJL177W | 1.25 |
RPL17B
|
Protein component of the large (60S) ribosomal subunit, nearly identical to Rpl17Ap and has similarity to E. coli L22 and rat L17 ribosomal proteins |
|
| YMR011W | 1.24 |
HXT2
|
High-affinity glucose transporter of the major facilitator superfamily, expression is induced by low levels of glucose and repressed by high levels of glucose |
|
| YPL183C | 1.23 |
RTT10
|
Cytoplasmic protein with a role in regulation of Ty1 transposition |
|
| YFR054C | 1.23 |
Dubious open reading frame unlikely to encode a functional protein, based on available experimental and comparative sequence data |
||
| YER028C | 1.22 |
MIG3
|
Probable transcriptional repressor involved in response to toxic agents such as hydroxyurea that inhibit ribonucleotide reductase; phosphorylation by Snf1p or the Mec1p pathway inactivates Mig3p, allowing induction of damage response genes |
|
| YJR105W | 1.22 |
ADO1
|
Adenosine kinase, required for the utilization of S-adenosylmethionine (AdoMet); may be involved in recycling adenosine produced through the methyl cycle |
|
| YOR313C | 1.20 |
SPS4
|
Protein whose expression is induced during sporulation; not required for sporulation; heterologous expression in E. coli induces the SOS response that senses DNA damage |
|
| YBL085W | 1.18 |
BOI1
|
Protein implicated in polar growth, functionally redundant with Boi2p; interacts with bud-emergence protein Bem1p; contains an SH3 (src homology 3) domain and a PH (pleckstrin homology) domain |
|
| YIL009W | 1.17 |
FAA3
|
Long chain fatty acyl-CoA synthetase, has a preference for C16 and C18 fatty acids; green fluorescent protein (GFP)-fusion protein localizes to the cell periphery |
|
| YOR029W | 1.16 |
Dubious open reading frame unlikely to encode a functional protein; based on available experimental and comparative sequence data |
||
| YLR154W-C | 1.16 |
TAR1
|
Mitochondrial protein of unknown function, overexpression suppresses an rpo41 mutation affecting mitochondrial RNA polymerase; encoded within the 25S rRNA gene on the opposite strand |
|
| YPL265W | 1.15 |
DIP5
|
Dicarboxylic amino acid permease, mediates high-affinity and high-capacity transport of L-glutamate and L-aspartate; also a transporter for Gln, Asn, Ser, Ala, and Gly |
|
| YER137C | 1.14 |
Putative protein of unknown function |
||
| YBR158W | 1.13 |
AMN1
|
Protein required for daughter cell separation, multiple mitotic checkpoints, and chromosome stability; contains 12 degenerate leucine-rich repeat motifs; expression is induced by the Mitotic Exit Network (MEN) |
|
| YNL065W | 1.12 |
AQR1
|
Plasma membrane multidrug transporter of the major facilitator superfamily, confers resistance to short-chain monocarboxylic acids and quinidine; involved in the excretion of excess amino acids |
|
| YIL056W | 1.10 |
VHR1
|
Transcriptional activator, required for the vitamin H-responsive element (VHRE) mediated induction of VHT1 (Vitamin H transporter) and BIO5 (biotin biosynthesis intermediate transporter) in response to low biotin concentrations |
|
| YML077W | 1.08 |
BET5
|
Component of the TRAPP (transport protein particle) complex, which plays an essential role in the vesicular transport from endoplasmic reticulum to Golgi |
|
| YPL250W-A | 1.07 |
Identified by fungal homology and RT-PCR |
||
| YOR314W | 1.05 |
Dubious open reading frame unlikely to encode a protein, based on available experimental and comparative sequence data |
||
| YER045C | 1.05 |
ACA1
|
Basic leucine zipper (bZIP) transcription factor of the ATF/CREB family, may regulate transcription of genes involved in utilization of non-optimal carbon sources |
|
| YNL069C | 0.98 |
RPL16B
|
N-terminally acetylated protein component of the large (60S) ribosomal subunit, binds to 5.8 S rRNA; has similarity to Rpl16Ap, E. coli L13 and rat L13a ribosomal proteins; transcriptionally regulated by Rap1p |
|
| YOL015W | 0.98 |
IRC10
|
Putative protein of unknown function; null mutant displays increased levels of spontaneous Rad52p foci |
|
| YOR047C | 0.98 |
STD1
|
Protein involved in control of glucose-regulated gene expression; interacts with protein kinase Snf1p, glucose sensors Snf3p and Rgt2p, and TATA-binding protein Spt15p; acts as a regulator of the transcription factor Rgt1p |
|
| YER046W | 0.96 |
SPO73
|
Meiosis-specific protein of unknown function, required for spore wall formation during sporulation; dispensible for both nuclear divisions during meiosis |
|
| YER131W | 0.93 |
RPS26B
|
Protein component of the small (40S) ribosomal subunit; nearly identical to Rps26Ap and has similarity to rat S26 ribosomal protein |
|
| YLR180W | 0.93 |
SAM1
|
S-adenosylmethionine synthetase, catalyzes transfer of the adenosyl group of ATP to the sulfur atom of methionine; one of two differentially regulated isozymes (Sam1p and Sam2p) |
|
| YOR030W | 0.93 |
DFG16
|
Probable multiple transmembrane protein, involved in diploid invasive and pseudohyphal growth upon nitrogen starvation; required for accumulation of processed Rim101p |
|
| YHR089C | 0.92 |
GAR1
|
Protein component of the H/ACA snoRNP pseudouridylase complex, involved in the modification and cleavage of the 18S pre-rRNA |
|
| YFL016C | 0.92 |
MDJ1
|
Co-chaperone that stimulates the ATPase activity of the HSP70 protein Ssc1p; involved in protein folding/refolding in the mitochodrial matrix; required for proteolysis of misfolded proteins; member of the HSP40 (DnaJ) family of chaperones |
|
| YIL096C | 0.91 |
Putative protein of unknown function; associates with precursors of the 60S ribosomal subunit |
||
| YCL018W | 0.91 |
LEU2
|
Beta-isopropylmalate dehydrogenase (IMDH), catalyzes the third step in the leucine biosynthesis pathway |
|
| YOR181W | 0.91 |
LAS17
|
Actin assembly factor, activates the Arp2/3 protein complex that nucleates branched actin filaments; localizes with the Arp2/3 complex to actin patches; homolog of the human Wiskott-Aldrich syndrome protein (WASP) |
|
| YKL062W | 0.90 |
MSN4
|
Transcriptional activator related to Msn2p; activated in stress conditions, which results in translocation from the cytoplasm to the nucleus; binds DNA at stress response elements of responsive genes, inducing gene expression |
|
| YPL137C | 0.90 |
GIP3
|
Glc7-interacting protein whose overexpression relocalizes Glc7p from the nucleus and prevents chromosome segregation; may interact with ribosomes, based on co-purification experiments |
|
| YDR098C | 0.89 |
GRX3
|
Hydroperoxide and superoxide-radical responsive glutathione-dependent oxidoreductase; monothiol glutaredoxin subfamily member along with Grx4p and Grx5p; protects cells from oxidative damage |
|
| YKR099W | 0.88 |
BAS1
|
Myb-related transcription factor involved in regulating basal and induced expression of genes of the purine and histidine biosynthesis pathways; also involved in regulation of meiotic recombination at specific genes |
|
| YBR167C | 0.88 |
POP7
|
Subunit of both RNase MRP, which cleaves pre-rRNA, and nuclear RNase P, which cleaves tRNA precursors to generate mature 5' ends |
|
| YIR021W | 0.88 |
MRS1
|
Protein required for the splicing of two mitochondrial group I introns (BI3 in COB and AI5beta in COX1); forms a splicing complex, containing four subunits of Mrs1p and two subunits of the BI3-encoded maturase, that binds to the BI3 RNA |
|
| YGL157W | 0.87 |
Oxidoreductase, catalyzes NADPH-dependent reduction of the bicyclic diketone bicyclo[2.2.2]octane-2,6-dione (BCO2,6D) to the chiral ketoalcohol (1R,4S,6S)-6-hydroxybicyclo[2.2.2]octane-2-one (BCO2one6ol) |
||
| YAL038W | 0.87 |
CDC19
|
Pyruvate kinase, functions as a homotetramer in glycolysis to convert phosphoenolpyruvate to pyruvate, the input for aerobic (TCA cycle) or anaerobic (glucose fermentation) respiration |
|
| YLR100W | 0.87 |
ERG27
|
3-keto sterol reductase, catalyzes the last of three steps required to remove two C-4 methyl groups from an intermediate in ergosterol biosynthesis; mutants are sterol auxotrophs |
|
| YDR344C | 0.86 |
Dubious open reading frame unlikely to encode a functional protein, based on available experimental and comparative sequence data |
||
| YLR367W | 0.85 |
RPS22B
|
Protein component of the small (40S) ribosomal subunit; nearly identical to Rps22Ap and has similarity to E. coli S8 and rat S15a ribosomal proteins |
|
| YDR531W | 0.85 |
Pantothenate kinase (ATP:D-pantothenate 4'-phosphotransferase, EC 2.7.1.33); catalyzes the first committed step in the universal biosynthetic pathway leading to coenzyme A1 |
||
| YER012W | 0.83 |
PRE1
|
Beta 4 subunit of the 20S proteasome; localizes to the nucleus throughout the cell cycle |
|
| YHR013C | 0.82 |
ARD1
|
Subunit of the N-terminal acetyltransferase NatA (Nat1p, Ard1p, Nat5p); N-terminally acetylates many proteins, which influences multiple processes such as the cell cycle, heat-shock resistance, mating, sporulation, and telomeric silencing |
|
| YKL165C | 0.82 |
MCD4
|
Protein involved in glycosylphosphatidylinositol (GPI) anchor synthesis; multimembrane-spanning protein that localizes to the endoplasmic reticulum; highly conserved among eukaryotes |
|
| YKL120W | 0.82 |
OAC1
|
Mitochondrial inner membrane transporter, transports oxaloacetate, sulfate, and thiosulfate; member of the mitochondrial carrier family |
|
| YPL238C | 0.79 |
Dubious open reading frame unlikely to encode a functional protein, based on available experimental and comparative sequence data; partially overlaps 5' end of the verified essential gene SUI3/YPL237W |
||
| YBR206W | 0.79 |
Dubious open reading frame unlikely to encode a protein, based on available experimental and comparative sequence data; partially overlaps the verified gene KTR3 |
||
| YOR051C | 0.79 |
Nuclear protein that inhibits replication of Brome mosaic virus in S. cerevisiae, which is a model system for studying replication of positive-strand RNA viruses in their natural hosts |
||
| YOR130C | 0.78 |
ORT1
|
Ornithine transporter of the mitochondrial inner membrane, exports ornithine from mitochondria as part of arginine biosynthesis; human ortholog is associated with hyperammonaemia-hyperornithinaemia-homocitrullinuria (HHH) syndrome |
|
| YMR009W | 0.78 |
ADI1
|
Acireductone dioxygenease involved in the methionine salvage pathway; ortholog of human MTCBP-1; transcribed with YMR010W and regulated post-transcriptionally by RNase III (Rnt1p) cleavage; ADI1 mRNA is induced in heat shock conditions |
|
| YIL118W | 0.76 |
RHO3
|
Non-essential small GTPase of the Rho/Rac subfamily of Ras-like proteins involved in the establishment of cell polarity; GTPase activity positively regulated by the GTPase activating protein (GAP) Rgd1p |
|
| YNL043C | 0.76 |
Dubious open reading frame unlikely to encode a protein, based on available experimental and comparative sequence data; partially overlaps the verified gene YIP3/YNL044W |
||
| YKL081W | 0.76 |
TEF4
|
Translation elongation factor EF-1 gamma |
|
| YMR102C | 0.76 |
Protein of unknown function; transcription is activated by paralogous transcription factors Yrm1p and Yrr1p along with genes involved in multidrug resistance; mutant shows increased resistance to azoles; YMR102C is not an essential gene |
||
| YPL178W | 0.75 |
CBC2
|
Small subunit of the heterodimeric cap binding complex that also contains Sto1p, component of the spliceosomal commitment complex; interacts with Npl3p, possibly to package mRNA for export from the nucleus; contains an RNA-binding motif |
|
| YIL009C-A | 0.75 |
EST3
|
Component of the telomerase holoenzyme, involved in telomere replication |
|
| YPL177C | 0.75 |
CUP9
|
Homeodomain-containing transcriptional repressor of PTR2, which encodes a major peptide transporter; imported peptides activate ubiquitin-dependent proteolysis, resulting in degradation of Cup9p and de-repression of PTR2 transcription |
|
| YJL107C | 0.74 |
Putative protein of unknown function; expression is induced by activation of the HOG1 mitogen-activated signaling pathway and this induction is Hog1p/Pbs2p dependent; YJL107C and adjacent ORF, YJL108C are merged in related fungi |
||
| YMR083W | 0.74 |
ADH3
|
Mitochondrial alcohol dehydrogenase isozyme III; involved in the shuttling of mitochondrial NADH to the cytosol under anaerobic conditions and ethanol production |
|
| YLR129W | 0.74 |
DIP2
|
Nucleolar protein, specifically associated with the U3 snoRNA, part of the large ribonucleoprotein complex known as the small subunit (SSU) processome, required for 18S rRNA biogenesis, part of the active pre-rRNA processing complex |
|
| YDL111C | 0.73 |
RRP42
|
Protein involved in rRNA processing; component of the exosome 3->5 exonuclease complex with Rrp4p, Rrp41p, Rrp43p and Dis3p |
|
| YGL158W | 0.73 |
RCK1
|
Protein kinase involved in the response to oxidative stress; identified as suppressor of S. pombe cell cycle checkpoint mutations |
|
| YKL154W | 0.73 |
SRP102
|
Signal recognition particle (SRP) receptor beta subunit; involved in SRP-dependent protein targeting; anchors Srp101p to the ER membrane |
|
| YNL118C | 0.73 |
DCP2
|
Catalytic subunit of the Dcp1p-Dcp2p decapping enzyme complex, which removes the 5' cap structure from mRNAs prior to their degradation; member of the Nudix hydrolase family |
|
| YGL148W | 0.71 |
ARO2
|
Bifunctional chorismate synthase and flavin reductase, catalyzes the conversion of 5-enolpyruvylshikimate 3-phosphate (EPSP) to form chorismate, which is a precursor to aromatic amino acids |
|
| YDL048C | 0.71 |
STP4
|
Protein containing a Kruppel-type zinc-finger domain; has similarity to Stp1p, Stp2p, and Stp3p |
|
| YOR226C | 0.71 |
ISU2
|
Conserved protein of the mitochondrial matrix, required for synthesis of mitochondrial and cytosolic iron-sulfur proteins, performs a scaffolding function in mitochondria during Fe/S cluster assembly; isu1 isu2 double mutant is inviable |
|
| YGR148C | 0.71 |
RPL24B
|
Ribosomal protein L30 of the large (60S) ribosomal subunit, nearly identical to Rpl24Ap and has similarity to rat L24 ribosomal protein; not essential for translation but may be required for normal translation rate |
|
| YBR210W | 0.70 |
ERV15
|
Protein involved in export of proteins from the endoplasmic reticulum, has similarity to Erv14p |
|
| YHR148W | 0.70 |
IMP3
|
Component of the SSU processome, which is required for pre-18S rRNA processing, essential protein that interacts with Mpp10p and mediates interactions of Imp4p and Mpp10p with U3 snoRNA |
|
| YLR353W | 0.70 |
BUD8
|
Protein involved in bud-site selection; diploid mutants display a unipolar budding pattern instead of the wild-type bipolar pattern, and bud at the proximal pole |
|
| YHR142W | 0.70 |
CHS7
|
Protein of unknown function, involved in chitin biosynthesis by regulating Chs3p export from the ER |
|
| YLR191W | 0.70 |
PEX13
|
Integral peroxisomal membrane required for the translocation of peroxisomal matrix proteins, interacts with the PTS1 signal recognition factor Pex5p and the PTS2 signal recognition factor Pex7p, forms a complex with Pex14p and Pex17p |
|
| YOR087W | 0.68 |
YVC1
|
Vacuolar cation channel, mediates release of Ca(2+) from the vacuole in response to hyperosmotic shock |
|
| YJR145C | 0.68 |
RPS4A
|
Protein component of the small (40S) ribosomal subunit; mutation affects 20S pre-rRNA processing; identical to Rps4Bp and has similarity to rat S4 ribosomal protein |
|
| YOR180C | 0.67 |
DCI1
|
Peroxisomal delta(3,5)-delta(2,4)-dienoyl-CoA isomerase, involved in fatty acid metabolism, contains peroxisome targeting signals at amino and carboxy termini |
|
| YHR128W | 0.66 |
FUR1
|
Uracil phosphoribosyltransferase, synthesizes UMP from uracil; involved in the pyrimidine salvage pathway |
|
| YPL237W | 0.66 |
SUI3
|
Beta subunit of the translation initiation factor eIF2, involved in the identification of the start codon; proposed to be involved in mRNA binding |
|
| YNL141W | 0.65 |
AAH1
|
Adenine deaminase (adenine aminohydrolase), converts adenine to hypoxanthine; involved in purine salvage; transcriptionally regulated by nutrient levels and growth phase; Aah1p degraded upon entry into quiescence via SCF and the proteasome |
|
| YJL106W | 0.65 |
IME2
|
Serine/threonine protein kinase involved in activation of meiosis, associates with Ime1p and mediates its stability, activates Ndt80p; IME2 expression is positively regulated by Ime1p |
|
| YJR094C | 0.65 |
IME1
|
Master regulator of meiosis that is active only during meiotic events, activates transcription of early meiotic genes through interaction with Ume6p, degraded by the 26S proteasome following phosphorylation by Ime2p |
|
| YMR106C | 0.65 |
YKU80
|
Subunit of the telomeric Ku complex (Yku70p-Yku80p), involved in telomere length maintenance, structure and telomere position effect; relocates to sites of double-strand cleavage to promote nonhomologous end joining during DSB repair |
|
| YER120W | 0.64 |
SCS2
|
Integral ER membrane protein that regulates phospholipid metabolism via an interaction with the FFAT motif of Opi1p, also involved in telomeric silencing, disruption causes inositol auxotrophy above 34 degrees C, VAP homolog |
|
| YOR162C | 0.63 |
YRR1
|
Zn2-Cys6 zinc-finger transcription factor that activates genes involved in multidrug resistance; paralog of Yrm1p, acting on an overlapping set of target genes |
|
| YBR106W | 0.63 |
PHO88
|
Probable membrane protein, involved in phosphate transport; pho88 pho86 double null mutant exhibits enhanced synthesis of repressible acid phosphatase at high inorganic phosphate concentrations |
|
| YHR095W | 0.63 |
Dubious open reading frame unlikely to encode a functional protein, based on available experimental and comparative sequence data |
||
| YDR133C | 0.62 |
Dubious open reading frame unlikely to encode a protein, based on available experimental and comparative sequence data; partially overlaps YDR134C |
||
| YOR222W | 0.62 |
ODC2
|
Mitochondrial inner membrane transporter, exports 2-oxoadipate and 2-oxoglutarate from the mitochondrial matrix to the cytosol for use in lysine and glutamate biosynthesis and in lysine catabolism |
|
| YMR320W | 0.62 |
Dubious open reading frame unlikely to encode a protein, based on available experimental and comparative sequence data |
||
| YMR049C | 0.62 |
ERB1
|
Protein required for maturation of the 25S and 5.8S ribosomal RNAs; constituent of 66S pre-ribosomal particles; homologous to mammalian Bop1 |
|
| YML043C | 0.61 |
RRN11
|
Protein required for rDNA transcription by RNA polymerase I, component of the core factor (CF) of rDNA transcription factor, which also contains Rrn6p and Rrn7p |
|
| YMR300C | 0.61 |
ADE4
|
Phosphoribosylpyrophosphate amidotransferase (PRPPAT; amidophosphoribosyltransferase), catalyzes first step of the 'de novo' purine nucleotide biosynthetic pathway |
|
| YOL031C | 0.60 |
SIL1
|
Nucleotide exchange factor for the endoplasmic reticulum (ER) lumenal Hsp70 chaperone Kar2p, required for protein translocation into the ER; homolog of Yarrowia lipolytica SLS1; GrpE-like protein |
|
| YEL068C | 0.59 |
Dubious open reading frame unlikely to encode a functional protein, based on available experimental and comparative sequence data |
||
| YPR014C | 0.59 |
Dubious open reading frame unlikely to encode a protein, based on available experimental and comparative sequence data; YPR014C is not an essential gene |
||
| YEL033W | 0.59 |
MTC7
|
Predicted metabolic role based on network analysis derived from ChIP experiments, a large-scale deletion study and localization of transcription factor binding sites; null mutant is sensitive to temperature oscillation in a cdc13-1 mutant |
|
| YFR001W | 0.59 |
LOC1
|
Nuclear protein involved in asymmetric localization of ASH1 mRNA; binds double-stranded RNA in vitro; constituent of 66S pre-ribosomal particles |
|
| YDR278C | 0.59 |
Dubious open reading frame unlikely to encode a functional protein, based on available experimental and comparative sequence data |
||
| YML018C | 0.59 |
Putative protein of unknown function; green fluorescent protein (GFP)-fusion protein localizes to the membrane of the vacuole; physical interaction with Atg27p suggests a possible role in autophagy; YML018C is not an essential gene |
||
| YHR193C | 0.58 |
EGD2
|
Alpha subunit of the heteromeric nascent polypeptide-associated complex (NAC) involved in protein sorting and translocation, associated with cytoplasmic ribosomes |
|
| YMR199W | 0.58 |
CLN1
|
G1 cyclin involved in regulation of the cell cycle; activates Cdc28p kinase to promote the G1 to S phase transition; late G1 specific expression depends on transcription factor complexes, MBF (Swi6p-Mbp1p) and SBF (Swi6p-Swi4p) |
|
| YEL029C | 0.58 |
BUD16
|
Putative pyridoxal kinase, key enzyme in vitamin B6 metabolism; involved in maintaining levels of pyridoxal 5'-phosphate, the active form of vitamin B6; required for genome integrity; homolog of E. coli PdxK; involved in bud-site selection |
|
| YLR357W | 0.58 |
RSC2
|
Component of the RSC chromatin remodeling complex; required for expression of mid-late sporulation-specific genes; involved in telomere maintenance |
|
| YOR026W | 0.57 |
BUB3
|
Kinetochore checkpoint WD40 repeat protein that localizes to kinetochores during prophase and metaphase, delays anaphase in the presence of unattached kinetochores; forms complexes with Mad1p-Bub1p and with Cdc20p, binds Mad2p and Mad3p |
|
| YNL035C | 0.57 |
Putative protein of unknown function with similarity to proteins containing WD-40 domains; green fluorescent protein (GFP)-fusion protein localizes to the nucleus; YNL035C is not an essential gene |
||
| YLR257W | 0.57 |
Putative protein of unknown function |
||
| YER036C | 0.57 |
ARB1
|
ATPase of the ATP-binding cassette (ABC) family involved in 40S and 60S ribosome biogenesis, has similarity to Gcn20p; shuttles from nucleus to cytoplasm, physically interacts with Tif6p, Lsg1p |
|
| YOL040C | 0.57 |
RPS15
|
Protein component of the small (40S) ribosomal subunit; has similarity to E. coli S19 and rat S15 ribosomal proteins |
|
| YPL144W | 0.57 |
POC4
|
Component of a heterodimeric Poc4p-Irc25p chaperone involved in assembly of alpha subunits into the 20S proteasome; may regulate formation of proteasome isoforms with alternative subunits under different conditions |
|
| YML115C | 0.56 |
VAN1
|
Component of the mannan polymerase I, which contains Van1p and Mnn9p and is involved in the first steps of mannan synthesis; mutants are vanadate-resistant |
|
| YPL131W | 0.56 |
RPL5
|
Protein component of the large (60S) ribosomal subunit with similarity to E. coli L18 and rat L5 ribosomal proteins; binds 5S rRNA and is required for 60S subunit assembly |
|
| YJL200C | 0.56 |
ACO2
|
Putative mitochondrial aconitase isozyme; similarity to Aco1p, an aconitase required for the TCA cycle; expression induced during growth on glucose, by amino acid starvation via Gcn4p, and repressed on ethanol |
|
| YGR157W | 0.56 |
CHO2
|
Phosphatidylethanolamine methyltransferase (PEMT), catalyzes the first step in the conversion of phosphatidylethanolamine to phosphatidylcholine during the methylation pathway of phosphatidylcholine biosynthesis |
|
| YGL039W | 0.55 |
Oxidoreductase, catalyzes NADPH-dependent reduction of the bicyclic diketone bicyclo[2.2.2]octane-2,6-dione (BCO2,6D) to the chiral ketoalcohol (1R,4S,6S)-6-hydroxybicyclo[2.2.2]octane-2-one (BCO2one6ol) |
||
| YLR420W | 0.55 |
URA4
|
Dihydroorotase, catalyzes the third enzymatic step in the de novo biosynthesis of pyrimidines, converting carbamoyl-L-aspartate into dihydroorotate |
|
| YHR046C | 0.54 |
INM1
|
Inositol monophosphatase, involved in biosynthesis of inositol and in phosphoinositide second messenger signaling; INM1 expression increases in the presence of inositol and decreases upon exposure to antibipolar drugs lithium and valproate |
|
| YCL063W | 0.54 |
VAC17
|
Protein involved in vacuole inheritance; acts as a vacuole-specific receptor for myosin Myo2p |
|
| YOL039W | 0.54 |
RPP2A
|
Ribosomal protein P2 alpha, a component of the ribosomal stalk, which is involved in the interaction between translational elongation factors and the ribosome; regulates the accumulation of P1 (Rpp1Ap and Rpp1Bp) in the cytoplasm |
|
| YEL053C | 0.54 |
MAK10
|
Non-catalytic subunit of N-terminal acetyltransferase of the NatC type, required for replication of dsRNA virus; expression is glucose-repressible |
|
| YPR148C | 0.54 |
Protein of unknown function that may interact with ribosomes, based on co-purification experiments; green fluorescent protein (GFP)-fusion protein localizes to the cytoplasm in a punctate pattern |
||
| YMR267W | 0.54 |
PPA2
|
Mitochondrial inorganic pyrophosphatase, required for mitochondrial function and possibly involved in energy generation from inorganic pyrophosphate |
|
| YBR081C | 0.54 |
SPT7
|
Subunit of the SAGA transcriptional regulatory complex, involved in proper assembly of the complex; also present as a C-terminally truncated form in the SLIK/SALSA transcriptional regulatory complex |
|
| YGR293C | 0.53 |
Dubious open reading frame unlikely to encode a protein, based on available experimental and comparative sequence data; partially overlaps the uncharacterized ORF YGR294W |
||
| YAR002W | 0.53 |
NUP60
|
Subunit of the nuclear pore complex (NPC), functions to anchor Nup2p to the NPC in a process controlled by the nucleoplasmic concentration of Gsp1p-GTP; potential Cdc28p substrate; involved in telomere maintenance |
|
| YDL082W | 0.53 |
RPL13A
|
Protein component of the large (60S) ribosomal subunit, nearly identical to Rpl13Bp; not essential for viability; has similarity to rat L13 ribosomal protein |
|
| YBR011C | 0.52 |
IPP1
|
Cytoplasmic inorganic pyrophosphatase (PPase), catalyzes the rapid exchange of oxygens from Pi with water, highly expressed and essential for viability, active-site residues show identity to those from E. coli PPase |
|
| YER119C-A | 0.52 |
Dubious open reading frame, not conserved in closely related Saccharomyces species; deletion mutation blocks replication of Brome mosaic virus in S. cerevisiae, but this is likely due to effects on the overlapping gene SCS2 |
||
| YCR035C | 0.52 |
RRP43
|
Protein involved in rRNA processing; component of the exosome 3->5 exonuclease complex with Rrp41p, Rrp42p, Rrp4p and Dis3p; required for efficient maturation of 5.8S, 18S and 25S rRNA |
|
| YDL173W | 0.52 |
Putative protein of unknown function; green fluorescent protein (GFP)-fusion protein localizes to the cytoplasm; YDL173W is not an essential gene |
||
| YDL134C | 0.52 |
PPH21
|
Catalytic subunit of protein phosphatase 2A, functionally redundant with Pph22p; methylated at C terminus; forms alternate complexes with several regulatory subunits; involved in signal transduction and regulation of mitosis |
|
| YHR136C | 0.52 |
SPL2
|
Protein with similarity to cyclin-dependent kinase inhibitors, overproduction suppresses a plc1 null mutation; green fluorescent protein (GFP)-fusion protein localizes to the cytoplasm in a punctate pattern |
|
| YMR220W | 0.52 |
ERG8
|
Phosphomevalonate kinase, an essential cytosolic enzyme that acts in the biosynthesis of isoprenoids and sterols, including ergosterol, from mevalonate |
|
| YOL016C | 0.51 |
CMK2
|
Calmodulin-dependent protein kinase; may play a role in stress response, many CA++/calmodulan dependent phosphorylation substrates demonstrated in vitro, amino acid sequence similar to Cmk1p and mammalian Cam Kinase II |
|
| YBR023C | 0.51 |
CHS3
|
Chitin synthase III, catalyzes the transfer of N-acetylglucosamine (GlcNAc) to chitin; required for synthesis of the majority of cell wall chitin, the chitin ring during bud emergence, and spore wall chitosan |
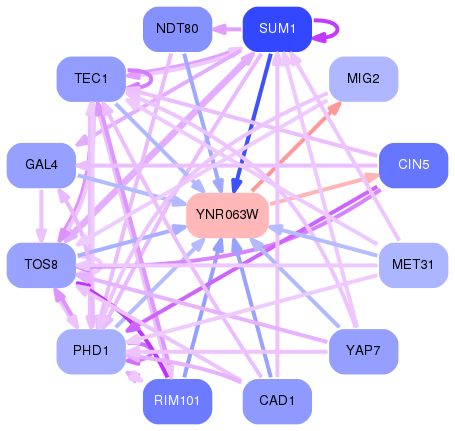
Network of associatons between targets according to the STRING database.

First level regulatory network of YNR063W
Gene Ontology Analysis
Gene overrepresentation in biological process category:
| Log-likelihood per target | Total log-likelihood | Term | Description |
|---|---|---|---|
| 1.5 | 4.6 | GO:0000098 | sulfur amino acid catabolic process(GO:0000098) |
| 1.1 | 3.2 | GO:0007189 | adenylate cyclase-activating G-protein coupled receptor signaling pathway(GO:0007189) |
| 1.0 | 3.0 | GO:0046039 | GTP biosynthetic process(GO:0006183) GTP metabolic process(GO:0046039) |
| 0.8 | 2.5 | GO:0090342 | regulation of cell aging(GO:0090342) regulation of replicative cell aging(GO:1900062) |
| 0.8 | 3.3 | GO:1900436 | filamentous growth of a population of unicellular organisms in response to starvation(GO:0036170) regulation of filamentous growth of a population of unicellular organisms in response to starvation(GO:1900434) positive regulation of filamentous growth of a population of unicellular organisms in response to starvation(GO:1900436) |
| 0.8 | 3.2 | GO:0000092 | mitotic anaphase B(GO:0000092) |
| 0.8 | 3.1 | GO:0014070 | response to organic cyclic compound(GO:0014070) response to cycloheximide(GO:0046898) |
| 0.6 | 3.1 | GO:0034723 | DNA replication-dependent nucleosome assembly(GO:0006335) DNA replication-independent nucleosome assembly(GO:0006336) DNA replication-dependent nucleosome organization(GO:0034723) positive regulation of histone acetylation(GO:0035066) positive regulation of protein acetylation(GO:1901985) positive regulation of peptidyl-lysine acetylation(GO:2000758) |
| 0.6 | 5.7 | GO:0006116 | NADH oxidation(GO:0006116) |
| 0.5 | 1.6 | GO:0006798 | polyphosphate catabolic process(GO:0006798) |
| 0.5 | 1.5 | GO:0009298 | GDP-mannose biosynthetic process(GO:0009298) GDP-mannose metabolic process(GO:0019673) |
| 0.4 | 3.0 | GO:0043137 | DNA replication, removal of RNA primer(GO:0043137) |
| 0.4 | 1.2 | GO:0071478 | cellular response to radiation(GO:0071478) cellular response to light stimulus(GO:0071482) |
| 0.4 | 1.2 | GO:0035953 | regulation of oligopeptide transport by regulation of transcription from RNA polymerase II promoter(GO:0035950) negative regulation of oligopeptide transport by negative regulation of transcription from RNA polymerase II promoter(GO:0035952) regulation of dipeptide transport by regulation of transcription from RNA polymerase II promoter(GO:0035953) negative regulation of dipeptide transport by negative regulation of transcription from RNA polymerase II promoter(GO:0035955) negative regulation of oligopeptide transport(GO:2000877) negative regulation of dipeptide transport(GO:2000879) |
| 0.4 | 1.4 | GO:0046490 | isopentenyl diphosphate biosynthetic process(GO:0009240) isopentenyl diphosphate biosynthetic process, mevalonate pathway(GO:0019287) isopentenyl diphosphate metabolic process(GO:0046490) |
| 0.3 | 1.0 | GO:0044209 | AMP salvage(GO:0044209) |
| 0.3 | 2.4 | GO:0006782 | protoporphyrinogen IX biosynthetic process(GO:0006782) protoporphyrinogen IX metabolic process(GO:0046501) |
| 0.3 | 3.7 | GO:0000056 | ribosomal small subunit export from nucleus(GO:0000056) |
| 0.3 | 1.7 | GO:0032233 | regulation of actin filament bundle assembly(GO:0032231) positive regulation of actin filament bundle assembly(GO:0032233) |
| 0.3 | 3.7 | GO:0015758 | glucose transport(GO:0015758) |
| 0.3 | 0.7 | GO:0043096 | purine nucleobase salvage(GO:0043096) adenine metabolic process(GO:0046083) |
| 0.3 | 1.0 | GO:0046495 | nicotinamide riboside metabolic process(GO:0046495) pyridine nucleoside metabolic process(GO:0070637) |
| 0.3 | 1.4 | GO:0035434 | copper ion transmembrane transport(GO:0035434) |
| 0.2 | 0.9 | GO:0046500 | S-adenosylmethionine metabolic process(GO:0046500) |
| 0.2 | 0.7 | GO:0008272 | sulfate transport(GO:0008272) |
| 0.2 | 1.5 | GO:0005992 | trehalose biosynthetic process(GO:0005992) oligosaccharide biosynthetic process(GO:0009312) disaccharide biosynthetic process(GO:0046351) |
| 0.2 | 1.1 | GO:0043433 | negative regulation of sequence-specific DNA binding transcription factor activity(GO:0043433) |
| 0.2 | 0.6 | GO:0032365 | intracellular lipid transport(GO:0032365) negative regulation of transcription factor import into nucleus(GO:0042992) |
| 0.2 | 0.8 | GO:0015867 | ATP transport(GO:0015867) |
| 0.2 | 0.8 | GO:0010138 | pyrimidine ribonucleotide salvage(GO:0010138) pyrimidine nucleotide salvage(GO:0032262) pyrimidine nucleoside salvage(GO:0043097) UMP salvage(GO:0044206) |
| 0.2 | 0.8 | GO:0070072 | proton-transporting V-type ATPase complex assembly(GO:0070070) vacuolar proton-transporting V-type ATPase complex assembly(GO:0070072) |
| 0.2 | 2.0 | GO:0007109 | obsolete cytokinesis, completion of separation(GO:0007109) |
| 0.2 | 1.1 | GO:0042538 | hyperosmotic salinity response(GO:0042538) |
| 0.2 | 1.7 | GO:0070525 | tRNA threonylcarbamoyladenosine metabolic process(GO:0070525) |
| 0.2 | 0.7 | GO:0009423 | chorismate biosynthetic process(GO:0009423) |
| 0.2 | 1.1 | GO:0045292 | mRNA cis splicing, via spliceosome(GO:0045292) |
| 0.2 | 0.9 | GO:0031087 | deadenylation-independent decapping of nuclear-transcribed mRNA(GO:0031087) |
| 0.2 | 0.3 | GO:0007026 | negative regulation of microtubule depolymerization(GO:0007026) regulation of microtubule depolymerization(GO:0031114) |
| 0.2 | 0.7 | GO:0070588 | calcium ion transmembrane transport(GO:0070588) |
| 0.2 | 0.8 | GO:0001676 | long-chain fatty acid metabolic process(GO:0001676) |
| 0.2 | 0.5 | GO:0034473 | U1 snRNA 3'-end processing(GO:0034473) |
| 0.2 | 0.2 | GO:0071474 | cellular hyperosmotic response(GO:0071474) |
| 0.2 | 0.8 | GO:0042780 | tRNA 3'-end processing(GO:0042780) |
| 0.2 | 1.6 | GO:0007021 | tubulin complex assembly(GO:0007021) |
| 0.2 | 1.1 | GO:0031120 | snRNA pseudouridine synthesis(GO:0031120) snRNA modification(GO:0040031) |
| 0.2 | 0.8 | GO:0070814 | hydrogen sulfide metabolic process(GO:0070813) hydrogen sulfide biosynthetic process(GO:0070814) |
| 0.2 | 0.8 | GO:0043619 | regulation of transcription from RNA polymerase II promoter in response to oxidative stress(GO:0043619) |
| 0.2 | 0.3 | GO:0015909 | long-chain fatty acid transport(GO:0015909) |
| 0.2 | 0.6 | GO:0006361 | transcription initiation from RNA polymerase I promoter(GO:0006361) |
| 0.2 | 1.8 | GO:0033967 | box C/D snoRNA metabolic process(GO:0033967) box C/D snoRNA processing(GO:0034963) |
| 0.2 | 1.4 | GO:0006474 | N-terminal protein amino acid acetylation(GO:0006474) |
| 0.2 | 0.3 | GO:0006166 | purine ribonucleoside salvage(GO:0006166) |
| 0.1 | 3.3 | GO:0002098 | tRNA wobble base modification(GO:0002097) tRNA wobble uridine modification(GO:0002098) |
| 0.1 | 0.6 | GO:0034198 | cellular response to amino acid starvation(GO:0034198) |
| 0.1 | 0.4 | GO:0072361 | regulation of glycolytic process by regulation of transcription from RNA polymerase II promoter(GO:0072361) regulation of glycolytic process by positive regulation of transcription from RNA polymerase II promoter(GO:0072363) |
| 0.1 | 0.6 | GO:0051131 | chaperone-mediated protein complex assembly(GO:0051131) |
| 0.1 | 0.1 | GO:0045901 | positive regulation of translational elongation(GO:0045901) |
| 0.1 | 1.7 | GO:0071051 | polyadenylation-dependent snoRNA 3'-end processing(GO:0071051) |
| 0.1 | 0.7 | GO:0016560 | protein import into peroxisome matrix, docking(GO:0016560) protein to membrane docking(GO:0022615) |
| 0.1 | 2.3 | GO:0051029 | rRNA export from nucleus(GO:0006407) rRNA transport(GO:0051029) |
| 0.1 | 1.5 | GO:0006458 | 'de novo' protein folding(GO:0006458) |
| 0.1 | 0.3 | GO:0019348 | polyprenol metabolic process(GO:0016093) polyprenol biosynthetic process(GO:0016094) dolichol metabolic process(GO:0019348) dolichol biosynthetic process(GO:0019408) |
| 0.1 | 1.5 | GO:0006817 | phosphate ion transport(GO:0006817) |
| 0.1 | 0.5 | GO:0060188 | regulation of protein desumoylation(GO:0060188) |
| 0.1 | 0.7 | GO:0009098 | leucine biosynthetic process(GO:0009098) |
| 0.1 | 0.6 | GO:0007535 | donor selection(GO:0007535) |
| 0.1 | 0.9 | GO:0043666 | regulation of phosphoprotein phosphatase activity(GO:0043666) |
| 0.1 | 0.4 | GO:0006567 | threonine catabolic process(GO:0006567) |
| 0.1 | 0.9 | GO:0071267 | L-methionine biosynthetic process from methylthioadenosine(GO:0019509) amino acid salvage(GO:0043102) L-methionine salvage(GO:0071267) |
| 0.1 | 1.2 | GO:0055069 | cellular zinc ion homeostasis(GO:0006882) zinc ion homeostasis(GO:0055069) |
| 0.1 | 0.9 | GO:0006616 | SRP-dependent cotranslational protein targeting to membrane, translocation(GO:0006616) |
| 0.1 | 0.6 | GO:0000028 | ribosomal small subunit assembly(GO:0000028) |
| 0.1 | 3.7 | GO:0006694 | steroid biosynthetic process(GO:0006694) sterol biosynthetic process(GO:0016126) |
| 0.1 | 0.7 | GO:0006855 | drug transmembrane transport(GO:0006855) |
| 0.1 | 15.4 | GO:0002181 | cytoplasmic translation(GO:0002181) |
| 0.1 | 1.4 | GO:0007120 | axial cellular bud site selection(GO:0007120) |
| 0.1 | 2.5 | GO:0006885 | regulation of pH(GO:0006885) |
| 0.1 | 0.3 | GO:0097577 | intracellular sequestering of iron ion(GO:0006880) sequestering of metal ion(GO:0051238) sequestering of iron ion(GO:0097577) |
| 0.1 | 0.3 | GO:0009202 | deoxyribonucleoside triphosphate biosynthetic process(GO:0009202) |
| 0.1 | 0.6 | GO:0009113 | purine nucleobase biosynthetic process(GO:0009113) |
| 0.1 | 1.2 | GO:0051278 | cell wall chitin biosynthetic process(GO:0006038) fungal-type cell wall chitin biosynthetic process(GO:0034221) fungal-type cell wall polysaccharide biosynthetic process(GO:0051278) fungal-type cell wall polysaccharide metabolic process(GO:0071966) |
| 0.1 | 1.4 | GO:0010499 | proteasomal ubiquitin-independent protein catabolic process(GO:0010499) |
| 0.1 | 0.3 | GO:0006624 | vacuolar protein processing(GO:0006624) |
| 0.1 | 0.2 | GO:1901070 | GMP biosynthetic process(GO:0006177) guanosine-containing compound biosynthetic process(GO:1901070) |
| 0.1 | 0.1 | GO:0016479 | negative regulation of transcription from RNA polymerase I promoter(GO:0016479) |
| 0.1 | 0.3 | GO:0060548 | negative regulation of apoptotic process(GO:0043066) negative regulation of programmed cell death(GO:0043069) negative regulation of cell death(GO:0060548) |
| 0.1 | 0.6 | GO:0009082 | branched-chain amino acid biosynthetic process(GO:0009082) |
| 0.1 | 1.2 | GO:0001100 | negative regulation of exit from mitosis(GO:0001100) |
| 0.1 | 0.4 | GO:0001402 | signal transduction involved in filamentous growth(GO:0001402) |
| 0.1 | 0.4 | GO:0090158 | regulation of phosphatidylinositol dephosphorylation(GO:0060304) endoplasmic reticulum membrane organization(GO:0090158) |
| 0.1 | 2.9 | GO:0043038 | amino acid activation(GO:0043038) tRNA aminoacylation(GO:0043039) |
| 0.1 | 1.0 | GO:0006614 | cotranslational protein targeting to membrane(GO:0006613) SRP-dependent cotranslational protein targeting to membrane(GO:0006614) |
| 0.1 | 0.3 | GO:0006482 | protein demethylation(GO:0006482) protein dealkylation(GO:0008214) histone demethylation(GO:0016577) demethylation(GO:0070988) |
| 0.1 | 0.8 | GO:0000032 | cell wall mannoprotein biosynthetic process(GO:0000032) mannoprotein metabolic process(GO:0006056) mannoprotein biosynthetic process(GO:0006057) cell wall glycoprotein biosynthetic process(GO:0031506) |
| 0.1 | 0.4 | GO:0036228 | protein targeting to nuclear inner membrane(GO:0036228) |
| 0.1 | 0.6 | GO:0006276 | plasmid maintenance(GO:0006276) |
| 0.1 | 0.2 | GO:0034389 | lipid particle organization(GO:0034389) |
| 0.1 | 0.6 | GO:0043094 | cellular metabolic compound salvage(GO:0043094) |
| 0.1 | 4.0 | GO:0007124 | pseudohyphal growth(GO:0007124) |
| 0.1 | 0.6 | GO:0000372 | Group I intron splicing(GO:0000372) RNA splicing, via transesterification reactions with guanosine as nucleophile(GO:0000376) |
| 0.1 | 0.4 | GO:0006363 | termination of RNA polymerase I transcription(GO:0006363) |
| 0.1 | 1.9 | GO:0000480 | endonucleolytic cleavage in 5'-ETS of tricistronic rRNA transcript (SSU-rRNA, 5.8S rRNA, LSU-rRNA)(GO:0000480) |
| 0.1 | 1.7 | GO:0042594 | response to starvation(GO:0042594) |
| 0.1 | 2.6 | GO:0044744 | protein targeting to nucleus(GO:0044744) |
| 0.1 | 0.1 | GO:0009090 | homoserine biosynthetic process(GO:0009090) |
| 0.1 | 0.3 | GO:0030497 | fatty acid elongation(GO:0030497) |
| 0.1 | 1.2 | GO:0032508 | DNA duplex unwinding(GO:0032508) |
| 0.1 | 1.0 | GO:0006415 | translational termination(GO:0006415) |
| 0.1 | 0.1 | GO:0071931 | positive regulation of transcription involved in G1/S transition of mitotic cell cycle(GO:0071931) |
| 0.1 | 0.4 | GO:0034063 | stress granule assembly(GO:0034063) |
| 0.1 | 1.0 | GO:0030473 | establishment of localization by movement along microtubule(GO:0010970) nuclear migration along microtubule(GO:0030473) organelle transport along microtubule(GO:0072384) |
| 0.1 | 1.2 | GO:0007094 | mitotic spindle assembly checkpoint(GO:0007094) |
| 0.1 | 0.2 | GO:0007329 | positive regulation of transcription from RNA polymerase II promoter by pheromones(GO:0007329) positive regulation of transcription by pheromones(GO:0009371) |
| 0.1 | 0.2 | GO:0006564 | L-serine biosynthetic process(GO:0006564) |
| 0.1 | 0.2 | GO:0044818 | mitotic G2/M transition checkpoint(GO:0044818) |
| 0.1 | 0.1 | GO:0051865 | protein autoubiquitination(GO:0051865) |
| 0.1 | 0.2 | GO:0000296 | spermine transport(GO:0000296) |
| 0.1 | 0.1 | GO:0090282 | positive regulation of transcription involved in G2/M transition of mitotic cell cycle(GO:0090282) |
| 0.1 | 0.2 | GO:0071406 | response to methylmercury(GO:0051597) cellular response to methylmercury(GO:0071406) |
| 0.1 | 0.2 | GO:0015883 | FAD transport(GO:0015883) |
| 0.1 | 0.3 | GO:0006673 | inositolphosphoceramide metabolic process(GO:0006673) |
| 0.1 | 0.1 | GO:0035337 | fatty-acyl-CoA metabolic process(GO:0035337) |
| 0.1 | 0.5 | GO:0072507 | cellular divalent inorganic cation homeostasis(GO:0072503) divalent inorganic cation homeostasis(GO:0072507) |
| 0.1 | 0.4 | GO:0052803 | histidine biosynthetic process(GO:0000105) histidine metabolic process(GO:0006547) imidazole-containing compound metabolic process(GO:0052803) |
| 0.1 | 0.1 | GO:1902223 | L-phenylalanine biosynthetic process(GO:0009094) erythrose 4-phosphate/phosphoenolpyruvate family amino acid biosynthetic process(GO:1902223) |
| 0.0 | 0.8 | GO:0030488 | tRNA methylation(GO:0030488) |
| 0.0 | 0.1 | GO:0015809 | arginine transport(GO:0015809) |
| 0.0 | 0.1 | GO:0035753 | maintenance of DNA trinucleotide repeats(GO:0035753) |
| 0.0 | 0.1 | GO:0045860 | positive regulation of protein kinase activity(GO:0045860) |
| 0.0 | 0.1 | GO:0000915 | assembly of actomyosin apparatus involved in cytokinesis(GO:0000912) actomyosin contractile ring assembly(GO:0000915) actomyosin structure organization(GO:0031032) actomyosin contractile ring organization(GO:0044837) |
| 0.0 | 0.2 | GO:0006658 | phosphatidylserine metabolic process(GO:0006658) |
| 0.0 | 0.4 | GO:0007096 | regulation of exit from mitosis(GO:0007096) |
| 0.0 | 0.1 | GO:0031684 | heterotrimeric G-protein complex cycle(GO:0031684) |
| 0.0 | 0.4 | GO:0000921 | septin ring assembly(GO:0000921) |
| 0.0 | 0.3 | GO:0070481 | nuclear-transcribed mRNA catabolic process, non-stop decay(GO:0070481) |
| 0.0 | 0.5 | GO:0000011 | vacuole inheritance(GO:0000011) |
| 0.0 | 0.2 | GO:0048255 | RNA stabilization(GO:0043489) mRNA stabilization(GO:0048255) |
| 0.0 | 0.1 | GO:0001109 | promoter clearance during DNA-templated transcription(GO:0001109) promoter clearance from RNA polymerase II promoter(GO:0001111) |
| 0.0 | 0.2 | GO:0070676 | intralumenal vesicle formation(GO:0070676) |
| 0.0 | 0.5 | GO:0007004 | telomere maintenance via telomerase(GO:0007004) telomere maintenance via telomere lengthening(GO:0010833) |
| 0.0 | 4.8 | GO:0006364 | rRNA processing(GO:0006364) |
| 0.0 | 0.4 | GO:0031110 | regulation of microtubule polymerization or depolymerization(GO:0031110) |
| 0.0 | 0.3 | GO:0009396 | folic acid-containing compound biosynthetic process(GO:0009396) pteridine-containing compound biosynthetic process(GO:0042559) |
| 0.0 | 0.5 | GO:0006493 | protein O-linked glycosylation(GO:0006493) |
| 0.0 | 1.2 | GO:0008033 | tRNA processing(GO:0008033) |
| 0.0 | 0.1 | GO:0034724 | DNA replication-independent nucleosome organization(GO:0034724) |
| 0.0 | 0.1 | GO:0060491 | regulation of cell projection organization(GO:0031344) mating projection assembly(GO:0031382) regulation of mating projection assembly(GO:0031383) regulation of termination of mating projection growth(GO:0031385) regulation of cell projection assembly(GO:0060491) |
| 0.0 | 0.2 | GO:0009051 | pentose-phosphate shunt, oxidative branch(GO:0009051) |
| 0.0 | 0.1 | GO:0000715 | nucleotide-excision repair, DNA damage recognition(GO:0000715) |
| 0.0 | 0.3 | GO:0000184 | nuclear-transcribed mRNA catabolic process, nonsense-mediated decay(GO:0000184) |
| 0.0 | 0.4 | GO:0016973 | poly(A)+ mRNA export from nucleus(GO:0016973) |
| 0.0 | 0.7 | GO:0006414 | translational elongation(GO:0006414) |
| 0.0 | 0.4 | GO:0033753 | ribosomal subunit export from nucleus(GO:0000054) ribosome localization(GO:0033750) establishment of ribosome localization(GO:0033753) |
| 0.0 | 0.1 | GO:0043171 | peptide catabolic process(GO:0043171) |
| 0.0 | 0.1 | GO:0007234 | osmosensory signaling via phosphorelay pathway(GO:0007234) |
| 0.0 | 1.1 | GO:0006413 | translational initiation(GO:0006413) |
| 0.0 | 0.1 | GO:0048279 | vesicle fusion with endoplasmic reticulum(GO:0048279) |
| 0.0 | 0.1 | GO:0007231 | osmosensory signaling pathway(GO:0007231) |
| 0.0 | 0.8 | GO:0006487 | protein N-linked glycosylation(GO:0006487) |
| 0.0 | 0.1 | GO:0032012 | ARF protein signal transduction(GO:0032011) regulation of ARF protein signal transduction(GO:0032012) |
| 0.0 | 0.0 | GO:0007232 | osmosensory signaling pathway via Sho1 osmosensor(GO:0007232) |
| 0.0 | 0.8 | GO:0009266 | response to temperature stimulus(GO:0009266) |
| 0.0 | 0.1 | GO:0007157 | agglutination involved in conjugation with cellular fusion(GO:0000752) agglutination involved in conjugation(GO:0000771) heterophilic cell-cell adhesion via plasma membrane cell adhesion molecules(GO:0007157) cell-cell adhesion(GO:0098609) adhesion between unicellular organisms(GO:0098610) multi organism cell adhesion(GO:0098740) cell-cell adhesion via plasma-membrane adhesion molecules(GO:0098742) |
| 0.0 | 0.1 | GO:1903051 | negative regulation of protein catabolic process(GO:0042177) negative regulation of proteolysis involved in cellular protein catabolic process(GO:1903051) negative regulation of cellular protein catabolic process(GO:1903363) |
| 0.0 | 0.3 | GO:0007076 | mitotic chromosome condensation(GO:0007076) |
| 0.0 | 0.4 | GO:0006513 | protein monoubiquitination(GO:0006513) |
| 0.0 | 0.2 | GO:0007323 | peptide pheromone maturation(GO:0007323) |
| 0.0 | 0.4 | GO:0009304 | tRNA transcription(GO:0009304) tRNA transcription from RNA polymerase III promoter(GO:0042797) |
| 0.0 | 0.0 | GO:0032958 | inositol phosphate biosynthetic process(GO:0032958) |
| 0.0 | 0.2 | GO:0006526 | arginine biosynthetic process(GO:0006526) |
| 0.0 | 0.1 | GO:0051126 | negative regulation of Arp2/3 complex-mediated actin nucleation(GO:0034316) negative regulation of actin nucleation(GO:0051126) |
| 0.0 | 0.3 | GO:0006283 | transcription-coupled nucleotide-excision repair(GO:0006283) |
| 0.0 | 0.2 | GO:0042766 | nucleosome mobilization(GO:0042766) |
| 0.0 | 0.1 | GO:0006741 | NADP biosynthetic process(GO:0006741) |
| 0.0 | 0.1 | GO:0048313 | Golgi inheritance(GO:0048313) |
| 0.0 | 0.1 | GO:0042435 | tryptophan biosynthetic process(GO:0000162) indole-containing compound biosynthetic process(GO:0042435) indolalkylamine biosynthetic process(GO:0046219) |
| 0.0 | 0.1 | GO:0015693 | magnesium ion transport(GO:0015693) |
| 0.0 | 0.5 | GO:0006891 | intra-Golgi vesicle-mediated transport(GO:0006891) |
| 0.0 | 0.1 | GO:0006037 | cell wall chitin metabolic process(GO:0006037) |
| 0.0 | 0.1 | GO:0034470 | ncRNA processing(GO:0034470) |
| 0.0 | 0.3 | GO:0006656 | phosphatidylcholine biosynthetic process(GO:0006656) |
| 0.0 | 0.1 | GO:0016255 | attachment of GPI anchor to protein(GO:0016255) |
| 0.0 | 0.1 | GO:0030042 | actin filament depolymerization(GO:0030042) Golgi to plasma membrane protein transport(GO:0043001) |
| 0.0 | 0.1 | GO:0007097 | nuclear migration(GO:0007097) establishment of nucleus localization(GO:0040023) nucleus localization(GO:0051647) |
| 0.0 | 0.1 | GO:0046416 | D-amino acid metabolic process(GO:0046416) |
| 0.0 | 0.0 | GO:1900544 | positive regulation of nucleotide metabolic process(GO:0045981) positive regulation of purine nucleotide metabolic process(GO:1900544) |
| 0.0 | 1.2 | GO:0006888 | ER to Golgi vesicle-mediated transport(GO:0006888) |
| 0.0 | 0.1 | GO:0006734 | NADH metabolic process(GO:0006734) |
| 0.0 | 0.2 | GO:0006369 | termination of RNA polymerase II transcription(GO:0006369) |
| 0.0 | 0.1 | GO:0008299 | isoprenoid metabolic process(GO:0006720) isoprenoid biosynthetic process(GO:0008299) |
| 0.0 | 0.4 | GO:0042147 | retrograde transport, endosome to Golgi(GO:0042147) |
| 0.0 | 0.1 | GO:0031647 | regulation of protein stability(GO:0031647) |
| 0.0 | 0.2 | GO:0031145 | anaphase-promoting complex-dependent catabolic process(GO:0031145) |
| 0.0 | 0.2 | GO:0019682 | pentose-phosphate shunt(GO:0006098) glyceraldehyde-3-phosphate metabolic process(GO:0019682) |
| 0.0 | 0.1 | GO:0006086 | acetyl-CoA biosynthetic process from pyruvate(GO:0006086) |
| 0.0 | 0.1 | GO:0000266 | mitochondrial fission(GO:0000266) |
| 0.0 | 0.1 | GO:0000244 | spliceosomal tri-snRNP complex assembly(GO:0000244) spliceosomal snRNP assembly(GO:0000387) |
| 0.0 | 0.0 | GO:0046348 | aminoglycan catabolic process(GO:0006026) chitin catabolic process(GO:0006032) amino sugar catabolic process(GO:0046348) glucosamine-containing compound catabolic process(GO:1901072) |
| 0.0 | 0.1 | GO:0006561 | proline biosynthetic process(GO:0006561) |
| 0.0 | 0.1 | GO:0008298 | intracellular mRNA localization(GO:0008298) |
| 0.0 | 0.2 | GO:0000245 | spliceosomal complex assembly(GO:0000245) |
| 0.0 | 0.1 | GO:0046854 | lipid phosphorylation(GO:0046834) phosphatidylinositol phosphorylation(GO:0046854) |
| 0.0 | 0.0 | GO:0006591 | ornithine metabolic process(GO:0006591) |
| 0.0 | 0.1 | GO:0051666 | actin cortical patch localization(GO:0051666) |
| 0.0 | 0.1 | GO:0032986 | nucleosome disassembly(GO:0006337) chromatin disassembly(GO:0031498) protein-DNA complex disassembly(GO:0032986) |
| 0.0 | 0.1 | GO:0045040 | protein import into mitochondrial outer membrane(GO:0045040) |
| 0.0 | 0.0 | GO:0006816 | calcium ion transport(GO:0006816) |
| 0.0 | 0.3 | GO:0040020 | regulation of meiotic nuclear division(GO:0040020) |
| 0.0 | 0.1 | GO:0042219 | cellular modified amino acid catabolic process(GO:0042219) |
| 0.0 | 0.1 | GO:0006378 | mRNA polyadenylation(GO:0006378) |
| 0.0 | 0.4 | GO:0006470 | protein dephosphorylation(GO:0006470) |
| 0.0 | 0.3 | GO:0071900 | regulation of cyclin-dependent protein serine/threonine kinase activity(GO:0000079) regulation of protein serine/threonine kinase activity(GO:0071900) regulation of cyclin-dependent protein kinase activity(GO:1904029) |
| 0.0 | 0.2 | GO:0016311 | dephosphorylation(GO:0016311) |
| 0.0 | 0.0 | GO:0035493 | SNARE complex assembly(GO:0035493) regulation of SNARE complex assembly(GO:0035542) |
| 0.0 | 0.0 | GO:0031047 | gene silencing involved in chronological cell aging(GO:0010978) gene silencing by RNA(GO:0031047) |
| 0.0 | 0.2 | GO:0006896 | Golgi to vacuole transport(GO:0006896) |
| 0.0 | 0.1 | GO:0045116 | protein neddylation(GO:0045116) |
Gene overrepresentation in cellular component category:
| Log-likelihood per target | Total log-likelihood | Term | Description |
|---|---|---|---|
| 1.4 | 1.4 | GO:0044427 | chromatin(GO:0000785) chromosomal part(GO:0044427) |
| 1.0 | 3.0 | GO:0032299 | ribonuclease H2 complex(GO:0032299) |
| 0.5 | 3.1 | GO:0005871 | kinesin complex(GO:0005871) |
| 0.4 | 1.5 | GO:0005946 | alpha,alpha-trehalose-phosphate synthase complex (UDP-forming)(GO:0005946) |
| 0.3 | 1.7 | GO:0000408 | EKC/KEOPS complex(GO:0000408) |
| 0.3 | 0.9 | GO:0009331 | glycerol-3-phosphate dehydrogenase complex(GO:0009331) |
| 0.3 | 0.8 | GO:0031415 | NatA complex(GO:0031415) |
| 0.3 | 3.2 | GO:0030688 | preribosome, small subunit precursor(GO:0030688) |
| 0.3 | 0.8 | GO:0005850 | eukaryotic translation initiation factor 2 complex(GO:0005850) |
| 0.2 | 1.7 | GO:0005697 | telomerase holoenzyme complex(GO:0005697) |
| 0.2 | 0.7 | GO:0034457 | Mpp10 complex(GO:0034457) |
| 0.2 | 1.1 | GO:0005853 | eukaryotic translation elongation factor 1 complex(GO:0005853) |
| 0.2 | 0.6 | GO:0070545 | PeBoW complex(GO:0070545) |
| 0.2 | 0.8 | GO:0017053 | transcriptional repressor complex(GO:0017053) |
| 0.2 | 0.6 | GO:0005854 | nascent polypeptide-associated complex(GO:0005854) |
| 0.2 | 1.3 | GO:0016272 | prefoldin complex(GO:0016272) |
| 0.2 | 15.5 | GO:0022625 | cytosolic large ribosomal subunit(GO:0022625) |
| 0.2 | 0.5 | GO:0031417 | NatC complex(GO:0031417) |
| 0.2 | 1.1 | GO:0000136 | alpha-1,6-mannosyltransferase complex(GO:0000136) |
| 0.2 | 2.2 | GO:0000176 | nuclear exosome (RNase complex)(GO:0000176) |
| 0.2 | 0.6 | GO:0070860 | RNA polymerase I core factor complex(GO:0070860) |
| 0.2 | 0.8 | GO:0034518 | RNA cap binding complex(GO:0034518) |
| 0.1 | 0.4 | GO:0017102 | methionyl glutamyl tRNA synthetase complex(GO:0017102) |
| 0.1 | 0.4 | GO:0035649 | Nrd1 complex(GO:0035649) |
| 0.1 | 0.6 | GO:0033597 | mitotic checkpoint complex(GO:0033597) |
| 0.1 | 1.0 | GO:0019774 | proteasome core complex, beta-subunit complex(GO:0019774) |
| 0.1 | 1.3 | GO:0005655 | nucleolar ribonuclease P complex(GO:0005655) multimeric ribonuclease P complex(GO:0030681) |
| 0.1 | 1.1 | GO:0051233 | spindle midzone(GO:0051233) |
| 0.1 | 1.1 | GO:0005720 | nuclear heterochromatin(GO:0005720) nuclear telomeric heterochromatin(GO:0005724) telomeric heterochromatin(GO:0031933) |
| 0.1 | 0.6 | GO:0044697 | HICS complex(GO:0044697) |
| 0.1 | 0.6 | GO:0031428 | box C/D snoRNP complex(GO:0031428) |
| 0.1 | 1.0 | GO:0044615 | nuclear pore nuclear basket(GO:0044615) |
| 0.1 | 0.4 | GO:0030869 | RENT complex(GO:0030869) |
| 0.1 | 0.9 | GO:0005852 | eukaryotic translation initiation factor 3 complex(GO:0005852) |
| 0.1 | 0.4 | GO:0030428 | cell septum(GO:0030428) |
| 0.1 | 0.7 | GO:0034388 | Pwp2p-containing subcomplex of 90S preribosome(GO:0034388) |
| 0.1 | 0.5 | GO:0016587 | Isw1 complex(GO:0016587) |
| 0.1 | 0.9 | GO:0030008 | TRAPP complex(GO:0030008) |
| 0.1 | 0.4 | GO:0034448 | EGO complex(GO:0034448) |
| 0.1 | 0.3 | GO:0097042 | extrinsic component of fungal-type vacuolar membrane(GO:0097042) |
| 0.1 | 0.5 | GO:0000159 | protein phosphatase type 2A complex(GO:0000159) |
| 0.1 | 0.2 | GO:0005771 | multivesicular body(GO:0005771) |
| 0.1 | 0.3 | GO:0044611 | nuclear pore inner ring(GO:0044611) |
| 0.1 | 0.1 | GO:0032155 | actomyosin contractile ring(GO:0005826) cell division site(GO:0032153) cell division site part(GO:0032155) contractile ring(GO:0070938) |
| 0.1 | 0.4 | GO:0032160 | septin filament array(GO:0032160) |
| 0.1 | 5.3 | GO:0022627 | cytosolic small ribosomal subunit(GO:0022627) |
| 0.1 | 0.4 | GO:0005641 | nuclear envelope lumen(GO:0005641) |
| 0.1 | 0.8 | GO:0005791 | rough endoplasmic reticulum(GO:0005791) rough endoplasmic reticulum membrane(GO:0030867) |
| 0.1 | 0.3 | GO:0005952 | cAMP-dependent protein kinase complex(GO:0005952) |
| 0.1 | 0.3 | GO:0000811 | GINS complex(GO:0000811) |
| 0.1 | 1.2 | GO:0046695 | SLIK (SAGA-like) complex(GO:0046695) |
| 0.1 | 2.6 | GO:0030686 | 90S preribosome(GO:0030686) |
| 0.1 | 1.2 | GO:0016586 | RSC complex(GO:0016586) |
| 0.1 | 0.4 | GO:0019773 | proteasome core complex, alpha-subunit complex(GO:0019773) |
| 0.1 | 0.3 | GO:0043527 | tRNA methyltransferase complex(GO:0043527) |
| 0.1 | 0.8 | GO:0005736 | DNA-directed RNA polymerase I complex(GO:0005736) |
| 0.1 | 0.4 | GO:0016459 | myosin complex(GO:0016459) |
| 0.1 | 0.3 | GO:0030132 | clathrin coat of coated pit(GO:0030132) |
| 0.1 | 0.4 | GO:0090544 | SWI/SNF complex(GO:0016514) BAF-type complex(GO:0090544) |
| 0.0 | 0.3 | GO:0042555 | MCM complex(GO:0042555) |
| 0.0 | 0.3 | GO:0070772 | PAS complex(GO:0070772) |
| 0.0 | 0.2 | GO:0005688 | U6 snRNP(GO:0005688) |
| 0.0 | 1.8 | GO:0005811 | lipid particle(GO:0005811) |
| 0.0 | 0.2 | GO:0000815 | ESCRT III complex(GO:0000815) |
| 0.0 | 8.4 | GO:0005933 | cellular bud(GO:0005933) |
| 0.0 | 0.3 | GO:0000798 | nuclear cohesin complex(GO:0000798) cohesin complex(GO:0008278) |
| 0.0 | 0.1 | GO:0000113 | nucleotide-excision repair factor 4 complex(GO:0000113) |
| 0.0 | 0.7 | GO:0031902 | late endosome membrane(GO:0031902) |
| 0.0 | 0.5 | GO:0022626 | cytosolic ribosome(GO:0022626) |
| 0.0 | 0.1 | GO:0097344 | Rix1 complex(GO:0097344) |
| 0.0 | 0.1 | GO:0005828 | polar microtubule(GO:0005827) kinetochore microtubule(GO:0005828) tubulin complex(GO:0045298) |
| 0.0 | 0.4 | GO:0000151 | ubiquitin ligase complex(GO:0000151) |
| 0.0 | 0.2 | GO:0008622 | epsilon DNA polymerase complex(GO:0008622) |
| 0.0 | 0.1 | GO:0000137 | Golgi cis cisterna(GO:0000137) |
| 0.0 | 0.4 | GO:0005686 | U2 snRNP(GO:0005686) |
| 0.0 | 0.4 | GO:0071782 | cortical endoplasmic reticulum(GO:0032541) endoplasmic reticulum tubular network(GO:0071782) endoplasmic reticulum subcompartment(GO:0098827) |
| 0.0 | 1.1 | GO:0030134 | ER to Golgi transport vesicle(GO:0030134) |
| 0.0 | 0.5 | GO:0005788 | endoplasmic reticulum lumen(GO:0005788) |
| 0.0 | 0.2 | GO:0072686 | mitotic spindle(GO:0072686) |
| 0.0 | 1.1 | GO:0035770 | ribonucleoprotein granule(GO:0035770) cytoplasmic ribonucleoprotein granule(GO:0036464) |
| 0.0 | 0.2 | GO:0000346 | transcription export complex(GO:0000346) |
| 0.0 | 0.1 | GO:0044426 | cell wall part(GO:0044426) external encapsulating structure part(GO:0044462) |
| 0.0 | 1.2 | GO:0030479 | actin cortical patch(GO:0030479) endocytic patch(GO:0061645) |
| 0.0 | 0.1 | GO:0070985 | TFIIK complex(GO:0070985) |
| 0.0 | 0.2 | GO:0030173 | integral component of Golgi membrane(GO:0030173) intrinsic component of Golgi membrane(GO:0031228) |
| 0.0 | 1.0 | GO:0030687 | preribosome, large subunit precursor(GO:0030687) |
| 0.0 | 0.3 | GO:0005881 | cytoplasmic microtubule(GO:0005881) |
| 0.0 | 0.1 | GO:0005665 | DNA-directed RNA polymerase II, core complex(GO:0005665) |
| 0.0 | 0.1 | GO:0005876 | spindle microtubule(GO:0005876) |
| 0.0 | 0.4 | GO:0031314 | extrinsic component of mitochondrial inner membrane(GO:0031314) |
| 0.0 | 0.3 | GO:0019005 | SCF ubiquitin ligase complex(GO:0019005) |
| 0.0 | 0.1 | GO:0030896 | checkpoint clamp complex(GO:0030896) |
| 0.0 | 0.1 | GO:0017059 | serine C-palmitoyltransferase complex(GO:0017059) SPOTS complex(GO:0035339) |
| 0.0 | 0.3 | GO:0005682 | U5 snRNP(GO:0005682) |
| 0.0 | 0.1 | GO:0005834 | heterotrimeric G-protein complex(GO:0005834) |
| 0.0 | 0.3 | GO:0000786 | nucleosome(GO:0000786) |
| 0.0 | 0.2 | GO:0034399 | nuclear periphery(GO:0034399) |
| 0.0 | 0.1 | GO:0042765 | GPI-anchor transamidase complex(GO:0042765) |
| 0.0 | 0.1 | GO:0031390 | Ctf18 RFC-like complex(GO:0031390) |
| 0.0 | 0.1 | GO:1990904 | intracellular ribonucleoprotein complex(GO:0030529) ribonucleoprotein complex(GO:1990904) |
| 0.0 | 0.1 | GO:0042575 | DNA polymerase complex(GO:0042575) |
| 0.0 | 0.4 | GO:0005844 | polysome(GO:0005844) |
| 0.0 | 0.1 | GO:0030130 | AP-1 adaptor complex(GO:0030121) clathrin coat of trans-Golgi network vesicle(GO:0030130) |
| 0.0 | 0.1 | GO:0030907 | MBF transcription complex(GO:0030907) |
| 0.0 | 0.1 | GO:0005967 | mitochondrial pyruvate dehydrogenase complex(GO:0005967) pyruvate dehydrogenase complex(GO:0045254) |
| 0.0 | 0.1 | GO:0000177 | cytoplasmic exosome (RNase complex)(GO:0000177) |
| 0.0 | 0.3 | GO:0005802 | trans-Golgi network(GO:0005802) |
| 0.0 | 0.1 | GO:0000131 | incipient cellular bud site(GO:0000131) |
| 0.0 | 1.8 | GO:0005840 | ribosome(GO:0005840) |
| 0.0 | 0.1 | GO:0031499 | TRAMP complex(GO:0031499) |
| 0.0 | 0.2 | GO:0000152 | nuclear ubiquitin ligase complex(GO:0000152) anaphase-promoting complex(GO:0005680) |
| 0.0 | 0.1 | GO:0000783 | telomere cap complex(GO:0000782) nuclear telomere cap complex(GO:0000783) |
| 0.0 | 0.1 | GO:0005801 | cis-Golgi network(GO:0005801) |
| 0.0 | 0.1 | GO:0005669 | transcription factor TFIID complex(GO:0005669) |
| 0.0 | 0.1 | GO:0005658 | alpha DNA polymerase:primase complex(GO:0005658) |
| 0.0 | 16.1 | GO:0005634 | nucleus(GO:0005634) |
| 0.0 | 0.1 | GO:0005742 | mitochondrial outer membrane translocase complex(GO:0005742) |
| 0.0 | 0.1 | GO:0000221 | vacuolar proton-transporting V-type ATPase, V1 domain(GO:0000221) proton-transporting V-type ATPase, V1 domain(GO:0033180) |
Gene overrepresentation in molecular function category:
| Log-likelihood per target | Total log-likelihood | Term | Description |
|---|---|---|---|
| 1.4 | 5.6 | GO:0015146 | pentose transmembrane transporter activity(GO:0015146) |
| 1.1 | 3.3 | GO:0003938 | IMP dehydrogenase activity(GO:0003938) |
| 0.8 | 4.7 | GO:0004022 | alcohol dehydrogenase (NAD) activity(GO:0004022) |
| 0.7 | 3.0 | GO:0004523 | RNA-DNA hybrid ribonuclease activity(GO:0004523) |
| 0.5 | 3.2 | GO:0003906 | DNA-(apurinic or apyrimidinic site) lyase activity(GO:0003906) |
| 0.5 | 2.1 | GO:0016634 | oxidoreductase activity, acting on the CH-CH group of donors, oxygen as acceptor(GO:0016634) |
| 0.5 | 1.5 | GO:0070568 | guanylyltransferase activity(GO:0070568) |
| 0.5 | 1.5 | GO:0004805 | trehalose-phosphatase activity(GO:0004805) |
| 0.5 | 2.4 | GO:0008536 | Ran GTPase binding(GO:0008536) |
| 0.5 | 2.8 | GO:0016846 | carbon-sulfur lyase activity(GO:0016846) |
| 0.5 | 2.3 | GO:0050072 | m7G(5')pppN diphosphatase activity(GO:0050072) |
| 0.4 | 1.3 | GO:0015088 | copper uptake transmembrane transporter activity(GO:0015088) |
| 0.4 | 1.5 | GO:0001046 | core promoter sequence-specific DNA binding(GO:0001046) |
| 0.3 | 1.6 | GO:0032451 | demethylase activity(GO:0032451) |
| 0.3 | 3.1 | GO:0003777 | microtubule motor activity(GO:0003777) |
| 0.3 | 1.2 | GO:0019206 | nucleoside kinase activity(GO:0019206) |
| 0.3 | 4.1 | GO:0001078 | transcriptional repressor activity, RNA polymerase II core promoter proximal region sequence-specific binding(GO:0001078) |
| 0.3 | 0.9 | GO:0016504 | peptidase activator activity(GO:0016504) |
| 0.3 | 1.4 | GO:0008526 | phosphatidylcholine transporter activity(GO:0008525) phosphatidylinositol transporter activity(GO:0008526) |
| 0.3 | 0.8 | GO:0000339 | RNA cap binding(GO:0000339) |
| 0.3 | 1.3 | GO:0004707 | MAP kinase activity(GO:0004707) |
| 0.2 | 0.7 | GO:0016838 | carbon-oxygen lyase activity, acting on phosphates(GO:0016838) |
| 0.2 | 0.7 | GO:0051010 | microtubule plus-end binding(GO:0051010) |
| 0.2 | 0.7 | GO:0005262 | calcium channel activity(GO:0005262) |
| 0.2 | 0.9 | GO:0008157 | protein phosphatase 1 binding(GO:0008157) |
| 0.2 | 0.7 | GO:0008271 | secondary active sulfate transmembrane transporter activity(GO:0008271) sulfate transmembrane transporter activity(GO:0015116) |
| 0.2 | 0.7 | GO:0031957 | very long-chain fatty acid-CoA ligase activity(GO:0031957) |
| 0.2 | 0.6 | GO:0015114 | phosphate ion transmembrane transporter activity(GO:0015114) |
| 0.2 | 1.2 | GO:0016702 | oxidoreductase activity, acting on single donors with incorporation of molecular oxygen(GO:0016701) oxidoreductase activity, acting on single donors with incorporation of molecular oxygen, incorporation of two atoms of oxygen(GO:0016702) |
| 0.2 | 0.6 | GO:0008097 | 5S rRNA binding(GO:0008097) |
| 0.2 | 0.7 | GO:0051377 | mannose-ethanolamine phosphotransferase activity(GO:0051377) |
| 0.2 | 0.5 | GO:0004100 | chitin synthase activity(GO:0004100) |
| 0.2 | 0.7 | GO:0016863 | intramolecular oxidoreductase activity, transposing C=C bonds(GO:0016863) |
| 0.2 | 1.7 | GO:0031490 | chromatin DNA binding(GO:0031490) |
| 0.2 | 0.9 | GO:0001133 | RNA polymerase II transcription factor activity, sequence-specific transcription regulatory region DNA binding(GO:0001133) |
| 0.2 | 1.4 | GO:0004596 | peptide alpha-N-acetyltransferase activity(GO:0004596) |
| 0.1 | 0.4 | GO:0019003 | GDP binding(GO:0019003) |
| 0.1 | 1.6 | GO:0005199 | structural constituent of cell wall(GO:0005199) |
| 0.1 | 1.2 | GO:0000009 | alpha-1,6-mannosyltransferase activity(GO:0000009) |
| 0.1 | 2.6 | GO:0030515 | snoRNA binding(GO:0030515) |
| 0.1 | 1.3 | GO:0000171 | ribonuclease MRP activity(GO:0000171) |
| 0.1 | 0.4 | GO:0032296 | ribonuclease III activity(GO:0004525) double-stranded RNA-specific ribonuclease activity(GO:0032296) |
| 0.1 | 0.5 | GO:0017057 | 6-phosphogluconolactonase activity(GO:0017057) |
| 0.1 | 0.7 | GO:0070300 | phosphatidic acid binding(GO:0070300) |
| 0.1 | 0.6 | GO:0000774 | adenyl-nucleotide exchange factor activity(GO:0000774) |
| 0.1 | 0.1 | GO:0051213 | dioxygenase activity(GO:0051213) |
| 0.1 | 1.0 | GO:0017112 | Rab guanyl-nucleotide exchange factor activity(GO:0017112) |
| 0.1 | 0.9 | GO:0031072 | heat shock protein binding(GO:0031072) |
| 0.1 | 0.3 | GO:0015166 | polyol transmembrane transporter activity(GO:0015166) |
| 0.1 | 1.6 | GO:0042803 | protein homodimerization activity(GO:0042803) |
| 0.1 | 1.3 | GO:0070491 | repressing transcription factor binding(GO:0070491) |
| 0.1 | 0.3 | GO:0016882 | cyclo-ligase activity(GO:0016882) |
| 0.1 | 0.4 | GO:0034450 | ubiquitin-ubiquitin ligase activity(GO:0034450) |
| 0.1 | 1.4 | GO:0003746 | translation elongation factor activity(GO:0003746) |
| 0.1 | 0.4 | GO:0003705 | transcription factor activity, RNA polymerase II distal enhancer sequence-specific binding(GO:0003705) |
| 0.1 | 1.1 | GO:0030295 | protein kinase activator activity(GO:0030295) |
| 0.1 | 0.3 | GO:0004691 | cyclic nucleotide-dependent protein kinase activity(GO:0004690) cAMP-dependent protein kinase activity(GO:0004691) |
| 0.1 | 0.6 | GO:0016408 | C-acyltransferase activity(GO:0016408) |
| 0.1 | 1.1 | GO:0019904 | protein domain specific binding(GO:0019904) |
| 0.1 | 18.7 | GO:0003735 | structural constituent of ribosome(GO:0003735) |
| 0.1 | 1.1 | GO:0005516 | calmodulin binding(GO:0005516) |
| 0.1 | 0.4 | GO:0005034 | osmosensor activity(GO:0005034) |
| 0.1 | 5.6 | GO:0003924 | GTPase activity(GO:0003924) |
| 0.1 | 0.7 | GO:0080025 | phosphatidylinositol-3,5-bisphosphate binding(GO:0080025) |
| 0.1 | 0.3 | GO:0016841 | ammonia-lyase activity(GO:0016841) |
| 0.1 | 0.6 | GO:0016423 | tRNA (guanine) methyltransferase activity(GO:0016423) |
| 0.1 | 2.6 | GO:0016875 | aminoacyl-tRNA ligase activity(GO:0004812) ligase activity, forming carbon-oxygen bonds(GO:0016875) ligase activity, forming aminoacyl-tRNA and related compounds(GO:0016876) |
| 0.1 | 0.9 | GO:0015616 | DNA translocase activity(GO:0015616) |
| 0.1 | 0.4 | GO:0008138 | protein tyrosine/serine/threonine phosphatase activity(GO:0008138) |
| 0.1 | 0.2 | GO:0010521 | telomerase inhibitor activity(GO:0010521) |
| 0.1 | 0.9 | GO:0015035 | protein disulfide oxidoreductase activity(GO:0015035) |
| 0.1 | 0.1 | GO:0042134 | rRNA primary transcript binding(GO:0042134) |
| 0.1 | 1.7 | GO:0004722 | protein serine/threonine phosphatase activity(GO:0004722) |
| 0.1 | 1.8 | GO:0004004 | ATP-dependent RNA helicase activity(GO:0004004) |
| 0.1 | 0.6 | GO:0019239 | deaminase activity(GO:0019239) |
| 0.1 | 2.1 | GO:0042393 | histone binding(GO:0042393) |
| 0.1 | 0.2 | GO:0035673 | oligopeptide transmembrane transporter activity(GO:0035673) |
| 0.1 | 0.2 | GO:0003841 | 1-acylglycerol-3-phosphate O-acyltransferase activity(GO:0003841) |
| 0.1 | 0.5 | GO:1901681 | sulfur compound binding(GO:1901681) |
| 0.1 | 0.2 | GO:0008252 | nucleotidase activity(GO:0008252) |
| 0.1 | 1.1 | GO:0019001 | GTP binding(GO:0005525) guanyl nucleotide binding(GO:0019001) guanyl ribonucleotide binding(GO:0032561) |
| 0.1 | 0.2 | GO:0000297 | spermine transmembrane transporter activity(GO:0000297) |
| 0.1 | 1.2 | GO:0004003 | ATP-dependent DNA helicase activity(GO:0004003) |
| 0.1 | 0.2 | GO:0015230 | FAD transmembrane transporter activity(GO:0015230) |
| 0.1 | 0.8 | GO:0001054 | RNA polymerase I activity(GO:0001054) |
| 0.1 | 0.2 | GO:0009922 | fatty acid elongase activity(GO:0009922) |
| 0.1 | 0.1 | GO:0003725 | double-stranded RNA binding(GO:0003725) |
| 0.1 | 1.4 | GO:0003743 | translation initiation factor activity(GO:0003743) |
| 0.0 | 0.4 | GO:0003727 | single-stranded RNA binding(GO:0003727) |
| 0.0 | 0.1 | GO:0019202 | amino acid kinase activity(GO:0019202) |
| 0.0 | 0.3 | GO:0030145 | manganese ion binding(GO:0030145) |
| 0.0 | 1.1 | GO:0017056 | structural constituent of nuclear pore(GO:0017056) |
| 0.0 | 0.7 | GO:0090484 | drug transporter activity(GO:0090484) |
| 0.0 | 1.2 | GO:0015631 | tubulin binding(GO:0015631) |
| 0.0 | 0.1 | GO:0015037 | peptide disulfide oxidoreductase activity(GO:0015037) glutathione disulfide oxidoreductase activity(GO:0015038) |
| 0.0 | 0.5 | GO:0004298 | threonine-type endopeptidase activity(GO:0004298) threonine-type peptidase activity(GO:0070003) |
| 0.0 | 0.2 | GO:0005086 | ARF guanyl-nucleotide exchange factor activity(GO:0005086) |
| 0.0 | 0.1 | GO:0000146 | microfilament motor activity(GO:0000146) |
| 0.0 | 1.3 | GO:0016765 | transferase activity, transferring alkyl or aryl (other than methyl) groups(GO:0016765) |
| 0.0 | 0.5 | GO:0031491 | nucleosome binding(GO:0031491) |
| 0.0 | 0.2 | GO:0019201 | nucleotide kinase activity(GO:0019201) |
| 0.0 | 0.2 | GO:0000033 | alpha-1,3-mannosyltransferase activity(GO:0000033) |
| 0.0 | 0.2 | GO:0030943 | mitochondrion targeting sequence binding(GO:0030943) |
| 0.0 | 0.1 | GO:0051183 | vitamin transporter activity(GO:0051183) |
| 0.0 | 0.6 | GO:0008170 | N-methyltransferase activity(GO:0008170) |
| 0.0 | 0.1 | GO:0004032 | alditol:NADP+ 1-oxidoreductase activity(GO:0004032) |
| 0.0 | 0.1 | GO:0015248 | sterol transporter activity(GO:0015248) |
| 0.0 | 0.1 | GO:0017022 | myosin binding(GO:0017022) |
| 0.0 | 2.4 | GO:0005543 | phospholipid binding(GO:0005543) |
| 0.0 | 0.3 | GO:0003678 | DNA helicase activity(GO:0003678) |
| 0.0 | 0.1 | GO:0001055 | RNA polymerase II activity(GO:0001055) |
| 0.0 | 1.1 | GO:0003779 | actin binding(GO:0003779) |
| 0.0 | 0.3 | GO:0008649 | rRNA methyltransferase activity(GO:0008649) |
| 0.0 | 0.1 | GO:0008172 | S-methyltransferase activity(GO:0008172) |
| 0.0 | 0.3 | GO:0004860 | protein kinase inhibitor activity(GO:0004860) |
| 0.0 | 0.3 | GO:0043495 | protein anchor(GO:0043495) |
| 0.0 | 0.2 | GO:0001671 | ATPase activator activity(GO:0001671) ATPase regulator activity(GO:0060590) |
| 0.0 | 1.4 | GO:0003682 | chromatin binding(GO:0003682) |
| 0.0 | 0.2 | GO:0019237 | centromeric DNA binding(GO:0019237) |
| 0.0 | 0.3 | GO:0003714 | transcription corepressor activity(GO:0003714) |
| 0.0 | 0.2 | GO:0004529 | exodeoxyribonuclease activity(GO:0004529) |
| 0.0 | 0.2 | GO:0016861 | intramolecular oxidoreductase activity, interconverting aldoses and ketoses(GO:0016861) |
| 0.0 | 0.4 | GO:0051087 | chaperone binding(GO:0051087) |
| 0.0 | 0.1 | GO:0003993 | acid phosphatase activity(GO:0003993) |
| 0.0 | 1.5 | GO:0005198 | structural molecule activity(GO:0005198) |
| 0.0 | 0.1 | GO:0050839 | cell adhesion molecule binding(GO:0050839) |
| 0.0 | 0.6 | GO:0030674 | protein binding, bridging(GO:0030674) |
| 0.0 | 0.1 | GO:0015174 | basic amino acid transmembrane transporter activity(GO:0015174) |
| 0.0 | 0.2 | GO:0008175 | tRNA methyltransferase activity(GO:0008175) |
| 0.0 | 0.1 | GO:0030060 | L-malate dehydrogenase activity(GO:0030060) |
| 0.0 | 0.1 | GO:0004614 | phosphoglucomutase activity(GO:0004614) |
| 0.0 | 0.1 | GO:0042736 | NAD+ kinase activity(GO:0003951) NADH kinase activity(GO:0042736) |
| 0.0 | 0.1 | GO:0004652 | polynucleotide adenylyltransferase activity(GO:0004652) |
| 0.0 | 0.1 | GO:0019211 | phosphatase activator activity(GO:0019211) |
| 0.0 | 0.1 | GO:0003923 | GPI-anchor transamidase activity(GO:0003923) |
| 0.0 | 0.1 | GO:0008443 | phosphofructokinase activity(GO:0008443) |
| 0.0 | 0.3 | GO:0008289 | lipid binding(GO:0008289) |
| 0.0 | 0.1 | GO:0001139 | transcription factor activity, core RNA polymerase II recruiting(GO:0001139) |
| 0.0 | 0.2 | GO:0008408 | 3'-5' exonuclease activity(GO:0008408) |
| 0.0 | 0.2 | GO:0042162 | telomeric DNA binding(GO:0042162) |
| 0.0 | 0.2 | GO:0004177 | aminopeptidase activity(GO:0004177) |
| 0.0 | 0.1 | GO:0030276 | clathrin binding(GO:0030276) |
| 0.0 | 0.3 | GO:0003684 | damaged DNA binding(GO:0003684) |
| 0.0 | 0.2 | GO:0016763 | transferase activity, transferring pentosyl groups(GO:0016763) |
| 0.0 | 0.3 | GO:0043130 | ubiquitin binding(GO:0043130) |
| 0.0 | 0.2 | GO:0051539 | 4 iron, 4 sulfur cluster binding(GO:0051539) |
| 0.0 | 0.1 | GO:0004497 | monooxygenase activity(GO:0004497) |
| 0.0 | 0.1 | GO:0080130 | L-phenylalanine aminotransferase activity(GO:0070546) L-phenylalanine:2-oxoglutarate aminotransferase activity(GO:0080130) |
| 0.0 | 0.2 | GO:0004222 | metalloendopeptidase activity(GO:0004222) |
| 0.0 | 0.1 | GO:0016646 | oxidoreductase activity, acting on the CH-NH group of donors, NAD or NADP as acceptor(GO:0016646) |
| 0.0 | 0.1 | GO:0015266 | protein channel activity(GO:0015266) |
| 0.0 | 0.1 | GO:0043021 | ribonucleoprotein complex binding(GO:0043021) |
| 0.0 | 0.1 | GO:0003887 | DNA-directed DNA polymerase activity(GO:0003887) DNA polymerase activity(GO:0034061) |
| 0.0 | 0.1 | GO:0019238 | cyclohydrolase activity(GO:0019238) |
Gene overrepresentation in curated gene sets: canonical pathways category:
| Log-likelihood per target | Total log-likelihood | Term | Description |
|---|---|---|---|
| 0.1 | 0.6 | PID P73PATHWAY | p73 transcription factor network |
| 0.1 | 0.1 | PID PDGFRB PATHWAY | PDGFR-beta signaling pathway |
| 0.1 | 0.3 | PID E2F PATHWAY | E2F transcription factor network |
| 0.1 | 0.2 | PID SHP2 PATHWAY | SHP2 signaling |
| 0.0 | 0.1 | PID MYC PATHWAY | C-MYC pathway |
| 0.0 | 0.0 | PID ERBB1 RECEPTOR PROXIMAL PATHWAY | EGF receptor (ErbB1) signaling pathway |
| 0.0 | 0.1 | PID HIF1 TFPATHWAY | HIF-1-alpha transcription factor network |
| 0.0 | 0.1 | PID ERA GENOMIC PATHWAY | Validated nuclear estrogen receptor alpha network |
| 0.0 | 0.1 | NABA CORE MATRISOME | Ensemble of genes encoding core extracellular matrix including ECM glycoproteins, collagens and proteoglycans |
Gene overrepresentation in curated gene sets: REACTOME pathways category:
| Log-likelihood per target | Total log-likelihood | Term | Description |
|---|---|---|---|
| 0.5 | 3.9 | REACTOME ACTIVATION OF THE MRNA UPON BINDING OF THE CAP BINDING COMPLEX AND EIFS AND SUBSEQUENT BINDING TO 43S | Genes involved in Activation of the mRNA upon binding of the cap-binding complex and eIFs, and subsequent binding to 43S |
| 0.4 | 0.7 | REACTOME REGULATION OF MRNA STABILITY BY PROTEINS THAT BIND AU RICH ELEMENTS | Genes involved in Regulation of mRNA Stability by Proteins that Bind AU-rich Elements |
| 0.4 | 1.4 | REACTOME GLYCEROPHOSPHOLIPID BIOSYNTHESIS | Genes involved in Glycerophospholipid biosynthesis |
| 0.2 | 0.6 | REACTOME SULFUR AMINO ACID METABOLISM | Genes involved in Sulfur amino acid metabolism |
| 0.2 | 3.3 | REACTOME INFLUENZA VIRAL RNA TRANSCRIPTION AND REPLICATION | Genes involved in Influenza Viral RNA Transcription and Replication |
| 0.1 | 0.4 | REACTOME CITRIC ACID CYCLE TCA CYCLE | Genes involved in Citric acid cycle (TCA cycle) |
| 0.1 | 0.6 | REACTOME INHIBITION OF THE PROTEOLYTIC ACTIVITY OF APC C REQUIRED FOR THE ONSET OF ANAPHASE BY MITOTIC SPINDLE CHECKPOINT COMPONENTS | Genes involved in Inhibition of the proteolytic activity of APC/C required for the onset of anaphase by mitotic spindle checkpoint components |
| 0.1 | 0.3 | REACTOME GLYCOLYSIS | Genes involved in Glycolysis |
| 0.1 | 0.2 | REACTOME DOWNSTREAM SIGNALING OF ACTIVATED FGFR | Genes involved in Downstream signaling of activated FGFR |
| 0.0 | 0.3 | REACTOME UNWINDING OF DNA | Genes involved in Unwinding of DNA |
| 0.0 | 0.1 | REACTOME G1 S SPECIFIC TRANSCRIPTION | Genes involved in G1/S-Specific Transcription |
| 0.0 | 0.1 | REACTOME PLATELET ACTIVATION SIGNALING AND AGGREGATION | Genes involved in Platelet activation, signaling and aggregation |
| 0.0 | 0.2 | REACTOME RNA POL II PRE TRANSCRIPTION EVENTS | Genes involved in RNA Polymerase II Pre-transcription Events |
| 0.0 | 0.1 | REACTOME MITOCHONDRIAL PROTEIN IMPORT | Genes involved in Mitochondrial Protein Import |
| 0.0 | 0.1 | REACTOME HIV LIFE CYCLE | Genes involved in HIV Life Cycle |
| 0.0 | 0.1 | REACTOME ASSOCIATION OF TRIC CCT WITH TARGET PROTEINS DURING BIOSYNTHESIS | Genes involved in Association of TriC/CCT with target proteins during biosynthesis |
| 0.0 | 0.1 | REACTOME GPCR LIGAND BINDING | Genes involved in GPCR ligand binding |