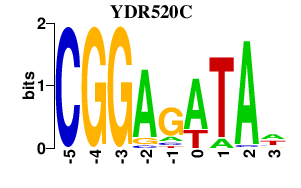
Results for YDR520C
Z-value: 1.30
Motif logo
Transcription factors associated with YDR520C
| Gene Symbol | Gene ID | Gene Info |
|---|---|---|
|
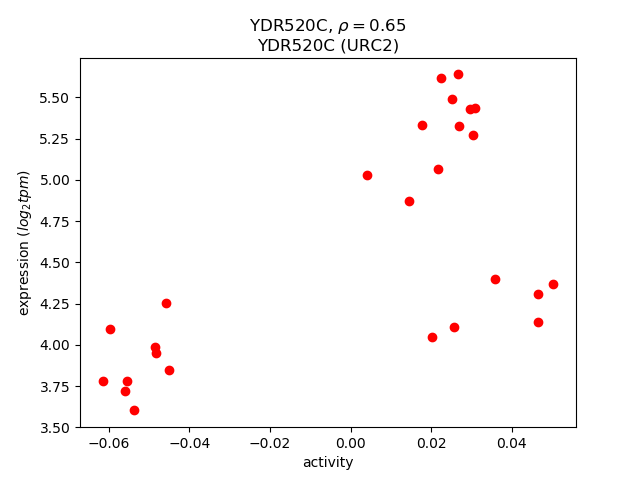
URC2
|
S000002928 | Putative Zn(II)2Cys6 motif containing transcription factor |
Activity-expression correlation:
Activity profile of YDR520C motif
Sorted Z-values of YDR520C motif
| Promoter | Log-likelihood | Transcript | Gene | Gene Info |
|---|---|---|---|---|
| YJR095W | 18.19 |
SFC1
|
Mitochondrial succinate-fumarate transporter, transports succinate into and fumarate out of the mitochondrion; required for ethanol and acetate utilization |
|
| YPL171C | 13.61 |
OYE3
|
Widely conserved NADPH oxidoreductase containing flavin mononucleotide (FMN), homologous to Oye2p with slight differences in ligand binding and catalytic properties; may be involved in sterol metabolism |
|
| YNR034W-A | 12.17 |
Putative protein of unknown function; expression is regulated by Msn2p/Msn4p |
||
| YIL057C | 11.95 |
Putative protein of unknown function; expression induced under carbon limitation and repressed under high glucose |
||
| YLR174W | 10.90 |
IDP2
|
Cytosolic NADP-specific isocitrate dehydrogenase, catalyzes oxidation of isocitrate to alpha-ketoglutarate; levels are elevated during growth on non-fermentable carbon sources and reduced during growth on glucose |
|
| YAR053W | 9.91 |
Dubious open reading frame unlikely to encode a protein, based on available experimental and comparative sequence data |
||
| YFL030W | 9.81 |
AGX1
|
Alanine:glyoxylate aminotransferase (AGT), catalyzes the synthesis of glycine from glyoxylate, which is one of three pathways for glycine biosynthesis in yeast; has similarity to mammalian and plant alanine:glyoxylate aminotransferases |
|
| YDL244W | 9.33 |
THI13
|
Protein involved in synthesis of the thiamine precursor hydroxymethylpyrimidine (HMP); member of a subtelomeric gene family including THI5, THI11, THI12, and THI13 |
|
| YKR009C | 9.22 |
FOX2
|
Multifunctional enzyme of the peroxisomal fatty acid beta-oxidation pathway; has 3-hydroxyacyl-CoA dehydrogenase and enoyl-CoA hydratase activities |
|
| YJL045W | 8.93 |
Minor succinate dehydrogenase isozyme; homologous to Sdh1p, the major isozyme reponsible for the oxidation of succinate and transfer of electrons to ubiquinone; induced during the diauxic shift in a Cat8p-dependent manner |
||
| YLR377C | 8.91 |
FBP1
|
Fructose-1,6-bisphosphatase, key regulatory enzyme in the gluconeogenesis pathway, required for glucose metabolism |
|
| YML042W | 8.45 |
CAT2
|
Carnitine acetyl-CoA transferase present in both mitochondria and peroxisomes, transfers activated acetyl groups to carnitine to form acetylcarnitine which can be shuttled across membranes |
|
| YOR348C | 8.30 |
PUT4
|
Proline permease, required for high-affinity transport of proline; also transports the toxic proline analog azetidine-2-carboxylate (AzC); PUT4 transcription is repressed in ammonia-grown cells |
|
| YDR277C | 8.01 |
MTH1
|
Negative regulator of the glucose-sensing signal transduction pathway, required for repression of transcription by Rgt1p; interacts with Rgt1p and the Snf3p and Rgt2p glucose sensors; phosphorylated by Yck1p, triggering Mth1p degradation |
|
| YFR053C | 7.96 |
HXK1
|
Hexokinase isoenzyme 1, a cytosolic protein that catalyzes phosphorylation of glucose during glucose metabolism; expression is highest during growth on non-glucose carbon sources; glucose-induced repression involves the hexokinase Hxk2p |
|
| YNR002C | 7.93 |
ATO2
|
Putative transmembrane protein involved in export of ammonia, a starvation signal that promotes cell death in aging colonies; phosphorylated in mitochondria; member of the TC 9.B.33 YaaH family; homolog of Ady2p and Y. lipolytica Gpr1p |
|
| YNL117W | 7.89 |
MLS1
|
Malate synthase, enzyme of the glyoxylate cycle, involved in utilization of non-fermentable carbon sources; expression is subject to carbon catabolite repression; localizes in peroxisomes during growth in oleic acid medium |
|
| YAL039C | 7.84 |
CYC3
|
Cytochrome c heme lyase (holocytochrome c synthase), attaches heme to apo-cytochrome c (Cyc1p or Cyc7p) in the mitochondrial intermembrane space; human ortholog may have a role in microphthalmia with linear skin defects (MLS) |
|
| YAR060C | 7.37 |
Dubious open reading frame unlikely to encode a protein, based on available experimental and comparative sequence data |
||
| YJL220W | 6.95 |
Dubious open reading frame unlikely to encode a protein, based on available experimental and comparative sequence data; partially overlaps the verified gene YJL221C/FSP2 |
||
| YJL116C | 6.67 |
NCA3
|
Protein that functions with Nca2p to regulate mitochondrial expression of subunits 6 (Atp6p) and 8 (Atp8p ) of the Fo-F1 ATP synthase; member of the SUN family |
|
| YNL274C | 6.62 |
GOR1
|
Glyoxylate reductase; null mutation results in increased biomass after diauxic shift; the authentic, non-tagged protein is detected in highly purified mitochondria in high-throughput studies |
|
| YHR096C | 6.59 |
HXT5
|
Hexose transporter with moderate affinity for glucose, induced in the presence of non-fermentable carbon sources, induced by a decrease in growth rate, contains an extended N-terminal domain relative to other HXTs |
|
| YOR065W | 6.28 |
CYT1
|
Cytochrome c1, component of the mitochondrial respiratory chain; expression is regulated by the heme-activated, glucose-repressed Hap2p/3p/4p/5p CCAAT-binding complex |
|
| YHR211W | 6.08 |
FLO5
|
Lectin-like cell wall protein (flocculin) involved in flocculation, binds to mannose chains on the surface of other cells, confers floc-forming ability that is chymotrypsin resistant but heat labile; similar to Flo1p |
|
| YJL221C | 6.03 |
FSP2
|
Protein of unknown function, expression is induced during nitrogen limitation |
|
| YJL219W | 5.96 |
HXT9
|
Putative hexose transporter that is nearly identical to Hxt11p, has similarity to major facilitator superfamily (MFS) transporters, expression of HXT9 is regulated by transcription factors Pdr1p and Pdr3p |
|
| YML089C | 5.95 |
Dubious open reading frame unlikely to encode a functional protein, based on available experimental and comparative sequence data; expression induced by calcium shortage |
||
| YOR343C | 5.80 |
Dubious open reading frame, unlikely to encode a functional protein; based on available experimental and comparative sequence data |
||
| YOR139C | 5.78 |
Hypothetical protein |
||
| YFL054C | 5.72 |
Putative channel-like protein; similar to Fps1p; mediates passive diffusion of glycerol in the presence of ethanol |
||
| YMR206W | 5.61 |
Putative protein of unknown function; YMR206W is not an essential gene |
||
| YOR140W | 5.57 |
SFL1
|
Transcriptional repressor and activator; involved in repression of flocculation-related genes, and activation of stress responsive genes; negatively regulated by cAMP-dependent protein kinase A subunit Tpk2p |
|
| YGR243W | 5.48 |
FMP43
|
Putative protein of unknown function; the authentic, non-tagged protein is detected in highly purified mitochondria in high-throughput studies |
|
| YHR212C | 5.41 |
Dubious open reading frame unlikely to encode a functional protein, based on available experimental and comparative sequence data |
||
| YCR007C | 5.30 |
Putative integral membrane protein, member of DUP240 gene family; YCR007C is not an essential gene |
||
| YPL135W | 5.09 |
ISU1
|
Conserved protein of the mitochondrial matrix, performs a scaffolding function during assembly of iron-sulfur clusters, interacts physically and functionally with yeast frataxin (Yfh1p); isu1 isu2 double mutant is inviable |
|
| YLR307C-A | 5.09 |
Putative protein of unknown function |
||
| YDR119W-A | 5.06 |
Putative protein of unknown function |
||
| YOL157C | 5.00 |
Putative protein of unknown function |
||
| YHR212W-A | 4.99 |
Putative protein of unknown function; identified by gene-trapping, microarray-based expression analysis, and genome-wide homology searching |
||
| YHR139C | 4.98 |
SPS100
|
Protein required for spore wall maturation; expressed during sporulation; may be a component of the spore wall |
|
| YHR048W | 4.97 |
YHK8
|
Presumed antiporter of the DHA1 family of multidrug resistance transporters; contains 12 predicted transmembrane spans; expression of gene is up-regulated in cells exhibiting reduced susceptibility to azoles |
|
| YOR382W | 4.83 |
FIT2
|
Mannoprotein that is incorporated into the cell wall via a glycosylphosphatidylinositol (GPI) anchor, involved in the retention of siderophore-iron in the cell wall |
|
| YKL109W | 4.77 |
HAP4
|
Subunit of the heme-activated, glucose-repressed Hap2p/3p/4p/5p CCAAT-binding complex, a transcriptional activator and global regulator of respiratory gene expression; provides the principal activation function of the complex |
|
| YEL028W | 4.76 |
Dubious open reading frame unlikely to encode a protein, based on available experimental and comparative sequence data |
||
| YJL127C-B | 4.72 |
Putative protein of unknown function; identified based on homology to the filamentous fungus, Ashbya gossypii |
||
| YDL245C | 4.68 |
HXT15
|
Protein of unknown function with similarity to hexose transporter family members, expression is induced by low levels of glucose and repressed by high levels of glucose |
|
| YIL077C | 4.65 |
Putative protein of unknown function; the authentic, non-tagged protein is detected in highly purified mitochondria in high-throughput studies; deletion confers sensitivity to 4-(N-(S-glutathionylacetyl)amino) phenylarsenoxide (GSAO) |
||
| YPL181W | 4.59 |
CTI6
|
Protein that relieves transcriptional repression by binding to the Cyc8p-Tup1p corepressor and recruiting the SAGA complex to the repressed promoter; contains a PHD finger domain |
|
| YPR191W | 4.57 |
QCR2
|
Subunit 2 of the ubiquinol cytochrome-c reductase complex, which is a component of the mitochondrial inner membrane electron transport chain; phosphorylated; transcription is regulated by Hap1p, Hap2p/Hap3p, and heme |
|
| YMR244W | 4.53 |
Putative protein of unknown function |
||
| YDR342C | 4.41 |
HXT7
|
High-affinity glucose transporter of the major facilitator superfamily, nearly identical to Hxt6p, expressed at high basal levels relative to other HXTs, expression repressed by high glucose levels |
|
| YLR122C | 4.40 |
Dubious open reading frame unlikely to encode a protein, based on available experimental and comparative sequence data; partially overlaps the dubious ORF YLR123C |
||
| YGR087C | 4.34 |
PDC6
|
Minor isoform of pyruvate decarboxylase, decarboxylates pyruvate to acetaldehyde, involved in amino acid catabolism; transcription is glucose- and ethanol-dependent, and is strongly induced during sulfur limitation |
|
| YPL182C | 4.31 |
Dubious open reading frame unlikely to encode a protein, based on available experimental and comparative sequence data; partially overlaps the verified gene CTI6/YPL181W |
||
| YOL156W | 4.30 |
HXT11
|
Putative hexose transporter that is nearly identical to Hxt9p, has similarity to major facilitator superfamily (MFS) transporters and is involved in pleiotropic drug resistance |
|
| YPL017C | 4.29 |
IRC15
|
Putative S-adenosylmethionine-dependent methyltransferase of the seven beta-strand family, required for accurate meiotic chromosome segregation; null mutant displays increased levels of spontaneous Rad52 foci |
|
| YPR196W | 4.28 |
Putative maltose activator |
||
| YDR171W | 4.24 |
HSP42
|
Small heat shock protein (sHSP) with chaperone activity; forms barrel-shaped oligomers that suppress unfolded protein aggregation; involved in cytoskeleton reorganization after heat shock |
|
| YOL084W | 4.22 |
PHM7
|
Protein of unknown function, expression is regulated by phosphate levels; green fluorescent protein (GFP)-fusion protein localizes to the cell periphery and vacuole |
|
| YIL160C | 4.20 |
POT1
|
3-ketoacyl-CoA thiolase with broad chain length specificity, cleaves 3-ketoacyl-CoA into acyl-CoA and acetyl-CoA during beta-oxidation of fatty acids |
|
| YNL202W | 4.16 |
SPS19
|
Peroxisomal 2,4-dienoyl-CoA reductase, auxiliary enzyme of fatty acid beta-oxidation; homodimeric enzyme required for growth and sporulation on petroselineate medium; expression induced during late sporulation and in the presence of oleate |
|
| YDL222C | 4.03 |
FMP45
|
Integral membrane protein localized to mitochondria (untagged protein) and eisosomes, immobile patches at the cortex associated with endocytosis; sporulation and sphingolipid content are altered in mutants; has homologs SUR7 and YNL194C |
|
| YPL147W | 4.01 |
PXA1
|
Subunit of a heterodimeric peroxisomal ATP-binding cassette transporter complex (Pxa1p-Pxa2p), required for import of long-chain fatty acids into peroxisomes; similarity to human adrenoleukodystrophy transporter and ALD-related proteins |
|
| YKL188C | 3.98 |
PXA2
|
Subunit of a heterodimeric peroxisomal ATP-binding cassette transporter complex (Pxa1p-Pxa2p), required for import of long-chain fatty acids into peroxisomes; similarity to human adrenoleukodystrophy transporter and ALD-related proteins |
|
| YOR393W | 3.92 |
ERR1
|
Protein of unknown function, has similarity to enolases |
|
| YLL019C | 3.87 |
KNS1
|
Nonessential putative protein kinase of unknown cellular role; member of the LAMMER family of protein kinases, which are serine/threonine kinases also capable of phosphorylating tyrosine residues |
|
| YML081C-A | 3.87 |
ATP18
|
Subunit of the mitochondrial F1F0 ATP synthase, which is a large enzyme complex required for ATP synthesis; termed subunit I or subunit j; does not correspond to known ATP synthase subunits in other organisms |
|
| YFL053W | 3.85 |
DAK2
|
Dihydroxyacetone kinase, required for detoxification of dihydroxyacetone (DHA); involved in stress adaptation |
|
| YDR536W | 3.83 |
STL1
|
Glycerol proton symporter of the plasma membrane, subject to glucose-induced inactivation, strongly but transiently induced when cells are subjected to osmotic shock |
|
| YGR197C | 3.73 |
SNG1
|
Protein involved in nitrosoguanidine (MNNG) resistance; expression is regulated by transcription factors involved in multidrug resistance |
|
| YLR123C | 3.71 |
Dubious open reading frame unlikely to encode a protein, based on available experimental and comparative sequence data; partially overlaps the dubious ORF YLR122C; contains characteristic aminoacyl-tRNA motif |
||
| YEL070W | 3.61 |
DSF1
|
Deletion suppressor of mpt5 mutation |
|
| YHL024W | 3.61 |
RIM4
|
Putative RNA-binding protein required for the expression of early and middle sporulation genes |
|
| YGR110W | 3.59 |
Putative protein of unknown function; transcription is increased in response to genotoxic stress; plays a role in restricting Ty1 transposition |
||
| YBL015W | 3.59 |
ACH1
|
Acetyl-coA hydrolase, primarily localized to mitochondria; phosphorylated; required for acetate utilization and for diploid pseudohyphal growth |
|
| YEL008W | 3.56 |
Hypothetical protein predicted to be involved in metabolism |
||
| YFR022W | 3.54 |
ROG3
|
Protein that binds to Rsp5p, which is a hect-type ubiquitin ligase, via its 2 PY motifs; has similarity to Rod1p; mutation suppresses the temperature sensitivity of an mck1 rim11 double mutant |
|
| YBR072W | 3.53 |
HSP26
|
Small heat shock protein (sHSP) with chaperone activity; forms hollow, sphere-shaped oligomers that suppress unfolded proteins aggregation; oligomer activation requires a heat-induced conformational change; not expressed in unstressed cells |
|
| YML090W | 3.51 |
Dubious open reading frame unlikely to encode a protein, based on available experimental and comparative sequence data; partially overlaps the dubious ORF YML089C; exhibits growth defect on a non-fermentable (respiratory) carbon source |
||
| YPL024W | 3.48 |
RMI1
|
Involved in response to DNA damage; null mutants have increased rates of recombination and delayed S phase; interacts physically and genetically with Sgs1p (RecQ family member) and Top3p (topoisomerase III) |
|
| YOR072W | 3.47 |
Dubious open reading frame unlikely to encode a protein, based on experimental and comparative sequence data; partially overlaps the dubious gene YOR072W-A; diploid deletion strains are methotrexate, paraquat and wortmannin sensitive |
||
| YOR138C | 3.40 |
RUP1
|
Protein involved in regulation of Rsp5p, which is an essential HECT ubiquitin ligase; required for binding of Rsp5p to Ubp2p; contains an UBA domain |
|
| YER015W | 3.38 |
FAA2
|
Long chain fatty acyl-CoA synthetase; accepts a wider range of acyl chain lengths than Faa1p, preferring C9:0-C13:0; involved in the activation of endogenous pools of fatty acids |
|
| YDL130W-A | 3.37 |
STF1
|
Protein involved in regulation of the mitochondrial F1F0-ATP synthase; Stf1p and Stf2p may act as stabilizing factors that enhance inhibitory action of the Inh1p protein |
|
| YJL089W | 3.34 |
SIP4
|
C6 zinc cluster transcriptional activator that binds to the carbon source-responsive element (CSRE) of gluconeogenic genes; involved in the positive regulation of gluconeogenesis; regulated by Snf1p protein kinase; localized to the nucleus |
|
| YFR029W | 3.33 |
PTR3
|
Component of the SPS plasma membrane amino acid sensor system (Ssy1p-Ptr3p-Ssy5p), which senses external amino acid concentration and transmits intracellular signals that result in regulation of expression of amino acid permease genes |
|
| YEL009C | 3.32 |
GCN4
|
Transcriptional activator of amino acid biosynthetic genes in response to amino acid starvation; expression is tightly regulated at both the transcriptional and translational levels |
|
| YJL133C-A | 3.28 |
Putative protein of unknown function; the authentic, non-tagged protein is detected in highly purified mitochondria in high-throughput studies |
||
| YOL052C-A | 3.24 |
DDR2
|
Multistress response protein, expression is activated by a variety of xenobiotic agents and environmental or physiological stresses |
|
| YGR067C | 3.24 |
Putative protein of unknown function; contains a zinc finger motif similar to that of Adr1p |
||
| YHR095W | 3.23 |
Dubious open reading frame unlikely to encode a functional protein, based on available experimental and comparative sequence data |
||
| YLR327C | 3.13 |
TMA10
|
Protein of unknown function that associates with ribosomes |
|
| YDL246C | 3.12 |
SOR2
|
Protein of unknown function, computational analysis of large-scale protein-protein interaction data suggests a possible role in fructose or mannose metabolism |
|
| YOR192C | 3.12 |
THI72
|
Transporter of thiamine or related compound; shares sequence similarity with Thi7p |
|
| YFL024C | 3.11 |
EPL1
|
Component of NuA4, which is an essential histone H4/H2A acetyltransferase complex; homologous to Drosophila Enhancer of Polycomb |
|
| YGL258W-A | 3.10 |
Putative protein of unknown function |
||
| YJR048W | 3.10 |
CYC1
|
Cytochrome c, isoform 1; electron carrier of the mitochondrial intermembrane space that transfers electrons from ubiquinone-cytochrome c oxidoreductase to cytochrome c oxidase during cellular respiration |
|
| YOR381W | 3.09 |
FRE3
|
Ferric reductase, reduces siderophore-bound iron prior to uptake by transporters; expression induced by low iron levels |
|
| YLR152C | 3.08 |
Putative protein of unknown function; YLR152C is not an essential gene |
||
| YFL052W | 3.06 |
Putative zinc cluster protein that contains a DNA binding domain; null mutant sensitive to calcofluor white, low osmolarity and heat, suggesting a role for YFL052Wp in cell wall integrity |
||
| YBR179C | 3.05 |
FZO1
|
Mitochondrial integral membrane protein involved in mitochondrial fusion and maintenance of the mitochondrial genome; contains N-terminal GTPase domain |
|
| YHR160C | 3.04 |
PEX18
|
Peroxin required for targeting of peroxisomal matrix proteins containing PTS2; interacts with Pex7p; partially redundant with Pex21p |
|
| YHR001W-A | 3.03 |
QCR10
|
Subunit of the ubiqunol-cytochrome c oxidoreductase complex which includes Cobp, Rip1p, Cyt1p, Cor1p, Qcr2p, Qcr6p, Qcr7p, Qcr8p, Qcr9p, and Qcr10p and comprises part of the mitochondrial respiratory chain |
|
| YNL144C | 3.01 |
Putative protein of unknown function; the authentic, non-tagged protein is detected in highly purified mitochondria in high-throughput studies; YNL144C is not an essential gene |
||
| YPL026C | 3.01 |
SKS1
|
Putative serine/threonine protein kinase; involved in the adaptation to low concentrations of glucose independent of the SNF3 regulated pathway |
|
| YLR332W | 2.98 |
MID2
|
O-glycosylated plasma membrane protein that acts as a sensor for cell wall integrity signaling and activates the pathway; interacts with Rom2p, a guanine nucleotide exchange factor for Rho1p, and with cell integrity pathway protein Zeo1p |
|
| YOR072W-A | 2.97 |
Dubious open reading frame unlikely to encode a protein, based on available experimental and comparative sequence data; partially overlaps the uncharacterized ORF YOR072W; originally identified by fungal homology and RT-PCR |
||
| YMR103C | 2.97 |
Dubious open reading frame unlikely to encode a protein, based on available experimental and comparative sequence data |
||
| YOR192C-C | 2.95 |
Putative protein of unknown function; identified by expression profiling and mass spectrometry |
||
| YHR210C | 2.94 |
Putative protein of unknown function; non-essential gene; highly expressed under anaeorbic conditions; sequence similarity to aldose 1-epimerases such as GAL10 |
||
| YOR084W | 2.92 |
LPX1
|
Oleic acid-inducible, peroxisomal matrix localized lipase; transcriptionally activated by Yrm1p along with genes involved in multidrug resistance; peroxisomal import is dependent on the PTS1 receptor, Pex5p and on self-interaction |
|
| YLR331C | 2.91 |
JIP3
|
Dubious open reading frame, unlikely to encode a protein; not conserved in closely related Saccharomyces species; 98% of ORF overlaps the verified gene MID2 |
|
| YOR071C | 2.91 |
NRT1
|
High-affinity nicotinamide riboside transporter; also transports thiamine with low affinity; shares sequence similarity with Thi7p and Thi72p; proposed to be involved in 5-fluorocytosine sensitivity |
|
| YJR159W | 2.89 |
SOR1
|
Sorbitol dehydrogenase; expression is induced in the presence of sorbitol |
|
| YOL100W | 2.86 |
PKH2
|
Serine/threonine protein kinase involved in sphingolipid-mediated signaling pathway that controls endocytosis; activates Ypk1p and Ykr2p, components of signaling cascade required for maintenance of cell wall integrity; redundant with Pkh1p |
|
| YJL217W | 2.82 |
Cytoplasmic protein of unknown function; expression induced by calcium shortage and via the copper sensing transciption factor Mac1p during conditons of copper deficiency; mRNA is cell cycle regulated, peaking in G1 phase |
||
| YPR013C | 2.79 |
Putative zinc finger protein; YPR013C is not an essential gene |
||
| YAR069C | 2.77 |
Dubious open reading frame unlikely to encode a protein, based on available experimental and comparative sequence data |
||
| YMR090W | 2.75 |
Putative protein of unknown function with similarity to DTDP-glucose 4,6-dehydratases; green fluorescent protein (GFP)-fusion protein localizes to the cytoplasm; YMR090W is not an essential gene |
||
| YML091C | 2.70 |
RPM2
|
Protein subunit of mitochondrial RNase P, has roles in nuclear transcription, cytoplasmic and mitochondrial RNA processing, and mitochondrial translation; distributed to mitochondria, cytoplasmic processing bodies, and the nucleus |
|
| YEL065W | 2.66 |
SIT1
|
Ferrioxamine B transporter, member of the ARN family of transporters that specifically recognize siderophore-iron chelates; transcription is induced during iron deprivation and diauxic shift; potentially phosphorylated by Cdc28p |
|
| YCR091W | 2.61 |
KIN82
|
Putative serine/threonine protein kinase, most similar to cyclic nucleotide-dependent protein kinase subfamily and the protein kinase C subfamily |
|
| YLR124W | 2.60 |
Dubious open reading frame unlikely to encode a protein, based on available experimental and comparative sequence data |
||
| YAR070C | 2.59 |
Dubious open reading frame unlikely to encode a protein, based on available experimental and comparative sequence data |
||
| YIR027C | 2.57 |
DAL1
|
Allantoinase, converts allantoin to allantoate in the first step of allantoin degradation; expression sensitive to nitrogen catabolite repression |
|
| YER033C | 2.57 |
ZRG8
|
Protein of unknown function; authentic, non-tagged protein is detected in highly purified mitochondria in high-throughput studies; GFP-fusion protein is localized to the cytoplasm; transcription induced under conditions of zinc deficiency |
|
| YBR180W | 2.54 |
DTR1
|
Putative dityrosine transporter, required for spore wall synthesis; expressed during sporulation; member of the major facilitator superfamily (DHA1 family) of multidrug resistance transporters |
|
| YKL217W | 2.52 |
JEN1
|
Lactate transporter, required for uptake of lactate and pyruvate; phosphorylated; expression is derepressed by transcriptional activator Cat8p during respiratory growth, and repressed in the presence of glucose, fructose, and mannose |
|
| YOR391C | 2.52 |
HSP33
|
Possible chaperone and cysteine protease with similarity to E. coli Hsp31 and S. cerevisiae Hsp31p, Hsp32p, and Sno4p; member of the DJ-1/ThiJ/PfpI superfamily, which includes human DJ-1 involved in Parkinson's disease |
|
| YLL056C | 2.50 |
Putative protein of unknown function, transcription is activated by paralogous transcription factors Yrm1p and Yrr1p along with genes involved in pleiotropic drug resistance (PDR) phenomenon; YLL056C is not an essential gene |
||
| YLR334C | 2.48 |
Dubious open reading frame unlikely to encode a protein, based on available experimental and comparative sequence data; overlaps a stand-alone long terminal repeat sequence whose presence indicates a retrotransposition event occurred here |
||
| YKR046C | 2.46 |
PET10
|
Protein of unknown function that co-purifies with lipid particles; expression pattern suggests a role in respiratory growth; computational analysis of large-scale protein-protein interaction data suggests a role in ATP/ADP exchange |
|
| YDR406W | 2.43 |
PDR15
|
Plasma membrane ATP binding cassette (ABC) transporter, multidrug transporter and general stress response factor implicated in cellular detoxification; regulated by Pdr1p, Pdr3p and Pdr8p; promoter contains a PDR responsive element |
|
| YGR088W | 2.41 |
CTT1
|
Cytosolic catalase T, has a role in protection from oxidative damage by hydrogen peroxide |
|
| YJR160C | 2.41 |
MPH3
|
Alpha-glucoside permease, transports maltose, maltotriose, alpha-methylglucoside, and turanose; identical to Mph2p; encoded in a subtelomeric position in a region likely to have undergone duplication |
|
| YLL053C | 2.40 |
Putative protein; in the Sigma 1278B strain background YLL053C is contiguous with AQY2 which encodes an aquaporin |
||
| YBL096C | 2.37 |
Non-essential protein of unknown function |
||
| YDL194W | 2.33 |
SNF3
|
Plasma membrane glucose sensor that regulates glucose transport; has 12 predicted transmembrane segments; long cytoplasmic C-terminal tail is required for low glucose induction of hexose transporter genes HXT2 and HXT4 |
|
| YKR015C | 2.31 |
Putative protein of unknown function |
||
| YPR151C | 2.31 |
SUE1
|
Mitochondrial protein required for degradation of unstable forms of cytochrome c |
|
| YBR037C | 2.30 |
SCO1
|
Copper-binding protein of the mitochondrial inner membrane, required for cytochrome c oxidase activity and respiration; may function to deliver copper to cytochrome c oxidase; has similarity to thioredoxins |
|
| YKL026C | 2.29 |
GPX1
|
Phospholipid hydroperoxide glutathione peroxidase induced by glucose starvation that protects cells from phospholipid hydroperoxides and nonphospholipid peroxides during oxidative stress |
|
| YLR125W | 2.24 |
Putative protein of unknown function; mutant has decreased Ty3 transposition; YLR125W is not an essential gene |
||
| YOL044W | 2.24 |
PEX15
|
Phosphorylated tail-anchored type II integral peroxisomal membrane protein required for peroxisome biogenesis, cells lacking Pex15p mislocalize peroxisomal matrix proteins to cytosol, overexpression results in impaired peroxisome assembly |
|
| YNL142W | 2.22 |
MEP2
|
Ammonium permease involved in regulation of pseudohyphal growth; belongs to a ubiquitous family of cytoplasmic membrane proteins that transport only ammonium (NH4+); expression is under the nitrogen catabolite repression regulation |
|
| YBL095W | 2.20 |
Putative protein of unknown function; the authentic, non-tagged protein is detected in highly purified mitochondria in high-throughput studies |
||
| YLL055W | 2.19 |
YCT1
|
High-affinity cysteine-specific transporter with similarity to the Dal5p family of transporters; green fluorescent protein (GFP)-fusion protein localizes to the endoplasmic reticulum; YCT1 is not an essential gene |
|
| YDR247W | 2.17 |
VHS1
|
Cytoplasmic serine/threonine protein kinase; identified as a high-copy suppressor of the synthetic lethality of a sis2 sit4 double mutant, suggesting a role in G1/S phase progression; homolog of Sks1p |
|
| YJR148W | 2.17 |
BAT2
|
Cytosolic branched-chain amino acid aminotransferase, homolog of murine ECA39; highly expressed during stationary phase and repressed during logarithmic phase |
|
| YEL011W | 2.14 |
GLC3
|
Glycogen branching enzyme, involved in glycogen accumulation; green fluorescent protein (GFP)-fusion protein localizes to the cytoplasm in a punctate pattern |
|
| YPL201C | 2.13 |
YIG1
|
Protein that interacts with glycerol 3-phosphatase and plays a role in anaerobic glycerol production; localizes to the nucleus and cytosol |
|
| YLL052C | 2.13 |
AQY2
|
Water channel that mediates the transport of water across cell membranes, only expressed in proliferating cells, controlled by osmotic signals, may be involved in freeze tolerance; disrupted by a stop codon in many S. cerevisiae strains |
|
| YPL271W | 2.11 |
ATP15
|
Epsilon subunit of the F1 sector of mitochondrial F1F0 ATP synthase, which is a large, evolutionarily conserved enzyme complex required for ATP synthesis; phosphorylated |
|
| YMR135C | 2.08 |
GID8
|
Protein of unknown function, involved in proteasome-dependent catabolite inactivation of fructose-1,6-bisphosphatase; contains LisH and CTLH domains, like Vid30p; dosage-dependent regulator of START |
|
| YCR005C | 2.08 |
CIT2
|
Citrate synthase, catalyzes the condensation of acetyl coenzyme A and oxaloacetate to form citrate, peroxisomal isozyme involved in glyoxylate cycle; expression is controlled by Rtg1p and Rtg2p transcription factors |
|
| YNL013C | 2.07 |
Dubious open reading frame unlikely to encode a protein, based on available experimental and comparative sequence data; partially overlaps the verified ORF HEF3/YNL014W |
||
| YOL085W-A | 2.07 |
Dubious open reading frame unlikely to encode a protein, based on available experimental and comparative sequence data; partially overlaps the dubious ORF YOL085C |
||
| YHR092C | 2.05 |
HXT4
|
High-affinity glucose transporter of the major facilitator superfamily, expression is induced by low levels of glucose and repressed by high levels of glucose |
|
| YBR203W | 2.04 |
COS111
|
Protein required for resistance to the antifungal drug ciclopirox olamine; not related to the subtelomerically-encoded COS family; the authentic, non-tagged protein is detected in highly purified mitochondria in high-throughput studies |
|
| YNL277W-A | 2.03 |
Putative protein of unknown function |
||
| YPR027C | 2.01 |
Putative protein of unknown function |
||
| YAR068W | 2.01 |
Fungal-specific protein of unknown function; induced in respiratory-deficient cells |
||
| YNR050C | 2.00 |
LYS9
|
Saccharopine dehydrogenase (NADP+, L-glutamate-forming); catalyzes the formation of saccharopine from alpha-aminoadipate 6-semialdehyde, which is the seventh step in lysine biosynthesis pathway |
|
| YFL051C | 1.96 |
Putative protein of unknown function; YFL051C is not an essential gene |
||
| YMR107W | 1.96 |
SPG4
|
Protein required for survival at high temperature during stationary phase; not required for growth on nonfermentable carbon sources |
|
| YFL055W | 1.96 |
AGP3
|
Low-affinity amino acid permease, may act to supply the cell with amino acids as nitrogen source in nitrogen-poor conditions; transcription is induced under conditions of sulfur limitation; plays a role in regulating Ty1 transposition |
|
| YLR304C | 1.95 |
ACO1
|
Aconitase, required for the tricarboxylic acid (TCA) cycle and also independently required for mitochondrial genome maintenance; phosphorylated; component of the mitochondrial nucleoid; mutation leads to glutamate auxotrophy |
|
| YBR169C | 1.95 |
SSE2
|
Member of the heat shock protein 70 (HSP70) family; may be involved in protein folding; localized to the cytoplasm; highly homologous to the heat shock protein Sse1p |
|
| YNL052W | 1.92 |
COX5A
|
Subunit Va of cytochrome c oxidase, which is the terminal member of the mitochondrial inner membrane electron transport chain; predominantly expressed during aerobic growth while its isoform Vb (Cox5Bp) is expressed during anaerobic growth |
|
| YAL054C | 1.92 |
ACS1
|
Acetyl-coA synthetase isoform which, along with Acs2p, is the nuclear source of acetyl-coA for histone acetlyation; expressed during growth on nonfermentable carbon sources and under aerobic conditions |
|
| YDR441C | 1.92 |
APT2
|
Apparent pseudogene, not transcribed or translated under normal conditions; encodes a protein with similarity to adenine phosphoribosyltransferase, but artificially expressed protein exhibits no enzymatic activity |
|
| YER158C | 1.91 |
Protein of unknown function, has similarity to Afr1p; potentially phosphorylated by Cdc28p |
||
| YIR039C | 1.89 |
YPS6
|
Putative GPI-anchored aspartic protease |
|
| YMR280C | 1.88 |
CAT8
|
Zinc cluster transcriptional activator necessary for derepression of a variety of genes under non-fermentative growth conditions, active after diauxic shift, binds carbon source responsive elements |
|
| YLR431C | 1.88 |
ATG23
|
Peripheral membrane protein required for the cytoplasm-to-vacuole targeting (Cvt) pathway; cycles between the pre-autophagosome (PAS) and non-PAS locations; forms a complex with Atg9p and Atg27p |
|
| YLR366W | 1.84 |
Dubious open reading frame unlikely to encode a protein, based on available experimental and comparative sequence data; partially overlaps the dubious ORF YLR364C-A |
||
| YNL276C | 1.83 |
Dubious open reading frame unlikely to encode a protein, based on available experimental and comparative sequence data; overlaps the verified gene MET2/YNL277W |
||
| YER014C-A | 1.83 |
BUD25
|
Protein involved in bud-site selection; diploid mutants display a random budding pattern instead of the wild-type bipolar pattern |
|
| YHR052W-A | 1.79 |
Dubious open reading frame unlikely to encode a protein, based on available experimental and comparative sequence data; partially overlaps CUP1-1 |
||
| YGR043C | 1.79 |
NQM1
|
Protein of unknown function; transcription is repressed by Mot1p and induced by alpha-factor and during diauxic shift; null mutant non-quiescent cells exhibit reduced reproductive capacity |
|
| YPR061C | 1.78 |
JID1
|
Probable Hsp40p co-chaperone, has a DnaJ-like domain and appears to be involved in ER-associated degradation of misfolded proteins containing a tightly folded cytoplasmic domain; inhibits replication of Brome mosaic virus in S. cerevisiae |
|
| YAR050W | 1.78 |
FLO1
|
Lectin-like protein involved in flocculation, cell wall protein that binds to mannose chains on the surface of other cells, confers floc-forming ability that is chymotrypsin sensitive and heat resistant; similar to Flo5p |
|
| YBR269C | 1.78 |
FMP21
|
Putative protein of unknown function; the authentic, non-tagged protein is detected in highly purified mitochondria in high-throughput studies |
|
| YDR096W | 1.76 |
GIS1
|
JmjC domain-containing histone demethylase; transcription factor involved in the expression of genes during nutrient limitation; also involved in the negative regulation of DPP1 and PHR1 |
|
| YLR296W | 1.75 |
Dubious open reading frame unlikely to encode a protein, based on available experimental and comparative sequence data |
||
| YJL214W | 1.75 |
HXT8
|
Protein of unknown function with similarity to hexose transporter family members, expression is induced by low levels of glucose and repressed by high levels of glucose |
|
| YKR103W | 1.75 |
NFT1
|
Putative transporter of the multidrug resistance-associated protein (MRP) subfamily; adjacent ORFs YKR103W and YKR104W are merged in different strain backgrounds. |
|
| YOR363C | 1.75 |
PIP2
|
Autoregulatory oleate-specific transcriptional activator of peroxisome proliferation, contains Zn(2)-Cys(6) cluster domain, forms heterodimer with Oaf1p, binds oleate response elements (OREs), activates beta-oxidation genes |
|
| YGR142W | 1.74 |
BTN2
|
v-SNARE binding protein that facilitates specific protein retrieval from a late endosome to the Golgi; modulates arginine uptake, possible role in mediating pH homeostasis between the vacuole and plasma membrane H(+)-ATPase |
|
| YMR141C | 1.73 |
Dubious open reading frame unlikely to encode a functional protein, based on available experimental and comparative sequence data |
||
| YDR070C | 1.72 |
FMP16
|
Putative protein of unknown function; the authentic, non-tagged protein is detected in highly purified mitochondria in high-throughput studies |
|
| YDR533C | 1.69 |
HSP31
|
Possible chaperone and cysteine protease with similarity to E. coli Hsp31; member of the DJ-1/ThiJ/PfpI superfamily, which includes human DJ-1 involved in Parkinson's disease; exists as a dimer and contains a putative metal-binding site |
|
| YNL055C | 1.68 |
POR1
|
Mitochondrial porin (voltage-dependent anion channel), outer membrane protein required for the maintenance of mitochondrial osmotic stability and mitochondrial membrane permeability; phosphorylated |
|
| YNL133C | 1.66 |
FYV6
|
Protein of unknown function, required for survival upon exposure to K1 killer toxin; proposed to regulate double-strand break repair via non-homologous end-joining |
|
| YOR120W | 1.65 |
GCY1
|
Putative NADP(+) coupled glycerol dehydrogenase, proposed to be involved in an alternative pathway for glycerol catabolism; member of the aldo-keto reductase (AKR) family |
|
| YMR081C | 1.64 |
ISF1
|
Serine-rich, hydrophilic protein with similarity to Mbr1p; overexpression suppresses growth defects of hap2, hap3, and hap4 mutants; expression is under glucose control; cotranscribed with NAM7 in a cyp1 mutant |
|
| YJR152W | 1.64 |
DAL5
|
Allantoin permease; ureidosuccinate permease; expression is constitutive but sensitive to nitrogen catabolite repression |
|
| YBR212W | 1.64 |
NGR1
|
RNA binding protein that negatively regulates growth rate; interacts with the 3' UTR of the mitochondrial porin (POR1) mRNA and enhances its degradation; overexpression impairs mitochondrial function; expressed in stationary phase |
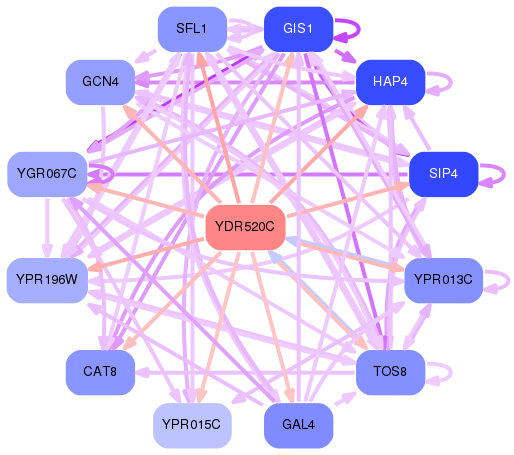
Network of associatons between targets according to the STRING database.

First level regulatory network of YDR520C
Gene Ontology Analysis
Gene overrepresentation in biological process category:
| Log-likelihood per target | Total log-likelihood | Term | Description |
|---|---|---|---|
| 6.1 | 18.2 | GO:0015740 | C4-dicarboxylate transport(GO:0015740) |
| 3.4 | 10.3 | GO:0015755 | fructose transport(GO:0015755) |
| 3.3 | 9.8 | GO:0006545 | glycine biosynthetic process(GO:0006545) |
| 2.8 | 28.3 | GO:0046487 | glyoxylate metabolic process(GO:0046487) |
| 2.8 | 8.4 | GO:0009437 | amino-acid betaine metabolic process(GO:0006577) carnitine metabolic process(GO:0009437) |
| 2.6 | 7.8 | GO:0017006 | protein-heme linkage(GO:0017003) protein-tetrapyrrole linkage(GO:0017006) cytochrome c-heme linkage(GO:0018063) |
| 2.4 | 9.6 | GO:0015804 | neutral amino acid transport(GO:0015804) |
| 2.1 | 6.3 | GO:1900460 | negative regulation of invasive growth in response to glucose limitation by negative regulation of transcription from RNA polymerase II promoter(GO:1900460) |
| 2.0 | 6.0 | GO:0015888 | thiamine transport(GO:0015888) |
| 2.0 | 8.0 | GO:0006848 | pyruvate transport(GO:0006848) |
| 1.7 | 17.0 | GO:0006122 | mitochondrial electron transport, ubiquinol to cytochrome c(GO:0006122) |
| 1.7 | 3.3 | GO:0061413 | regulation of gluconeogenesis by regulation of transcription from RNA polymerase II promoter(GO:0035947) positive regulation of gluconeogenesis by positive regulation of transcription from RNA polymerase II promoter(GO:0035948) regulation of transcription from RNA polymerase II promoter by a nonfermentable carbon source(GO:0061413) positive regulation of transcription from RNA polymerase II promoter by a nonfermentable carbon source(GO:0061414) |
| 1.5 | 1.5 | GO:1904951 | positive regulation of protein transport(GO:0051222) positive regulation of establishment of protein localization(GO:1904951) |
| 1.3 | 14.4 | GO:0006635 | fatty acid beta-oxidation(GO:0006635) |
| 1.2 | 9.9 | GO:0015891 | siderophore transport(GO:0015891) |
| 1.2 | 7.0 | GO:0000501 | flocculation(GO:0000128) flocculation via cell wall protein-carbohydrate interaction(GO:0000501) |
| 1.1 | 4.6 | GO:0051101 | positive regulation of DNA binding(GO:0043388) regulation of DNA binding(GO:0051101) |
| 1.1 | 3.4 | GO:0032780 | negative regulation of ATPase activity(GO:0032780) |
| 1.1 | 4.4 | GO:0000949 | aromatic amino acid family catabolic process to alcohol via Ehrlich pathway(GO:0000949) |
| 1.0 | 7.2 | GO:0006083 | acetate metabolic process(GO:0006083) |
| 1.0 | 4.8 | GO:0019563 | alditol catabolic process(GO:0019405) glycerol catabolic process(GO:0019563) |
| 1.0 | 2.9 | GO:0042744 | hydrogen peroxide catabolic process(GO:0042744) |
| 0.9 | 3.7 | GO:0010688 | negative regulation of ribosomal protein gene transcription from RNA polymerase II promoter(GO:0010688) |
| 0.9 | 4.4 | GO:0060211 | regulation of nuclear-transcribed mRNA poly(A) tail shortening(GO:0060211) |
| 0.8 | 3.3 | GO:0043200 | response to amino acid(GO:0043200) |
| 0.8 | 2.4 | GO:0072488 | ammonium transmembrane transport(GO:0072488) |
| 0.8 | 10.9 | GO:0015986 | energy coupled proton transport, down electrochemical gradient(GO:0015985) ATP synthesis coupled proton transport(GO:0015986) |
| 0.8 | 5.3 | GO:0015908 | fatty acid transport(GO:0015908) |
| 0.7 | 0.7 | GO:0051099 | positive regulation of binding(GO:0051099) |
| 0.7 | 3.0 | GO:0036498 | mRNA splicing via endonucleolytic cleavage and ligation involved in unfolded protein response(GO:0030969) IRE1-mediated unfolded protein response(GO:0036498) mRNA splicing, via endonucleolytic cleavage and ligation(GO:0070054) |
| 0.7 | 3.6 | GO:0008053 | mitochondrial fusion(GO:0008053) |
| 0.7 | 3.6 | GO:0043112 | receptor recycling(GO:0001881) protein import into peroxisome matrix, receptor recycling(GO:0016562) receptor metabolic process(GO:0043112) |
| 0.7 | 2.1 | GO:0019401 | glycerol biosynthetic process(GO:0006114) alditol biosynthetic process(GO:0019401) |
| 0.7 | 2.8 | GO:0015793 | glycerol transport(GO:0015793) |
| 0.7 | 1.4 | GO:0009730 | detection of chemical stimulus(GO:0009593) detection of carbohydrate stimulus(GO:0009730) detection of hexose stimulus(GO:0009732) detection of monosaccharide stimulus(GO:0034287) detection of glucose(GO:0051594) detection of stimulus(GO:0051606) |
| 0.7 | 12.0 | GO:0042724 | thiamine biosynthetic process(GO:0009228) thiamine-containing compound biosynthetic process(GO:0042724) |
| 0.7 | 2.1 | GO:0005993 | trehalose catabolic process(GO:0005993) |
| 0.7 | 4.2 | GO:0009062 | fatty acid catabolic process(GO:0009062) |
| 0.7 | 4.9 | GO:0061188 | negative regulation of chromatin silencing at rDNA(GO:0061188) |
| 0.7 | 4.8 | GO:0016239 | positive regulation of macroautophagy(GO:0016239) |
| 0.7 | 15.8 | GO:0012501 | apoptotic process(GO:0006915) cell death(GO:0008219) programmed cell death(GO:0012501) |
| 0.7 | 9.2 | GO:0072593 | reactive oxygen species metabolic process(GO:0072593) |
| 0.6 | 3.6 | GO:0006279 | premeiotic DNA replication(GO:0006279) |
| 0.6 | 3.4 | GO:0000255 | allantoin metabolic process(GO:0000255) allantoin catabolic process(GO:0000256) |
| 0.6 | 1.7 | GO:0042843 | D-xylose catabolic process(GO:0042843) |
| 0.5 | 8.7 | GO:0019740 | nitrogen utilization(GO:0019740) |
| 0.5 | 3.8 | GO:0000023 | maltose metabolic process(GO:0000023) |
| 0.5 | 4.7 | GO:0070086 | ubiquitin-dependent endocytosis(GO:0070086) |
| 0.5 | 3.6 | GO:0006123 | mitochondrial electron transport, cytochrome c to oxygen(GO:0006123) |
| 0.5 | 2.0 | GO:0031135 | negative regulation of conjugation(GO:0031135) negative regulation of conjugation with cellular fusion(GO:0031138) negative regulation of multi-organism process(GO:0043901) |
| 0.5 | 1.5 | GO:0001676 | long-chain fatty acid metabolic process(GO:0001676) |
| 0.5 | 1.9 | GO:0009083 | branched-chain amino acid catabolic process(GO:0009083) |
| 0.5 | 3.8 | GO:0006359 | regulation of transcription from RNA polymerase III promoter(GO:0006359) |
| 0.5 | 9.3 | GO:0015749 | hexose transport(GO:0008645) monosaccharide transport(GO:0015749) |
| 0.4 | 0.4 | GO:0034440 | fatty acid oxidation(GO:0019395) lipid oxidation(GO:0034440) |
| 0.4 | 5.5 | GO:0007135 | meiosis II(GO:0007135) meiotic sister chromatid segregation(GO:0045144) |
| 0.4 | 1.7 | GO:0016577 | protein demethylation(GO:0006482) protein dealkylation(GO:0008214) histone demethylation(GO:0016577) demethylation(GO:0070988) |
| 0.4 | 6.3 | GO:0000436 | carbon catabolite activation of transcription from RNA polymerase II promoter(GO:0000436) |
| 0.4 | 0.8 | GO:0045723 | positive regulation of fatty acid biosynthetic process(GO:0045723) |
| 0.4 | 1.2 | GO:0006103 | 2-oxoglutarate metabolic process(GO:0006103) |
| 0.4 | 1.9 | GO:0006121 | mitochondrial electron transport, succinate to ubiquinone(GO:0006121) |
| 0.4 | 2.8 | GO:0045332 | phospholipid translocation(GO:0045332) |
| 0.3 | 2.4 | GO:0045721 | negative regulation of gluconeogenesis(GO:0045721) |
| 0.3 | 1.0 | GO:2001247 | positive regulation of phosphatidylcholine biosynthetic process(GO:2001247) |
| 0.3 | 1.0 | GO:0006111 | regulation of gluconeogenesis(GO:0006111) |
| 0.3 | 1.0 | GO:0070583 | spore membrane bending pathway(GO:0070583) |
| 0.3 | 0.3 | GO:0006108 | malate metabolic process(GO:0006108) |
| 0.3 | 1.0 | GO:0072329 | monocarboxylic acid catabolic process(GO:0072329) |
| 0.3 | 3.2 | GO:0046686 | response to cadmium ion(GO:0046686) |
| 0.3 | 4.7 | GO:0008535 | respiratory chain complex IV assembly(GO:0008535) |
| 0.3 | 0.9 | GO:0010994 | free ubiquitin chain polymerization(GO:0010994) |
| 0.3 | 0.9 | GO:0033499 | galactose catabolic process via UDP-galactose(GO:0033499) |
| 0.3 | 0.6 | GO:0000019 | regulation of mitotic recombination(GO:0000019) |
| 0.3 | 2.8 | GO:0015893 | drug transport(GO:0015893) |
| 0.3 | 1.7 | GO:0051260 | protein homooligomerization(GO:0051260) |
| 0.3 | 5.0 | GO:0031163 | iron-sulfur cluster assembly(GO:0016226) metallo-sulfur cluster assembly(GO:0031163) |
| 0.3 | 0.8 | GO:0015693 | magnesium ion transport(GO:0015693) |
| 0.3 | 0.5 | GO:0045912 | negative regulation of cellular carbohydrate metabolic process(GO:0010677) negative regulation of glycogen biosynthetic process(GO:0045719) negative regulation of carbohydrate metabolic process(GO:0045912) negative regulation of glycogen metabolic process(GO:0070874) |
| 0.3 | 2.6 | GO:0006101 | tricarboxylic acid cycle(GO:0006099) citrate metabolic process(GO:0006101) |
| 0.3 | 0.8 | GO:0045950 | negative regulation of mitotic recombination(GO:0045950) |
| 0.3 | 0.5 | GO:0071941 | urea metabolic process(GO:0019627) nitrogen cycle metabolic process(GO:0071941) |
| 0.2 | 1.0 | GO:0032105 | negative regulation of macroautophagy(GO:0016242) negative regulation of response to external stimulus(GO:0032102) negative regulation of response to extracellular stimulus(GO:0032105) negative regulation of response to nutrient levels(GO:0032108) |
| 0.2 | 0.7 | GO:0043335 | protein unfolding(GO:0043335) |
| 0.2 | 0.7 | GO:0051093 | negative regulation of cell differentiation(GO:0045596) negative regulation of developmental process(GO:0051093) |
| 0.2 | 1.7 | GO:0046020 | negative regulation of transcription by pheromones(GO:0045996) negative regulation of transcription from RNA polymerase II promoter by pheromones(GO:0046020) |
| 0.2 | 1.5 | GO:0072337 | modified amino acid transport(GO:0072337) |
| 0.2 | 0.7 | GO:0036257 | multivesicular body organization(GO:0036257) |
| 0.2 | 2.8 | GO:1905037 | autophagosome assembly(GO:0000045) autophagosome organization(GO:1905037) |
| 0.2 | 1.1 | GO:0033683 | nucleotide-excision repair, DNA incision(GO:0033683) |
| 0.2 | 1.7 | GO:0006078 | (1->6)-beta-D-glucan biosynthetic process(GO:0006078) |
| 0.2 | 2.8 | GO:0016558 | protein import into peroxisome matrix(GO:0016558) |
| 0.2 | 1.2 | GO:0018065 | protein-cofactor linkage(GO:0018065) |
| 0.2 | 2.0 | GO:0019878 | lysine biosynthetic process via aminoadipic acid(GO:0019878) |
| 0.2 | 0.4 | GO:0071466 | cellular response to xenobiotic stimulus(GO:0071466) |
| 0.2 | 3.9 | GO:0016579 | protein deubiquitination(GO:0016579) |
| 0.2 | 0.6 | GO:0001113 | transcriptional open complex formation at RNA polymerase II promoter(GO:0001113) |
| 0.2 | 0.6 | GO:0019323 | pentose metabolic process(GO:0019321) pentose catabolic process(GO:0019323) |
| 0.2 | 0.2 | GO:0043902 | positive regulation of multi-organism process(GO:0043902) |
| 0.2 | 0.8 | GO:0016036 | cellular response to phosphate starvation(GO:0016036) |
| 0.2 | 6.0 | GO:0007031 | peroxisome organization(GO:0007031) |
| 0.2 | 0.6 | GO:0031297 | replication fork processing(GO:0031297) |
| 0.2 | 0.2 | GO:0006740 | NADPH regeneration(GO:0006740) |
| 0.2 | 0.4 | GO:0045980 | negative regulation of nucleotide metabolic process(GO:0045980) |
| 0.2 | 0.5 | GO:2000058 | regulation of protein ubiquitination involved in ubiquitin-dependent protein catabolic process(GO:2000058) |
| 0.2 | 0.5 | GO:0071281 | response to iron ion(GO:0010039) regulation of transcription from RNA polymerase II promoter in response to iron(GO:0034395) cellular response to iron ion(GO:0071281) |
| 0.2 | 0.3 | GO:0045005 | DNA-dependent DNA replication maintenance of fidelity(GO:0045005) |
| 0.2 | 0.5 | GO:0045117 | azole transport(GO:0045117) |
| 0.2 | 0.7 | GO:0000715 | nucleotide-excision repair, DNA damage recognition(GO:0000715) |
| 0.2 | 2.1 | GO:0006749 | glutathione metabolic process(GO:0006749) |
| 0.2 | 1.0 | GO:0015718 | monocarboxylic acid transport(GO:0015718) |
| 0.2 | 0.5 | GO:0006835 | dicarboxylic acid transport(GO:0006835) |
| 0.2 | 0.8 | GO:0071805 | cellular potassium ion transport(GO:0071804) potassium ion transmembrane transport(GO:0071805) |
| 0.2 | 0.5 | GO:0051503 | adenine nucleotide transport(GO:0051503) |
| 0.2 | 5.2 | GO:0009060 | aerobic respiration(GO:0009060) |
| 0.2 | 0.2 | GO:0099515 | actin filament-based movement(GO:0030048) actin filament-based transport(GO:0099515) |
| 0.2 | 2.1 | GO:0005978 | glycogen biosynthetic process(GO:0005978) |
| 0.1 | 0.1 | GO:0051238 | intracellular sequestering of iron ion(GO:0006880) sequestering of metal ion(GO:0051238) sequestering of iron ion(GO:0097577) |
| 0.1 | 6.0 | GO:0042244 | ascospore wall assembly(GO:0030476) spore wall assembly(GO:0042244) spore wall biogenesis(GO:0070590) ascospore wall biogenesis(GO:0070591) fungal-type cell wall assembly(GO:0071940) |
| 0.1 | 2.0 | GO:0042026 | protein refolding(GO:0042026) |
| 0.1 | 0.8 | GO:0015851 | nucleobase transport(GO:0015851) |
| 0.1 | 0.9 | GO:0009306 | protein secretion(GO:0009306) |
| 0.1 | 0.8 | GO:0000920 | cell separation after cytokinesis(GO:0000920) |
| 0.1 | 0.4 | GO:1902751 | positive regulation of G2/M transition of mitotic cell cycle(GO:0010971) positive regulation of cell cycle G2/M phase transition(GO:1902751) |
| 0.1 | 0.5 | GO:0071709 | ascospore-type prospore membrane assembly(GO:0032120) membrane biogenesis(GO:0044091) membrane assembly(GO:0071709) |
| 0.1 | 0.6 | GO:0051292 | pore complex assembly(GO:0046931) nuclear pore complex assembly(GO:0051292) |
| 0.1 | 0.2 | GO:0042816 | pyridoxine metabolic process(GO:0008614) pyridoxine biosynthetic process(GO:0008615) vitamin B6 metabolic process(GO:0042816) vitamin B6 biosynthetic process(GO:0042819) |
| 0.1 | 0.3 | GO:0032874 | positive regulation of stress-activated MAPK cascade(GO:0032874) positive regulation of stress-activated protein kinase signaling cascade(GO:0070304) |
| 0.1 | 1.7 | GO:0007129 | synapsis(GO:0007129) |
| 0.1 | 0.2 | GO:0006390 | transcription from mitochondrial promoter(GO:0006390) |
| 0.1 | 0.5 | GO:0045041 | protein import into mitochondrial intermembrane space(GO:0045041) |
| 0.1 | 0.3 | GO:0006501 | C-terminal protein lipidation(GO:0006501) |
| 0.1 | 0.6 | GO:0006276 | plasmid maintenance(GO:0006276) |
| 0.1 | 0.1 | GO:2000105 | positive regulation of DNA-dependent DNA replication(GO:2000105) |
| 0.1 | 0.3 | GO:0006827 | high-affinity iron ion transmembrane transport(GO:0006827) |
| 0.1 | 0.8 | GO:0070987 | error-free translesion synthesis(GO:0070987) |
| 0.1 | 0.3 | GO:0071050 | snoRNA polyadenylation(GO:0071050) |
| 0.1 | 0.3 | GO:0034059 | response to anoxia(GO:0034059) cellular response to anoxia(GO:0071454) |
| 0.1 | 2.3 | GO:0006200 | obsolete ATP catabolic process(GO:0006200) |
| 0.1 | 0.3 | GO:0070542 | response to lipid(GO:0033993) response to oleic acid(GO:0034201) response to fatty acid(GO:0070542) cellular response to lipid(GO:0071396) cellular response to fatty acid(GO:0071398) cellular response to oleic acid(GO:0071400) |
| 0.1 | 0.3 | GO:0006285 | base-excision repair, AP site formation(GO:0006285) |
| 0.1 | 0.7 | GO:0043488 | regulation of RNA stability(GO:0043487) regulation of mRNA stability(GO:0043488) |
| 0.1 | 0.5 | GO:0015677 | copper ion import(GO:0015677) |
| 0.1 | 0.8 | GO:0006513 | protein monoubiquitination(GO:0006513) |
| 0.1 | 0.7 | GO:0000321 | re-entry into mitotic cell cycle after pheromone arrest(GO:0000321) |
| 0.1 | 0.6 | GO:0006829 | zinc II ion transport(GO:0006829) |
| 0.1 | 0.5 | GO:0007532 | regulation of mating-type specific transcription, DNA-templated(GO:0007532) |
| 0.1 | 0.8 | GO:0006817 | phosphate ion transport(GO:0006817) |
| 0.1 | 0.2 | GO:1904668 | positive regulation of ubiquitin protein ligase activity(GO:1904668) |
| 0.1 | 0.3 | GO:0009410 | response to xenobiotic stimulus(GO:0009410) |
| 0.1 | 0.2 | GO:2000217 | regulation of invasive growth in response to glucose limitation(GO:2000217) |
| 0.1 | 0.5 | GO:0097034 | mitochondrial respiratory chain complex IV biogenesis(GO:0097034) |
| 0.1 | 0.2 | GO:0071850 | mitotic cell cycle arrest in response to pheromone(GO:0000751) mitotic cell cycle arrest(GO:0071850) |
| 0.1 | 0.4 | GO:0006591 | ornithine metabolic process(GO:0006591) |
| 0.1 | 0.6 | GO:0009065 | glutamine family amino acid catabolic process(GO:0009065) |
| 0.1 | 1.2 | GO:0006895 | Golgi to endosome transport(GO:0006895) |
| 0.1 | 0.3 | GO:0032973 | amino acid export(GO:0032973) |
| 0.1 | 0.2 | GO:0071630 | nucleus-associated proteasomal ubiquitin-dependent protein catabolic process(GO:0071630) |
| 0.1 | 0.8 | GO:0030174 | regulation of DNA-dependent DNA replication initiation(GO:0030174) |
| 0.1 | 0.6 | GO:0010525 | regulation of transposition, RNA-mediated(GO:0010525) |
| 0.1 | 0.2 | GO:0042407 | cristae formation(GO:0042407) |
| 0.1 | 0.1 | GO:0010676 | positive regulation of cellular carbohydrate metabolic process(GO:0010676) positive regulation of carbohydrate metabolic process(GO:0045913) |
| 0.1 | 0.2 | GO:0006596 | polyamine biosynthetic process(GO:0006596) spermidine metabolic process(GO:0008216) |
| 0.1 | 0.2 | GO:0001308 | progressive alteration of chromatin involved in replicative cell aging(GO:0001304) negative regulation of chromatin silencing involved in replicative cell aging(GO:0001308) |
| 0.1 | 0.2 | GO:0032077 | positive regulation of deoxyribonuclease activity(GO:0032077) positive regulation of endodeoxyribonuclease activity(GO:0032079) |
| 0.1 | 0.7 | GO:0008360 | regulation of cell shape(GO:0008360) |
| 0.1 | 0.2 | GO:0006655 | phosphatidylglycerol biosynthetic process(GO:0006655) |
| 0.1 | 0.2 | GO:0071931 | positive regulation of transcription involved in G1/S transition of mitotic cell cycle(GO:0071931) |
| 0.1 | 0.3 | GO:0031507 | heterochromatin assembly(GO:0031507) |
| 0.0 | 0.2 | GO:0007119 | budding cell isotropic bud growth(GO:0007119) |
| 0.0 | 0.6 | GO:0070127 | tRNA aminoacylation for mitochondrial protein translation(GO:0070127) |
| 0.0 | 0.1 | GO:0042148 | strand invasion(GO:0042148) |
| 0.0 | 0.6 | GO:0000902 | cell morphogenesis(GO:0000902) |
| 0.0 | 0.3 | GO:0051322 | anaphase(GO:0051322) |
| 0.0 | 0.7 | GO:0007266 | Rho protein signal transduction(GO:0007266) |
| 0.0 | 0.2 | GO:0000209 | protein polyubiquitination(GO:0000209) |
| 0.0 | 0.7 | GO:0006303 | double-strand break repair via nonhomologous end joining(GO:0006303) |
| 0.0 | 0.2 | GO:0000729 | meiotic DNA double-strand break processing(GO:0000706) DNA double-strand break processing(GO:0000729) |
| 0.0 | 0.1 | GO:0043328 | protein targeting to vacuole involved in ubiquitin-dependent protein catabolic process via the multivesicular body sorting pathway(GO:0043328) |
| 0.0 | 0.4 | GO:0043162 | ubiquitin-dependent protein catabolic process via the multivesicular body sorting pathway(GO:0043162) |
| 0.0 | 0.1 | GO:0000957 | mitochondrial RNA catabolic process(GO:0000957) |
| 0.0 | 0.6 | GO:0031503 | protein complex localization(GO:0031503) |
| 0.0 | 0.1 | GO:0065005 | lipid tube assembly(GO:0060988) protein-lipid complex assembly(GO:0065005) protein-lipid complex subunit organization(GO:0071825) |
| 0.0 | 0.3 | GO:0005977 | glycogen metabolic process(GO:0005977) energy reserve metabolic process(GO:0006112) |
| 0.0 | 0.2 | GO:0009967 | positive regulation of signal transduction(GO:0009967) positive regulation of signaling(GO:0023056) |
| 0.0 | 0.1 | GO:0060237 | regulation of fungal-type cell wall organization(GO:0060237) |
| 0.0 | 0.1 | GO:0000389 | mRNA 3'-splice site recognition(GO:0000389) |
| 0.0 | 0.6 | GO:0006418 | tRNA aminoacylation for protein translation(GO:0006418) |
| 0.0 | 0.4 | GO:0006301 | postreplication repair(GO:0006301) |
| 0.0 | 0.2 | GO:0006488 | dolichol-linked oligosaccharide biosynthetic process(GO:0006488) |
| 0.0 | 0.3 | GO:1901264 | carbohydrate derivative transport(GO:1901264) |
| 0.0 | 0.1 | GO:0060963 | positive regulation of ribosomal protein gene transcription from RNA polymerase II promoter(GO:0060963) |
| 0.0 | 0.0 | GO:0016320 | endoplasmic reticulum membrane fusion(GO:0016320) |
| 0.0 | 0.1 | GO:0070900 | mitochondrial tRNA modification(GO:0070900) mitochondrial RNA modification(GO:1900864) |
| 0.0 | 0.1 | GO:0006771 | riboflavin metabolic process(GO:0006771) riboflavin biosynthetic process(GO:0009231) |
| 0.0 | 0.2 | GO:0031204 | posttranslational protein targeting to membrane, translocation(GO:0031204) |
| 0.0 | 0.3 | GO:0008156 | negative regulation of DNA replication(GO:0008156) |
| 0.0 | 0.1 | GO:0018345 | protein palmitoylation(GO:0018345) |
| 0.0 | 0.1 | GO:0046466 | sphingolipid catabolic process(GO:0030149) membrane lipid catabolic process(GO:0046466) |
| 0.0 | 0.4 | GO:0042147 | retrograde transport, endosome to Golgi(GO:0042147) |
| 0.0 | 0.1 | GO:0034085 | establishment of sister chromatid cohesion(GO:0034085) establishment of mitotic sister chromatid cohesion(GO:0034087) |
| 0.0 | 0.1 | GO:0072367 | positive regulation of lipid transport(GO:0032370) regulation of sterol transport(GO:0032371) positive regulation of sterol transport(GO:0032373) positive regulation of transmembrane transport(GO:0034764) regulation of sterol import by regulation of transcription from RNA polymerase II promoter(GO:0035968) positive regulation of sterol import by positive regulation of transcription from RNA polymerase II promoter(GO:0035969) regulation of lipid transport by regulation of transcription from RNA polymerase II promoter(GO:0072367) regulation of lipid transport by positive regulation of transcription from RNA polymerase II promoter(GO:0072369) regulation of sterol import(GO:2000909) positive regulation of sterol import(GO:2000911) |
| 0.0 | 1.1 | GO:0031505 | fungal-type cell wall organization(GO:0031505) |
| 0.0 | 0.0 | GO:0030100 | regulation of endocytosis(GO:0030100) |
| 0.0 | 0.0 | GO:0038032 | termination of signal transduction(GO:0023021) termination of G-protein coupled receptor signaling pathway(GO:0038032) |
| 0.0 | 0.0 | GO:0035690 | cellular response to drug(GO:0035690) regulation of response to drug(GO:2001023) positive regulation of response to drug(GO:2001025) regulation of cellular response to drug(GO:2001038) positive regulation of cellular response to drug(GO:2001040) |
| 0.0 | 0.0 | GO:0051469 | vesicle fusion with vacuole(GO:0051469) |
| 0.0 | 0.1 | GO:0042181 | ubiquinone metabolic process(GO:0006743) ubiquinone biosynthetic process(GO:0006744) ketone biosynthetic process(GO:0042181) quinone metabolic process(GO:1901661) quinone biosynthetic process(GO:1901663) |
| 0.0 | 0.1 | GO:0018344 | protein geranylgeranylation(GO:0018344) |
Gene overrepresentation in cellular component category:
| Log-likelihood per target | Total log-likelihood | Term | Description |
|---|---|---|---|
| 1.7 | 20.2 | GO:0005782 | peroxisomal matrix(GO:0005782) microbody lumen(GO:0031907) |
| 1.5 | 13.9 | GO:0045275 | mitochondrial respiratory chain complex III(GO:0005750) respiratory chain complex III(GO:0045275) |
| 1.2 | 4.9 | GO:0016602 | CCAAT-binding factor complex(GO:0016602) |
| 1.2 | 3.5 | GO:0031422 | RecQ helicase-Topo III complex(GO:0031422) |
| 0.9 | 14.2 | GO:0045259 | mitochondrial proton-transporting ATP synthase complex(GO:0005753) proton-transporting ATP synthase complex(GO:0045259) |
| 0.8 | 4.7 | GO:0034045 | pre-autophagosomal structure membrane(GO:0034045) |
| 0.6 | 5.1 | GO:0042597 | periplasmic space(GO:0042597) |
| 0.6 | 35.0 | GO:0005777 | peroxisome(GO:0005777) microbody(GO:0042579) |
| 0.6 | 1.7 | GO:0046930 | pore complex(GO:0046930) |
| 0.5 | 9.5 | GO:0070469 | respiratory chain(GO:0070469) |
| 0.5 | 3.1 | GO:0032777 | Piccolo NuA4 histone acetyltransferase complex(GO:0032777) |
| 0.5 | 3.1 | GO:0032126 | eisosome(GO:0032126) |
| 0.4 | 1.2 | GO:0000015 | phosphopyruvate hydratase complex(GO:0000015) |
| 0.4 | 5.3 | GO:0005619 | ascospore wall(GO:0005619) |
| 0.4 | 1.2 | GO:0009353 | mitochondrial alpha-ketoglutarate dehydrogenase complex(GO:0005947) mitochondrial oxoglutarate dehydrogenase complex(GO:0009353) dihydrolipoyl dehydrogenase complex(GO:0045240) oxoglutarate dehydrogenase complex(GO:0045252) |
| 0.4 | 1.6 | GO:0008623 | CHRAC(GO:0008623) |
| 0.4 | 4.1 | GO:0005832 | chaperonin-containing T-complex(GO:0005832) |
| 0.3 | 2.4 | GO:0034657 | GID complex(GO:0034657) |
| 0.3 | 5.0 | GO:0033698 | Rpd3L complex(GO:0033698) |
| 0.3 | 0.9 | GO:0046658 | anchored component of plasma membrane(GO:0046658) |
| 0.3 | 1.4 | GO:0033100 | NuA3 histone acetyltransferase complex(GO:0033100) H3 histone acetyltransferase complex(GO:0070775) |
| 0.3 | 41.7 | GO:0005743 | mitochondrial inner membrane(GO:0005743) |
| 0.2 | 1.0 | GO:0031932 | TORC2 complex(GO:0031932) |
| 0.2 | 1.8 | GO:0030915 | Smc5-Smc6 complex(GO:0030915) |
| 0.2 | 0.7 | GO:0032585 | multivesicular body membrane(GO:0032585) |
| 0.2 | 0.7 | GO:0000113 | nucleotide-excision repair factor 4 complex(GO:0000113) |
| 0.2 | 3.3 | GO:0019897 | extrinsic component of plasma membrane(GO:0019897) |
| 0.2 | 0.9 | GO:0005770 | late endosome(GO:0005770) |
| 0.2 | 0.6 | GO:0030128 | AP-2 adaptor complex(GO:0030122) clathrin coat of endocytic vesicle(GO:0030128) endocytic vesicle(GO:0030139) endocytic vesicle membrane(GO:0030666) clathrin-coated endocytic vesicle membrane(GO:0030669) clathrin-coated endocytic vesicle(GO:0045334) |
| 0.2 | 1.1 | GO:0000112 | nucleotide-excision repair factor 3 complex(GO:0000112) |
| 0.1 | 0.4 | GO:0032177 | split septin rings(GO:0032176) cellular bud neck split septin rings(GO:0032177) |
| 0.1 | 0.4 | GO:0000111 | nucleotide-excision repair factor 2 complex(GO:0000111) |
| 0.1 | 0.8 | GO:0033263 | CORVET complex(GO:0033263) |
| 0.1 | 0.4 | GO:0031235 | intrinsic component of the cytoplasmic side of the plasma membrane(GO:0031235) |
| 0.1 | 0.3 | GO:0035649 | Nrd1 complex(GO:0035649) |
| 0.1 | 0.6 | GO:0044614 | nuclear pore cytoplasmic filaments(GO:0044614) |
| 0.1 | 0.6 | GO:0035361 | Cul8-RING ubiquitin ligase complex(GO:0035361) |
| 0.1 | 0.9 | GO:0000164 | protein phosphatase type 1 complex(GO:0000164) |
| 0.1 | 0.3 | GO:0009898 | cytoplasmic side of plasma membrane(GO:0009898) |
| 0.1 | 1.0 | GO:0000795 | synaptonemal complex(GO:0000795) |
| 0.1 | 3.2 | GO:0005758 | mitochondrial intermembrane space(GO:0005758) |
| 0.1 | 0.7 | GO:0016272 | prefoldin complex(GO:0016272) |
| 0.1 | 0.4 | GO:0098552 | side of membrane(GO:0098552) cytoplasmic side of membrane(GO:0098562) |
| 0.1 | 1.7 | GO:0048471 | perinuclear region of cytoplasm(GO:0048471) |
| 0.1 | 1.5 | GO:0000152 | nuclear ubiquitin ligase complex(GO:0000152) |
| 0.1 | 0.3 | GO:0019867 | outer membrane(GO:0019867) organelle outer membrane(GO:0031968) |
| 0.1 | 0.4 | GO:0070210 | Rpd3L-Expanded complex(GO:0070210) |
| 0.1 | 1.5 | GO:0009295 | nucleoid(GO:0009295) mitochondrial nucleoid(GO:0042645) |
| 0.1 | 1.7 | GO:0000407 | pre-autophagosomal structure(GO:0000407) |
| 0.1 | 49.0 | GO:0005739 | mitochondrion(GO:0005739) |
| 0.1 | 1.7 | GO:0042764 | prospore membrane(GO:0005628) intracellular immature spore(GO:0042763) ascospore-type prospore(GO:0042764) |
| 0.1 | 4.1 | GO:0009277 | fungal-type cell wall(GO:0009277) |
| 0.1 | 0.7 | GO:0005769 | early endosome(GO:0005769) |
| 0.1 | 1.2 | GO:0005811 | lipid particle(GO:0005811) |
| 0.1 | 0.2 | GO:0031205 | endoplasmic reticulum Sec complex(GO:0031205) Sec62/Sec63 complex(GO:0031207) |
| 0.1 | 0.7 | GO:0000812 | Swr1 complex(GO:0000812) |
| 0.1 | 0.2 | GO:0033309 | SBF transcription complex(GO:0033309) |
| 0.1 | 0.6 | GO:0098827 | endoplasmic reticulum tubular network(GO:0071782) endoplasmic reticulum subcompartment(GO:0098827) |
| 0.0 | 0.1 | GO:0031463 | Cul3-RING ubiquitin ligase complex(GO:0031463) |
| 0.0 | 0.2 | GO:0097196 | Shu complex(GO:0097196) |
| 0.0 | 0.7 | GO:0016592 | mediator complex(GO:0016592) |
| 0.0 | 0.2 | GO:0098857 | membrane raft(GO:0045121) membrane microdomain(GO:0098857) |
| 0.0 | 0.2 | GO:0019866 | organelle inner membrane(GO:0019866) |
| 0.0 | 1.3 | GO:0044440 | endosomal part(GO:0044440) |
| 0.0 | 0.1 | GO:0032545 | CURI complex(GO:0032545) |
| 0.0 | 0.2 | GO:0030015 | CCR4-NOT core complex(GO:0030015) |
| 0.0 | 0.1 | GO:0000153 | cytoplasmic ubiquitin ligase complex(GO:0000153) ER ubiquitin ligase complex(GO:0000835) Hrd1p ubiquitin ligase complex(GO:0000836) Hrd1p ubiquitin ligase ERAD-L complex(GO:0000839) |
| 0.0 | 0.1 | GO:0016281 | eukaryotic translation initiation factor 4F complex(GO:0016281) |
| 0.0 | 0.1 | GO:0071014 | post-mRNA release spliceosomal complex(GO:0071014) |
Gene overrepresentation in molecular function category:
| Log-likelihood per target | Total log-likelihood | Term | Description |
|---|---|---|---|
| 4.6 | 18.5 | GO:0015556 | C4-dicarboxylate transmembrane transporter activity(GO:0015556) |
| 3.6 | 10.9 | GO:0004450 | isocitrate dehydrogenase (NADP+) activity(GO:0004450) |
| 2.9 | 11.7 | GO:0016661 | oxidoreductase activity, acting on other nitrogenous compounds as donors(GO:0016661) |
| 2.8 | 8.4 | GO:0016406 | carnitine O-acetyltransferase activity(GO:0004092) carnitine O-acyltransferase activity(GO:0016406) |
| 2.0 | 8.0 | GO:0004396 | hexokinase activity(GO:0004396) |
| 2.0 | 7.9 | GO:0005537 | mannose binding(GO:0005537) |
| 1.8 | 5.5 | GO:0050833 | pyruvate transmembrane transporter activity(GO:0050833) |
| 1.8 | 7.3 | GO:0015193 | L-proline transmembrane transporter activity(GO:0015193) |
| 1.7 | 8.3 | GO:0050308 | sugar-phosphatase activity(GO:0050308) |
| 1.4 | 6.8 | GO:0015295 | solute:proton symporter activity(GO:0015295) |
| 1.3 | 6.7 | GO:0008198 | ferrous iron binding(GO:0008198) |
| 1.2 | 3.7 | GO:0005536 | glucose binding(GO:0005536) |
| 1.2 | 2.4 | GO:0015151 | alpha-glucoside transmembrane transporter activity(GO:0015151) glucoside transmembrane transporter activity(GO:0042947) |
| 1.2 | 3.6 | GO:0016289 | CoA hydrolase activity(GO:0016289) |
| 1.1 | 4.4 | GO:0004737 | pyruvate decarboxylase activity(GO:0004737) |
| 1.0 | 10.9 | GO:0046933 | proton-transporting ATP synthase activity, rotational mechanism(GO:0046933) |
| 0.9 | 7.6 | GO:0016681 | ubiquinol-cytochrome-c reductase activity(GO:0008121) oxidoreductase activity, acting on diphenols and related substances as donors(GO:0016679) oxidoreductase activity, acting on diphenols and related substances as donors, cytochrome as acceptor(GO:0016681) |
| 0.9 | 10.1 | GO:0046912 | transferase activity, transferring acyl groups, acyl groups converted into alkyl on transfer(GO:0046912) |
| 0.9 | 0.9 | GO:0005346 | purine ribonucleotide transmembrane transporter activity(GO:0005346) |
| 0.8 | 2.3 | GO:0047066 | phospholipid-hydroperoxide glutathione peroxidase activity(GO:0047066) |
| 0.8 | 2.3 | GO:0016405 | CoA-ligase activity(GO:0016405) acid-thiol ligase activity(GO:0016878) |
| 0.8 | 7.6 | GO:0015205 | nucleobase transmembrane transporter activity(GO:0015205) |
| 0.7 | 3.6 | GO:0000099 | sulfur amino acid transmembrane transporter activity(GO:0000099) |
| 0.7 | 2.1 | GO:0015927 | alpha,alpha-trehalase activity(GO:0004555) trehalase activity(GO:0015927) |
| 0.7 | 2.1 | GO:0031957 | very long-chain fatty acid-CoA ligase activity(GO:0031957) |
| 0.7 | 2.7 | GO:0015343 | siderophore transmembrane transporter activity(GO:0015343) iron chelate transmembrane transporter activity(GO:0015603) siderophore transporter activity(GO:0042927) |
| 0.6 | 1.3 | GO:0015038 | peptide disulfide oxidoreductase activity(GO:0015037) glutathione disulfide oxidoreductase activity(GO:0015038) |
| 0.6 | 6.0 | GO:0035064 | methylated histone binding(GO:0035064) |
| 0.6 | 11.4 | GO:0016769 | transaminase activity(GO:0008483) transferase activity, transferring nitrogenous groups(GO:0016769) |
| 0.6 | 3.5 | GO:0000400 | four-way junction DNA binding(GO:0000400) |
| 0.6 | 1.7 | GO:0022829 | anion channel activity(GO:0005253) voltage-gated anion channel activity(GO:0008308) porin activity(GO:0015288) wide pore channel activity(GO:0022829) |
| 0.6 | 1.7 | GO:0051864 | histone demethylase activity (H3-K36 specific)(GO:0051864) |
| 0.5 | 7.1 | GO:0015297 | antiporter activity(GO:0015297) |
| 0.5 | 4.5 | GO:0004129 | cytochrome-c oxidase activity(GO:0004129) heme-copper terminal oxidase activity(GO:0015002) oxidoreductase activity, acting on a heme group of donors(GO:0016675) oxidoreductase activity, acting on a heme group of donors, oxygen as acceptor(GO:0016676) |
| 0.5 | 0.5 | GO:0005078 | MAP-kinase scaffold activity(GO:0005078) signaling adaptor activity(GO:0035591) |
| 0.5 | 4.3 | GO:0016668 | oxidoreductase activity, acting on a sulfur group of donors, NAD(P) as acceptor(GO:0016668) |
| 0.5 | 2.8 | GO:0016888 | endodeoxyribonuclease activity, producing 5'-phosphomonoesters(GO:0016888) |
| 0.5 | 4.2 | GO:0016628 | oxidoreductase activity, acting on the CH-CH group of donors, NAD or NADP as acceptor(GO:0016628) |
| 0.5 | 4.1 | GO:0004712 | protein serine/threonine/tyrosine kinase activity(GO:0004712) |
| 0.4 | 3.1 | GO:0008379 | thioredoxin peroxidase activity(GO:0008379) peroxiredoxin activity(GO:0051920) |
| 0.4 | 3.8 | GO:0016723 | ferric-chelate reductase activity(GO:0000293) oxidoreductase activity, oxidizing metal ions, NAD or NADP as acceptor(GO:0016723) |
| 0.4 | 1.3 | GO:0008972 | hydroxymethylpyrimidine kinase activity(GO:0008902) phosphomethylpyrimidine kinase activity(GO:0008972) |
| 0.4 | 0.8 | GO:0004364 | glutathione transferase activity(GO:0004364) |
| 0.4 | 1.2 | GO:0004634 | phosphopyruvate hydratase activity(GO:0004634) |
| 0.4 | 2.1 | GO:0016408 | C-acyltransferase activity(GO:0016408) |
| 0.4 | 2.1 | GO:0002161 | aminoacyl-tRNA editing activity(GO:0002161) |
| 0.4 | 2.9 | GO:0016684 | peroxidase activity(GO:0004601) oxidoreductase activity, acting on peroxide as acceptor(GO:0016684) |
| 0.4 | 3.2 | GO:0015293 | symporter activity(GO:0015293) |
| 0.4 | 5.2 | GO:0044389 | ubiquitin protein ligase binding(GO:0031625) ubiquitin-like protein ligase binding(GO:0044389) |
| 0.4 | 4.8 | GO:0098811 | transcriptional activator activity, RNA polymerase II transcription factor binding(GO:0001190) transcriptional repressor activity, RNA polymerase II activating transcription factor binding(GO:0098811) |
| 0.4 | 1.9 | GO:0008177 | succinate dehydrogenase (ubiquinone) activity(GO:0008177) |
| 0.4 | 1.1 | GO:0008897 | holo-[acyl-carrier-protein] synthase activity(GO:0008897) |
| 0.4 | 4.4 | GO:0001103 | RNA polymerase II repressing transcription factor binding(GO:0001103) |
| 0.4 | 5.3 | GO:0008519 | ammonium transmembrane transporter activity(GO:0008519) |
| 0.3 | 4.8 | GO:0001102 | RNA polymerase II activating transcription factor binding(GO:0001102) |
| 0.3 | 1.3 | GO:0008172 | S-methyltransferase activity(GO:0008172) |
| 0.3 | 0.9 | GO:0070569 | uridylyltransferase activity(GO:0070569) |
| 0.3 | 3.1 | GO:0004888 | transmembrane signaling receptor activity(GO:0004888) signaling receptor activity(GO:0038023) transmembrane receptor activity(GO:0099600) |
| 0.3 | 3.0 | GO:0043495 | protein anchor(GO:0043495) |
| 0.3 | 5.4 | GO:0016836 | hydro-lyase activity(GO:0016836) |
| 0.3 | 12.9 | GO:0016820 | hydrolase activity, acting on acid anhydrides, catalyzing transmembrane movement of substances(GO:0016820) ATPase activity, coupled to transmembrane movement of substances(GO:0042626) |
| 0.3 | 5.8 | GO:0051287 | NAD binding(GO:0051287) |
| 0.3 | 1.6 | GO:0004029 | aldehyde dehydrogenase (NAD) activity(GO:0004029) aldehyde dehydrogenase [NAD(P)+] activity(GO:0004030) |
| 0.3 | 0.8 | GO:0004584 | dolichyl-phosphate-mannose-glycolipid alpha-mannosyltransferase activity(GO:0004584) |
| 0.2 | 1.7 | GO:0000149 | SNARE binding(GO:0000149) |
| 0.2 | 2.1 | GO:0001085 | RNA polymerase II transcription factor binding(GO:0001085) |
| 0.2 | 0.7 | GO:0008137 | NADH dehydrogenase activity(GO:0003954) NADH dehydrogenase (ubiquinone) activity(GO:0008137) NADH dehydrogenase (quinone) activity(GO:0050136) |
| 0.2 | 1.6 | GO:0000774 | adenyl-nucleotide exchange factor activity(GO:0000774) |
| 0.2 | 3.4 | GO:0042803 | protein homodimerization activity(GO:0042803) |
| 0.2 | 1.8 | GO:0004190 | aspartic-type endopeptidase activity(GO:0004190) aspartic-type peptidase activity(GO:0070001) |
| 0.2 | 0.6 | GO:0016417 | S-acyltransferase activity(GO:0016417) |
| 0.2 | 2.4 | GO:0004702 | receptor signaling protein serine/threonine kinase activity(GO:0004702) |
| 0.2 | 2.6 | GO:0008081 | phosphoric diester hydrolase activity(GO:0008081) |
| 0.2 | 1.2 | GO:0016721 | superoxide dismutase activity(GO:0004784) oxidoreductase activity, acting on superoxide radicals as acceptor(GO:0016721) |
| 0.2 | 1.0 | GO:0018456 | aryl-alcohol dehydrogenase (NAD+) activity(GO:0018456) |
| 0.2 | 1.1 | GO:0000014 | single-stranded DNA endodeoxyribonuclease activity(GO:0000014) |
| 0.2 | 12.8 | GO:0051082 | unfolded protein binding(GO:0051082) |
| 0.2 | 0.3 | GO:1901474 | azole transmembrane transporter activity(GO:1901474) |
| 0.2 | 0.5 | GO:0016813 | hydrolase activity, acting on carbon-nitrogen (but not peptide) bonds, in linear amidines(GO:0016813) |
| 0.2 | 0.5 | GO:0004088 | carbamoyl-phosphate synthase (glutamine-hydrolyzing) activity(GO:0004088) |
| 0.2 | 0.5 | GO:0016624 | oxidoreductase activity, acting on the aldehyde or oxo group of donors, disulfide as acceptor(GO:0016624) |
| 0.2 | 3.5 | GO:0016298 | lipase activity(GO:0016298) |
| 0.2 | 2.2 | GO:0051539 | 4 iron, 4 sulfur cluster binding(GO:0051539) |
| 0.2 | 0.6 | GO:0003916 | DNA topoisomerase activity(GO:0003916) |
| 0.1 | 0.6 | GO:0000268 | peroxisome targeting sequence binding(GO:0000268) |
| 0.1 | 1.7 | GO:0020037 | heme binding(GO:0020037) tetrapyrrole binding(GO:0046906) |
| 0.1 | 1.2 | GO:0005548 | phospholipid transporter activity(GO:0005548) |
| 0.1 | 1.4 | GO:0016780 | phosphotransferase activity, for other substituted phosphate groups(GO:0016780) |
| 0.1 | 0.4 | GO:0004128 | cytochrome-b5 reductase activity, acting on NAD(P)H(GO:0004128) |
| 0.1 | 1.0 | GO:0005385 | zinc ion transmembrane transporter activity(GO:0005385) |
| 0.1 | 0.6 | GO:0004075 | biotin carboxylase activity(GO:0004075) |
| 0.1 | 0.5 | GO:0004032 | alditol:NADP+ 1-oxidoreductase activity(GO:0004032) |
| 0.1 | 1.4 | GO:0016646 | oxidoreductase activity, acting on the CH-NH group of donors, NAD or NADP as acceptor(GO:0016646) |
| 0.1 | 4.8 | GO:0001077 | transcriptional activator activity, RNA polymerase II core promoter proximal region sequence-specific binding(GO:0001077) transcriptional activator activity, RNA polymerase II transcription regulatory region sequence-specific binding(GO:0001228) |
| 0.1 | 0.3 | GO:0008169 | C-methyltransferase activity(GO:0008169) |
| 0.1 | 0.5 | GO:0061659 | ubiquitin protein ligase activity(GO:0061630) ubiquitin-like protein ligase activity(GO:0061659) |
| 0.1 | 9.4 | GO:0004672 | protein kinase activity(GO:0004672) |
| 0.1 | 2.1 | GO:0016881 | acid-amino acid ligase activity(GO:0016881) |
| 0.1 | 0.4 | GO:0008601 | protein phosphatase type 2A regulator activity(GO:0008601) |
| 0.1 | 0.3 | GO:0043139 | 5'-3' DNA helicase activity(GO:0043139) ATP-dependent 5'-3' DNA helicase activity(GO:0043141) |
| 0.1 | 0.4 | GO:0016597 | amino acid binding(GO:0016597) |
| 0.1 | 0.2 | GO:0043812 | phosphatidylinositol phosphate 4-phosphatase activity(GO:0034596) phosphatidylinositol-4-phosphate phosphatase activity(GO:0043812) |
| 0.1 | 0.2 | GO:0045118 | azole transporter activity(GO:0045118) |
| 0.1 | 2.2 | GO:0004857 | enzyme inhibitor activity(GO:0004857) |
| 0.1 | 0.3 | GO:0019776 | Atg8 ligase activity(GO:0019776) |
| 0.1 | 1.8 | GO:0003684 | damaged DNA binding(GO:0003684) |
| 0.1 | 0.2 | GO:0003840 | gamma-glutamyltransferase activity(GO:0003840) |
| 0.1 | 0.4 | GO:0000026 | alpha-1,2-mannosyltransferase activity(GO:0000026) |
| 0.1 | 2.2 | GO:0046983 | protein dimerization activity(GO:0046983) |
| 0.1 | 0.6 | GO:0003714 | transcription corepressor activity(GO:0003714) |
| 0.1 | 0.3 | GO:0046970 | NAD-dependent histone deacetylase activity(GO:0017136) histone deacetylase activity (H3-K14 specific)(GO:0031078) NAD-dependent histone deacetylase activity (H3-K14 specific)(GO:0032041) histone deacetylase activity (H3-K9 specific)(GO:0032129) histone deacetylase activity (H4-K16 specific)(GO:0034739) NAD-dependent protein deacetylase activity(GO:0034979) NAD-dependent histone deacetylase activity (H3-K9 specific)(GO:0046969) NAD-dependent histone deacetylase activity (H4-K16 specific)(GO:0046970) NAD-dependent histone deacetylase activity (H3-K18 specific)(GO:0097372) |
| 0.1 | 1.1 | GO:0008374 | O-acyltransferase activity(GO:0008374) |
| 0.1 | 0.5 | GO:0001671 | ATPase activator activity(GO:0001671) ATPase regulator activity(GO:0060590) |
| 0.1 | 0.2 | GO:0070567 | cytidylyltransferase activity(GO:0070567) |
| 0.1 | 1.1 | GO:0004843 | thiol-dependent ubiquitin-specific protease activity(GO:0004843) thiol-dependent ubiquitinyl hydrolase activity(GO:0036459) ubiquitinyl hydrolase activity(GO:0101005) |
| 0.1 | 0.3 | GO:0004652 | polynucleotide adenylyltransferase activity(GO:0004652) |
| 0.0 | 0.3 | GO:0005089 | Rho guanyl-nucleotide exchange factor activity(GO:0005089) |
| 0.0 | 0.1 | GO:0000150 | recombinase activity(GO:0000150) |
| 0.0 | 0.7 | GO:0003713 | transcription coactivator activity(GO:0003713) |
| 0.0 | 0.3 | GO:0015103 | inorganic anion transmembrane transporter activity(GO:0015103) |
| 0.0 | 0.1 | GO:0070336 | flap-structured DNA binding(GO:0070336) |
| 0.0 | 0.3 | GO:0005381 | iron ion transmembrane transporter activity(GO:0005381) |
| 0.0 | 0.5 | GO:0016831 | carboxy-lyase activity(GO:0016831) |
| 0.0 | 0.2 | GO:0008028 | monocarboxylic acid transmembrane transporter activity(GO:0008028) |
| 0.0 | 0.1 | GO:0032183 | SUMO binding(GO:0032183) |
| 0.0 | 0.7 | GO:0003688 | DNA replication origin binding(GO:0003688) |
| 0.0 | 0.4 | GO:0045182 | translation regulator activity(GO:0045182) |
| 0.0 | 0.3 | GO:1901505 | carbohydrate derivative transporter activity(GO:1901505) |
| 0.0 | 0.4 | GO:0005509 | calcium ion binding(GO:0005509) |
| 0.0 | 0.2 | GO:0005496 | steroid binding(GO:0005496) sterol binding(GO:0032934) |
| 0.0 | 0.1 | GO:0016409 | palmitoyltransferase activity(GO:0016409) |
| 0.0 | 0.3 | GO:0015926 | glucosidase activity(GO:0015926) |
| 0.0 | 0.1 | GO:0050291 | sphingosine N-acyltransferase activity(GO:0050291) |
| 0.0 | 0.2 | GO:0035251 | UDP-glucosyltransferase activity(GO:0035251) |
| 0.0 | 0.2 | GO:0004222 | metalloendopeptidase activity(GO:0004222) |
| 0.0 | 0.2 | GO:0022804 | active transmembrane transporter activity(GO:0022804) |
| 0.0 | 0.1 | GO:0004661 | protein geranylgeranyltransferase activity(GO:0004661) |
Gene overrepresentation in curated gene sets: canonical pathways category:
| Log-likelihood per target | Total log-likelihood | Term | Description |
|---|---|---|---|
| 0.5 | 1.6 | PID HNF3B PATHWAY | FOXA2 and FOXA3 transcription factor networks |
| 0.5 | 1.5 | NABA ECM REGULATORS | Genes encoding enzymes and their regulators involved in the remodeling of the extracellular matrix |
| 0.5 | 2.3 | PID P53 DOWNSTREAM PATHWAY | Direct p53 effectors |
| 0.4 | 3.5 | PID FANCONI PATHWAY | Fanconi anemia pathway |
| 0.2 | 0.7 | PID DELTA NP63 PATHWAY | Validated transcriptional targets of deltaNp63 isoforms |
| 0.2 | 0.6 | PID NOTCH PATHWAY | Notch signaling pathway |
| 0.1 | 0.3 | PID AR PATHWAY | Coregulation of Androgen receptor activity |
| 0.1 | 116.4 | PID TELOMERASE PATHWAY | Regulation of Telomerase |
| 0.1 | 0.1 | PID ATF2 PATHWAY | ATF-2 transcription factor network |
| 0.0 | 0.3 | NABA SECRETED FACTORS | Genes encoding secreted soluble factors |
Gene overrepresentation in curated gene sets: REACTOME pathways category:
| Log-likelihood per target | Total log-likelihood | Term | Description |
|---|---|---|---|
| 1.8 | 5.3 | REACTOME MEIOTIC SYNAPSIS | Genes involved in Meiotic Synapsis |
| 1.7 | 5.0 | REACTOME RESPIRATORY ELECTRON TRANSPORT | Genes involved in Respiratory electron transport |
| 0.9 | 7.8 | REACTOME GLUCONEOGENESIS | Genes involved in Gluconeogenesis |
| 0.2 | 0.7 | REACTOME DOWNREGULATION OF ERBB2 ERBB3 SIGNALING | Genes involved in Downregulation of ERBB2:ERBB3 signaling |
| 0.2 | 1.0 | REACTOME HEMOSTASIS | Genes involved in Hemostasis |
| 0.2 | 0.6 | REACTOME DNA REPAIR | Genes involved in DNA Repair |
| 0.2 | 0.3 | REACTOME RIG I MDA5 MEDIATED INDUCTION OF IFN ALPHA BETA PATHWAYS | Genes involved in RIG-I/MDA5 mediated induction of IFN-alpha/beta pathways |
| 0.1 | 0.4 | REACTOME TOLL RECEPTOR CASCADES | Genes involved in Toll Receptor Cascades |
| 0.1 | 112.2 | REACTOME CHONDROITIN SULFATE BIOSYNTHESIS | Genes involved in Chondroitin sulfate biosynthesis |
| 0.1 | 0.2 | REACTOME SYNTHESIS OF PIPS AT THE LATE ENDOSOME MEMBRANE | Genes involved in Synthesis of PIPs at the late endosome membrane |
| 0.0 | 0.3 | REACTOME TRANSMEMBRANE TRANSPORT OF SMALL MOLECULES | Genes involved in Transmembrane transport of small molecules |
| 0.0 | 0.2 | REACTOME BIOSYNTHESIS OF THE N GLYCAN PRECURSOR DOLICHOL LIPID LINKED OLIGOSACCHARIDE LLO AND TRANSFER TO A NASCENT PROTEIN | Genes involved in Biosynthesis of the N-glycan precursor (dolichol lipid-linked oligosaccharide, LLO) and transfer to a nascent protein |