Results for STB5
Z-value: 0.38
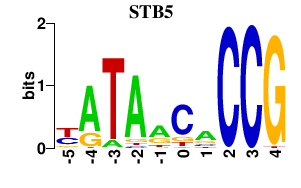
Motif logo
Transcription factors associated with STB5
| Gene Symbol | Gene ID | Gene Info |
|---|---|---|
|
STB5
|
S000001221 | Transcription factor |
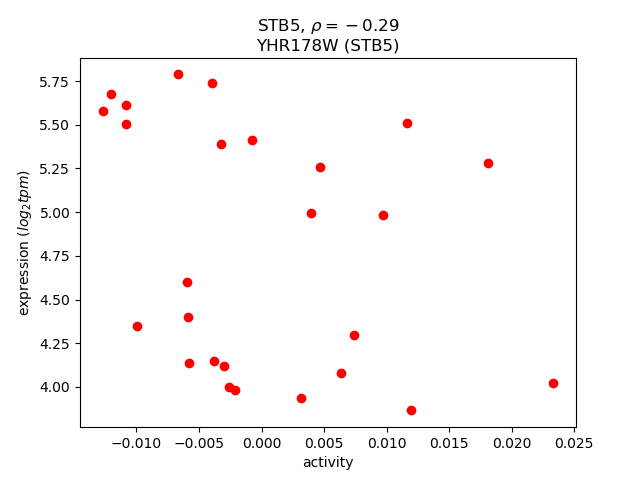
Activity-expression correlation:
Activity profile of STB5 motif
Sorted Z-values of STB5 motif
| Promoter | Log-likelihood | Transcript | Gene | Gene Info |
|---|---|---|---|---|
| YOR315W | 1.39 |
SFG1
|
Nuclear protein, putative transcription factor required for growth of superficial pseudohyphae (which do not invade the agar substrate) but not for invasive pseudohyphal growth; may act together with Phd1p; potential Cdc28p substrate |
|
| YJR094W-A | 1.32 |
RPL43B
|
Protein component of the large (60S) ribosomal subunit, identical to Rpl43Ap and has similarity to rat L37a ribosomal protein |
|
| YDR345C | 0.96 |
HXT3
|
Low affinity glucose transporter of the major facilitator superfamily, expression is induced in low or high glucose conditions |
|
| YFR055W | 0.94 |
IRC7
|
Putative cystathionine beta-lyase; involved in copper ion homeostasis and sulfur metabolism; null mutant displays increased levels of spontaneous Rad52p foci; expression induced by nitrogen limitation in a GLN3, GAT1-dependent manner |
|
| YDR033W | 0.90 |
MRH1
|
Protein that localizes primarily to the plasma membrane, also found at the nuclear envelope; the authentic, non-tagged protein is detected in mitochondria in a phosphorylated state; has similarity to Hsp30p and Yro2p |
|
| YLR154W-A | 0.86 |
Dubious open reading frame unlikely to encode a protein; encoded within the the 25S rRNA gene on the opposite strand |
||
| YLR154W-B | 0.84 |
Dubious open reading frame unlikely to encode a protein; encoded within the the 25S rRNA gene on the opposite strand |
||
| YDR508C | 0.79 |
GNP1
|
High-affinity glutamine permease, also transports Leu, Ser, Thr, Cys, Met and Asn; expression is fully dependent on Grr1p and modulated by the Ssy1p-Ptr3p-Ssy5p (SPS) sensor of extracellular amino acids |
|
| YHR181W | 0.78 |
SVP26
|
Integral membrane protein of the early Golgi apparatus and endoplasmic reticulum, involved in COP II vesicle transport; may also function to promote retention of proteins in the early Golgi compartment |
|
| YHR174W | 0.77 |
ENO2
|
Enolase II, a phosphopyruvate hydratase that catalyzes the conversion of 2-phosphoglycerate to phosphoenolpyruvate during glycolysis and the reverse reaction during gluconeogenesis; expression is induced in response to glucose |
|
| YKL219W | 0.73 |
COS9
|
Protein of unknown function, member of the DUP380 subfamily of conserved, often subtelomerically-encoded proteins |
|
| YDR509W | 0.72 |
Dubious open reading frame unlikely to encode a functional protein, based on available experimental and comparative sequence data |
||
| YMR083W | 0.69 |
ADH3
|
Mitochondrial alcohol dehydrogenase isozyme III; involved in the shuttling of mitochondrial NADH to the cytosol under anaerobic conditions and ethanol production |
|
| YJL153C | 0.69 |
INO1
|
Inositol 1-phosphate synthase, involved in synthesis of inositol phosphates and inositol-containing phospholipids; transcription is coregulated with other phospholipid biosynthetic genes by Ino2p and Ino4p, which bind the UASINO DNA element |
|
| YDR098C | 0.63 |
GRX3
|
Hydroperoxide and superoxide-radical responsive glutathione-dependent oxidoreductase; monothiol glutaredoxin subfamily member along with Grx4p and Grx5p; protects cells from oxidative damage |
|
| YHR183W | 0.63 |
GND1
|
6-phosphogluconate dehydrogenase (decarboxylating), catalyzes an NADPH regenerating reaction in the pentose phosphate pathway; required for growth on D-glucono-delta-lactone and adaptation to oxidative stress |
|
| YGR251W | 0.62 |
Putative protein of unknown function; deletion mutant has defects in pre-rRNA processing; green fluorescent protein (GFP)-fusion protein localizes to both the nucleus and the nucleolus; YGR251W is an essential gene |
||
| YBR158W | 0.59 |
AMN1
|
Protein required for daughter cell separation, multiple mitotic checkpoints, and chromosome stability; contains 12 degenerate leucine-rich repeat motifs; expression is induced by the Mitotic Exit Network (MEN) |
|
| YOR317W | 0.53 |
FAA1
|
Long chain fatty acyl-CoA synthetase with a preference for C12:0-C16:0 fatty acids; involved in the activation of imported fatty acids; localized to both lipid particles and mitochondrial outer membrane; essential for stationary phase |
|
| YKL008C | 0.53 |
LAC1
|
Ceramide synthase component, involved in synthesis of ceramide from C26(acyl)-coenzyme A and dihydrosphingosine or phytosphingosine, functionally equivalent to Lag1p |
|
| YPR074C | 0.52 |
TKL1
|
Transketolase, similar to Tkl2p; catalyzes conversion of xylulose-5-phosphate and ribose-5-phosphate to sedoheptulose-7-phosphate and glyceraldehyde-3-phosphate in the pentose phosphate pathway; needed for synthesis of aromatic amino acids |
|
| YFR056C | 0.51 |
Dubious open reading frame unlikely to encode a protein based on available experimental and comparative sequence data; partially overlaps the uncharacterized gene YFR055W |
||
| YDR133C | 0.51 |
Dubious open reading frame unlikely to encode a protein, based on available experimental and comparative sequence data; partially overlaps YDR134C |
||
| YOR316C-A | 0.50 |
Putative protein of unknown function; identified by fungal homology and RT-PCR |
||
| YHR182C-A | 0.50 |
Dubious open reading frame unlikely to encode a functional protein, based on available experimental and comparative sequence data |
||
| YBR143C | 0.46 |
SUP45
|
Polypeptide release factor involved in translation termination; mutant form acts as a recessive omnipotent suppressor |
|
| YDR279W | 0.46 |
RNH202
|
Ribonuclease H2 subunit, required for RNase H2 activity |
|
| YNL241C | 0.46 |
ZWF1
|
Glucose-6-phosphate dehydrogenase (G6PD), catalyzes the first step of the pentose phosphate pathway; involved in adapting to oxidatve stress; homolog of the human G6PD which is deficient in patients with hemolytic anemia |
|
| YHR163W | 0.45 |
SOL3
|
6-phosphogluconolactonase, catalyzes the second step of the pentose phosphate pathway; weak multicopy suppressor of los1-1 mutation; homologous to Sol2p and Sol1p |
|
| YMR318C | 0.43 |
ADH6
|
NADPH-dependent medium chain alcohol dehydrogenase with broad substrate specificity; member of the cinnamyl family of alcohol dehydrogenases; may be involved in fusel alcohol synthesis or in aldehyde tolerance |
|
| YCR018C | 0.41 |
SRD1
|
Protein involved in the processing of pre-rRNA to mature rRNA; contains a C2/C2 zinc finger motif; srd1 mutation suppresses defects caused by the rrp1-1 mutation |
|
| YOR095C | 0.41 |
RKI1
|
Ribose-5-phosphate ketol-isomerase, catalyzes the interconversion of ribose 5-phosphate and ribulose 5-phosphate in the pentose phosphate pathway; participates in pyridoxine biosynthesis |
|
| YNL030W | 0.41 |
HHF2
|
One of two identical histone H4 proteins (see also HHF1); core histone required for chromatin assembly and chromosome function; contributes to telomeric silencing; N-terminal domain involved in maintaining genomic integrity |
|
| YHR094C | 0.41 |
HXT1
|
Low-affinity glucose transporter of the major facilitator superfamily, expression is induced by Hxk2p in the presence of glucose and repressed by Rgt1p when glucose is limiting |
|
| YMR202W | 0.41 |
ERG2
|
C-8 sterol isomerase, catalyzes the isomerization of the delta-8 double bond to the delta-7 position at an intermediate step in ergosterol biosynthesis |
|
| YDR044W | 0.39 |
HEM13
|
Coproporphyrinogen III oxidase, an oxygen requiring enzyme that catalyzes the sixth step in the heme biosynthetic pathway; localizes to the mitochondrial inner membrane; transcription is repressed by oxygen and heme (via Rox1p and Hap1p) |
|
| YJR105W | 0.39 |
ADO1
|
Adenosine kinase, required for the utilization of S-adenosylmethionine (AdoMet); may be involved in recycling adenosine produced through the methyl cycle |
|
| YLR110C | 0.38 |
CCW12
|
Cell wall mannoprotein, mutants are defective in mating and agglutination, expression is downregulated by alpha-factor |
|
| YHR180W-A | 0.37 |
Dubious open reading frame unlikely to encode a protein, based on available experimental and comparative sequence data; partially overlaps dubious ORF YHR180C-B and long terminal repeat YHRCsigma3 |
||
| YLR154W-C | 0.36 |
TAR1
|
Mitochondrial protein of unknown function, overexpression suppresses an rpo41 mutation affecting mitochondrial RNA polymerase; encoded within the 25S rRNA gene on the opposite strand |
|
| YOR314W | 0.36 |
Dubious open reading frame unlikely to encode a protein, based on available experimental and comparative sequence data |
||
| YEL066W | 0.34 |
HPA3
|
D-Amino acid N-acetyltransferase, catalyzes N-acetylation of D-amino acids through ordered bi-bi mechanism in which acetyl-CoA is first substrate bound and CoA is last product liberated; similar to Hpa2p, acetylates histones weakly in vitro |
|
| YLR411W | 0.34 |
CTR3
|
High-affinity copper transporter of the plasma membrane, acts as a trimer; gene is disrupted by a Ty2 transposon insertion in many laboratory strains of S. cerevisiae |
|
| YHR005C-A | 0.34 |
MRS11
|
Essential protein of the mitochondrial intermembrane space, forms a complex with Tim9p (TIM10 complex) that mediates insertion of hydrophobic proteins at the inner membrane, has homology to Mrs5p, which is also involved in this process |
|
| YKL096W-A | 0.34 |
CWP2
|
Covalently linked cell wall mannoprotein, major constituent of the cell wall; plays a role in stabilizing the cell wall; involved in low pH resistance; precursor is GPI-anchored |
|
| YOR028C | 0.33 |
CIN5
|
Basic leucine zipper transcriptional factor of the yAP-1 family that mediates pleiotropic drug resistance and salt tolerance; localizes constitutively to the nucleus |
|
| YJL115W | 0.33 |
ASF1
|
Nucleosome assembly factor, involved in chromatin assembly and disassembly, anti-silencing protein that causes derepression of silent loci when overexpressed; plays a role in regulating Ty1 transposition |
|
| YDL198C | 0.33 |
GGC1
|
Mitochondrial GTP/GDP transporter, essential for mitochondrial genome maintenance; has a role in mitochondrial iron transport; member of the mitochondrial carrier family |
|
| YER177W | 0.32 |
BMH1
|
14-3-3 protein, major isoform; controls proteome at post-transcriptional level, binds proteins and DNA, involved in regulation of many processes including exocytosis, vesicle transport, Ras/MAPK signaling, and rapamycin-sensitive signaling |
|
| YGR249W | 0.31 |
MGA1
|
Protein similar to heat shock transcription factor; multicopy suppressor of pseudohyphal growth defects of ammonium permease mutants |
|
| YOR361C | 0.30 |
PRT1
|
Subunit of the core complex of translation initiation factor 3(eIF3), essential for translation; part of a subcomplex (Prt1p-Rpg1p-Nip1p) that stimulates binding of mRNA and tRNA(i)Met to ribosomes |
|
| YPL028W | 0.30 |
ERG10
|
Acetyl-CoA C-acetyltransferase (acetoacetyl-CoA thiolase), cytosolic enzyme that transfers an acetyl group from one acetyl-CoA molecule to another, forming acetoacetyl-CoA; involved in the first step in mevalonate biosynthesis |
|
| YMR246W | 0.30 |
FAA4
|
Long chain fatty acyl-CoA synthetase, regulates protein modification during growth in the presence of ethanol, functions to incorporate palmitic acid into phospholipids and neutral lipids |
|
| YGR242W | 0.29 |
Dubious open reading frame unlikely to encode a protein, based on available experimental and comparative sequence data; partially overlaps the verified ORF YAP1802/YGR241C |
||
| YIR021W | 0.29 |
MRS1
|
Protein required for the splicing of two mitochondrial group I introns (BI3 in COB and AI5beta in COX1); forms a splicing complex, containing four subunits of Mrs1p and two subunits of the BI3-encoded maturase, that binds to the BI3 RNA |
|
| YEL068C | 0.28 |
Dubious open reading frame unlikely to encode a functional protein, based on available experimental and comparative sequence data |
||
| YGR108W | 0.28 |
CLB1
|
B-type cyclin involved in cell cycle progression; activates Cdc28p to promote the transition from G2 to M phase; accumulates during G2 and M, then targeted via a destruction box motif for ubiquitin-mediated degradation by the proteasome |
|
| YIL121W | 0.28 |
QDR2
|
Multidrug transporter of the major facilitator superfamily, required for resistance to quinidine, barban, cisplatin, and bleomycin; may have a role in potassium uptake |
|
| YGL012W | 0.28 |
ERG4
|
C-24(28) sterol reductase, catalyzes the final step in ergosterol biosynthesis; mutants are viable, but lack ergosterol |
|
| YHR173C | 0.27 |
Dubious ORF unlikely to encode a functional protein, based on available experimental and comparative sequence data |
||
| YGR241C | 0.27 |
YAP1802
|
Protein involved in clathrin cage assembly; binds Pan1p and clathrin; homologous to Yap1801p, member of the AP180 protein family |
|
| YKL164C | 0.27 |
PIR1
|
O-glycosylated protein required for cell wall stability; attached to the cell wall via beta-1,3-glucan; mediates mitochondrial translocation of Apn1p; expression regulated by the cell integrity pathway and by Swi5p during the cell cycle |
|
| YCL018W | 0.26 |
LEU2
|
Beta-isopropylmalate dehydrogenase (IMDH), catalyzes the third step in the leucine biosynthesis pathway |
|
| YPR063C | 0.26 |
ER-localized protein of unknown function |
||
| YER134C | 0.26 |
Putative protein of unknown function; non-essential gene |
||
| YNL090W | 0.26 |
RHO2
|
Non-essential small GTPase of the Rho/Rac subfamily of Ras-like proteins, involved in the establishment of cell polarity and in microtubule assembly |
|
| YGL220W | 0.25 |
FRA2
|
Protein involved in negative regulation of transcription of iron regulon; forms an iron independent complex with Fra2p, Grx3p, and Grx4p; null mutant fails to repress iron regulon and is sensitive to nickel |
|
| YER137C | 0.25 |
Putative protein of unknown function |
||
| YDL084W | 0.25 |
SUB2
|
Component of the TREX complex required for nuclear mRNA export; member of the DEAD-box RNA helicase superfamily and is involved in early and late steps of spliceosome assembly; homolog of the human splicing factor hUAP56 |
|
| YLR206W | 0.24 |
ENT2
|
Epsin-like protein required for endocytosis and actin patch assembly and functionally redundant with Ent1p; contains clathrin-binding motif at C-terminus |
|
| YGR155W | 0.24 |
CYS4
|
Cystathionine beta-synthase, catalyzes the synthesis of cystathionine from serine and homocysteine, the first committed step in cysteine biosynthesis |
|
| YJR101W | 0.24 |
RSM26
|
Mitochondrial ribosomal protein of the small subunit |
|
| YGL221C | 0.24 |
NIF3
|
Protein of unknown function, similar to Listeria monocytogenes major sigma factor (rpoD gene product); the authentic, non-tagged protein is detected in highly purified mitochondria in high-throughput studies |
|
| YHL001W | 0.24 |
RPL14B
|
Protein component of the large (60S) ribosomal subunit, nearly identical to Rpl14Ap and has similarity to rat L14 ribosomal protein |
|
| YDL205C | 0.24 |
HEM3
|
Phorphobilinogen deaminase, catalyzes the conversion of 4-porphobilinogen to hydroxymethylbilane, the third step in the heme biosynthetic pathway; localizes to both the cytoplasm and nucleus; expression is regulated by Hap2p-Hap3p |
|
| YLR154C | 0.24 |
RNH203
|
Ribonuclease H2 subunit, required for RNase H2 activity |
|
| YHR177W | 0.23 |
Putative protein of unknown function |
||
| YGR181W | 0.23 |
TIM13
|
Mitochondrial intermembrane space protein, forms a complex with TIm8p that mediates import and insertion of a subset of polytopic inner membrane proteins; may prevent aggregation of incoming proteins in a chaperone-like manner |
|
| YKR092C | 0.23 |
SRP40
|
Nucleolar, serine-rich protein with a role in preribosome assembly or transport; may function as a chaperone of small nucleolar ribonucleoprotein particles (snoRNPs); immunologically and structurally to rat Nopp140 |
|
| YHR070C-A | 0.23 |
Dubious open reading frame unlikely to encode a protein, based on available experimental and comparative sequence data; overlaps the verified gene TRM5/YHR070W |
||
| YOR029W | 0.23 |
Dubious open reading frame unlikely to encode a functional protein; based on available experimental and comparative sequence data |
||
| YBR009C | 0.23 |
HHF1
|
One of two identical histone H4 proteins (see also HHF2); core histone required for chromatin assembly and chromosome function; contributes to telomeric silencing; N-terminal domain involved in maintaining genomic integrity |
|
| YOR087W | 0.23 |
YVC1
|
Vacuolar cation channel, mediates release of Ca(2+) from the vacuole in response to hyperosmotic shock |
|
| YBR011C | 0.22 |
IPP1
|
Cytoplasmic inorganic pyrophosphatase (PPase), catalyzes the rapid exchange of oxygens from Pi with water, highly expressed and essential for viability, active-site residues show identity to those from E. coli PPase |
|
| YKL030W | 0.22 |
Dubious open reading frame, unlikely to encode a protein; not conserved in closely related Saccharomyces species; partially overlaps the verified gene MAE1 |
||
| YLL045C | 0.22 |
RPL8B
|
Ribosomal protein L4 of the large (60S) ribosomal subunit, nearly identical to Rpl8Ap and has similarity to rat L7a ribosomal protein; mutation results in decreased amounts of free 60S subunits |
|
| YJL143W | 0.22 |
TIM17
|
Essential constituent of the mitochondrial inner membrane presequence translocase; interacts with Pam18p to recruit the presequence translocase-associated motor (PAM complex) and also required for protein sorting during import |
|
| YNL031C | 0.22 |
HHT2
|
One of two identical histone H3 proteins (see also HHT1); core histone required for chromatin assembly, involved in heterochromatin-mediated telomeric and HM silencing; regulated by acetylation, methylation, and mitotic phosphorylation |
|
| YOL127W | 0.22 |
RPL25
|
Primary rRNA-binding ribosomal protein component of the large (60S) ribosomal subunit, has similarity to E. coli L23 and rat L23a ribosomal proteins; binds to 26S rRNA via a conserved C-terminal motif |
|
| YEL027W | 0.22 |
CUP5
|
Proteolipid subunit of the vacuolar H(+)-ATPase V0 sector (subunit c; dicyclohexylcarbodiimide binding subunit); required for vacuolar acidification and important for copper and iron metal ion homeostasis |
|
| YAL038W | 0.22 |
CDC19
|
Pyruvate kinase, functions as a homotetramer in glycolysis to convert phosphoenolpyruvate to pyruvate, the input for aerobic (TCA cycle) or anaerobic (glucose fermentation) respiration |
|
| YMR049C | 0.22 |
ERB1
|
Protein required for maturation of the 25S and 5.8S ribosomal RNAs; constituent of 66S pre-ribosomal particles; homologous to mammalian Bop1 |
|
| YGR027C | 0.22 |
RPS25A
|
Protein component of the small (40S) ribosomal subunit; nearly identical to Rps25Bp and has similarity to rat S25 ribosomal protein |
|
| YIL169C | 0.22 |
Putative protein of unknown function; serine/threonine rich and highly similar to YOL155C, a putative glucan alpha-1,4-glucosidase; transcript is induced in both high and low pH environments; YIL169C is a non-essential gene |
||
| YDL083C | 0.22 |
RPS16B
|
Protein component of the small (40S) ribosomal subunit; identical to Rps16Ap and has similarity to E. coli S9 and rat S16 ribosomal proteins |
|
| YGL097W | 0.21 |
SRM1
|
Nucleotide exchange factor for Gsp1p, localizes to the nucleus, required for nucleocytoplasmic trafficking of macromolecules; suppressor of the pheromone response pathway; potentially phosphorylated by Cdc28p |
|
| YHL028W | 0.21 |
WSC4
|
ER membrane protein involved in the translocation of soluble secretory proteins and insertion of membrane proteins into the ER membrane; may also have a role in the stress response but has only partial functional overlap with WSC1-3 |
|
| YOR101W | 0.21 |
RAS1
|
GTPase involved in G-protein signaling in the adenylate cyclase activating pathway, plays a role in cell proliferation; localized to the plasma membrane; homolog of mammalian RAS proto-oncogenes |
|
| YOR163W | 0.21 |
DDP1
|
Polyphosphate phosphatase; hydrolyzes diphosphorylated inositol polyphosphates and diadenosine polyphosphates; has high specificity for diadenosine hexa- and pentaphosphates; member of the MutT family of nucleotide hydrolases |
|
| YBR268W | 0.21 |
MRPL37
|
Mitochondrial ribosomal protein of the large subunit |
|
| YIL046W-A | 0.21 |
Putative protein of unknown function; identified by expression profiling and mass spectrometry |
||
| YBL085W | 0.20 |
BOI1
|
Protein implicated in polar growth, functionally redundant with Boi2p; interacts with bud-emergence protein Bem1p; contains an SH3 (src homology 3) domain and a PH (pleckstrin homology) domain |
|
| YDR100W | 0.20 |
TVP15
|
Integral membrane protein localized to late Golgi vesicles along with the v-SNARE Tlg2p |
|
| YIL159W | 0.20 |
BNR1
|
Formin, nucleates the formation of linear actin filaments, involved in cell processes such as budding and mitotic spindle orientation which require the formation of polarized actin cables, functionally redundant with BNI1 |
|
| YNL141W | 0.20 |
AAH1
|
Adenine deaminase (adenine aminohydrolase), converts adenine to hypoxanthine; involved in purine salvage; transcriptionally regulated by nutrient levels and growth phase; Aah1p degraded upon entry into quiescence via SCF and the proteasome |
|
| YOR096W | 0.20 |
RPS7A
|
Protein component of the small (40S) ribosomal subunit, nearly identical to Rps7Bp; interacts with Kti11p; deletion causes hypersensitivity to zymocin; has similarity to rat S7 and Xenopus S8 ribosomal proteins |
|
| YMR263W | 0.20 |
SAP30
|
Subunit of a histone deacetylase complex, along with Rpd3p and Sin3p, that is involved in silencing at telomeres, rDNA, and silent mating-type loci; involved in telomere maintenance |
|
| YOR340C | 0.20 |
RPA43
|
RNA polymerase I subunit A43 |
|
| YPR062W | 0.20 |
FCY1
|
Cytosine deaminase, zinc metalloenzyme that catalyzes the hydrolytic deamination of cytosine to uracil; of biomedical interest because it also catalyzes the deamination of 5-fluorocytosine (5FC) to form anticancer drug 5-fluorouracil (5FU) |
|
| YKL218C | 0.19 |
SRY1
|
3-hydroxyaspartate dehydratase, deaminates L-threo-3-hydroxyaspartate to form oxaloacetate and ammonia; required for survival in the presence of hydroxyaspartate |
|
| YLR083C | 0.19 |
EMP70
|
Protein with a role in cellular adhesion and filamentous growth; similar to Tmn2p and Tmn3p; member of Transmembrane Nine family of proteins with 9 transmembrane segments; 24kDa cleavage product found in endosome-enriched membrane fractions |
|
| YOR354C | 0.19 |
MSC6
|
Protein of unknown function; mutant is defective in directing meiotic recombination events to homologous chromatids; the authentic, non-tagged protein is detected in highly purified mitochondria in high-throughput studies |
|
| YOR357C | 0.19 |
SNX3
|
Sorting nexin required to maintain late-Golgi resident enzymes in their proper location by recycling molecules from the prevacuolar compartment; contains a PX domain and sequence similarity to human Snx3p |
|
| YIL056W | 0.19 |
VHR1
|
Transcriptional activator, required for the vitamin H-responsive element (VHRE) mediated induction of VHT1 (Vitamin H transporter) and BIO5 (biotin biosynthesis intermediate transporter) in response to low biotin concentrations |
|
| YJR114W | 0.19 |
Dubious open reading frame unlikely to encode a protein, based on available experimental and comparative sequence data; partially overlaps the verified ORF RSM7/YJR113C |
||
| YML043C | 0.19 |
RRN11
|
Protein required for rDNA transcription by RNA polymerase I, component of the core factor (CF) of rDNA transcription factor, which also contains Rrn6p and Rrn7p |
|
| YFL015C | 0.19 |
Dubious open reading frame unlikely to encode a protein; partially overlaps dubious ORF YFL015W-A; YFL015C is not an essential gene |
||
| YJL196C | 0.19 |
ELO1
|
Elongase I, medium-chain acyl elongase, catalyzes carboxy-terminal elongation of unsaturated C12-C16 fatty acyl-CoAs to C16-C18 fatty acids |
|
| YIL133C | 0.19 |
RPL16A
|
N-terminally acetylated protein component of the large (60S) ribosomal subunit, binds to 5.8 S rRNA; has similarity to Rpl16Bp, E. coli L13 and rat L13a ribosomal proteins; transcriptionally regulated by Rap1p |
|
| YLR372W | 0.19 |
SUR4
|
Elongase, involved in fatty acid and sphingolipid biosynthesis; synthesizes very long chain 20-26-carbon fatty acids from C18-CoA primers; involved in regulation of sphingolipid biosynthesis |
|
| YDR534C | 0.19 |
FIT1
|
Mannoprotein that is incorporated into the cell wall via a glycosylphosphatidylinositol (GPI) anchor, involved in the retention of siderophore-iron in the cell wall |
|
| YOL012C | 0.19 |
HTZ1
|
Histone variant H2AZ, exchanged for histone H2A in nucleosomes by the SWR1 complex; involved in transcriptional regulation through prevention of the spread of silent heterochromatin |
|
| YLR432W | 0.19 |
IMD3
|
Inosine monophosphate dehydrogenase, catalyzes the first step of GMP biosynthesis, member of a four-gene family in S. cerevisiae, constitutively expressed |
|
| YCL022C | 0.18 |
Dubious open reading frame unlikely to encode a protein, based on available experimental and comparative sequence data; completely overlaps verified gene KCC4/YCL024W |
||
| YBR283C | 0.18 |
SSH1
|
Subunit of the Ssh1 translocon complex; Sec61p homolog involved in co-translational pathway of protein translocation; not essential |
|
| YKL182W | 0.18 |
FAS1
|
Beta subunit of fatty acid synthetase, which catalyzes the synthesis of long-chain saturated fatty acids; contains acetyltransacylase, dehydratase, enoyl reductase, malonyl transacylase, and palmitoyl transacylase activities |
|
| YDR047W | 0.18 |
HEM12
|
Uroporphyrinogen decarboxylase, catalyzes the fifth step in the heme biosynthetic pathway; localizes to both the cytoplasm and nucleus; activity inhibited by Cu2+, Zn2+, Fe2+, Fe3+ and sulfhydryl-specific reagents |
|
| YGR255C | 0.18 |
COQ6
|
Putative flavin-dependent monooxygenase, involved in ubiquinone (Coenzyme Q) biosynthesis; localizes to the matrix face of the mitochondrial inner membrane in a large complex with other ubiquinone biosynthetic enzymes |
|
| YPL037C | 0.18 |
EGD1
|
Subunit beta1 of the nascent polypeptide-associated complex (NAC) involved in protein targeting, associated with cytoplasmic ribosomes; enhances DNA binding of the Gal4p activator; homolog of human BTF3b |
|
| YDR046C | 0.18 |
BAP3
|
Amino acid permease involved in the uptake of cysteine, leucine, isoleucine and valine |
|
| YMR009W | 0.18 |
ADI1
|
Acireductone dioxygenease involved in the methionine salvage pathway; ortholog of human MTCBP-1; transcribed with YMR010W and regulated post-transcriptionally by RNase III (Rnt1p) cleavage; ADI1 mRNA is induced in heat shock conditions |
|
| YGR279C | 0.18 |
SCW4
|
Cell wall protein with similarity to glucanases; scw4 scw10 double mutants exhibit defects in mating |
|
| YOR146W | 0.18 |
Dubious open reading frame unlikely to encode a protein, based on available experimental and comparative sequence data; open reading frame overlaps the verified gene PNO1/YOR145C |
||
| YNR054C | 0.18 |
ESF2
|
Essential nucleolar protein involved in pre-18S rRNA processing; binds to RNA and stimulates ATPase activity of Dbp8; involved in assembly of the small subunit (SSU) processome |
|
| YER012W | 0.18 |
PRE1
|
Beta 4 subunit of the 20S proteasome; localizes to the nucleus throughout the cell cycle |
|
| YER133W-A | 0.17 |
Dubious open reading frame unlikely to encode a protein, based on available experimental and comparative sequence data; partially overlaps uncharacterized gene YER134C. |
||
| YER043C | 0.17 |
SAH1
|
S-adenosyl-L-homocysteine hydrolase, catabolizes S-adenosyl-L-homocysteine which is formed after donation of the activated methyl group of S-adenosyl-L-methionine (AdoMet) to an acceptor |
|
| YGR040W | 0.17 |
KSS1
|
Mitogen-activated protein kinase (MAPK) involved in signal transduction pathways that control filamentous growth and pheromone response; the KSS1 gene is nonfunctional in S288C strains and functional in W303 strains |
|
| YDR535C | 0.17 |
Dubious open reading frame unlikely to encode a protein, based on available experimental and comparative sequence data; YDR535C is not an essential gene. |
||
| YGR148C | 0.17 |
RPL24B
|
Ribosomal protein L30 of the large (60S) ribosomal subunit, nearly identical to Rpl24Ap and has similarity to rat L24 ribosomal protein; not essential for translation but may be required for normal translation rate |
|
| YDR101C | 0.17 |
ARX1
|
Shuttling pre-60S factor; involved in the biogenesis of ribosomal large subunit biogenesis; interacts directly with Alb1; responsible for Tif6 recycling defects in absence of Rei1; associated with the ribosomal export complex |
|
| YER131W | 0.17 |
RPS26B
|
Protein component of the small (40S) ribosomal subunit; nearly identical to Rps26Ap and has similarity to rat S26 ribosomal protein |
|
| YJL008C | 0.17 |
CCT8
|
Subunit of the cytosolic chaperonin Cct ring complex, related to Tcp1p, required for the assembly of actin and tubulins in vivo |
|
| YOL013W-A | 0.16 |
Putative protein of unknown function; identified by SAGE |
||
| YLR328W | 0.16 |
NMA1
|
Nicotinic acid mononucleotide adenylyltransferase, involved in pathways of NAD biosynthesis, including the de novo, NAD(+) salvage, and nicotinamide riboside salvage pathways |
|
| YER058W | 0.16 |
PET117
|
Protein required for assembly of cytochrome c oxidase |
|
| YHR043C | 0.16 |
DOG2
|
2-deoxyglucose-6-phosphate phosphatase, member of a family of low molecular weight phosphatases, similar to Dog1p, induced by oxidative and osmotic stress, confers 2-deoxyglucose resistance when overexpressed |
|
| YKL166C | 0.16 |
TPK3
|
cAMP-dependent protein kinase catalytic subunit; promotes vegetative growth in response to nutrients via the Ras-cAMP signaling pathway; inhibited by regulatory subunit Bcy1p in the absence of cAMP; partially redundant with Tpk1p and Tpk2p |
|
| YMR032W | 0.16 |
HOF1
|
Bud neck-localized, SH3 domain-containing protein required for cytokinesis; regulates actomyosin ring dynamics and septin localization; interacts with the formins, Bni1p and Bnr1p, and with Cyk3p, Vrp1p, and Bni5p |
|
| YPL112C | 0.16 |
PEX25
|
Peripheral peroxisomal membrane peroxin required for the regulation of peroxisome size and maintenance, recruits GTPase Rho1p to peroxisomes, induced by oleate, interacts with homologous protein Pex27p |
|
| YBR052C | 0.16 |
RFS1
|
Protein of unknown function; member of a flavodoxin-like fold protein family that includes Pst2p and Ycp4p; green fluorescent protein (GFP)-fusion protein localizes to the cytoplasm in a punctate pattern |
|
| YLR401C | 0.16 |
DUS3
|
Dihydrouridine synthase, member of a widespread family of conserved proteins including Smm1p, Dus1p, and Dus4p; contains a consensus oleate response element (ORE) in its promoter region |
|
| YJL216C | 0.16 |
Protein of unknown function, similar to alpha-D-glucosidases; transcriptionally activated by both Pdr8p and Yrm1p, along with transporters and other genes involved in the pleiotropic drug resistance (PDR) phenomenon |
||
| YMR199W | 0.16 |
CLN1
|
G1 cyclin involved in regulation of the cell cycle; activates Cdc28p kinase to promote the G1 to S phase transition; late G1 specific expression depends on transcription factor complexes, MBF (Swi6p-Mbp1p) and SBF (Swi6p-Swi4p) |
|
| YDL082W | 0.16 |
RPL13A
|
Protein component of the large (60S) ribosomal subunit, nearly identical to Rpl13Bp; not essential for viability; has similarity to rat L13 ribosomal protein |
|
| YJL148W | 0.16 |
RPA34
|
RNA polymerase I subunit A34.5 |
|
| YJR001W | 0.16 |
AVT1
|
Vacuolar transporter, imports large neutral amino acids into the vacuole; member of a family of seven S. cerevisiae genes (AVT1-7) related to vesicular GABA-glycine transporters |
|
| YOL086C | 0.15 |
ADH1
|
Alcohol dehydrogenase, fermentative isozyme active as homo- or heterotetramers; required for the reduction of acetaldehyde to ethanol, the last step in the glycolytic pathway |
|
| YPL108W | 0.15 |
Cytoplasmic protein of unknown function; non-essential gene that is induced in a GDH1 deleted strain with altered redox metabolism; GFP-fusion protein is induced in response to the DNA-damaging agent MMS |
||
| YLR253W | 0.15 |
Putative protein of unknown function; the authentic, non-tagged protein is detected in highly purified mitochondria in high-throughput studies; transcription is periodic during the metabolic cycle; YLR253W is not an essential gene |
||
| YJR113C | 0.15 |
RSM7
|
Mitochondrial ribosomal protein of the small subunit, has similarity to E. coli S7 ribosomal protein |
|
| YPL274W | 0.15 |
SAM3
|
High-affinity S-adenosylmethionine permease, required for utilization of S-adenosylmethionine as a sulfur source; has similarity to S-methylmethionine permease Mmp1p |
|
| YER048C | 0.15 |
CAJ1
|
Nuclear type II J heat shock protein of the E. coli dnaJ family, contains a leucine zipper-like motif, binds to non-native substrates for presentation to Ssa3p, may function during protein translocation, assembly and disassembly |
|
| YPL265W | 0.15 |
DIP5
|
Dicarboxylic amino acid permease, mediates high-affinity and high-capacity transport of L-glutamate and L-aspartate; also a transporter for Gln, Asn, Ser, Ala, and Gly |
|
| YPL221W | 0.15 |
FLC1
|
Putative FAD transporter; required for uptake of FAD into endoplasmic reticulum; involved in cell wall maintenance |
|
| YKL081W | 0.15 |
TEF4
|
Translation elongation factor EF-1 gamma |
|
| YNR016C | 0.15 |
ACC1
|
Acetyl-CoA carboxylase, biotin containing enzyme that catalyzes the carboxylation of acetyl-CoA to form malonyl-CoA; required for de novo biosynthesis of long-chain fatty acids |
|
| YLR413W | 0.15 |
Putative protein of unknown function; YLR413W is not an essential gene |
||
| YCR090C | 0.15 |
Putative protein of unknown function; green fluorescent protein (GFP)-fusion protein localizes to the cytoplasm and nucleus; YCR090C is not an essential gene |
||
| YOR230W | 0.15 |
WTM1
|
Transcriptional modulator involved in regulation of meiosis, silencing, and expression of RNR genes; required for nuclear localization of the ribonucleotide reductase small subunit Rnr2p and Rnr4p; contains WD repeats |
|
| YMR011W | 0.15 |
HXT2
|
High-affinity glucose transporter of the major facilitator superfamily, expression is induced by low levels of glucose and repressed by high levels of glucose |
|
| YBR238C | 0.14 |
Mitochondrial membrane protein with similarity to Rmd9p; not required for respiratory growth but causes a synthetic respiratory defect in combination with rmd9 mutations; transcriptionally up-regulated by TOR; deletion increases life span |
||
| YDR349C | 0.14 |
YPS7
|
Putative GPI-anchored aspartic protease, located in the cytoplasm and endoplasmic reticulum |
|
| YDR094W | 0.14 |
Dubious open reading frame unlikely to encode a protein, based on available experimental and comparative sequence data; partially overlaps verified ORF DNF2 |
||
| YPR170W-B | 0.14 |
Putative protein of unknown function, conserved in fungi; partially overlaps the dubious genes YPR169W-A, YPR170W-A and YRP170C |
||
| YOL104C | 0.14 |
NDJ1
|
Meiosis-specific telomere protein, required for bouquet formation, effective homolog pairing, ordered cross-over distribution (interference), sister chromatid cohesion at meiotic telomeres, and segregation of small chromosomes |
|
| YDL007W | 0.14 |
RPT2
|
One of six ATPases of the 19S regulatory particle of the 26S proteasome involved in the degradation of ubiquitinated substrates; required for normal peptide hydrolysis by the core 20S particle |
|
| YNL338W | 0.14 |
Dubious open reading frame unlikely to encode a protein, based on available experimental and comparative sequence data; completely overlaps TEL14L-XC, which is Telomeric X element Core sequence on the left arm of Chromosome XIV |
||
| YNR060W | 0.14 |
FRE4
|
Ferric reductase, reduces a specific subset of siderophore-bound iron prior to uptake by transporters; expression induced by low iron levels |
|
| YNL043C | 0.14 |
Dubious open reading frame unlikely to encode a protein, based on available experimental and comparative sequence data; partially overlaps the verified gene YIP3/YNL044W |
||
| YDR091C | 0.14 |
RLI1
|
Essential iron-sulfur protein required for ribosome biogenesis and translation initiation; facilitates binding of a multifactor complex (MFC) of translation initiation factors to the small ribosomal subunit; predicted ABC family ATPase |
|
| YOR119C | 0.14 |
RIO1
|
Essential serine kinase involved in cell cycle progression and processing of the 20S pre-rRNA into mature 18S rRNA |
|
| YMR116C | 0.14 |
ASC1
|
G-protein beta subunit and guanine nucleotide dissociation inhibitor for Gpa2p; ortholog of RACK1 that inhibits translation; core component of the small (40S) ribosomal subunit; represses Gcn4p in the absence of amino acid starvation |
|
| YOR273C | 0.14 |
TPO4
|
Polyamine transport protein, recognizes spermine, putrescine, and spermidine; localizes to the plasma membrane; member of the major facilitator superfamily |
|
| YBL044W | 0.13 |
Putative protein of unknown function; YBL044W is not an essential protein |
||
| YPL061W | 0.13 |
ALD6
|
Cytosolic aldehyde dehydrogenase, activated by Mg2+ and utilizes NADP+ as the preferred coenzyme; required for conversion of acetaldehyde to acetate; constitutively expressed; locates to the mitochondrial outer surface upon oxidative stress |
|
| YHR216W | 0.13 |
IMD2
|
Inosine monophosphate dehydrogenase, catalyzes the first step of GMP biosynthesis, expression is induced by mycophenolic acid resulting in resistance to the drug, expression is repressed by nutrient limitation |
|
| YGL157W | 0.13 |
Oxidoreductase, catalyzes NADPH-dependent reduction of the bicyclic diketone bicyclo[2.2.2]octane-2,6-dione (BCO2,6D) to the chiral ketoalcohol (1R,4S,6S)-6-hydroxybicyclo[2.2.2]octane-2-one (BCO2one6ol) |
||
| YCL021W-A | 0.13 |
Putative protein of unknown function |
||
| YEL001C | 0.13 |
IRC22
|
Putative protein of unknown function; green fluorescent protein (GFP)-fusion localizes to the ER; YEL001C is non-essential; null mutant displays increased levels of spontaneous Rad52p foci |
|
| YOR008C-A | 0.13 |
Putative protein of unknown function, includes a potential transmembrane domain; deletion results in slightly lengthened telomeres |
||
| YGL034C | 0.13 |
Dubious open reading frame unlikely to encode a functional protein, based on available experimental and comparative sequence data |
||
| YGL161C | 0.13 |
YIP5
|
Protein that interacts with Rab GTPases, localized to late Golgi vesicles; computational analysis of large-scale protein-protein interaction data suggests a possible role in vesicle-mediated transport |
|
| YNL066W | 0.13 |
SUN4
|
Cell wall protein related to glucanases, possibly involved in cell wall septation; member of the SUN family |
|
| YMR072W | 0.13 |
ABF2
|
Mitochondrial DNA-binding protein involved in mitochondrial DNA replication and recombination, member of HMG1 DNA-binding protein family; activity may be regulated by protein kinase A phosphorylation |
|
| YBR149W | 0.13 |
ARA1
|
NADP+ dependent arabinose dehydrogenase, involved in carbohydrate metabolism; purified as homodimer; naturally occurs with a N-terminus degradation product |
|
| YOR356W | 0.13 |
Mitochondrial protein with similarity to flavoprotein-type oxidoreductases; found in a large supramolecular complex with other mitochondrial dehydrogenases |
||
| YKL073W | 0.13 |
LHS1
|
Molecular chaperone of the endoplasmic reticulum lumen, involved in polypeptide translocation and folding; member of the Hsp70 family; localizes to the lumen of the ER; regulated by the unfolded protein response pathway |
|
| YKL097C | 0.13 |
Dubious open reading frame, unlikely to encode a protein; not conserved in closely related Saccharomyces species |
||
| YLR351C | 0.13 |
NIT3
|
Nit protein, one of two proteins in S. cerevisiae with similarity to the Nit domain of NitFhit from fly and worm and to the mouse and human Nit protein which interacts with the Fhit tumor suppressor; nitrilase superfamily member |
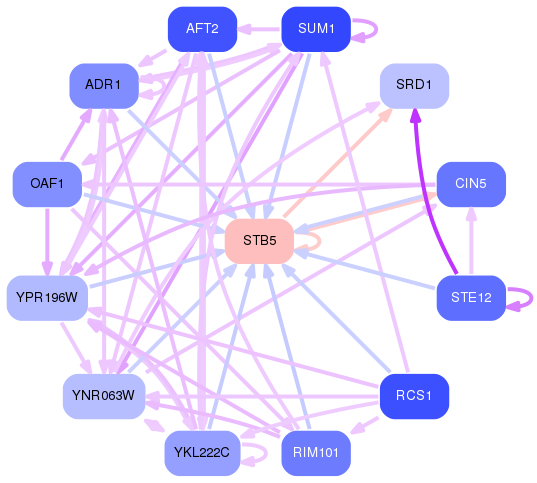
Network of associatons between targets according to the STRING database.

First level regulatory network of STB5
Gene Ontology Analysis
Gene overrepresentation in biological process category:
| Log-likelihood per target | Total log-likelihood | Term | Description |
|---|---|---|---|
| 0.4 | 1.1 | GO:0000098 | sulfur amino acid catabolic process(GO:0000098) |
| 0.2 | 1.0 | GO:0035337 | fatty-acyl-CoA metabolic process(GO:0035337) |
| 0.2 | 1.2 | GO:0009051 | pentose-phosphate shunt, oxidative branch(GO:0009051) |
| 0.2 | 0.2 | GO:0046838 | phosphorylated carbohydrate dephosphorylation(GO:0046838) inositol phosphate dephosphorylation(GO:0046855) inositol phosphate catabolic process(GO:0071545) |
| 0.1 | 0.1 | GO:0009756 | cellular glucose homeostasis(GO:0001678) carbohydrate mediated signaling(GO:0009756) hexose mediated signaling(GO:0009757) sugar mediated signaling pathway(GO:0010182) glucose mediated signaling pathway(GO:0010255) carbohydrate homeostasis(GO:0033500) glucose homeostasis(GO:0042593) cellular response to monosaccharide stimulus(GO:0071326) cellular response to hexose stimulus(GO:0071331) cellular response to glucose stimulus(GO:0071333) |
| 0.1 | 0.4 | GO:0051436 | negative regulation of ubiquitin-protein ligase activity involved in mitotic cell cycle(GO:0051436) regulation of ubiquitin-protein ligase activity involved in mitotic cell cycle(GO:0051439) negative regulation of ubiquitin protein ligase activity(GO:1904667) |
| 0.1 | 0.6 | GO:0035434 | copper ion transmembrane transport(GO:0035434) |
| 0.1 | 0.3 | GO:0044209 | AMP salvage(GO:0044209) |
| 0.1 | 0.3 | GO:0046416 | D-amino acid metabolic process(GO:0046416) |
| 0.1 | 0.8 | GO:0046501 | protoporphyrinogen IX biosynthetic process(GO:0006782) protoporphyrinogen IX metabolic process(GO:0046501) |
| 0.1 | 0.8 | GO:0043137 | DNA replication, removal of RNA primer(GO:0043137) |
| 0.1 | 0.7 | GO:0006021 | inositol biosynthetic process(GO:0006021) |
| 0.1 | 0.6 | GO:0046513 | ceramide metabolic process(GO:0006672) ceramide biosynthetic process(GO:0046513) |
| 0.1 | 0.2 | GO:0043096 | purine nucleobase salvage(GO:0043096) adenine metabolic process(GO:0046083) |
| 0.1 | 0.3 | GO:0046039 | GTP biosynthetic process(GO:0006183) GTP metabolic process(GO:0046039) |
| 0.1 | 1.0 | GO:0006098 | pentose-phosphate shunt(GO:0006098) glyceraldehyde-3-phosphate metabolic process(GO:0019682) |
| 0.1 | 0.4 | GO:0098742 | agglutination involved in conjugation with cellular fusion(GO:0000752) agglutination involved in conjugation(GO:0000771) heterophilic cell-cell adhesion via plasma membrane cell adhesion molecules(GO:0007157) cell-cell adhesion(GO:0098609) adhesion between unicellular organisms(GO:0098610) multi organism cell adhesion(GO:0098740) cell-cell adhesion via plasma-membrane adhesion molecules(GO:0098742) |
| 0.1 | 0.4 | GO:0030497 | fatty acid elongation(GO:0030497) |
| 0.1 | 0.4 | GO:0015848 | spermidine transport(GO:0015848) |
| 0.1 | 0.3 | GO:0042538 | hyperosmotic salinity response(GO:0042538) |
| 0.1 | 0.2 | GO:0010039 | response to iron ion(GO:0010039) regulation of transcription from RNA polymerase II promoter in response to iron(GO:0034395) cellular response to iron ion(GO:0071281) |
| 0.1 | 0.6 | GO:0034729 | histone H3-K79 methylation(GO:0034729) |
| 0.1 | 0.4 | GO:2000758 | positive regulation of histone acetylation(GO:0035066) positive regulation of protein acetylation(GO:1901985) positive regulation of peptidyl-lysine acetylation(GO:2000758) |
| 0.1 | 0.6 | GO:0000947 | amino acid catabolic process to alcohol via Ehrlich pathway(GO:0000947) |
| 0.1 | 0.2 | GO:0007189 | adenylate cyclase-activating G-protein coupled receptor signaling pathway(GO:0007189) |
| 0.1 | 0.3 | GO:0070911 | global genome nucleotide-excision repair(GO:0070911) |
| 0.1 | 0.1 | GO:0000296 | spermine transport(GO:0000296) |
| 0.1 | 0.3 | GO:0000028 | ribosomal small subunit assembly(GO:0000028) |
| 0.1 | 0.3 | GO:0051083 | 'de novo' cotranslational protein folding(GO:0051083) |
| 0.1 | 0.7 | GO:0045053 | protein retention in Golgi apparatus(GO:0045053) |
| 0.1 | 0.2 | GO:0046087 | cytidine metabolic process(GO:0046087) |
| 0.1 | 0.2 | GO:0042992 | negative regulation of transcription factor import into nucleus(GO:0042992) |
| 0.1 | 0.2 | GO:0010674 | negative regulation of transcription from RNA polymerase II promoter involved in meiotic cell cycle(GO:0010674) |
| 0.1 | 0.4 | GO:0009098 | leucine biosynthetic process(GO:0009098) |
| 0.1 | 0.2 | GO:0019346 | transsulfuration(GO:0019346) |
| 0.1 | 0.8 | GO:0044088 | regulation of vacuole fusion, non-autophagic(GO:0032889) regulation of vacuole organization(GO:0044088) |
| 0.1 | 0.2 | GO:0019413 | acetate biosynthetic process(GO:0019413) |
| 0.1 | 0.1 | GO:0006531 | aspartate metabolic process(GO:0006531) |
| 0.1 | 0.2 | GO:0070588 | calcium ion transmembrane transport(GO:0070588) |
| 0.1 | 0.3 | GO:0015865 | purine nucleotide transport(GO:0015865) purine ribonucleotide transport(GO:0015868) |
| 0.1 | 0.4 | GO:0043457 | regulation of cellular respiration(GO:0043457) |
| 0.1 | 0.4 | GO:0010696 | positive regulation of spindle pole body separation(GO:0010696) |
| 0.0 | 0.2 | GO:0006361 | transcription initiation from RNA polymerase I promoter(GO:0006361) |
| 0.0 | 0.2 | GO:0007535 | donor selection(GO:0007535) |
| 0.0 | 0.2 | GO:0051693 | regulation of actin filament depolymerization(GO:0030834) negative regulation of actin filament depolymerization(GO:0030835) barbed-end actin filament capping(GO:0051016) actin filament capping(GO:0051693) |
| 0.0 | 1.3 | GO:0097384 | ergosterol biosynthetic process(GO:0006696) phytosteroid biosynthetic process(GO:0016129) cellular alcohol biosynthetic process(GO:0044108) cellular lipid biosynthetic process(GO:0097384) |
| 0.0 | 0.0 | GO:0014070 | response to organic cyclic compound(GO:0014070) response to cycloheximide(GO:0046898) |
| 0.0 | 0.1 | GO:0071478 | cellular response to radiation(GO:0071478) cellular response to light stimulus(GO:0071482) |
| 0.0 | 0.1 | GO:0006529 | asparagine biosynthetic process(GO:0006529) |
| 0.0 | 0.6 | GO:0006415 | translational termination(GO:0006415) |
| 0.0 | 0.2 | GO:0002943 | tRNA dihydrouridine synthesis(GO:0002943) |
| 0.0 | 0.6 | GO:0001100 | negative regulation of exit from mitosis(GO:0001100) |
| 0.0 | 0.1 | GO:0016998 | cell wall macromolecule catabolic process(GO:0016998) |
| 0.0 | 0.3 | GO:0019509 | L-methionine biosynthetic process from methylthioadenosine(GO:0019509) |
| 0.0 | 0.5 | GO:0042790 | transcription of nuclear large rRNA transcript from RNA polymerase I promoter(GO:0042790) |
| 0.0 | 0.7 | GO:0006407 | rRNA export from nucleus(GO:0006407) rRNA transport(GO:0051029) |
| 0.0 | 5.2 | GO:0002181 | cytoplasmic translation(GO:0002181) |
| 0.0 | 0.1 | GO:0008272 | sulfate transport(GO:0008272) |
| 0.0 | 0.3 | GO:0001402 | signal transduction involved in filamentous growth(GO:0001402) |
| 0.0 | 0.1 | GO:0002143 | tRNA wobble position uridine thiolation(GO:0002143) |
| 0.0 | 0.3 | GO:0000376 | Group I intron splicing(GO:0000372) RNA splicing, via transesterification reactions with guanosine as nucleophile(GO:0000376) |
| 0.0 | 0.0 | GO:0071456 | cellular response to hypoxia(GO:0071456) |
| 0.0 | 0.1 | GO:0018195 | peptidyl-arginine modification(GO:0018195) peptidyl-arginine methylation(GO:0018216) |
| 0.0 | 0.1 | GO:0006517 | protein deglycosylation(GO:0006517) |
| 0.0 | 0.2 | GO:0032042 | mitochondrial DNA metabolic process(GO:0032042) |
| 0.0 | 0.1 | GO:0015883 | FAD transport(GO:0015883) |
| 0.0 | 0.1 | GO:0051303 | meiotic telomere clustering(GO:0045141) establishment of chromosome localization(GO:0051303) chromosome localization to nuclear envelope involved in homologous chromosome segregation(GO:0090220) |
| 0.0 | 0.3 | GO:0006801 | superoxide metabolic process(GO:0006801) |
| 0.0 | 0.1 | GO:0008216 | spermidine metabolic process(GO:0008216) |
| 0.0 | 0.0 | GO:0045901 | positive regulation of translational elongation(GO:0045901) |
| 0.0 | 0.3 | GO:0007109 | obsolete cytokinesis, completion of separation(GO:0007109) |
| 0.0 | 0.1 | GO:0031591 | wybutosine metabolic process(GO:0031590) wybutosine biosynthetic process(GO:0031591) |
| 0.0 | 0.3 | GO:0009395 | phospholipid catabolic process(GO:0009395) |
| 0.0 | 0.2 | GO:0015891 | siderophore transport(GO:0015891) |
| 0.0 | 0.1 | GO:0009186 | deoxyribonucleoside diphosphate metabolic process(GO:0009186) |
| 0.0 | 0.1 | GO:0032231 | regulation of actin filament bundle assembly(GO:0032231) positive regulation of actin filament bundle assembly(GO:0032233) |
| 0.0 | 0.1 | GO:0006798 | polyphosphate catabolic process(GO:0006798) |
| 0.0 | 0.2 | GO:0034063 | stress granule assembly(GO:0034063) |
| 0.0 | 0.1 | GO:0009298 | GDP-mannose biosynthetic process(GO:0009298) GDP-mannose metabolic process(GO:0019673) |
| 0.0 | 0.1 | GO:2000879 | regulation of oligopeptide transport by regulation of transcription from RNA polymerase II promoter(GO:0035950) negative regulation of oligopeptide transport by negative regulation of transcription from RNA polymerase II promoter(GO:0035952) regulation of dipeptide transport by regulation of transcription from RNA polymerase II promoter(GO:0035953) negative regulation of dipeptide transport by negative regulation of transcription from RNA polymerase II promoter(GO:0035955) negative regulation of oligopeptide transport(GO:2000877) negative regulation of dipeptide transport(GO:2000879) |
| 0.0 | 0.1 | GO:0006564 | L-serine biosynthetic process(GO:0006564) |
| 0.0 | 0.0 | GO:0009302 | snoRNA transcription(GO:0009302) |
| 0.0 | 0.0 | GO:0007188 | G-protein coupled receptor signaling pathway, coupled to cyclic nucleotide second messenger(GO:0007187) adenylate cyclase-modulating G-protein coupled receptor signaling pathway(GO:0007188) |
| 0.0 | 0.2 | GO:0045039 | protein import into mitochondrial inner membrane(GO:0045039) |
| 0.0 | 0.1 | GO:0045860 | positive regulation of protein kinase activity(GO:0045860) |
| 0.0 | 0.3 | GO:0000917 | barrier septum assembly(GO:0000917) cell septum assembly(GO:0090529) |
| 0.0 | 0.0 | GO:0030042 | actin filament depolymerization(GO:0030042) |
| 0.0 | 0.1 | GO:0006491 | N-glycan processing(GO:0006491) |
| 0.0 | 0.2 | GO:0031204 | posttranslational protein targeting to membrane, translocation(GO:0031204) |
| 0.0 | 0.6 | GO:0045454 | cell redox homeostasis(GO:0045454) |
| 0.0 | 0.2 | GO:0055070 | cellular copper ion homeostasis(GO:0006878) copper ion homeostasis(GO:0055070) |
| 0.0 | 0.3 | GO:0006283 | transcription-coupled nucleotide-excision repair(GO:0006283) |
| 0.0 | 0.1 | GO:0043489 | RNA stabilization(GO:0043489) mRNA stabilization(GO:0048255) |
| 0.0 | 0.1 | GO:0031565 | obsolete cytokinesis checkpoint(GO:0031565) |
| 0.0 | 0.3 | GO:0044396 | actin cortical patch assembly(GO:0000147) actin cortical patch organization(GO:0044396) |
| 0.0 | 0.1 | GO:0043555 | regulation of translation in response to stress(GO:0043555) |
| 0.0 | 0.1 | GO:0007234 | osmosensory signaling via phosphorelay pathway(GO:0007234) |
| 0.0 | 0.4 | GO:0030150 | protein import into mitochondrial matrix(GO:0030150) |
| 0.0 | 0.1 | GO:0000743 | nuclear migration involved in conjugation with cellular fusion(GO:0000743) |
| 0.0 | 0.9 | GO:0007124 | pseudohyphal growth(GO:0007124) |
| 0.0 | 0.1 | GO:0000348 | mRNA branch site recognition(GO:0000348) |
| 0.0 | 0.1 | GO:0019401 | glycerol biosynthetic process(GO:0006114) alditol biosynthetic process(GO:0019401) |
| 0.0 | 0.2 | GO:0006743 | ubiquinone metabolic process(GO:0006743) ubiquinone biosynthetic process(GO:0006744) ketone biosynthetic process(GO:0042181) quinone metabolic process(GO:1901661) quinone biosynthetic process(GO:1901663) |
| 0.0 | 0.1 | GO:0090113 | regulation of COPII vesicle coating(GO:0003400) regulation of vesicle targeting, to, from or within Golgi(GO:0048209) regulation of ER to Golgi vesicle-mediated transport by GTP hydrolysis(GO:0090113) |
| 0.0 | 0.0 | GO:0006567 | threonine catabolic process(GO:0006567) |
| 0.0 | 0.1 | GO:0045292 | mRNA cis splicing, via spliceosome(GO:0045292) |
| 0.0 | 0.2 | GO:0010499 | proteasomal ubiquitin-independent protein catabolic process(GO:0010499) |
| 0.0 | 0.1 | GO:0006003 | fructose 2,6-bisphosphate metabolic process(GO:0006003) |
| 0.0 | 0.2 | GO:0007009 | plasma membrane organization(GO:0007009) |
| 0.0 | 0.1 | GO:0070124 | mitochondrial translational initiation(GO:0070124) |
| 0.0 | 0.1 | GO:0016036 | cellular response to phosphate starvation(GO:0016036) |
| 0.0 | 0.1 | GO:0042558 | folic acid-containing compound metabolic process(GO:0006760) folic acid-containing compound biosynthetic process(GO:0009396) pteridine-containing compound metabolic process(GO:0042558) pteridine-containing compound biosynthetic process(GO:0042559) |
| 0.0 | 0.1 | GO:0000301 | retrograde transport, vesicle recycling within Golgi(GO:0000301) |
| 0.0 | 0.0 | GO:0006432 | phenylalanyl-tRNA aminoacylation(GO:0006432) |
| 0.0 | 0.1 | GO:0009082 | branched-chain amino acid biosynthetic process(GO:0009082) |
| 0.0 | 0.1 | GO:0018344 | protein geranylgeranylation(GO:0018344) |
| 0.0 | 0.0 | GO:0009847 | spore germination(GO:0009847) |
| 0.0 | 0.1 | GO:0035376 | sterol import(GO:0035376) |
| 0.0 | 0.1 | GO:0006829 | zinc II ion transport(GO:0006829) |
| 0.0 | 0.2 | GO:0015991 | energy coupled proton transmembrane transport, against electrochemical gradient(GO:0015988) ATP hydrolysis coupled proton transport(GO:0015991) ATP hydrolysis coupled transmembrane transport(GO:0090662) |
| 0.0 | 0.1 | GO:0031506 | cell wall mannoprotein biosynthetic process(GO:0000032) mannoprotein metabolic process(GO:0006056) mannoprotein biosynthetic process(GO:0006057) cell wall glycoprotein biosynthetic process(GO:0031506) |
| 0.0 | 0.1 | GO:0000084 | mitotic S phase(GO:0000084) S phase(GO:0051320) |
| 0.0 | 0.1 | GO:0046417 | chorismate metabolic process(GO:0046417) |
| 0.0 | 0.0 | GO:0033559 | unsaturated fatty acid biosynthetic process(GO:0006636) unsaturated fatty acid metabolic process(GO:0033559) |
| 0.0 | 0.0 | GO:0097577 | intracellular sequestering of iron ion(GO:0006880) sequestering of metal ion(GO:0051238) sequestering of iron ion(GO:0097577) |
| 0.0 | 0.0 | GO:0006624 | vacuolar protein processing(GO:0006624) |
| 0.0 | 0.1 | GO:0060188 | regulation of protein desumoylation(GO:0060188) |
| 0.0 | 0.0 | GO:0006596 | polyamine biosynthetic process(GO:0006596) |
| 0.0 | 0.1 | GO:0009262 | deoxyribonucleotide metabolic process(GO:0009262) deoxyribonucleotide biosynthetic process(GO:0009263) |
| 0.0 | 0.1 | GO:0006015 | 5-phosphoribose 1-diphosphate biosynthetic process(GO:0006015) 5-phosphoribose 1-diphosphate metabolic process(GO:0046391) |
| 0.0 | 0.4 | GO:0000472 | endonucleolytic cleavage to generate mature 5'-end of SSU-rRNA from (SSU-rRNA, 5.8S rRNA, LSU-rRNA)(GO:0000472) |
| 0.0 | 0.1 | GO:0015780 | nucleotide-sugar transport(GO:0015780) |
| 0.0 | 0.1 | GO:0070682 | proteasome regulatory particle assembly(GO:0070682) |
| 0.0 | 0.0 | GO:0019255 | glucose 1-phosphate metabolic process(GO:0019255) |
| 0.0 | 0.2 | GO:0030488 | tRNA methylation(GO:0030488) |
| 0.0 | 0.0 | GO:0046495 | nicotinamide riboside metabolic process(GO:0046495) pyridine nucleoside metabolic process(GO:0070637) |
| 0.0 | 0.1 | GO:0016559 | peroxisome fission(GO:0016559) |
| 0.0 | 0.0 | GO:0036257 | multivesicular body organization(GO:0036257) |
| 0.0 | 0.1 | GO:0000921 | septin ring assembly(GO:0000921) |
| 0.0 | 0.0 | GO:0010978 | gene silencing involved in chronological cell aging(GO:0010978) gene silencing by RNA(GO:0031047) |
| 0.0 | 0.2 | GO:0070481 | nuclear-transcribed mRNA catabolic process, non-stop decay(GO:0070481) |
| 0.0 | 0.1 | GO:0055069 | cellular zinc ion homeostasis(GO:0006882) zinc ion homeostasis(GO:0055069) |
| 0.0 | 0.0 | GO:0006750 | glutathione biosynthetic process(GO:0006750) nonribosomal peptide biosynthetic process(GO:0019184) |
| 0.0 | 0.1 | GO:0000105 | histidine biosynthetic process(GO:0000105) histidine metabolic process(GO:0006547) imidazole-containing compound metabolic process(GO:0052803) |
| 0.0 | 0.0 | GO:0032447 | protein urmylation(GO:0032447) |
| 0.0 | 0.1 | GO:0006089 | lactate metabolic process(GO:0006089) |
| 0.0 | 0.1 | GO:0006458 | 'de novo' protein folding(GO:0006458) |
| 0.0 | 0.1 | GO:0016479 | negative regulation of transcription from RNA polymerase I promoter(GO:0016479) |
| 0.0 | 0.1 | GO:0006037 | cell wall chitin metabolic process(GO:0006037) cell wall polysaccharide metabolic process(GO:0010383) |
| 0.0 | 0.2 | GO:0006730 | one-carbon metabolic process(GO:0006730) |
Gene overrepresentation in cellular component category:
| Log-likelihood per target | Total log-likelihood | Term | Description |
|---|---|---|---|
| 0.2 | 0.7 | GO:0000015 | phosphopyruvate hydratase complex(GO:0000015) |
| 0.2 | 0.7 | GO:0032299 | ribonuclease H2 complex(GO:0032299) |
| 0.1 | 0.3 | GO:0005854 | nascent polypeptide-associated complex(GO:0005854) |
| 0.1 | 0.3 | GO:0071261 | Ssh1 translocon complex(GO:0071261) |
| 0.1 | 1.2 | GO:0000786 | nucleosome(GO:0000786) |
| 0.1 | 0.2 | GO:0042719 | mitochondrial intermembrane space protein transporter complex(GO:0042719) |
| 0.1 | 0.2 | GO:0070545 | PeBoW complex(GO:0070545) |
| 0.1 | 0.3 | GO:0070860 | RNA polymerase I core factor complex(GO:0070860) |
| 0.1 | 0.2 | GO:0044697 | HICS complex(GO:0044697) |
| 0.1 | 0.4 | GO:0005852 | eukaryotic translation initiation factor 3 complex(GO:0005852) |
| 0.0 | 1.1 | GO:0030173 | integral component of Golgi membrane(GO:0030173) intrinsic component of Golgi membrane(GO:0031228) |
| 0.0 | 0.2 | GO:0032160 | septin filament array(GO:0032160) |
| 0.0 | 3.7 | GO:0022625 | cytosolic large ribosomal subunit(GO:0022625) |
| 0.0 | 0.1 | GO:0000262 | cytoplasmic chromosome(GO:0000229) mitochondrial chromosome(GO:0000262) |
| 0.0 | 0.1 | GO:0000111 | nucleotide-excision repair factor 2 complex(GO:0000111) |
| 0.0 | 0.3 | GO:0000346 | transcription export complex(GO:0000346) |
| 0.0 | 0.2 | GO:0005952 | cAMP-dependent protein kinase complex(GO:0005952) |
| 0.0 | 0.2 | GO:0005971 | ribonucleoside-diphosphate reductase complex(GO:0005971) |
| 0.0 | 0.1 | GO:0005827 | polar microtubule(GO:0005827) tubulin complex(GO:0045298) |
| 0.0 | 0.2 | GO:0034518 | RNA cap binding complex(GO:0034518) |
| 0.0 | 0.0 | GO:0005826 | actomyosin contractile ring(GO:0005826) contractile ring(GO:0070938) |
| 0.0 | 0.5 | GO:0005736 | DNA-directed RNA polymerase I complex(GO:0005736) |
| 0.0 | 2.0 | GO:0022627 | cytosolic small ribosomal subunit(GO:0022627) |
| 0.0 | 0.1 | GO:0042788 | polysomal ribosome(GO:0042788) |
| 0.0 | 0.1 | GO:0005853 | eukaryotic translation elongation factor 1 complex(GO:0005853) |
| 0.0 | 0.1 | GO:0000144 | cellular bud neck septin ring(GO:0000144) |
| 0.0 | 1.1 | GO:0005811 | lipid particle(GO:0005811) |
| 0.0 | 0.7 | GO:0005887 | integral component of plasma membrane(GO:0005887) |
| 0.0 | 0.3 | GO:0005744 | mitochondrial inner membrane presequence translocase complex(GO:0005744) |
| 0.0 | 0.1 | GO:0043625 | delta DNA polymerase complex(GO:0043625) |
| 0.0 | 0.1 | GO:0005940 | septin ring(GO:0005940) |
| 0.0 | 0.1 | GO:0030428 | cell septum(GO:0030428) |
| 0.0 | 0.7 | GO:0015935 | small ribosomal subunit(GO:0015935) |
| 0.0 | 0.1 | GO:0030123 | AP-3 adaptor complex(GO:0030123) |
| 0.0 | 0.1 | GO:0005797 | Golgi medial cisterna(GO:0005797) |
| 0.0 | 0.2 | GO:0000243 | commitment complex(GO:0000243) |
| 0.0 | 0.3 | GO:0098857 | membrane raft(GO:0045121) membrane microdomain(GO:0098857) |
| 0.0 | 0.1 | GO:0019774 | proteasome core complex, beta-subunit complex(GO:0019774) |
| 0.0 | 0.2 | GO:0005832 | chaperonin-containing T-complex(GO:0005832) |
| 0.0 | 0.1 | GO:0005956 | protein kinase CK2 complex(GO:0005956) |
| 0.0 | 0.3 | GO:0030118 | clathrin coat(GO:0030118) |
| 0.0 | 0.1 | GO:0034455 | t-UTP complex(GO:0034455) |
| 0.0 | 0.1 | GO:0097196 | Shu complex(GO:0097196) |
| 0.0 | 0.1 | GO:0043527 | tRNA methyltransferase complex(GO:0043527) |
| 0.0 | 0.0 | GO:0016363 | nuclear matrix(GO:0016363) |
| 0.0 | 0.1 | GO:0017053 | transcriptional repressor complex(GO:0017053) |
| 0.0 | 0.4 | GO:0000784 | nuclear chromosome, telomeric region(GO:0000784) |
| 0.0 | 0.1 | GO:0019773 | proteasome core complex, alpha-subunit complex(GO:0019773) |
| 0.0 | 0.0 | GO:0000930 | gamma-tubulin small complex, spindle pole body(GO:0000928) gamma-tubulin complex(GO:0000930) gamma-tubulin small complex(GO:0008275) |
| 0.0 | 0.1 | GO:0030892 | mitotic cohesin complex(GO:0030892) nuclear mitotic cohesin complex(GO:0034990) |
| 0.0 | 0.1 | GO:0030127 | COPII vesicle coat(GO:0030127) |
| 0.0 | 0.0 | GO:0070823 | HDA1 complex(GO:0070823) |
| 0.0 | 0.1 | GO:0072686 | mitotic spindle(GO:0072686) |
| 0.0 | 0.2 | GO:0022626 | cytosolic ribosome(GO:0022626) |
| 0.0 | 0.1 | GO:0008540 | proteasome regulatory particle, base subcomplex(GO:0008540) |
| 0.0 | 0.1 | GO:0033180 | vacuolar proton-transporting V-type ATPase, V1 domain(GO:0000221) proton-transporting V-type ATPase, V1 domain(GO:0033180) |
| 0.0 | 0.1 | GO:0033178 | mitochondrial proton-transporting ATP synthase complex, catalytic core F(1)(GO:0000275) proton-transporting two-sector ATPase complex, catalytic domain(GO:0033178) proton-transporting ATP synthase complex, catalytic core F(1)(GO:0045261) |
| 0.0 | 0.0 | GO:0005850 | eukaryotic translation initiation factor 2 complex(GO:0005850) |
| 0.0 | 2.0 | GO:0005933 | cellular bud(GO:0005933) |
| 0.0 | 0.0 | GO:0005868 | cytoplasmic dynein complex(GO:0005868) |
| 0.0 | 0.0 | GO:0033254 | vacuolar transporter chaperone complex(GO:0033254) |
| 0.0 | 0.1 | GO:0017059 | serine C-palmitoyltransferase complex(GO:0017059) SPOTS complex(GO:0035339) |
Gene overrepresentation in molecular function category:
| Log-likelihood per target | Total log-likelihood | Term | Description |
|---|---|---|---|
| 0.2 | 0.7 | GO:0004634 | phosphopyruvate hydratase activity(GO:0004634) |
| 0.2 | 0.7 | GO:0016872 | intramolecular lyase activity(GO:0016872) |
| 0.2 | 0.8 | GO:0015193 | L-proline transmembrane transporter activity(GO:0015193) |
| 0.2 | 0.7 | GO:0004523 | RNA-DNA hybrid ribonuclease activity(GO:0004523) |
| 0.2 | 0.6 | GO:0050291 | sphingosine N-acyltransferase activity(GO:0050291) |
| 0.1 | 0.9 | GO:0016846 | carbon-sulfur lyase activity(GO:0016846) |
| 0.1 | 0.4 | GO:0051219 | phosphoprotein binding(GO:0051219) |
| 0.1 | 0.5 | GO:0004467 | long-chain fatty acid-CoA ligase activity(GO:0004467) |
| 0.1 | 0.5 | GO:0016863 | intramolecular oxidoreductase activity, transposing C=C bonds(GO:0016863) |
| 0.1 | 0.4 | GO:0009922 | fatty acid elongase activity(GO:0009922) |
| 0.1 | 0.5 | GO:0015146 | pentose transmembrane transporter activity(GO:0015146) |
| 0.1 | 0.5 | GO:0003747 | translation release factor activity(GO:0003747) translation termination factor activity(GO:0008079) |
| 0.1 | 0.3 | GO:0015088 | copper uptake transmembrane transporter activity(GO:0015088) |
| 0.1 | 0.5 | GO:0017057 | 6-phosphogluconolactonase activity(GO:0017057) |
| 0.1 | 0.7 | GO:0004022 | alcohol dehydrogenase (NAD) activity(GO:0004022) |
| 0.1 | 0.3 | GO:0003938 | IMP dehydrogenase activity(GO:0003938) |
| 0.1 | 1.0 | GO:0005216 | ion channel activity(GO:0005216) |
| 0.1 | 0.4 | GO:0019206 | nucleoside kinase activity(GO:0019206) |
| 0.1 | 0.6 | GO:0016744 | transferase activity, transferring aldehyde or ketonic groups(GO:0016744) |
| 0.1 | 0.4 | GO:0015606 | spermidine transmembrane transporter activity(GO:0015606) |
| 0.1 | 0.3 | GO:0016634 | oxidoreductase activity, acting on the CH-CH group of donors, oxygen as acceptor(GO:0016634) |
| 0.1 | 0.3 | GO:0001186 | core promoter sequence-specific DNA binding(GO:0001046) transcription factor activity, RNA polymerase I transcription factor recruiting(GO:0001186) |
| 0.1 | 0.1 | GO:0000297 | spermine transmembrane transporter activity(GO:0000297) |
| 0.1 | 0.3 | GO:0004622 | lysophospholipase activity(GO:0004622) |
| 0.1 | 0.3 | GO:0050072 | m7G(5')pppN diphosphatase activity(GO:0050072) |
| 0.1 | 0.3 | GO:0005092 | GDP-dissociation inhibitor activity(GO:0005092) |
| 0.1 | 0.4 | GO:0004784 | superoxide dismutase activity(GO:0004784) oxidoreductase activity, acting on superoxide radicals as acceptor(GO:0016721) |
| 0.1 | 0.2 | GO:0016504 | peptidase activator activity(GO:0016504) |
| 0.1 | 0.5 | GO:0016861 | intramolecular oxidoreductase activity, interconverting aldoses and ketoses(GO:0016861) |
| 0.1 | 0.4 | GO:0015450 | P-P-bond-hydrolysis-driven protein transmembrane transporter activity(GO:0015450) |
| 0.1 | 0.2 | GO:0004690 | cyclic nucleotide-dependent protein kinase activity(GO:0004690) cAMP-dependent protein kinase activity(GO:0004691) |
| 0.1 | 0.5 | GO:0005353 | fructose transmembrane transporter activity(GO:0005353) mannose transmembrane transporter activity(GO:0015578) |
| 0.1 | 0.2 | GO:0015658 | L-tyrosine transmembrane transporter activity(GO:0005302) L-glutamine transmembrane transporter activity(GO:0015186) L-isoleucine transmembrane transporter activity(GO:0015188) branched-chain amino acid transmembrane transporter activity(GO:0015658) |
| 0.1 | 0.5 | GO:0005545 | 1-phosphatidylinositol binding(GO:0005545) |
| 0.0 | 0.1 | GO:0015173 | aromatic amino acid transmembrane transporter activity(GO:0015173) |
| 0.0 | 0.2 | GO:0016841 | ammonia-lyase activity(GO:0016841) |
| 0.0 | 0.2 | GO:0016417 | S-acyltransferase activity(GO:0016417) |
| 0.0 | 0.3 | GO:0015216 | purine nucleotide transmembrane transporter activity(GO:0015216) |
| 0.0 | 0.8 | GO:0050661 | NADP binding(GO:0050661) |
| 0.0 | 0.1 | GO:0015166 | polyol transmembrane transporter activity(GO:0015166) |
| 0.0 | 0.7 | GO:0015035 | protein disulfide oxidoreductase activity(GO:0015035) |
| 0.0 | 1.3 | GO:0046982 | protein heterodimerization activity(GO:0046982) |
| 0.0 | 0.2 | GO:0017150 | tRNA dihydrouridine synthase activity(GO:0017150) |
| 0.0 | 0.2 | GO:0004748 | ribonucleoside-diphosphate reductase activity, thioredoxin disulfide as acceptor(GO:0004748) oxidoreductase activity, acting on CH or CH2 groups(GO:0016725) oxidoreductase activity, acting on CH or CH2 groups, disulfide as acceptor(GO:0016728) ribonucleoside-diphosphate reductase activity(GO:0061731) |
| 0.0 | 0.1 | GO:0000150 | recombinase activity(GO:0000150) |
| 0.0 | 0.2 | GO:0070546 | L-phenylalanine aminotransferase activity(GO:0070546) L-phenylalanine:2-oxoglutarate aminotransferase activity(GO:0080130) |
| 0.0 | 0.2 | GO:0016709 | oxidoreductase activity, acting on paired donors, with incorporation or reduction of molecular oxygen, NAD(P)H as one donor, and incorporation of one atom of oxygen(GO:0016709) |
| 0.0 | 0.1 | GO:0015116 | secondary active sulfate transmembrane transporter activity(GO:0008271) sulfate transmembrane transporter activity(GO:0015116) |
| 0.0 | 0.1 | GO:0015248 | sterol transporter activity(GO:0015248) |
| 0.0 | 0.1 | GO:0016885 | ligase activity, forming carbon-carbon bonds(GO:0016885) |
| 0.0 | 0.1 | GO:0042134 | rRNA primary transcript binding(GO:0042134) |
| 0.0 | 0.1 | GO:0016274 | arginine N-methyltransferase activity(GO:0016273) protein-arginine N-methyltransferase activity(GO:0016274) |
| 0.0 | 0.4 | GO:0019239 | deaminase activity(GO:0019239) |
| 0.0 | 0.1 | GO:0097617 | RNA strand annealing activity(GO:0033592) annealing activity(GO:0097617) |
| 0.0 | 0.1 | GO:0000339 | RNA cap binding(GO:0000339) |
| 0.0 | 0.1 | GO:0015230 | FAD transmembrane transporter activity(GO:0015230) |
| 0.0 | 0.2 | GO:0070300 | phosphatidic acid binding(GO:0070300) |
| 0.0 | 0.5 | GO:0001054 | RNA polymerase I activity(GO:0001054) |
| 0.0 | 0.1 | GO:0005034 | osmosensor activity(GO:0005034) |
| 0.0 | 0.1 | GO:0016717 | oxidoreductase activity, acting on paired donors, with oxidation of a pair of donors resulting in the reduction of molecular oxygen to two molecules of water(GO:0016717) |
| 0.0 | 6.3 | GO:0003735 | structural constituent of ribosome(GO:0003735) |
| 0.0 | 0.1 | GO:0004707 | MAP kinase activity(GO:0004707) |
| 0.0 | 0.2 | GO:0004029 | aldehyde dehydrogenase (NAD) activity(GO:0004029) aldehyde dehydrogenase [NAD(P)+] activity(GO:0004030) |
| 0.0 | 0.3 | GO:0030276 | clathrin binding(GO:0030276) |
| 0.0 | 0.1 | GO:0017137 | Rab GTPase binding(GO:0017137) |
| 0.0 | 0.1 | GO:0008157 | protein phosphatase 1 binding(GO:0008157) |
| 0.0 | 0.9 | GO:0030674 | protein binding, bridging(GO:0030674) |
| 0.0 | 0.1 | GO:0004458 | D-lactate dehydrogenase (cytochrome) activity(GO:0004458) |
| 0.0 | 0.1 | GO:0003746 | translation elongation factor activity(GO:0003746) |
| 0.0 | 0.1 | GO:0004197 | cysteine-type endopeptidase activity(GO:0004197) |
| 0.0 | 0.1 | GO:0000774 | adenyl-nucleotide exchange factor activity(GO:0000774) |
| 0.0 | 0.1 | GO:0008139 | nuclear localization sequence binding(GO:0008139) |
| 0.0 | 0.2 | GO:0008320 | protein transmembrane transporter activity(GO:0008320) macromolecule transmembrane transporter activity(GO:0022884) |
| 0.0 | 0.1 | GO:0004809 | tRNA (guanine-N2-)-methyltransferase activity(GO:0004809) |
| 0.0 | 0.1 | GO:0008297 | single-stranded DNA exodeoxyribonuclease activity(GO:0008297) single-stranded DNA 3'-5' exodeoxyribonuclease activity(GO:0008310) |
| 0.0 | 0.1 | GO:0004661 | protein geranylgeranyltransferase activity(GO:0004661) |
| 0.0 | 0.1 | GO:0015179 | L-amino acid transmembrane transporter activity(GO:0015179) |
| 0.0 | 0.1 | GO:0031386 | protein tag(GO:0031386) |
| 0.0 | 0.3 | GO:0001671 | ATPase activator activity(GO:0001671) |
| 0.0 | 0.1 | GO:0016423 | tRNA (guanine) methyltransferase activity(GO:0016423) |
| 0.0 | 0.2 | GO:0001133 | RNA polymerase II transcription factor activity, sequence-specific transcription regulatory region DNA binding(GO:0001133) |
| 0.0 | 0.3 | GO:0015238 | drug transmembrane transporter activity(GO:0015238) |
| 0.0 | 0.3 | GO:0042162 | telomeric DNA binding(GO:0042162) |
| 0.0 | 0.1 | GO:0005385 | zinc ion transmembrane transporter activity(GO:0005385) |
| 0.0 | 0.1 | GO:0017169 | CDP-alcohol phosphatidyltransferase activity(GO:0017169) |
| 0.0 | 0.2 | GO:0016646 | oxidoreductase activity, acting on the CH-NH group of donors, NAD or NADP as acceptor(GO:0016646) |
| 0.0 | 0.1 | GO:0036002 | pre-mRNA binding(GO:0036002) |
| 0.0 | 0.1 | GO:0003873 | 6-phosphofructo-2-kinase activity(GO:0003873) |
| 0.0 | 0.0 | GO:0031370 | eukaryotic initiation factor 4G binding(GO:0031370) |
| 0.0 | 0.0 | GO:0004100 | chitin synthase activity(GO:0004100) |
| 0.0 | 0.0 | GO:0004826 | phenylalanine-tRNA ligase activity(GO:0004826) |
| 0.0 | 0.2 | GO:0008175 | tRNA methyltransferase activity(GO:0008175) |
| 0.0 | 0.0 | GO:0008443 | phosphofructokinase activity(GO:0008443) |
| 0.0 | 0.1 | GO:0019237 | centromeric DNA binding(GO:0019237) |
| 0.0 | 0.0 | GO:0003680 | AT DNA binding(GO:0003680) |
| 0.0 | 0.2 | GO:0070491 | repressing transcription factor binding(GO:0070491) |
| 0.0 | 0.0 | GO:0051010 | microtubule plus-end binding(GO:0051010) |
| 0.0 | 0.5 | GO:0008565 | protein transporter activity(GO:0008565) |
| 0.0 | 0.1 | GO:0004749 | ribose phosphate diphosphokinase activity(GO:0004749) |
| 0.0 | 0.2 | GO:0004407 | histone deacetylase activity(GO:0004407) protein deacetylase activity(GO:0033558) |
| 0.0 | 0.2 | GO:0042803 | protein homodimerization activity(GO:0042803) |
| 0.0 | 0.9 | GO:0003924 | GTPase activity(GO:0003924) |
| 0.0 | 0.0 | GO:0070568 | guanylyltransferase activity(GO:0070568) |
| 0.0 | 0.1 | GO:0005338 | nucleotide-sugar transmembrane transporter activity(GO:0005338) |
| 0.0 | 0.1 | GO:0000033 | alpha-1,3-mannosyltransferase activity(GO:0000033) |
| 0.0 | 0.1 | GO:0016701 | oxidoreductase activity, acting on single donors with incorporation of molecular oxygen(GO:0016701) oxidoreductase activity, acting on single donors with incorporation of molecular oxygen, incorporation of two atoms of oxygen(GO:0016702) |
| 0.0 | 0.1 | GO:0003993 | acid phosphatase activity(GO:0003993) |
| 0.0 | 0.0 | GO:0016832 | aldehyde-lyase activity(GO:0016832) |
| 0.0 | 0.4 | GO:0003779 | actin binding(GO:0003779) |
| 0.0 | 0.1 | GO:0070566 | adenylyltransferase activity(GO:0070566) |
| 0.0 | 0.1 | GO:0000026 | alpha-1,2-mannosyltransferase activity(GO:0000026) |
| 0.0 | 0.0 | GO:0019003 | GDP binding(GO:0019003) |
| 0.0 | 0.3 | GO:0016765 | transferase activity, transferring alkyl or aryl (other than methyl) groups(GO:0016765) |
Gene overrepresentation in curated gene sets: canonical pathways category:
| Log-likelihood per target | Total log-likelihood | Term | Description |
|---|---|---|---|
| 0.0 | 0.1 | PID P38 ALPHA BETA DOWNSTREAM PATHWAY | Signaling mediated by p38-alpha and p38-beta |
| 0.0 | 0.2 | PID CXCR4 PATHWAY | CXCR4-mediated signaling events |
| 0.0 | 0.1 | PID LKB1 PATHWAY | LKB1 signaling events |
| 0.0 | 0.1 | PID ERA GENOMIC PATHWAY | Validated nuclear estrogen receptor alpha network |
| 0.0 | 0.0 | PID IL4 2PATHWAY | IL4-mediated signaling events |
Gene overrepresentation in curated gene sets: REACTOME pathways category:
| Log-likelihood per target | Total log-likelihood | Term | Description |
|---|---|---|---|
| 0.2 | 0.7 | REACTOME GLYCOLYSIS | Genes involved in Glycolysis |
| 0.1 | 0.2 | REACTOME SULFUR AMINO ACID METABOLISM | Genes involved in Sulfur amino acid metabolism |
| 0.1 | 0.2 | REACTOME REGULATION OF MRNA STABILITY BY PROTEINS THAT BIND AU RICH ELEMENTS | Genes involved in Regulation of mRNA Stability by Proteins that Bind AU-rich Elements |
| 0.0 | 0.1 | REACTOME ETHANOL OXIDATION | Genes involved in Ethanol oxidation |
| 0.0 | 0.1 | REACTOME SIGNALING BY RHO GTPASES | Genes involved in Signaling by Rho GTPases |
| 0.0 | 0.2 | REACTOME FORMATION OF TUBULIN FOLDING INTERMEDIATES BY CCT TRIC | Genes involved in Formation of tubulin folding intermediates by CCT/TriC |
| 0.0 | 0.2 | REACTOME FORMATION OF THE TERNARY COMPLEX AND SUBSEQUENTLY THE 43S COMPLEX | Genes involved in Formation of the ternary complex, and subsequently, the 43S complex |
| 0.0 | 0.3 | REACTOME INFLUENZA VIRAL RNA TRANSCRIPTION AND REPLICATION | Genes involved in Influenza Viral RNA Transcription and Replication |
| 0.0 | 0.1 | REACTOME PLATELET ACTIVATION SIGNALING AND AGGREGATION | Genes involved in Platelet activation, signaling and aggregation |
| 0.0 | 0.0 | REACTOME RESPIRATORY ELECTRON TRANSPORT ATP SYNTHESIS BY CHEMIOSMOTIC COUPLING AND HEAT PRODUCTION BY UNCOUPLING PROTEINS | Genes involved in Respiratory electron transport, ATP synthesis by chemiosmotic coupling, and heat production by uncoupling proteins. |