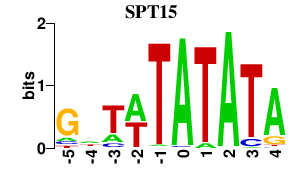
Results for SPT15
Z-value: 1.76
Motif logo
Transcription factors associated with SPT15
| Gene Symbol | Gene ID | Gene Info |
|---|---|---|
|
SPT15
|
S000000950 | TATA-binding protein |
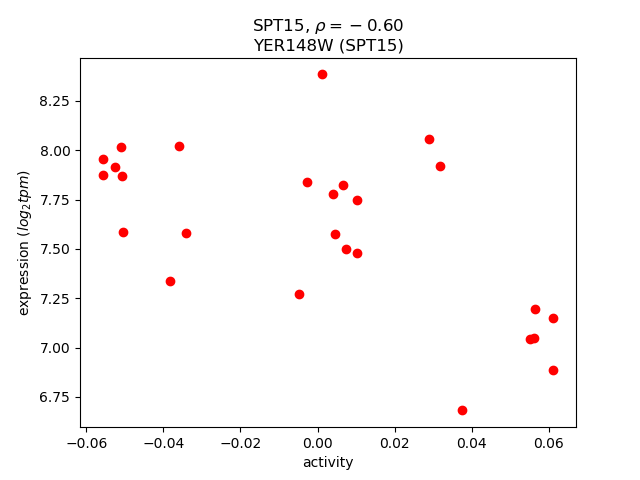
Activity-expression correlation:
Activity profile of SPT15 motif
Sorted Z-values of SPT15 motif
| Promoter | Log-likelihood | Transcript | Gene | Gene Info |
|---|---|---|---|---|
| YBR117C | 23.08 |
TKL2
|
Transketolase, similar to Tkl1p; catalyzes conversion of xylulose-5-phosphate and ribose-5-phosphate to sedoheptulose-7-phosphate and glyceraldehyde-3-phosphate in the pentose phosphate pathway; needed for synthesis of aromatic amino acids |
|
| YJL089W | 19.98 |
SIP4
|
C6 zinc cluster transcriptional activator that binds to the carbon source-responsive element (CSRE) of gluconeogenic genes; involved in the positive regulation of gluconeogenesis; regulated by Snf1p protein kinase; localized to the nucleus |
|
| YMR271C | 18.34 |
URA10
|
Minor orotate phosphoribosyltransferase (OPRTase) isozyme that catalyzes the fifth enzymatic step in the de novo biosynthesis of pyrimidines, converting orotate into orotidine-5'-phosphate; major OPRTase encoded by URA5 |
|
| YJR048W | 14.88 |
CYC1
|
Cytochrome c, isoform 1; electron carrier of the mitochondrial intermembrane space that transfers electrons from ubiquinone-cytochrome c oxidoreductase to cytochrome c oxidase during cellular respiration |
|
| YNR034W-A | 14.81 |
Putative protein of unknown function; expression is regulated by Msn2p/Msn4p |
||
| YMR107W | 14.37 |
SPG4
|
Protein required for survival at high temperature during stationary phase; not required for growth on nonfermentable carbon sources |
|
| YPL171C | 14.15 |
OYE3
|
Widely conserved NADPH oxidoreductase containing flavin mononucleotide (FMN), homologous to Oye2p with slight differences in ligand binding and catalytic properties; may be involved in sterol metabolism |
|
| YNL014W | 10.56 |
HEF3
|
Translational elongation factor EF-3; paralog of YEF3 and member of the ABC superfamily; stimulates EF-1 alpha-dependent binding of aminoacyl-tRNA by the ribosome; normally expressed in zinc deficient cells |
|
| YFL030W | 10.36 |
AGX1
|
Alanine:glyoxylate aminotransferase (AGT), catalyzes the synthesis of glycine from glyoxylate, which is one of three pathways for glycine biosynthesis in yeast; has similarity to mammalian and plant alanine:glyoxylate aminotransferases |
|
| YLR307C-A | 10.32 |
Putative protein of unknown function |
||
| YCL001W-B | 9.78 |
Putative protein of unknown function; identified by homology |
||
| YFR017C | 9.67 |
Putative protein of unknown function; green fluorescent protein (GFP)-fusion protein localizes to the cytoplasm and is induced in response to the DNA-damaging agent MMS; YFR017C is not an essential gene |
||
| YKR097W | 9.22 |
PCK1
|
Phosphoenolpyruvate carboxykinase, key enzyme in gluconeogenesis, catalyzes early reaction in carbohydrate biosynthesis, glucose represses transcription and accelerates mRNA degradation, regulated by Mcm1p and Cat8p, located in the cytosol |
|
| YEL039C | 9.21 |
CYC7
|
Cytochrome c isoform 2, expressed under hypoxic conditions; electron carrier of the mitochondrial intermembrane space that transfers electrons from ubiquinone-cytochrome c oxidoreductase to cytochrome c oxidase during cellular respiration |
|
| YMR206W | 8.97 |
Putative protein of unknown function; YMR206W is not an essential gene |
||
| YLR174W | 8.84 |
IDP2
|
Cytosolic NADP-specific isocitrate dehydrogenase, catalyzes oxidation of isocitrate to alpha-ketoglutarate; levels are elevated during growth on non-fermentable carbon sources and reduced during growth on glucose |
|
| YAR035W | 8.66 |
YAT1
|
Outer mitochondrial carnitine acetyltransferase, minor ethanol-inducible enzyme involved in transport of activated acyl groups from the cytoplasm into the mitochondrial matrix; phosphorylated |
|
| YAL062W | 8.52 |
GDH3
|
NADP(+)-dependent glutamate dehydrogenase, synthesizes glutamate from ammonia and alpha-ketoglutarate; rate of alpha-ketoglutarate utilization differs from Gdh1p; expression regulated by nitrogen and carbon sources |
|
| YCR005C | 8.52 |
CIT2
|
Citrate synthase, catalyzes the condensation of acetyl coenzyme A and oxaloacetate to form citrate, peroxisomal isozyme involved in glyoxylate cycle; expression is controlled by Rtg1p and Rtg2p transcription factors |
|
| YMR175W | 8.35 |
SIP18
|
Protein of unknown function whose expression is induced by osmotic stress |
|
| YCL040W | 8.31 |
GLK1
|
Glucokinase, catalyzes the phosphorylation of glucose at C6 in the first irreversible step of glucose metabolism; one of three glucose phosphorylating enzymes; expression regulated by non-fermentable carbon sources |
|
| YBL043W | 7.93 |
ECM13
|
Non-essential protein of unknown function; induced by treatment with 8-methoxypsoralen and UVA irradiation |
|
| YLR356W | 7.76 |
Putative protein of unknown function with similarity to SCM4; green fluorescent protein (GFP)-fusion protein localizes to mitochondria; YLR356W is not an essential gene |
||
| YPR027C | 7.64 |
Putative protein of unknown function |
||
| YLR142W | 7.62 |
PUT1
|
Proline oxidase, nuclear-encoded mitochondrial protein involved in utilization of proline as sole nitrogen source; PUT1 transcription is induced by Put3p in the presence of proline and the absence of a preferred nitrogen source |
|
| YPR030W | 7.53 |
CSR2
|
Nuclear protein with a potential regulatory role in utilization of galactose and nonfermentable carbon sources; overproduction suppresses the lethality at high temperature of a chs5 spa2 double null mutation; potential Cdc28p substrate |
|
| YER015W | 7.48 |
FAA2
|
Long chain fatty acyl-CoA synthetase; accepts a wider range of acyl chain lengths than Faa1p, preferring C9:0-C13:0; involved in the activation of endogenous pools of fatty acids |
|
| YLR004C | 7.45 |
THI73
|
Putative plasma membrane permease proposed to be involved in carboxylic acid uptake and repressed by thiamine; substrate of Dbf2p/Mob1p kinase; transcription is altered if mitochondrial dysfunction occurs |
|
| YCL042W | 7.44 |
Putative protein of unknown function; epitope-tagged protein localizes to the cytoplasm |
||
| YGR243W | 7.33 |
FMP43
|
Putative protein of unknown function; the authentic, non-tagged protein is detected in highly purified mitochondria in high-throughput studies |
|
| YLR377C | 7.21 |
FBP1
|
Fructose-1,6-bisphosphatase, key regulatory enzyme in the gluconeogenesis pathway, required for glucose metabolism |
|
| YDL210W | 7.02 |
UGA4
|
Permease that serves as a gamma-aminobutyrate (GABA) transport protein involved in the utilization of GABA as a nitrogen source; catalyzes the transport of putrescine and delta-aminolevulinic acid (ALA); localized to the vacuolar membrane |
|
| YIL099W | 6.96 |
SGA1
|
Intracellular sporulation-specific glucoamylase involved in glycogen degradation; induced during starvation of a/a diploids late in sporulation, but dispensable for sporulation |
|
| YGR032W | 6.78 |
GSC2
|
Catalytic subunit of 1,3-beta-glucan synthase, involved in formation of the inner layer of the spore wall; activity positively regulated by Rho1p and negatively by Smk1p; has similarity to an alternate catalytic subunit, Fks1p (Gsc1p) |
|
| YNL036W | 6.77 |
NCE103
|
Carbonic anhydrase; poorly transcribed under aerobic conditions and at an undetectable level under anaerobic conditions; involved in non-classical protein export pathway |
|
| YER158C | 6.76 |
Protein of unknown function, has similarity to Afr1p; potentially phosphorylated by Cdc28p |
||
| YKL065W-A | 6.66 |
Putative protein of unknown function |
||
| YFR053C | 6.63 |
HXK1
|
Hexokinase isoenzyme 1, a cytosolic protein that catalyzes phosphorylation of glucose during glucose metabolism; expression is highest during growth on non-glucose carbon sources; glucose-induced repression involves the hexokinase Hxk2p |
|
| YML087C | 6.58 |
AIM33
|
Putative protein of unknown function; highly conserved across species and orthologous to human CYB5R4; null mutant shows increased frequency of mitochondrial genome loss (petite formation) and severe growth defect in minimal glycerol media |
|
| YNR002C | 6.27 |
ATO2
|
Putative transmembrane protein involved in export of ammonia, a starvation signal that promotes cell death in aging colonies; phosphorylated in mitochondria; member of the TC 9.B.33 YaaH family; homolog of Ady2p and Y. lipolytica Gpr1p |
|
| YDR536W | 6.25 |
STL1
|
Glycerol proton symporter of the plasma membrane, subject to glucose-induced inactivation, strongly but transiently induced when cells are subjected to osmotic shock |
|
| YBL015W | 6.24 |
ACH1
|
Acetyl-coA hydrolase, primarily localized to mitochondria; phosphorylated; required for acetate utilization and for diploid pseudohyphal growth |
|
| YIL045W | 6.21 |
PIG2
|
Putative type-1 protein phosphatase targeting subunit that tethers Glc7p type-1 protein phosphatase to Gsy2p glycogen synthase |
|
| YJR146W | 6.21 |
Dubious open reading frame unlikely to encode a protein, based on available experimental and comparative sequence data; partially overlaps the verified gene HMS2 |
||
| YAL054C | 6.19 |
ACS1
|
Acetyl-coA synthetase isoform which, along with Acs2p, is the nuclear source of acetyl-coA for histone acetlyation; expressed during growth on nonfermentable carbon sources and under aerobic conditions |
|
| YKL141W | 6.13 |
SDH3
|
Cytochrome b subunit of succinate dehydrogenase (Sdh1p, Sdh2p, Sdh3p, Sdh4p), which couples the oxidation of succinate to the transfer of electrons to ubiquinone |
|
| YFR022W | 6.10 |
ROG3
|
Protein that binds to Rsp5p, which is a hect-type ubiquitin ligase, via its 2 PY motifs; has similarity to Rod1p; mutation suppresses the temperature sensitivity of an mck1 rim11 double mutant |
|
| YPL222C-A | 6.10 |
Identified by gene-trapping, microarray-based expression analysis, and genome-wide homology searching |
||
| YDR406W | 6.05 |
PDR15
|
Plasma membrane ATP binding cassette (ABC) transporter, multidrug transporter and general stress response factor implicated in cellular detoxification; regulated by Pdr1p, Pdr3p and Pdr8p; promoter contains a PDR responsive element |
|
| YHL046W-A | 5.93 |
Dubious open reading frame unlikely to encode a functional protein, based on available experimental and comparative sequence data |
||
| YPR002W | 5.88 |
PDH1
|
Mitochondrial protein that participates in respiration, induced by diauxic shift; homologous to E. coli PrpD, may take part in the conversion of 2-methylcitrate to 2-methylisocitrate |
|
| YFL058W | 5.83 |
THI5
|
Protein involved in synthesis of the thiamine precursor hydroxymethylpyrimidine (HMP); member of a subtelomeric gene family including THI5, THI11, THI12, and THI13 |
|
| YLR327C | 5.81 |
TMA10
|
Protein of unknown function that associates with ribosomes |
|
| YBL064C | 5.81 |
PRX1
|
Mitochondrial peroxiredoxin (1-Cys Prx) with thioredoxin peroxidase activity, has a role in reduction of hydroperoxides; induced during respiratory growth and under conditions of oxidative stress; phosphorylated |
|
| YFL019C | 5.77 |
Dubious open reading frame unlikely to encode a protein; YFL019C is not an essential gene |
||
| YJR095W | 5.75 |
SFC1
|
Mitochondrial succinate-fumarate transporter, transports succinate into and fumarate out of the mitochondrion; required for ethanol and acetate utilization |
|
| YEL011W | 5.74 |
GLC3
|
Glycogen branching enzyme, involved in glycogen accumulation; green fluorescent protein (GFP)-fusion protein localizes to the cytoplasm in a punctate pattern |
|
| YKR034W | 5.71 |
DAL80
|
Negative regulator of genes in multiple nitrogen degradation pathways; expression is regulated by nitrogen levels and by Gln3p; member of the GATA-binding family, forms homodimers and heterodimers with Deh1p |
|
| YPL165C | 5.71 |
SET6
|
Protein of unknown function; deletion heterozygote is sensitive to compounds that target ergosterol biosynthesis, may be involved in compound availability |
|
| YKL163W | 5.68 |
PIR3
|
O-glycosylated covalently-bound cell wall protein required for cell wall stability; expression is cell cycle regulated, peaking in M/G1 and also subject to regulation by the cell integrity pathway |
|
| YDR343C | 5.64 |
HXT6
|
High-affinity glucose transporter of the major facilitator superfamily, nearly identical to Hxt7p, expressed at high basal levels relative to other HXTs, repression of expression by high glucose requires SNF3 |
|
| YCL025C | 5.63 |
AGP1
|
Low-affinity amino acid permease with broad substrate range, involved in uptake of asparagine, glutamine, and other amino acids; expression is regulated by the SPS plasma membrane amino acid sensor system (Ssy1p-Ptr3p-Ssy5p) |
|
| YKL177W | 5.61 |
Dubious open reading frame unlikely to encode a protein, based on available experimental and comparative sequence data; partially overlaps the verified gene STE3 |
||
| YPR010C-A | 5.59 |
Putative protein of unknown function; conserved among Saccharomyces sensu stricto species |
||
| YOR152C | 5.58 |
Putative protein of unknown function; has no similarity to any known protein; YOR152C is not an essential gene |
||
| YHR096C | 5.48 |
HXT5
|
Hexose transporter with moderate affinity for glucose, induced in the presence of non-fermentable carbon sources, induced by a decrease in growth rate, contains an extended N-terminal domain relative to other HXTs |
|
| YML042W | 5.46 |
CAT2
|
Carnitine acetyl-CoA transferase present in both mitochondria and peroxisomes, transfers activated acetyl groups to carnitine to form acetylcarnitine which can be shuttled across membranes |
|
| YDR277C | 5.41 |
MTH1
|
Negative regulator of the glucose-sensing signal transduction pathway, required for repression of transcription by Rgt1p; interacts with Rgt1p and the Snf3p and Rgt2p glucose sensors; phosphorylated by Yck1p, triggering Mth1p degradation |
|
| YDL138W | 5.38 |
RGT2
|
Plasma membrane glucose receptor, highly similar to Snf3p; both Rgt2p and Snf3p serve as transmembrane glucose sensors generating an intracellular signal that induces expression of glucose transporter (HXT) genes |
|
| YJR078W | 5.37 |
BNA2
|
Putative tryptophan 2,3-dioxygenase or indoleamine 2,3-dioxygenase, required for the de novo biosynthesis of NAD from tryptophan via kynurenine; expression regulated by Hst1p and Aft2p |
|
| YNR058W | 5.35 |
BIO3
|
7,8-diamino-pelargonic acid aminotransferase (DAPA), catalyzes the second step in the biotin biosynthesis pathway; BIO3 is in a cluster of 3 genes (BIO3, BIO4, and BIO5) that mediate biotin synthesis |
|
| YHL047C | 5.32 |
ARN2
|
Transporter, member of the ARN family of transporters that specifically recognize siderophore-iron chelates; responsible for uptake of iron bound to the siderophore triacetylfusarinine C |
|
| YBR116C | 5.27 |
Dubious open reading frame unlikely to encode a protein, based on available experimental and comparative sequence data; partially overlaps the verified gene TKL2 |
||
| YHR217C | 5.23 |
Dubious open reading frame unlikely to encode a protein, based on available experimental and comparative sequence data; located in the telomeric region TEL08R. |
||
| YHR092C | 5.18 |
HXT4
|
High-affinity glucose transporter of the major facilitator superfamily, expression is induced by low levels of glucose and repressed by high levels of glucose |
|
| YDR119W-A | 5.16 |
Putative protein of unknown function |
||
| YHR053C | 5.15 |
CUP1-1
|
Metallothionein, binds copper and mediates resistance to high concentrations of copper and cadmium; locus is variably amplified in different strains, with two copies, CUP1-1 and CUP1-2, in the genomic sequence reference strain S288C |
|
| YHR139C | 5.12 |
SPS100
|
Protein required for spore wall maturation; expressed during sporulation; may be a component of the spore wall |
|
| YAR050W | 5.04 |
FLO1
|
Lectin-like protein involved in flocculation, cell wall protein that binds to mannose chains on the surface of other cells, confers floc-forming ability that is chymotrypsin sensitive and heat resistant; similar to Flo5p |
|
| YDR070C | 5.04 |
FMP16
|
Putative protein of unknown function; the authentic, non-tagged protein is detected in highly purified mitochondria in high-throughput studies |
|
| YBR147W | 5.02 |
RTC2
|
Putative protein of unknown function; the authentic, non-tagged protein is detected in highly purified mitochondria in high-throughput studies; null mutant displays fluconazole resistance and suppresses cdc13-1 temperature sensitivity |
|
| YHR001W-A | 5.02 |
QCR10
|
Subunit of the ubiqunol-cytochrome c oxidoreductase complex which includes Cobp, Rip1p, Cyt1p, Cor1p, Qcr2p, Qcr6p, Qcr7p, Qcr8p, Qcr9p, and Qcr10p and comprises part of the mitochondrial respiratory chain |
|
| YPL027W | 5.02 |
SMA1
|
Protein of unknown function involved in the assembly of the prospore membrane during sporulation |
|
| YKR102W | 4.87 |
FLO10
|
Lectin-like protein with similarity to Flo1p, thought to be involved in flocculation |
|
| YPL156C | 4.85 |
PRM4
|
Pheromone-regulated protein, predicted to have 1 transmembrane segment; transcriptionally regulated by Ste12p during mating and by Cat8p during the diauxic shift |
|
| YKL217W | 4.83 |
JEN1
|
Lactate transporter, required for uptake of lactate and pyruvate; phosphorylated; expression is derepressed by transcriptional activator Cat8p during respiratory growth, and repressed in the presence of glucose, fructose, and mannose |
|
| YNL200C | 4.82 |
Putative protein of unknown function; the authentic, non-tagged protein is detected in highly purified mitochondria in high-throughput studies |
||
| YGR256W | 4.82 |
GND2
|
6-phosphogluconate dehydrogenase (decarboxylating), catalyzes an NADPH regenerating reaction in the pentose phosphate pathway; required for growth on D-glucono-delta-lactone |
|
| YOR343C | 4.80 |
Dubious open reading frame, unlikely to encode a functional protein; based on available experimental and comparative sequence data |
||
| YPR184W | 4.76 |
GDB1
|
Glycogen debranching enzyme containing glucanotranferase and alpha-1,6-amyloglucosidase activities, required for glycogen degradation; phosphorylated in mitochondria |
|
| YBR296C | 4.73 |
PHO89
|
Na+/Pi cotransporter, active in early growth phase; similar to phosphate transporters of Neurospora crassa; transcription regulated by inorganic phosphate concentrations and Pho4p |
|
| YOR382W | 4.70 |
FIT2
|
Mannoprotein that is incorporated into the cell wall via a glycosylphosphatidylinositol (GPI) anchor, involved in the retention of siderophore-iron in the cell wall |
|
| YNR050C | 4.70 |
LYS9
|
Saccharopine dehydrogenase (NADP+, L-glutamate-forming); catalyzes the formation of saccharopine from alpha-aminoadipate 6-semialdehyde, which is the seventh step in lysine biosynthesis pathway |
|
| YPL006W | 4.67 |
NCR1
|
Vacuolar membrane protein that transits through the biosynthetic vacuolar protein sorting pathway, involved in sphingolipid metabolism; glycoprotein and functional orthologue of human Niemann Pick C1 (NPC1) protein |
|
| YPL240C | 4.67 |
HSP82
|
Hsp90 chaperone required for pheromone signaling and negative regulation of Hsf1p; docks with Tom70p for mitochondrial preprotein delivery; promotes telomerase DNA binding and nucleotide addition; interacts with Cns1p, Cpr6p, Cpr7p, Sti1p |
|
| YGL121C | 4.65 |
GPG1
|
Proposed gamma subunit of the heterotrimeric G protein that interacts with the receptor Grp1p; involved in regulation of pseudohyphal growth; requires Gpb1p or Gpb2p to interact with Gpa2p |
|
| YMR244W | 4.65 |
Putative protein of unknown function |
||
| YIL101C | 4.57 |
XBP1
|
Transcriptional repressor that binds to promoter sequences of the cyclin genes, CYS3, and SMF2; expression is induced by stress or starvation during mitosis, and late in meiosis; member of the Swi4p/Mbp1p family; potential Cdc28p substrate |
|
| YLR122C | 4.56 |
Dubious open reading frame unlikely to encode a protein, based on available experimental and comparative sequence data; partially overlaps the dubious ORF YLR123C |
||
| YAL060W | 4.56 |
BDH1
|
NAD-dependent (R,R)-butanediol dehydrogenase, catalyzes oxidation of (R,R)-2,3-butanediol to (3R)-acetoin, oxidation of meso-butanediol to (3S)-acetoin, and reduction of acetoin; enhances use of 2,3-butanediol as an aerobic carbon source |
|
| YGR066C | 4.55 |
Putative protein of unknown function |
||
| YDR036C | 4.55 |
EHD3
|
3-hydroxyisobutyryl-CoA hydrolase, member of a family of enoyl-CoA hydratase/isomerases; non-tagged protein is detected in highly purified mitochondria in high-throughput studies; phosphorylated; mutation affects fluid-phase endocytosis |
|
| YNL144C | 4.53 |
Putative protein of unknown function; the authentic, non-tagged protein is detected in highly purified mitochondria in high-throughput studies; YNL144C is not an essential gene |
||
| YDL223C | 4.52 |
HBT1
|
Substrate of the Hub1p ubiquitin-like protein that localizes to the shmoo tip (mating projection); mutants are defective for mating projection formation, thereby implicating Hbt1p in polarized cell morphogenesis |
|
| YKR046C | 4.51 |
PET10
|
Protein of unknown function that co-purifies with lipid particles; expression pattern suggests a role in respiratory growth; computational analysis of large-scale protein-protein interaction data suggests a role in ATP/ADP exchange |
|
| YGR142W | 4.50 |
BTN2
|
v-SNARE binding protein that facilitates specific protein retrieval from a late endosome to the Golgi; modulates arginine uptake, possible role in mediating pH homeostasis between the vacuole and plasma membrane H(+)-ATPase |
|
| YLL013C | 4.48 |
PUF3
|
Protein of the mitochondrial outer surface, links the Arp2/3 complex with the mitochore during anterograde mitochondrial movement; also binds to and promotes degradation of mRNAs for select nuclear-encoded mitochondrial proteins |
|
| YBR201C-A | 4.47 |
Putative protein of unknown function |
||
| YDR540C | 4.43 |
IRC4
|
Putative protein of unknown function; null mutant displays increased levels of spontaneous Rad52p foci; green fluorescent protein (GFP)-fusion protein localizes to the cytoplasm and nucleus |
|
| YHR033W | 4.43 |
Putative protein of unknown function; epitope-tagged protein localizes to the cytoplasm |
||
| YIL162W | 4.43 |
SUC2
|
Invertase, sucrose hydrolyzing enzyme; a secreted, glycosylated form is regulated by glucose repression, and an intracellular, nonglycosylated enzyme is produced constitutively |
|
| YDR234W | 4.42 |
LYS4
|
Homoaconitase, catalyzes the conversion of homocitrate to homoisocitrate, which is a step in the lysine biosynthesis pathway |
|
| YPL250C | 4.42 |
ICY2
|
Protein of unknown function; mobilized into polysomes upon a shift from a fermentable to nonfermentable carbon source; potential Cdc28p substrate |
|
| YJL144W | 4.42 |
Cytoplasmic hydrophilin of unknown function, possibly involved in the dessication response; expression induced by osmotic stress, starvation and during stationary phase; GFP-fusion protein is induced by the DNA-damaging agent MMS |
||
| YKL178C | 4.42 |
STE3
|
Receptor for a factor receptor, transcribed in alpha cells and required for mating by alpha cells, couples to MAP kinase cascade to mediate pheromone response; ligand bound receptors are endocytosed and recycled to the plasma membrane; GPCR |
|
| YOL035C | 4.41 |
Dubious open reading frame unlikely to encode a functional protein, based on available experimental and comparative sequence data |
||
| YCR011C | 4.40 |
ADP1
|
Putative ATP-dependent permease of the ABC transporter family of proteins |
|
| YGR065C | 4.38 |
VHT1
|
High-affinity plasma membrane H+-biotin (vitamin H) symporter; mutation results in fatty acid auxotrophy; 12 transmembrane domain containing major facilitator subfamily member; mRNA levels negatively regulated by iron deprivation and biotin |
|
| YOL118C | 4.36 |
Dubious open reading frame, unlikely to encode a functional protein; based on available experimental and comparative sequence data |
||
| YER065C | 4.29 |
ICL1
|
Isocitrate lyase, catalyzes the formation of succinate and glyoxylate from isocitrate, a key reaction of the glyoxylate cycle; expression of ICL1 is induced by growth on ethanol and repressed by growth on glucose |
|
| YBR105C | 4.27 |
VID24
|
Peripheral membrane protein located at Vid (vacuole import and degradation) vesicles; regulates fructose-1,6-bisphosphatase (FBPase) targeting to the vacuole; involved in proteasome-dependent catabolite degradation of FBPase |
|
| YAR047C | 4.25 |
Dubious open reading frame unlikely to encode a protein, based on available experimental and comparative sequence data |
||
| YML120C | 4.21 |
NDI1
|
NADH:ubiquinone oxidoreductase, transfers electrons from NADH to ubiquinone in the respiratory chain but does not pump protons, in contrast to the higher eukaryotic multisubunit respiratory complex I; phosphorylated; homolog of human AMID |
|
| YPR191W | 4.16 |
QCR2
|
Subunit 2 of the ubiquinol cytochrome-c reductase complex, which is a component of the mitochondrial inner membrane electron transport chain; phosphorylated; transcription is regulated by Hap1p, Hap2p/Hap3p, and heme |
|
| YER150W | 4.15 |
SPI1
|
GPI-anchored cell wall protein involved in weak acid resistance; basal expression requires Msn2p/Msn4p; expression is induced under conditions of stress and during the diauxic shift; similar to Sed1p |
|
| YLR258W | 4.15 |
GSY2
|
Glycogen synthase, similar to Gsy1p; expression induced by glucose limitation, nitrogen starvation, heat shock, and stationary phase; activity regulated by cAMP-dependent, Snf1p and Pho85p kinases as well as by the Gac1p-Glc7p phosphatase |
|
| YNL093W | 4.13 |
YPT53
|
GTPase, similar to Ypt51p and Ypt52p and to mammalian rab5; required for vacuolar protein sorting and endocytosis |
|
| YER038W-A | 4.11 |
FMP49
|
Dubious open reading frame, unlikely to encode a protein; not conserved in closely related Saccharomyces species; 99% of ORF overlaps the verified gene HVG1; protein product detected in mitochondria |
|
| YIL059C | 4.09 |
Dubious open reading frame unlikely to encode a protein, based on available experimental and comparative sequence data; partially overlaps the uncharacterized ORF YIL060W |
||
| YMR056C | 4.08 |
AAC1
|
Mitochondrial inner membrane ADP/ATP translocator, exchanges cytosolic ADP for mitochondrially synthesized ATP; phosphorylated; Aac1p is a minor isoform while Pet9p is the major ADP/ATP translocator |
|
| YGL255W | 4.07 |
ZRT1
|
High-affinity zinc transporter of the plasma membrane, responsible for the majority of zinc uptake; transcription is induced under low-zinc conditions by the Zap1p transcription factor |
|
| YGR144W | 4.07 |
THI4
|
Thiazole synthase, catalyzes formation of the thiazole moiety of thiamin pyrophosphate; required for thiamine biosynthesis and for mitochondrial genome stability |
|
| YJL152W | 4.03 |
Dubious ORF unlikely to encode a functional protein, based on available experimental and comparative sequence data |
||
| YPL262W | 3.96 |
FUM1
|
Fumarase, converts fumaric acid to L-malic acid in the TCA cycle; cytosolic and mitochondrial localization determined by the N-terminal mitochondrial targeting sequence and protein conformation; phosphorylated in mitochondria |
|
| YPL229W | 3.96 |
Putative protein of unknown function; green fluorescent protein (GFP)-fusion protein localizes to the cytoplasm; YPL229W is not an essential gene |
||
| YFL011W | 3.94 |
HXT10
|
Putative hexose transporter, expressed at low levels and expression is repressed by glucose |
|
| YIR034C | 3.94 |
LYS1
|
Saccharopine dehydrogenase (NAD+, L-lysine-forming), catalyzes the conversion of saccharopine to L-lysine, which is the final step in the lysine biosynthesis pathway |
|
| YBL033C | 3.94 |
RIB1
|
GTP cyclohydrolase II; catalyzes the first step of the riboflavin biosynthesis pathway |
|
| YNL037C | 3.93 |
IDH1
|
Subunit of mitochondrial NAD(+)-dependent isocitrate dehydrogenase, which catalyzes the oxidation of isocitrate to alpha-ketoglutarate in the TCA cycle |
|
| YPR028W | 3.92 |
YOP1
|
Membrane protein that interacts with Yip1p to mediate membrane traffic; overexpression results in cell death and accumulation of internal cell membranes; regulates vesicular traffic in stressed cells |
|
| YML083C | 3.92 |
Putative protein of unknown function; strong increase in transcript abundance during anaerobic growth compared to aerobic growth; cells deleted for YML083C do not exhibit growth defects in anerobic or anaerobic conditions |
||
| YMR194C-B | 3.91 |
Putative protein of unknown function |
||
| YGR067C | 3.90 |
Putative protein of unknown function; contains a zinc finger motif similar to that of Adr1p |
||
| YLR350W | 3.89 |
ORM2
|
Evolutionarily conserved protein with similarity to Orm1p, required for resistance to agents that induce the unfolded protein response; human ortholog is located in the endoplasmic reticulum |
|
| YDL026W | 3.89 |
Dubious ORF unlikely to encode a protein, based on available experimental and comparative sequence data |
||
| YIL136W | 3.88 |
OM45
|
Protein of unknown function, major constituent of the mitochondrial outer membrane; located on the outer (cytosolic) face of the outer membrane |
|
| YLR296W | 3.83 |
Dubious open reading frame unlikely to encode a protein, based on available experimental and comparative sequence data |
||
| YDR374C | 3.82 |
Putative protein of unknown function |
||
| YKL148C | 3.81 |
SDH1
|
Flavoprotein subunit of succinate dehydrogenase (Sdh1p, Sdh2p, Sdh3p, Sdh4p), which couples the oxidation of succinate to the transfer of electrons to ubiquinone |
|
| YML131W | 3.80 |
Putative protein of unknown function with similarity to oxidoreductases; HOG1 and SKO1-dependent mRNA expression is induced after osmotic shock; GFP-fusion protein localizes to the cytoplasm and is induced by the DNA-damaging agent MMS |
||
| YNR057C | 3.79 |
BIO4
|
Dethiobiotin synthetase, catalyzes the third step in the biotin biosynthesis pathway; BIO4 is in a cluster of 3 genes (BIO3, BIO4, and BIO5) that mediate biotin synthesis; expression appears to be repressed at low iron levels |
|
| YCL067C | 3.75 |
HMLALPHA2
|
Silenced copy of ALPHA2 at HML; homeobox-domain protein that associates with Mcm1p in haploid cells to repress a-specific gene expression and interacts with a1p in diploid cells to repress haploid-specific gene expression |
|
| YKL031W | 3.74 |
Dubious open reading frame, unlikely to encode a protein; not conserved in closely related Saccharomyces species |
||
| YCR091W | 3.74 |
KIN82
|
Putative serine/threonine protein kinase, most similar to cyclic nucleotide-dependent protein kinase subfamily and the protein kinase C subfamily |
|
| YNL194C | 3.74 |
Integral membrane protein localized to eisosomes; sporulation and plasma membrane sphingolipid content are altered in mutants; has homologs SUR7 and FMP45; GFP-fusion protein is induced in response to the DNA-damaging agent MMS |
||
| YKL034W | 3.74 |
TUL1
|
Golgi-localized RING-finger ubiquitin ligase (E3), involved in ubiquitinating and sorting membrane proteins that contain polar transmembrane domains to multivesicular bodies for delivery to the vacuole for quality control purposes |
|
| YCR010C | 3.73 |
ADY2
|
Acetate transporter required for normal sporulation; phosphorylated in mitochondria |
|
| YDR258C | 3.73 |
HSP78
|
Oligomeric mitochondrial matrix chaperone that cooperates with Ssc1p in mitochondrial thermotolerance after heat shock; prevents the aggregation of misfolded matrix proteins; component of the mitochondrial proteolysis system |
|
| YPL134C | 3.71 |
ODC1
|
Mitochondrial inner membrane transporter, exports 2-oxoadipate and 2-oxoglutarate from the mitochondrial matrix to the cytosol for lysine and glutamate biosynthesis and lysine catabolism; suppresses, in multicopy, an fmc1 null mutation |
|
| YLR123C | 3.70 |
Dubious open reading frame unlikely to encode a protein, based on available experimental and comparative sequence data; partially overlaps the dubious ORF YLR122C; contains characteristic aminoacyl-tRNA motif |
||
| YLR295C | 3.68 |
ATP14
|
Subunit h of the F0 sector of mitochondrial F1F0 ATP synthase, which is a large, evolutionarily conserved enzyme complex required for ATP synthesis |
|
| YGR146C | 3.68 |
Putative protein of unknown function; induced by iron homeostasis transcription factor Aft2p; multicopy suppressor of a temperature sensitive hsf1 mutant; induced by treatment with 8-methoxypsoralen and UVA irradiation |
||
| YDL085W | 3.68 |
NDE2
|
Mitochondrial external NADH dehydrogenase, catalyzes the oxidation of cytosolic NADH; Nde1p and Nde2p are involved in providing the cytosolic NADH to the mitochondrial respiratory chain |
|
| YGL062W | 3.66 |
PYC1
|
Pyruvate carboxylase isoform, cytoplasmic enzyme that converts pyruvate to oxaloacetate; highly similar to isoform Pyc2p but differentially regulated; mutations in the human homolog are associated with lactic acidosis |
|
| YLR237W | 3.66 |
THI7
|
Plasma membrane transporter responsible for the uptake of thiamine, member of the major facilitator superfamily of transporters; mutation of human ortholog causes thiamine-responsive megaloblastic anemia |
|
| YFL052W | 3.64 |
Putative zinc cluster protein that contains a DNA binding domain; null mutant sensitive to calcofluor white, low osmolarity and heat, suggesting a role for YFL052Wp in cell wall integrity |
||
| YMR306W | 3.64 |
FKS3
|
Protein involved in spore wall assembly, has similarity to 1,3-beta-D-glucan synthase catalytic subunits Fks1p and Gsc2p; the authentic, non-tagged protein is detected in highly purified mitochondria in high-throughput studies |
|
| YMR104C | 3.64 |
YPK2
|
Protein kinase with similarityto serine/threonine protein kinase Ypk1p; functionally redundant with YPK1 at the genetic level; participates in a signaling pathway required for optimal cell wall integrity; homolog of mammalian kinase SGK |
|
| YPR015C | 3.64 |
Putative protein of unknown function |
||
| YBR183W | 3.62 |
YPC1
|
Alkaline ceramidase that also has reverse (CoA-independent) ceramide synthase activity, catalyzes both breakdown and synthesis of phytoceramide; overexpression confers fumonisin B1 resistance |
|
| YPL247C | 3.61 |
Putative protein of unknown function; green fluorescent protein (GFP)-fusion protein localizes to the cytoplasm and nucleus; similar to the petunia WD repeat protein an11; YPL247C is not an essential gene |
||
| YOL119C | 3.59 |
MCH4
|
Protein with similarity to mammalian monocarboxylate permeases, which are involved in transport of monocarboxylic acids across the plasma membrane; mutant is not deficient in monocarboxylate transport |
|
| YPR192W | 3.58 |
AQY1
|
Spore-specific water channel that mediates the transport of water across cell membranes, developmentally controlled; may play a role in spore maturation, probably by allowing water outflow, may be involved in freeze tolerance |
|
| YNL322C | 3.57 |
KRE1
|
Cell wall glycoprotein involved in beta-glucan assembly; serves as a K1 killer toxin membrane receptor |
|
| YCR021C | 3.57 |
HSP30
|
Hydrophobic plasma membrane localized, stress-responsive protein that negatively regulates the H(+)-ATPase Pma1p; induced by heat shock, ethanol treatment, weak organic acid, glucose limitation, and entry into stationary phase |
|
| YLR136C | 3.56 |
TIS11
|
mRNA-binding protein expressed during iron starvation; binds to a sequence element in the 3'-untranslated regions of specific mRNAs to mediate their degradation; involved in iron homeostasis |
|
| YPL186C | 3.56 |
UIP4
|
Protein that interacts with Ulp1p, a Ubl (ubiquitin-like protein)-specific protease for Smt3p protein conjugates; detected in a phosphorylated state in the mitochondrial outer membrane; also detected in ER and nuclear envelope |
|
| YNL104C | 3.55 |
LEU4
|
Alpha-isopropylmalate synthase (2-isopropylmalate synthase); the main isozyme responsible for the first step in the leucine biosynthesis pathway |
|
| YBR101C | 3.55 |
FES1
|
Hsp70 (Ssa1p) nucleotide exchange factor, cytosolic homolog of Sil1p, which is the nucleotide exchange factor for BiP (Kar2p) in the endoplasmic reticulum |
|
| YGR197C | 3.55 |
SNG1
|
Protein involved in nitrosoguanidine (MNNG) resistance; expression is regulated by transcription factors involved in multidrug resistance |
|
| YHR126C | 3.54 |
Putative protein of unknown function; transcription dependent upon Azf1p |
||
| YHR071W | 3.53 |
PCL5
|
Cyclin, interacts with Pho85p cyclin-dependent kinase (Cdk), induced by Gcn4p at level of transcription, specifically required for Gcn4p degradation, may be sensor of cellular protein biosynthetic capacity |
|
| YBR076C-A | 3.53 |
Dubious open reading frame unlikely to encode a protein; partially overlaps verified gene ECM8; identified by fungal homology and RT-PCR |
||
| YDR178W | 3.52 |
SDH4
|
Membrane anchor subunit of succinate dehydrogenase (Sdh1p, Sdh2p, Sdh3p, Sdh4p), which couples the oxidation of succinate to the transfer of electrons to ubiquinone |
|
| YMR118C | 3.51 |
Protein of unknown function with similarity to succinate dehydrogenase cytochrome b subunit; YMR118C is not an essential gene |
||
| YJL199C | 3.51 |
MBB1
|
Dubious open reading frame, unlikely to encode a protein; not conserved in closely related Saccharomyces species; protein detected in large-scale protein-protein interaction studies |
|
| YGR182C | 3.49 |
Dubious open reading frame unlikely to encode a protein, based on available experimental and comparative sequence data; partially overlaps the verified ORF TIM13/YGR181W |
||
| YDL204W | 3.49 |
RTN2
|
Protein of unknown function; has similarity to mammalian reticulon proteins; member of the RTNLA (reticulon-like A) subfamily |
|
| YOR393W | 3.47 |
ERR1
|
Protein of unknown function, has similarity to enolases |
|
| YDL027C | 3.46 |
Putative protein of unknown function; the authentic, non-tagged protein is detected in highly purified mitochondria in high-throughput studies; YDL027C is not an essential gene |
||
| YER024W | 3.46 |
YAT2
|
Carnitine acetyltransferase; has similarity to Yat1p, which is a carnitine acetyltransferase associated with the mitochondrial outer membrane |
|
| YHR218W | 3.46 |
Helicase-like protein encoded within the telomeric Y' element |
||
| YFL020C | 3.46 |
PAU5
|
Part of 23-member seripauperin multigene family encoded mainly in subtelomeric regions, active during alcoholic fermentation, regulated by anaerobiosis, negatively regulated by oxygen, repressed by heme |
|
| YIL100C-A | 3.45 |
Dubious open reading frame unlikely to encode a functional protein, based on available experimental and comparative sequence data |
||
| YMR081C | 3.45 |
ISF1
|
Serine-rich, hydrophilic protein with similarity to Mbr1p; overexpression suppresses growth defects of hap2, hap3, and hap4 mutants; expression is under glucose control; cotranscribed with NAM7 in a cyp1 mutant |
|
| YMR141C | 3.44 |
Dubious open reading frame unlikely to encode a functional protein, based on available experimental and comparative sequence data |
||
| YKL067W | 3.44 |
YNK1
|
Nucleoside diphosphate kinase, catalyzes the transfer of gamma phosphates from nucleoside triphosphates, usually ATP, to nucleoside diphosphates by a mechanism that involves formation of an autophosphorylated enzyme intermediate |
|
| YGL227W | 3.44 |
VID30
|
Protein involved in proteasome-dependent catabolite degradation of fructose-1,6-bisphosphatase (FBPase); shifts the balance of nitrogen metabolism toward the production of glutamate; localized to the nucleus and the cytoplasm |
|
| YMR251W | 3.44 |
GTO3
|
Omega class glutathione transferase; putative cytosolic localization |
|
| YDL244W | 3.43 |
THI13
|
Protein involved in synthesis of the thiamine precursor hydroxymethylpyrimidine (HMP); member of a subtelomeric gene family including THI5, THI11, THI12, and THI13 |
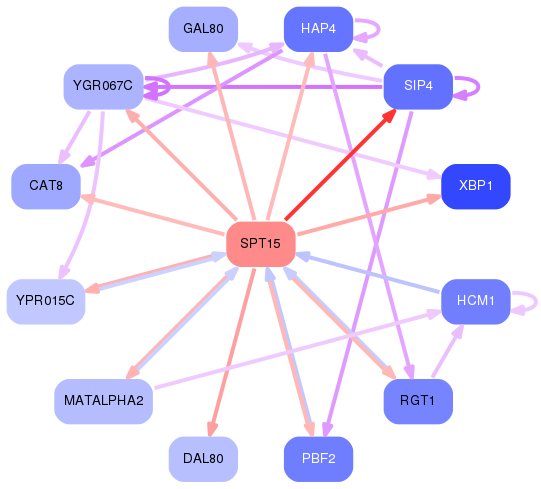
Network of associatons between targets according to the STRING database.

First level regulatory network of SPT15
Gene Ontology Analysis
Gene overrepresentation in biological process category:
| Log-likelihood per target | Total log-likelihood | Term | Description |
|---|---|---|---|
| 7.5 | 22.6 | GO:0061414 | regulation of gluconeogenesis by regulation of transcription from RNA polymerase II promoter(GO:0035947) positive regulation of gluconeogenesis by positive regulation of transcription from RNA polymerase II promoter(GO:0035948) regulation of transcription from RNA polymerase II promoter by a nonfermentable carbon source(GO:0061413) positive regulation of transcription from RNA polymerase II promoter by a nonfermentable carbon source(GO:0061414) |
| 5.9 | 17.6 | GO:0009437 | amino-acid betaine metabolic process(GO:0006577) carnitine metabolic process(GO:0009437) |
| 4.4 | 17.6 | GO:0046323 | glucose import(GO:0046323) |
| 3.9 | 11.8 | GO:0006545 | glycine biosynthetic process(GO:0006545) |
| 3.7 | 37.1 | GO:0006122 | mitochondrial electron transport, ubiquinol to cytochrome c(GO:0006122) |
| 3.3 | 26.5 | GO:0006097 | glyoxylate cycle(GO:0006097) |
| 3.3 | 16.3 | GO:0006121 | mitochondrial electron transport, succinate to ubiquinone(GO:0006121) |
| 2.9 | 11.8 | GO:0006848 | pyruvate transport(GO:0006848) |
| 2.9 | 17.3 | GO:0006207 | 'de novo' pyrimidine nucleobase biosynthetic process(GO:0006207) 'de novo' UMP biosynthetic process(GO:0044205) |
| 2.6 | 10.3 | GO:0006075 | (1->3)-beta-D-glucan biosynthetic process(GO:0006075) |
| 2.4 | 12.2 | GO:0005980 | glycogen catabolic process(GO:0005980) |
| 2.4 | 21.7 | GO:0006537 | glutamate biosynthetic process(GO:0006537) |
| 2.3 | 6.8 | GO:0072488 | ammonium transmembrane transport(GO:0072488) |
| 2.2 | 13.5 | GO:0009102 | biotin metabolic process(GO:0006768) biotin biosynthetic process(GO:0009102) |
| 2.2 | 6.6 | GO:0051594 | detection of chemical stimulus(GO:0009593) detection of carbohydrate stimulus(GO:0009730) detection of hexose stimulus(GO:0009732) detection of monosaccharide stimulus(GO:0034287) detection of glucose(GO:0051594) detection of stimulus(GO:0051606) |
| 2.1 | 16.7 | GO:0015891 | siderophore transport(GO:0015891) |
| 2.0 | 6.1 | GO:0010466 | negative regulation of peptidase activity(GO:0010466) regulation of peptidase activity(GO:0052547) |
| 2.0 | 8.2 | GO:0046688 | response to copper ion(GO:0046688) |
| 2.0 | 8.1 | GO:0071462 | response to water(GO:0009415) cellular response to water stimulus(GO:0071462) |
| 2.0 | 35.4 | GO:0006772 | thiamine metabolic process(GO:0006772) |
| 2.0 | 5.9 | GO:0019543 | propionate metabolic process(GO:0019541) propionate catabolic process(GO:0019543) short-chain fatty acid catabolic process(GO:0019626) propionate catabolic process, 2-methylcitrate cycle(GO:0019629) |
| 1.9 | 5.8 | GO:0030149 | sphingolipid catabolic process(GO:0030149) membrane lipid catabolic process(GO:0046466) |
| 1.9 | 5.7 | GO:0090295 | nitrogen catabolite repression of transcription(GO:0090295) |
| 1.9 | 28.1 | GO:0006098 | pentose-phosphate shunt(GO:0006098) glyceraldehyde-3-phosphate metabolic process(GO:0019682) |
| 1.9 | 11.2 | GO:0000128 | flocculation(GO:0000128) flocculation via cell wall protein-carbohydrate interaction(GO:0000501) |
| 1.8 | 5.5 | GO:0015888 | thiamine transport(GO:0015888) |
| 1.8 | 7.2 | GO:0015976 | carbon utilization(GO:0015976) |
| 1.8 | 16.1 | GO:0070086 | ubiquitin-dependent endocytosis(GO:0070086) |
| 1.8 | 12.3 | GO:0007532 | regulation of mating-type specific transcription, DNA-templated(GO:0007532) |
| 1.7 | 5.2 | GO:0043335 | protein unfolding(GO:0043335) |
| 1.7 | 8.6 | GO:0015793 | glycerol transport(GO:0015793) |
| 1.7 | 6.7 | GO:0015847 | putrescine transport(GO:0015847) |
| 1.7 | 16.6 | GO:0019878 | lysine biosynthetic process via aminoadipic acid(GO:0019878) |
| 1.6 | 8.1 | GO:0032974 | amino acid transmembrane export from vacuole(GO:0032974) vacuolar transmembrane transport(GO:0034486) vacuolar amino acid transmembrane transport(GO:0034487) amino acid transmembrane export(GO:0044746) |
| 1.6 | 8.0 | GO:0034627 | 'de novo' NAD biosynthetic process from tryptophan(GO:0034354) 'de novo' NAD biosynthetic process(GO:0034627) |
| 1.6 | 4.7 | GO:0006538 | glutamate catabolic process(GO:0006538) |
| 1.6 | 18.7 | GO:0046352 | disaccharide catabolic process(GO:0046352) |
| 1.6 | 4.7 | GO:0032780 | negative regulation of ATPase activity(GO:0032780) |
| 1.5 | 3.1 | GO:0006740 | NADPH regeneration(GO:0006740) |
| 1.5 | 6.1 | GO:0015886 | heme transport(GO:0015886) |
| 1.5 | 7.4 | GO:0042732 | D-xylose metabolic process(GO:0042732) |
| 1.4 | 4.3 | GO:1905038 | regulation of sphingolipid biosynthetic process(GO:0090153) negative regulation of sphingolipid biosynthetic process(GO:0090155) regulation of membrane lipid metabolic process(GO:1905038) |
| 1.4 | 24.4 | GO:0005978 | glycogen biosynthetic process(GO:0005978) |
| 1.4 | 1.4 | GO:0000304 | response to singlet oxygen(GO:0000304) |
| 1.4 | 6.9 | GO:0006083 | acetate metabolic process(GO:0006083) |
| 1.4 | 2.7 | GO:0072353 | cellular age-dependent response to reactive oxygen species(GO:0072353) |
| 1.4 | 5.5 | GO:0051180 | vitamin transport(GO:0051180) |
| 1.3 | 4.0 | GO:0051469 | vesicle fusion with vacuole(GO:0051469) |
| 1.3 | 3.9 | GO:0043068 | positive regulation of cell death(GO:0010942) positive regulation of apoptotic process(GO:0043065) positive regulation of programmed cell death(GO:0043068) |
| 1.3 | 3.8 | GO:0045117 | azole transport(GO:0045117) |
| 1.3 | 11.4 | GO:0006829 | zinc II ion transport(GO:0006829) |
| 1.2 | 1.2 | GO:0009313 | oligosaccharide catabolic process(GO:0009313) |
| 1.2 | 4.9 | GO:0019563 | alditol catabolic process(GO:0019405) glycerol catabolic process(GO:0019563) |
| 1.2 | 3.5 | GO:0006527 | arginine catabolic process(GO:0006527) |
| 1.2 | 5.8 | GO:0001676 | long-chain fatty acid metabolic process(GO:0001676) |
| 1.1 | 3.4 | GO:0006624 | vacuolar protein processing(GO:0006624) |
| 1.1 | 16.8 | GO:0019740 | nitrogen utilization(GO:0019740) |
| 1.1 | 4.4 | GO:0019320 | glucose catabolic process(GO:0006007) hexose catabolic process(GO:0019320) glycolytic fermentation to ethanol(GO:0019655) glycolytic fermentation(GO:0019660) hexose catabolic process to ethanol(GO:1902707) |
| 1.1 | 4.3 | GO:0016242 | negative regulation of macroautophagy(GO:0016242) negative regulation of response to external stimulus(GO:0032102) negative regulation of response to extracellular stimulus(GO:0032105) negative regulation of response to nutrient levels(GO:0032108) |
| 1.1 | 1.1 | GO:0006552 | leucine catabolic process(GO:0006552) |
| 1.0 | 6.3 | GO:0051292 | pore complex assembly(GO:0046931) nuclear pore complex assembly(GO:0051292) |
| 1.0 | 3.1 | GO:0006688 | glycosphingolipid biosynthetic process(GO:0006688) |
| 1.0 | 4.0 | GO:0006598 | polyamine catabolic process(GO:0006598) |
| 1.0 | 8.9 | GO:0046686 | response to cadmium ion(GO:0046686) |
| 1.0 | 2.9 | GO:0006572 | tyrosine catabolic process(GO:0006572) |
| 0.9 | 1.9 | GO:0008272 | sulfate transport(GO:0008272) |
| 0.9 | 15.1 | GO:0006754 | ATP biosynthetic process(GO:0006754) |
| 0.9 | 2.8 | GO:1900460 | negative regulation of invasive growth in response to glucose limitation by negative regulation of transcription from RNA polymerase II promoter(GO:1900460) |
| 0.9 | 8.8 | GO:0072350 | tricarboxylic acid metabolic process(GO:0072350) |
| 0.9 | 2.6 | GO:0009438 | methylglyoxal metabolic process(GO:0009438) methylglyoxal catabolic process to D-lactate via S-lactoyl-glutathione(GO:0019243) methylglyoxal catabolic process(GO:0051596) methylglyoxal catabolic process to lactate(GO:0061727) |
| 0.8 | 2.5 | GO:0019388 | galactose catabolic process(GO:0019388) galactose catabolic process via UDP-galactose(GO:0033499) |
| 0.8 | 2.5 | GO:0006089 | lactate metabolic process(GO:0006089) |
| 0.8 | 3.3 | GO:0043954 | cellular component maintenance(GO:0043954) |
| 0.8 | 4.1 | GO:0009208 | CTP biosynthetic process(GO:0006241) pyrimidine ribonucleoside triphosphate metabolic process(GO:0009208) pyrimidine ribonucleoside triphosphate biosynthetic process(GO:0009209) CTP metabolic process(GO:0046036) |
| 0.8 | 4.9 | GO:0009083 | branched-chain amino acid catabolic process(GO:0009083) |
| 0.8 | 7.0 | GO:0000755 | cytogamy(GO:0000755) |
| 0.8 | 6.8 | GO:0071709 | ascospore-type prospore membrane assembly(GO:0032120) membrane biogenesis(GO:0044091) membrane assembly(GO:0071709) |
| 0.7 | 0.7 | GO:0051156 | glucose 6-phosphate metabolic process(GO:0051156) |
| 0.7 | 3.7 | GO:0051099 | positive regulation of binding(GO:0051099) |
| 0.7 | 12.6 | GO:0008645 | hexose transport(GO:0008645) monosaccharide transport(GO:0015749) |
| 0.7 | 2.9 | GO:2000911 | positive regulation of lipid transport(GO:0032370) regulation of sterol transport(GO:0032371) positive regulation of sterol transport(GO:0032373) positive regulation of transmembrane transport(GO:0034764) regulation of sterol import by regulation of transcription from RNA polymerase II promoter(GO:0035968) positive regulation of sterol import by positive regulation of transcription from RNA polymerase II promoter(GO:0035969) regulation of lipid transport by regulation of transcription from RNA polymerase II promoter(GO:0072367) regulation of lipid transport by positive regulation of transcription from RNA polymerase II promoter(GO:0072369) regulation of sterol import(GO:2000909) positive regulation of sterol import(GO:2000911) |
| 0.7 | 2.1 | GO:0006390 | transcription from mitochondrial promoter(GO:0006390) |
| 0.7 | 2.1 | GO:0015740 | C4-dicarboxylate transport(GO:0015740) |
| 0.7 | 3.5 | GO:0006012 | galactose metabolic process(GO:0006012) |
| 0.7 | 4.2 | GO:0000492 | box C/D snoRNP assembly(GO:0000492) |
| 0.7 | 6.3 | GO:0000196 | MAPK cascade involved in cell wall organization or biogenesis(GO:0000196) |
| 0.7 | 2.0 | GO:0097577 | intracellular sequestering of iron ion(GO:0006880) sequestering of metal ion(GO:0051238) sequestering of iron ion(GO:0097577) |
| 0.7 | 2.6 | GO:0052652 | cAMP biosynthetic process(GO:0006171) cyclic nucleotide biosynthetic process(GO:0009190) cyclic purine nucleotide metabolic process(GO:0052652) |
| 0.6 | 1.3 | GO:0001324 | age-dependent general metabolic decline involved in chronological cell aging(GO:0001323) age-dependent response to oxidative stress involved in chronological cell aging(GO:0001324) |
| 0.6 | 2.6 | GO:0015855 | pyrimidine nucleobase transport(GO:0015855) |
| 0.6 | 3.2 | GO:0051260 | protein homooligomerization(GO:0051260) |
| 0.6 | 3.8 | GO:0000920 | cell separation after cytokinesis(GO:0000920) |
| 0.6 | 1.7 | GO:0015680 | intracellular copper ion transport(GO:0015680) |
| 0.6 | 3.4 | GO:0006591 | ornithine metabolic process(GO:0006591) |
| 0.6 | 1.1 | GO:0071466 | cellular response to xenobiotic stimulus(GO:0071466) |
| 0.6 | 1.1 | GO:2000058 | regulation of protein ubiquitination involved in ubiquitin-dependent protein catabolic process(GO:2000058) |
| 0.5 | 1.1 | GO:0010507 | negative regulation of autophagy(GO:0010507) |
| 0.5 | 2.2 | GO:0000023 | maltose metabolic process(GO:0000023) |
| 0.5 | 4.1 | GO:0045332 | phospholipid translocation(GO:0045332) |
| 0.5 | 1.0 | GO:0061395 | regulation of transcription from RNA polymerase II promoter in response to arsenic-containing substance(GO:0061394) positive regulation of transcription from RNA polymerase II promoter in response to arsenic-containing substance(GO:0061395) cellular response to arsenic-containing substance(GO:0071243) |
| 0.5 | 2.1 | GO:0010993 | regulation of ubiquitin homeostasis(GO:0010993) |
| 0.5 | 3.1 | GO:0070941 | eisosome assembly(GO:0070941) |
| 0.5 | 0.5 | GO:0061410 | positive regulation of transcription from RNA polymerase II promoter in response to ethanol(GO:0061410) cellular response to ethanol(GO:0071361) cellular response to alcohol(GO:0097306) |
| 0.5 | 1.4 | GO:0031930 | mitochondria-nucleus signaling pathway(GO:0031930) |
| 0.5 | 2.8 | GO:0000114 | obsolete regulation of transcription involved in G1 phase of mitotic cell cycle(GO:0000114) |
| 0.5 | 3.8 | GO:0018345 | protein palmitoylation(GO:0018345) |
| 0.5 | 3.8 | GO:0015893 | drug transport(GO:0015893) |
| 0.5 | 2.3 | GO:0032048 | cardiolipin metabolic process(GO:0032048) |
| 0.5 | 2.8 | GO:0006465 | signal peptide processing(GO:0006465) |
| 0.5 | 6.9 | GO:0072329 | monocarboxylic acid catabolic process(GO:0072329) |
| 0.4 | 1.3 | GO:0010688 | negative regulation of ribosomal protein gene transcription from RNA polymerase II promoter(GO:0010688) |
| 0.4 | 7.4 | GO:0008219 | apoptotic process(GO:0006915) cell death(GO:0008219) programmed cell death(GO:0012501) |
| 0.4 | 0.4 | GO:0051259 | protein oligomerization(GO:0051259) |
| 0.4 | 3.0 | GO:0045721 | negative regulation of gluconeogenesis(GO:0045721) |
| 0.4 | 1.3 | GO:0051093 | negative regulation of cell differentiation(GO:0045596) negative regulation of developmental process(GO:0051093) |
| 0.4 | 2.1 | GO:0000390 | spliceosomal complex disassembly(GO:0000390) |
| 0.4 | 1.2 | GO:0006000 | fructose metabolic process(GO:0006000) |
| 0.4 | 9.1 | GO:0000422 | mitophagy(GO:0000422) mitochondrion disassembly(GO:0061726) |
| 0.4 | 1.6 | GO:0044070 | regulation of anion transport(GO:0044070) |
| 0.4 | 14.3 | GO:0009060 | aerobic respiration(GO:0009060) |
| 0.4 | 4.8 | GO:0042026 | protein refolding(GO:0042026) |
| 0.4 | 1.6 | GO:0032781 | positive regulation of ATPase activity(GO:0032781) |
| 0.4 | 2.7 | GO:0009231 | riboflavin metabolic process(GO:0006771) riboflavin biosynthetic process(GO:0009231) |
| 0.4 | 3.0 | GO:0010526 | negative regulation of transposition, RNA-mediated(GO:0010526) negative regulation of transposition(GO:0010529) |
| 0.4 | 1.9 | GO:0043112 | receptor recycling(GO:0001881) protein import into peroxisome matrix, receptor recycling(GO:0016562) receptor metabolic process(GO:0043112) |
| 0.4 | 4.8 | GO:0034087 | establishment of sister chromatid cohesion(GO:0034085) establishment of mitotic sister chromatid cohesion(GO:0034087) |
| 0.4 | 13.6 | GO:0070726 | cell wall assembly(GO:0070726) |
| 0.4 | 0.7 | GO:0000042 | protein targeting to Golgi(GO:0000042) establishment of protein localization to Golgi(GO:0072600) |
| 0.4 | 1.1 | GO:0006784 | heme a biosynthetic process(GO:0006784) heme a metabolic process(GO:0046160) |
| 0.3 | 10.6 | GO:0006200 | obsolete ATP catabolic process(GO:0006200) |
| 0.3 | 1.0 | GO:0006798 | polyphosphate catabolic process(GO:0006798) |
| 0.3 | 1.5 | GO:0017183 | peptidyl-diphthamide metabolic process(GO:0017182) peptidyl-diphthamide biosynthetic process from peptidyl-histidine(GO:0017183) |
| 0.3 | 1.2 | GO:0046685 | response to arsenic-containing substance(GO:0046685) |
| 0.3 | 3.3 | GO:0072593 | reactive oxygen species metabolic process(GO:0072593) |
| 0.3 | 2.6 | GO:0015802 | basic amino acid transport(GO:0015802) |
| 0.3 | 0.3 | GO:0046185 | aldehyde catabolic process(GO:0046185) |
| 0.3 | 1.5 | GO:0043328 | protein targeting to vacuole involved in ubiquitin-dependent protein catabolic process via the multivesicular body sorting pathway(GO:0043328) |
| 0.3 | 0.9 | GO:0045141 | meiotic telomere clustering(GO:0045141) establishment of chromosome localization(GO:0051303) chromosome localization to nuclear envelope involved in homologous chromosome segregation(GO:0090220) |
| 0.3 | 2.0 | GO:0006816 | calcium ion transport(GO:0006816) |
| 0.3 | 3.5 | GO:0045991 | carbon catabolite activation of transcription(GO:0045991) |
| 0.3 | 2.6 | GO:0033617 | mitochondrial respiratory chain complex IV assembly(GO:0033617) |
| 0.3 | 2.0 | GO:0097034 | mitochondrial respiratory chain complex IV biogenesis(GO:0097034) |
| 0.3 | 1.4 | GO:0000244 | spliceosomal tri-snRNP complex assembly(GO:0000244) |
| 0.3 | 1.6 | GO:0010388 | protein deneddylation(GO:0000338) cullin deneddylation(GO:0010388) |
| 0.3 | 5.1 | GO:0006895 | Golgi to endosome transport(GO:0006895) |
| 0.3 | 0.8 | GO:0017003 | protein-heme linkage(GO:0017003) protein-tetrapyrrole linkage(GO:0017006) cytochrome c-heme linkage(GO:0018063) |
| 0.3 | 2.1 | GO:0051181 | cofactor transport(GO:0051181) |
| 0.2 | 1.0 | GO:0000272 | polysaccharide catabolic process(GO:0000272) |
| 0.2 | 2.5 | GO:0006081 | cellular aldehyde metabolic process(GO:0006081) |
| 0.2 | 1.9 | GO:0006616 | SRP-dependent cotranslational protein targeting to membrane, translocation(GO:0006616) |
| 0.2 | 1.2 | GO:0018904 | glycerol ether metabolic process(GO:0006662) ether metabolic process(GO:0018904) |
| 0.2 | 0.7 | GO:0031055 | chromatin remodeling at centromere(GO:0031055) |
| 0.2 | 2.6 | GO:0032509 | endosome transport via multivesicular body sorting pathway(GO:0032509) |
| 0.2 | 1.4 | GO:0006279 | premeiotic DNA replication(GO:0006279) |
| 0.2 | 0.7 | GO:0045950 | negative regulation of mitotic recombination(GO:0045950) |
| 0.2 | 0.2 | GO:0034762 | regulation of transmembrane transport(GO:0034762) |
| 0.2 | 4.6 | GO:0098660 | inorganic ion transmembrane transport(GO:0098660) |
| 0.2 | 0.2 | GO:0000706 | meiotic DNA double-strand break processing(GO:0000706) DNA double-strand break processing(GO:0000729) |
| 0.2 | 0.7 | GO:0090399 | replicative senescence(GO:0090399) |
| 0.2 | 0.7 | GO:0043484 | regulation of RNA splicing(GO:0043484) regulation of mRNA splicing, via spliceosome(GO:0048024) positive regulation of mRNA processing(GO:0050685) |
| 0.2 | 0.9 | GO:0034316 | negative regulation of Arp2/3 complex-mediated actin nucleation(GO:0034316) negative regulation of actin nucleation(GO:0051126) |
| 0.2 | 2.7 | GO:0006885 | regulation of pH(GO:0006885) |
| 0.2 | 0.2 | GO:0006824 | cobalt ion transport(GO:0006824) |
| 0.2 | 1.1 | GO:0070900 | mitochondrial tRNA modification(GO:0070900) mitochondrial RNA modification(GO:1900864) |
| 0.2 | 1.7 | GO:0006826 | iron ion transport(GO:0006826) |
| 0.2 | 0.6 | GO:0042407 | cristae formation(GO:0042407) |
| 0.2 | 0.9 | GO:0070676 | intralumenal vesicle formation(GO:0070676) |
| 0.2 | 0.9 | GO:0001113 | transcriptional open complex formation at RNA polymerase II promoter(GO:0001113) |
| 0.2 | 0.6 | GO:0043901 | negative regulation of conjugation(GO:0031135) negative regulation of conjugation with cellular fusion(GO:0031138) negative regulation of multi-organism process(GO:0043901) |
| 0.2 | 0.2 | GO:0001178 | regulation of transcriptional start site selection at RNA polymerase II promoter(GO:0001178) |
| 0.2 | 3.8 | GO:0016579 | protein deubiquitination(GO:0016579) |
| 0.2 | 0.8 | GO:0009410 | response to xenobiotic stimulus(GO:0009410) |
| 0.2 | 0.6 | GO:0000736 | double-strand break repair via single-strand annealing, removal of nonhomologous ends(GO:0000736) |
| 0.2 | 0.6 | GO:0031114 | negative regulation of microtubule depolymerization(GO:0007026) regulation of microtubule depolymerization(GO:0031114) |
| 0.2 | 1.6 | GO:0042276 | error-prone translesion synthesis(GO:0042276) |
| 0.2 | 0.2 | GO:0000963 | mitochondrial RNA processing(GO:0000963) |
| 0.2 | 1.4 | GO:0046580 | negative regulation of Ras protein signal transduction(GO:0046580) negative regulation of small GTPase mediated signal transduction(GO:0051058) |
| 0.2 | 1.4 | GO:0000080 | mitotic G1 phase(GO:0000080) G1 phase(GO:0051318) |
| 0.2 | 0.2 | GO:0007032 | endosome organization(GO:0007032) |
| 0.2 | 0.6 | GO:0032079 | positive regulation of deoxyribonuclease activity(GO:0032077) positive regulation of endodeoxyribonuclease activity(GO:0032079) |
| 0.2 | 0.6 | GO:0010525 | regulation of transposition, RNA-mediated(GO:0010525) |
| 0.2 | 0.2 | GO:0006108 | malate metabolic process(GO:0006108) |
| 0.2 | 1.9 | GO:0051568 | histone H3-K4 methylation(GO:0051568) |
| 0.2 | 2.0 | GO:0000767 | cell morphogenesis involved in conjugation(GO:0000767) |
| 0.2 | 0.6 | GO:0055078 | cellular sodium ion homeostasis(GO:0006883) sodium ion homeostasis(GO:0055078) |
| 0.2 | 0.7 | GO:0070988 | protein demethylation(GO:0006482) protein dealkylation(GO:0008214) histone demethylation(GO:0016577) demethylation(GO:0070988) |
| 0.2 | 0.9 | GO:0060628 | regulation of COPII vesicle coating(GO:0003400) regulation of vesicle targeting, to, from or within Golgi(GO:0048209) regulation of ER to Golgi vesicle-mediated transport(GO:0060628) regulation of ER to Golgi vesicle-mediated transport by GTP hydrolysis(GO:0090113) |
| 0.2 | 0.3 | GO:0034497 | protein localization to pre-autophagosomal structure(GO:0034497) |
| 0.2 | 0.5 | GO:0000448 | cleavage in ITS2 between 5.8S rRNA and LSU-rRNA of tricistronic rRNA transcript (SSU-rRNA, 5.8S rRNA, LSU-rRNA)(GO:0000448) |
| 0.2 | 0.2 | GO:0006011 | UDP-glucose metabolic process(GO:0006011) |
| 0.2 | 0.5 | GO:0043200 | response to amino acid(GO:0043200) |
| 0.2 | 0.8 | GO:0006544 | glycine metabolic process(GO:0006544) |
| 0.2 | 0.7 | GO:0097271 | protein localization to bud neck(GO:0097271) |
| 0.2 | 0.5 | GO:0010971 | positive regulation of G2/M transition of mitotic cell cycle(GO:0010971) positive regulation of cell cycle G2/M phase transition(GO:1902751) |
| 0.2 | 1.3 | GO:0007323 | peptide pheromone maturation(GO:0007323) |
| 0.2 | 0.5 | GO:0000730 | meiotic DNA recombinase assembly(GO:0000707) DNA recombinase assembly(GO:0000730) |
| 0.2 | 1.4 | GO:0007007 | inner mitochondrial membrane organization(GO:0007007) |
| 0.2 | 0.5 | GO:0055088 | lipid homeostasis(GO:0055088) |
| 0.2 | 0.8 | GO:0045996 | negative regulation of transcription by pheromones(GO:0045996) negative regulation of transcription from RNA polymerase II promoter by pheromones(GO:0046020) |
| 0.2 | 0.2 | GO:0006074 | (1->3)-beta-D-glucan metabolic process(GO:0006074) |
| 0.1 | 3.9 | GO:0006312 | mitotic recombination(GO:0006312) |
| 0.1 | 0.4 | GO:0036297 | interstrand cross-link repair(GO:0036297) |
| 0.1 | 1.3 | GO:0070816 | phosphorylation of RNA polymerase II C-terminal domain(GO:0070816) |
| 0.1 | 1.4 | GO:0030242 | pexophagy(GO:0030242) |
| 0.1 | 0.3 | GO:0006311 | meiotic gene conversion(GO:0006311) |
| 0.1 | 1.0 | GO:0006638 | neutral lipid metabolic process(GO:0006638) acylglycerol metabolic process(GO:0006639) triglyceride metabolic process(GO:0006641) |
| 0.1 | 0.4 | GO:0051383 | centromere complex assembly(GO:0034508) kinetochore assembly(GO:0051382) kinetochore organization(GO:0051383) |
| 0.1 | 0.6 | GO:0017062 | respiratory chain complex III assembly(GO:0017062) mitochondrial respiratory chain complex III assembly(GO:0034551) |
| 0.1 | 0.3 | GO:1904668 | positive regulation of ubiquitin protein ligase activity(GO:1904668) |
| 0.1 | 0.8 | GO:0016574 | histone ubiquitination(GO:0016574) |
| 0.1 | 0.5 | GO:0051274 | beta-glucan biosynthetic process(GO:0051274) |
| 0.1 | 0.4 | GO:0007070 | negative regulation of transcription during mitosis(GO:0007068) negative regulation of transcription from RNA polymerase II promoter during mitosis(GO:0007070) regulation of transcription during mitosis(GO:0045896) regulation of transcription from RNA polymerase II promoter, mitotic(GO:0046021) |
| 0.1 | 0.4 | GO:0045041 | protein import into mitochondrial intermembrane space(GO:0045041) |
| 0.1 | 0.7 | GO:0006488 | dolichol-linked oligosaccharide biosynthetic process(GO:0006488) |
| 0.1 | 1.3 | GO:0006749 | glutathione metabolic process(GO:0006749) |
| 0.1 | 0.2 | GO:0033683 | nucleotide-excision repair, DNA incision(GO:0033683) |
| 0.1 | 0.1 | GO:0042148 | strand invasion(GO:0042148) |
| 0.1 | 0.1 | GO:2000105 | positive regulation of DNA-dependent DNA replication(GO:2000105) |
| 0.1 | 1.2 | GO:0034620 | endoplasmic reticulum unfolded protein response(GO:0030968) cellular response to unfolded protein(GO:0034620) |
| 0.1 | 0.5 | GO:0007050 | cell cycle arrest(GO:0007050) |
| 0.1 | 0.5 | GO:0000733 | DNA strand renaturation(GO:0000733) |
| 0.1 | 0.1 | GO:0071941 | nitrogen cycle metabolic process(GO:0071941) |
| 0.1 | 0.2 | GO:0044783 | G1 DNA damage checkpoint(GO:0044783) |
| 0.1 | 0.3 | GO:0034308 | primary alcohol metabolic process(GO:0034308) |
| 0.1 | 1.5 | GO:0007129 | synapsis(GO:0007129) |
| 0.1 | 1.6 | GO:0007266 | Rho protein signal transduction(GO:0007266) |
| 0.1 | 0.8 | GO:0035269 | protein mannosylation(GO:0035268) protein O-linked mannosylation(GO:0035269) mannosylation(GO:0097502) |
| 0.1 | 0.4 | GO:0009098 | leucine biosynthetic process(GO:0009098) |
| 0.1 | 0.7 | GO:0045040 | protein import into mitochondrial outer membrane(GO:0045040) |
| 0.1 | 0.3 | GO:0051654 | establishment of mitochondrion localization(GO:0051654) |
| 0.1 | 0.3 | GO:0006285 | base-excision repair, AP site formation(GO:0006285) |
| 0.1 | 0.6 | GO:0001101 | response to acid chemical(GO:0001101) |
| 0.1 | 0.3 | GO:0071629 | cytoplasm-associated proteasomal ubiquitin-dependent protein catabolic process(GO:0071629) |
| 0.1 | 0.1 | GO:2000217 | regulation of invasive growth in response to glucose limitation(GO:2000217) |
| 0.1 | 0.2 | GO:0090110 | cargo loading into vesicle(GO:0035459) cargo loading into COPII-coated vesicle(GO:0090110) |
| 0.1 | 0.5 | GO:0006515 | misfolded or incompletely synthesized protein catabolic process(GO:0006515) |
| 0.1 | 0.5 | GO:0007006 | mitochondrial membrane organization(GO:0007006) |
| 0.1 | 0.3 | GO:0016239 | positive regulation of autophagy(GO:0010508) positive regulation of macroautophagy(GO:0016239) |
| 0.1 | 0.2 | GO:0010513 | positive regulation of phosphatidylinositol biosynthetic process(GO:0010513) |
| 0.1 | 0.3 | GO:0006627 | protein processing involved in protein targeting to mitochondrion(GO:0006627) |
| 0.1 | 0.2 | GO:0015693 | magnesium ion transport(GO:0015693) |
| 0.1 | 0.2 | GO:0065005 | lipid tube assembly(GO:0060988) protein-lipid complex assembly(GO:0065005) protein-lipid complex subunit organization(GO:0071825) |
| 0.1 | 0.1 | GO:0071454 | response to anoxia(GO:0034059) cellular response to anoxia(GO:0071454) |
| 0.1 | 0.3 | GO:0030026 | cellular manganese ion homeostasis(GO:0030026) manganese ion homeostasis(GO:0055071) |
| 0.1 | 0.2 | GO:0070933 | histone H3 deacetylation(GO:0070932) histone H4 deacetylation(GO:0070933) |
| 0.1 | 0.7 | GO:0016558 | protein import into peroxisome matrix(GO:0016558) |
| 0.0 | 0.1 | GO:0006269 | DNA replication, synthesis of RNA primer(GO:0006269) |
| 0.0 | 0.1 | GO:0017004 | cytochrome complex assembly(GO:0017004) |
| 0.0 | 0.6 | GO:0044396 | actin cortical patch assembly(GO:0000147) actin cortical patch organization(GO:0044396) |
| 0.0 | 0.2 | GO:0006048 | UDP-N-acetylglucosamine metabolic process(GO:0006047) UDP-N-acetylglucosamine biosynthetic process(GO:0006048) |
| 0.0 | 0.1 | GO:0019748 | secondary metabolic process(GO:0019748) |
| 0.0 | 0.1 | GO:0015851 | nucleobase transport(GO:0015851) |
| 0.0 | 0.2 | GO:0000349 | generation of catalytic spliceosome for first transesterification step(GO:0000349) |
| 0.0 | 0.4 | GO:0016226 | iron-sulfur cluster assembly(GO:0016226) metallo-sulfur cluster assembly(GO:0031163) |
| 0.0 | 0.4 | GO:0016925 | protein sumoylation(GO:0016925) |
| 0.0 | 0.3 | GO:0043162 | ubiquitin-dependent protein catabolic process via the multivesicular body sorting pathway(GO:0043162) |
| 0.0 | 0.0 | GO:0010528 | regulation of transposition(GO:0010528) |
| 0.0 | 0.1 | GO:0015781 | pyrimidine nucleotide-sugar transport(GO:0015781) UDP-glucose transport(GO:0015786) |
| 0.0 | 0.1 | GO:0018344 | protein geranylgeranylation(GO:0018344) |
| 0.0 | 0.1 | GO:0071495 | cellular response to endogenous stimulus(GO:0071495) |
| 0.0 | 0.3 | GO:0030150 | protein import into mitochondrial matrix(GO:0030150) |
| 0.0 | 0.0 | GO:0042727 | flavin-containing compound metabolic process(GO:0042726) flavin-containing compound biosynthetic process(GO:0042727) |
| 0.0 | 0.0 | GO:0031555 | transcriptional attenuation(GO:0031555) transcription antitermination(GO:0031564) |
| 0.0 | 0.1 | GO:0030042 | actin filament depolymerization(GO:0030042) |
| 0.0 | 0.0 | GO:0032365 | intracellular lipid transport(GO:0032365) |
| 0.0 | 0.1 | GO:0009306 | protein secretion(GO:0009306) |
| 0.0 | 0.0 | GO:0051707 | immune effector process(GO:0002252) immune system process(GO:0002376) defense response(GO:0006952) response to virus(GO:0009615) response to external biotic stimulus(GO:0043207) defense response to virus(GO:0051607) response to other organism(GO:0051707) defense response to other organism(GO:0098542) |
| 0.0 | 0.1 | GO:0045033 | peroxisome inheritance(GO:0045033) |
Gene overrepresentation in cellular component category:
| Log-likelihood per target | Total log-likelihood | Term | Description |
|---|---|---|---|
| 3.5 | 3.5 | GO:0000015 | phosphopyruvate hydratase complex(GO:0000015) |
| 3.3 | 16.3 | GO:0045283 | mitochondrial respiratory chain complex II, succinate dehydrogenase complex (ubiquinone)(GO:0005749) succinate dehydrogenase complex (ubiquinone)(GO:0045257) respiratory chain complex II(GO:0045273) succinate dehydrogenase complex(GO:0045281) fumarate reductase complex(GO:0045283) |
| 2.3 | 9.1 | GO:0000148 | 1,3-beta-D-glucan synthase complex(GO:0000148) |
| 1.9 | 5.7 | GO:0031166 | integral component of vacuolar membrane(GO:0031166) |
| 1.9 | 11.1 | GO:0045239 | tricarboxylic acid cycle enzyme complex(GO:0045239) |
| 1.8 | 39.4 | GO:0070469 | respiratory chain(GO:0070469) |
| 1.6 | 4.8 | GO:0005756 | mitochondrial proton-transporting ATP synthase, central stalk(GO:0005756) proton-transporting ATP synthase, central stalk(GO:0045269) |
| 1.4 | 10.0 | GO:0034657 | GID complex(GO:0034657) |
| 1.3 | 3.9 | GO:0032585 | multivesicular body membrane(GO:0032585) |
| 1.2 | 9.2 | GO:0000164 | protein phosphatase type 1 complex(GO:0000164) |
| 1.0 | 10.1 | GO:0005775 | vacuolar lumen(GO:0005775) |
| 0.9 | 1.9 | GO:0045261 | mitochondrial proton-transporting ATP synthase complex, catalytic core F(1)(GO:0000275) proton-transporting ATP synthase complex, catalytic core F(1)(GO:0045261) |
| 0.9 | 2.7 | GO:0001400 | mating projection base(GO:0001400) |
| 0.8 | 2.3 | GO:0045265 | mitochondrial proton-transporting ATP synthase, stator stalk(GO:0000274) proton-transporting ATP synthase, stator stalk(GO:0045265) |
| 0.7 | 2.2 | GO:0046658 | anchored component of plasma membrane(GO:0046658) |
| 0.7 | 4.0 | GO:0034045 | pre-autophagosomal structure membrane(GO:0034045) |
| 0.7 | 1.3 | GO:0033263 | CORVET complex(GO:0033263) |
| 0.6 | 3.7 | GO:0045263 | mitochondrial proton-transporting ATP synthase complex, coupling factor F(o)(GO:0000276) proton-transporting ATP synthase complex, coupling factor F(o)(GO:0045263) |
| 0.6 | 0.6 | GO:0005753 | mitochondrial proton-transporting ATP synthase complex(GO:0005753) proton-transporting ATP synthase complex(GO:0045259) |
| 0.6 | 2.3 | GO:0016602 | CCAAT-binding factor complex(GO:0016602) |
| 0.6 | 38.5 | GO:0005777 | peroxisome(GO:0005777) microbody(GO:0042579) |
| 0.6 | 10.2 | GO:0031307 | intrinsic component of mitochondrial outer membrane(GO:0031306) integral component of mitochondrial outer membrane(GO:0031307) |
| 0.6 | 2.8 | GO:0031931 | TORC1 complex(GO:0031931) |
| 0.5 | 2.1 | GO:0008623 | CHRAC(GO:0008623) |
| 0.5 | 1.0 | GO:0000111 | nucleotide-excision repair factor 2 complex(GO:0000111) |
| 0.5 | 3.7 | GO:0042597 | periplasmic space(GO:0042597) |
| 0.5 | 1.4 | GO:0034099 | luminal surveillance complex(GO:0034099) |
| 0.4 | 0.4 | GO:0009331 | glycerol-3-phosphate dehydrogenase complex(GO:0009331) |
| 0.4 | 1.3 | GO:0070211 | Snt2C complex(GO:0070211) |
| 0.4 | 2.4 | GO:0032126 | eisosome(GO:0032126) |
| 0.4 | 18.6 | GO:0031225 | anchored component of membrane(GO:0031225) |
| 0.4 | 7.4 | GO:0005628 | prospore membrane(GO:0005628) intracellular immature spore(GO:0042763) ascospore-type prospore(GO:0042764) |
| 0.4 | 4.6 | GO:0031160 | spore wall(GO:0031160) |
| 0.3 | 1.7 | GO:0009898 | cytoplasmic side of plasma membrane(GO:0009898) |
| 0.3 | 5.7 | GO:0044455 | mitochondrial membrane part(GO:0044455) |
| 0.3 | 1.3 | GO:0072380 | ER membrane insertion complex(GO:0072379) TRC complex(GO:0072380) |
| 0.3 | 0.6 | GO:0032389 | MutLalpha complex(GO:0032389) |
| 0.3 | 2.3 | GO:0002178 | palmitoyltransferase complex(GO:0002178) endoplasmic reticulum palmitoyltransferase complex(GO:0031211) |
| 0.3 | 0.9 | GO:0031422 | RecQ helicase-Topo III complex(GO:0031422) |
| 0.3 | 5.0 | GO:0031305 | integral component of mitochondrial inner membrane(GO:0031305) |
| 0.3 | 6.8 | GO:0005887 | integral component of plasma membrane(GO:0005887) |
| 0.3 | 37.4 | GO:0005743 | mitochondrial inner membrane(GO:0005743) |
| 0.3 | 1.6 | GO:0008180 | COP9 signalosome(GO:0008180) |
| 0.3 | 4.5 | GO:0009295 | nucleoid(GO:0009295) mitochondrial nucleoid(GO:0042645) |
| 0.3 | 4.3 | GO:0048471 | perinuclear region of cytoplasm(GO:0048471) |
| 0.2 | 3.0 | GO:0090544 | SWI/SNF complex(GO:0016514) BAF-type complex(GO:0090544) |
| 0.2 | 0.7 | GO:0032176 | split septin rings(GO:0032176) cellular bud neck split septin rings(GO:0032177) |
| 0.2 | 7.9 | GO:0005758 | mitochondrial intermembrane space(GO:0005758) |
| 0.2 | 2.2 | GO:0000795 | synaptonemal complex(GO:0000795) |
| 0.2 | 0.9 | GO:0000839 | Hrd1p ubiquitin ligase complex(GO:0000836) Hrd1p ubiquitin ligase ERAD-L complex(GO:0000839) |
| 0.2 | 0.7 | GO:0031235 | intrinsic component of the cytoplasmic side of the plasma membrane(GO:0031235) |
| 0.2 | 34.5 | GO:0000323 | storage vacuole(GO:0000322) lytic vacuole(GO:0000323) fungal-type vacuole(GO:0000324) |
| 0.2 | 8.0 | GO:0005741 | mitochondrial outer membrane(GO:0005741) |
| 0.2 | 1.5 | GO:0000112 | nucleotide-excision repair factor 3 complex(GO:0000112) |
| 0.2 | 0.9 | GO:0000815 | ESCRT III complex(GO:0000815) |
| 0.2 | 1.5 | GO:0005671 | Ada2/Gcn5/Ada3 transcription activator complex(GO:0005671) |
| 0.2 | 1.0 | GO:0035361 | Cul8-RING ubiquitin ligase complex(GO:0035361) |
| 0.2 | 0.8 | GO:0033101 | cellular bud membrane(GO:0033101) |
| 0.2 | 2.8 | GO:0033698 | Rpd3L complex(GO:0033698) |
| 0.2 | 13.9 | GO:0005774 | vacuolar membrane(GO:0005774) |
| 0.2 | 1.1 | GO:0005770 | late endosome(GO:0005770) |
| 0.2 | 0.5 | GO:0035649 | Nrd1 complex(GO:0035649) |
| 0.2 | 2.4 | GO:0071782 | endoplasmic reticulum tubular network(GO:0071782) endoplasmic reticulum subcompartment(GO:0098827) |
| 0.2 | 0.7 | GO:0030128 | AP-2 adaptor complex(GO:0030122) clathrin coat of endocytic vesicle(GO:0030128) endocytic vesicle(GO:0030139) endocytic vesicle membrane(GO:0030666) clathrin-coated endocytic vesicle membrane(GO:0030669) clathrin-coated endocytic vesicle(GO:0045334) |
| 0.2 | 0.5 | GO:0000110 | nucleotide-excision repair factor 1 complex(GO:0000110) |
| 0.2 | 0.5 | GO:0005787 | signal peptidase complex(GO:0005787) |
| 0.1 | 40.5 | GO:0005886 | plasma membrane(GO:0005886) |
| 0.1 | 0.4 | GO:0000113 | nucleotide-excision repair factor 4 complex(GO:0000113) |
| 0.1 | 1.1 | GO:0035097 | histone methyltransferase complex(GO:0035097) Set1C/COMPASS complex(GO:0048188) |
| 0.1 | 0.4 | GO:0005960 | glycine cleavage complex(GO:0005960) |
| 0.1 | 0.3 | GO:0033255 | SAS acetyltransferase complex(GO:0033255) |
| 0.1 | 0.3 | GO:0005955 | calcineurin complex(GO:0005955) |
| 0.1 | 0.1 | GO:0000439 | core TFIIH complex(GO:0000439) |
| 0.1 | 0.3 | GO:0032807 | DNA ligase IV complex(GO:0032807) |
| 0.1 | 0.3 | GO:0043541 | UDP-N-acetylglucosamine transferase complex(GO:0043541) |
| 0.1 | 0.7 | GO:0030915 | Smc5-Smc6 complex(GO:0030915) |
| 0.1 | 0.2 | GO:0070274 | RES complex(GO:0070274) |
| 0.1 | 0.2 | GO:0005675 | holo TFIIH complex(GO:0005675) |
| 0.1 | 0.2 | GO:0030870 | Mre11 complex(GO:0030870) |
| 0.1 | 37.6 | GO:0005739 | mitochondrion(GO:0005739) |
| 0.1 | 0.4 | GO:0000808 | origin recognition complex(GO:0000808) nuclear origin of replication recognition complex(GO:0005664) |
| 0.1 | 1.9 | GO:0000151 | ubiquitin ligase complex(GO:0000151) |
| 0.0 | 0.2 | GO:0071014 | post-mRNA release spliceosomal complex(GO:0071014) |
| 0.0 | 0.1 | GO:0005968 | Rab-protein geranylgeranyltransferase complex(GO:0005968) |
| 0.0 | 0.3 | GO:0030015 | CCR4-NOT core complex(GO:0030015) |
| 0.0 | 0.1 | GO:0000417 | HIR complex(GO:0000417) |
| 0.0 | 0.3 | GO:1902562 | NuA4 histone acetyltransferase complex(GO:0035267) H4/H2A histone acetyltransferase complex(GO:0043189) H4 histone acetyltransferase complex(GO:1902562) |
| 0.0 | 0.3 | GO:0005682 | U5 snRNP(GO:0005682) |
| 0.0 | 0.1 | GO:0070210 | Rpd3L-Expanded complex(GO:0070210) |
| 0.0 | 0.1 | GO:0030869 | RENT complex(GO:0030869) |
| 0.0 | 0.1 | GO:0005869 | dynactin complex(GO:0005869) |
| 0.0 | 0.1 | GO:0005905 | clathrin-coated pit(GO:0005905) |
| 0.0 | 0.1 | GO:0035327 | transcriptionally active chromatin(GO:0035327) |
| 0.0 | 0.0 | GO:0042788 | polysomal ribosome(GO:0042788) |
| 0.0 | 0.0 | GO:0098552 | side of membrane(GO:0098552) cytoplasmic side of membrane(GO:0098562) |
Gene overrepresentation in molecular function category:
| Log-likelihood per target | Total log-likelihood | Term | Description |
|---|---|---|---|
| 5.9 | 17.6 | GO:0004092 | carnitine O-acetyltransferase activity(GO:0004092) carnitine O-acyltransferase activity(GO:0016406) |
| 4.1 | 12.3 | GO:0016289 | CoA hydrolase activity(GO:0016289) |
| 4.0 | 19.8 | GO:0015295 | solute:proton symporter activity(GO:0015295) |
| 3.9 | 15.7 | GO:0004396 | hexokinase activity(GO:0004396) |
| 3.8 | 11.3 | GO:0004108 | citrate (Si)-synthase activity(GO:0004108) citrate synthase activity(GO:0036440) |
| 3.6 | 10.8 | GO:0004450 | isocitrate dehydrogenase (NADP+) activity(GO:0004450) |
| 3.5 | 20.9 | GO:0016744 | transferase activity, transferring aldehyde or ketonic groups(GO:0016744) |
| 3.5 | 10.4 | GO:0003843 | 1,3-beta-D-glucan synthase activity(GO:0003843) |
| 3.3 | 16.3 | GO:0008177 | succinate dehydrogenase (ubiquinone) activity(GO:0008177) |
| 3.2 | 9.7 | GO:0050136 | NADH dehydrogenase activity(GO:0003954) NADH dehydrogenase (ubiquinone) activity(GO:0008137) NADH dehydrogenase (quinone) activity(GO:0050136) |
| 3.2 | 12.9 | GO:0005537 | mannose binding(GO:0005537) |
| 3.1 | 9.3 | GO:0016208 | AMP binding(GO:0016208) |
| 3.1 | 12.3 | GO:0016661 | oxidoreductase activity, acting on other nitrogenous compounds as donors(GO:0016661) |
| 2.6 | 10.4 | GO:0042927 | siderophore transmembrane transporter activity(GO:0015343) iron chelate transmembrane transporter activity(GO:0015603) siderophore transporter activity(GO:0042927) |
| 2.5 | 7.5 | GO:1901474 | azole transmembrane transporter activity(GO:1901474) |
| 2.4 | 4.7 | GO:0004448 | isocitrate dehydrogenase activity(GO:0004448) |
| 2.3 | 6.9 | GO:0050833 | pyruvate transmembrane transporter activity(GO:0050833) |
| 2.3 | 6.9 | GO:0031957 | very long-chain fatty acid-CoA ligase activity(GO:0031957) |
| 2.3 | 6.9 | GO:0004575 | beta-fructofuranosidase activity(GO:0004564) sucrose alpha-glucosidase activity(GO:0004575) |
| 2.2 | 4.4 | GO:0004930 | G-protein coupled receptor activity(GO:0004930) |
| 2.2 | 6.6 | GO:0005536 | glucose binding(GO:0005536) |
| 2.0 | 6.1 | GO:0030414 | endopeptidase inhibitor activity(GO:0004866) peptidase inhibitor activity(GO:0030414) |
| 2.0 | 7.9 | GO:0016639 | oxidoreductase activity, acting on the CH-NH2 group of donors, NAD or NADP as acceptor(GO:0016639) |
| 1.9 | 21.1 | GO:0015293 | symporter activity(GO:0015293) |
| 1.9 | 5.6 | GO:0008902 | hydroxymethylpyrimidine kinase activity(GO:0008902) phosphomethylpyrimidine kinase activity(GO:0008972) |
| 1.9 | 11.2 | GO:0004784 | superoxide dismutase activity(GO:0004784) oxidoreductase activity, acting on superoxide radicals as acceptor(GO:0016721) |
| 1.8 | 7.1 | GO:0005186 | mating pheromone activity(GO:0000772) pheromone activity(GO:0005186) |
| 1.7 | 8.3 | GO:0050308 | sugar-phosphatase activity(GO:0050308) |
| 1.6 | 4.8 | GO:0090599 | alpha-glucosidase activity(GO:0090599) |
| 1.5 | 12.4 | GO:0008121 | ubiquinol-cytochrome-c reductase activity(GO:0008121) oxidoreductase activity, acting on diphenols and related substances as donors(GO:0016679) oxidoreductase activity, acting on diphenols and related substances as donors, cytochrome as acceptor(GO:0016681) |
| 1.5 | 6.1 | GO:0015217 | ATP transmembrane transporter activity(GO:0005347) ATP:ADP antiporter activity(GO:0005471) ADP transmembrane transporter activity(GO:0015217) |
| 1.5 | 10.4 | GO:0046912 | transferase activity, transferring acyl groups, acyl groups converted into alkyl on transfer(GO:0046912) |
| 1.4 | 2.9 | GO:0045118 | azole transporter activity(GO:0045118) |
| 1.4 | 2.9 | GO:0016878 | CoA-ligase activity(GO:0016405) acid-thiol ligase activity(GO:0016878) |
| 1.4 | 11.3 | GO:0005385 | zinc ion transmembrane transporter activity(GO:0005385) |
| 1.4 | 22.2 | GO:0046906 | heme binding(GO:0020037) tetrapyrrole binding(GO:0046906) |
| 1.3 | 8.8 | GO:0004364 | glutathione transferase activity(GO:0004364) |
| 1.2 | 3.7 | GO:0004555 | alpha,alpha-trehalase activity(GO:0004555) trehalase activity(GO:0015927) |
| 1.2 | 6.1 | GO:0019238 | cyclohydrolase activity(GO:0019238) |
| 1.2 | 16.4 | GO:0016645 | oxidoreductase activity, acting on the CH-NH group of donors(GO:0016645) |
| 1.1 | 7.9 | GO:0015174 | basic amino acid transmembrane transporter activity(GO:0015174) |
| 1.1 | 12.3 | GO:0046933 | proton-transporting ATP synthase activity, rotational mechanism(GO:0046933) |
| 1.1 | 5.6 | GO:0008198 | ferrous iron binding(GO:0008198) |
| 1.1 | 2.2 | GO:0016790 | thiolester hydrolase activity(GO:0016790) |
| 1.1 | 4.4 | GO:0022821 | potassium:proton antiporter activity(GO:0015386) potassium ion antiporter activity(GO:0022821) |
| 1.1 | 13.1 | GO:0008599 | protein phosphatase type 1 regulator activity(GO:0008599) |
| 1.1 | 14.1 | GO:0044389 | ubiquitin protein ligase binding(GO:0031625) ubiquitin-like protein ligase binding(GO:0044389) |
| 1.1 | 4.2 | GO:0005315 | inorganic phosphate transmembrane transporter activity(GO:0005315) |
| 1.0 | 3.0 | GO:0016882 | cyclo-ligase activity(GO:0016882) |
| 0.9 | 1.9 | GO:0008271 | secondary active sulfate transmembrane transporter activity(GO:0008271) sulfate transmembrane transporter activity(GO:0015116) |
| 0.9 | 2.8 | GO:0016417 | S-acyltransferase activity(GO:0016417) |
| 0.9 | 3.6 | GO:0004032 | alditol:NADP+ 1-oxidoreductase activity(GO:0004032) |
| 0.8 | 8.4 | GO:0035251 | UDP-glucosyltransferase activity(GO:0035251) |
| 0.8 | 4.1 | GO:0050253 | triglyceride lipase activity(GO:0004806) retinyl-palmitate esterase activity(GO:0050253) |
| 0.8 | 15.3 | GO:0008483 | transaminase activity(GO:0008483) transferase activity, transferring nitrogenous groups(GO:0016769) |
| 0.8 | 3.2 | GO:0016435 | rRNA (guanine) methyltransferase activity(GO:0016435) |
| 0.8 | 1.6 | GO:0016724 | ferroxidase activity(GO:0004322) oxidoreductase activity, oxidizing metal ions, oxygen as acceptor(GO:0016724) |
| 0.8 | 2.3 | GO:0004458 | lactate dehydrogenase activity(GO:0004457) D-lactate dehydrogenase (cytochrome) activity(GO:0004458) oxidoreductase activity, acting on the CH-OH group of donors, cytochrome as acceptor(GO:0016898) |
| 0.7 | 5.0 | GO:0015205 | nucleobase transmembrane transporter activity(GO:0015205) |
| 0.7 | 2.8 | GO:0015556 | C4-dicarboxylate transmembrane transporter activity(GO:0015556) |
| 0.7 | 2.7 | GO:0016885 | ligase activity, forming carbon-carbon bonds(GO:0016885) |
| 0.7 | 3.9 | GO:0016833 | oxo-acid-lyase activity(GO:0016833) |
| 0.6 | 1.9 | GO:0030060 | L-malate dehydrogenase activity(GO:0030060) |
| 0.6 | 10.1 | GO:0016763 | transferase activity, transferring pentosyl groups(GO:0016763) |
| 0.6 | 1.2 | GO:0015489 | putrescine transmembrane transporter activity(GO:0015489) |
| 0.6 | 0.6 | GO:0090482 | vitamin transmembrane transporter activity(GO:0090482) |
| 0.6 | 28.4 | GO:0001077 | transcriptional activator activity, RNA polymerase II core promoter proximal region sequence-specific binding(GO:0001077) transcriptional activator activity, RNA polymerase II transcription regulatory region sequence-specific binding(GO:0001228) |
| 0.6 | 1.7 | GO:0032183 | SUMO binding(GO:0032183) |
| 0.6 | 1.7 | GO:0015188 | L-tyrosine transmembrane transporter activity(GO:0005302) L-glutamine transmembrane transporter activity(GO:0015186) L-isoleucine transmembrane transporter activity(GO:0015188) branched-chain amino acid transmembrane transporter activity(GO:0015658) |
| 0.5 | 1.6 | GO:0022829 | porin activity(GO:0015288) wide pore channel activity(GO:0022829) |
| 0.5 | 10.3 | GO:0016831 | carboxy-lyase activity(GO:0016831) |
| 0.5 | 6.5 | GO:0001227 | transcriptional repressor activity, RNA polymerase II transcription regulatory region sequence-specific binding(GO:0001227) |
| 0.5 | 1.6 | GO:0004088 | carbamoyl-phosphate synthase (glutamine-hydrolyzing) activity(GO:0004088) |
| 0.5 | 4.7 | GO:0016722 | oxidoreductase activity, oxidizing metal ions(GO:0016722) |
| 0.5 | 4.7 | GO:0060089 | receptor activity(GO:0004872) molecular transducer activity(GO:0060089) |
| 0.5 | 1.5 | GO:0016668 | oxidoreductase activity, acting on a sulfur group of donors, NAD(P) as acceptor(GO:0016668) |
| 0.5 | 6.1 | GO:0005199 | structural constituent of cell wall(GO:0005199) |
| 0.5 | 3.4 | GO:0008028 | monocarboxylic acid transmembrane transporter activity(GO:0008028) |
| 0.5 | 0.5 | GO:0008157 | protein phosphatase 1 binding(GO:0008157) |
| 0.5 | 6.7 | GO:0005353 | fructose transmembrane transporter activity(GO:0005353) mannose transmembrane transporter activity(GO:0015578) |
| 0.5 | 1.4 | GO:0031492 | nucleosomal DNA binding(GO:0031492) |
| 0.5 | 1.4 | GO:0004862 | cAMP-dependent protein kinase inhibitor activity(GO:0004862) |
| 0.5 | 1.4 | GO:0004738 | pyruvate dehydrogenase activity(GO:0004738) |
| 0.4 | 1.8 | GO:0001097 | TFIIH-class transcription factor binding(GO:0001097) |
| 0.4 | 3.5 | GO:0000149 | SNARE binding(GO:0000149) |
| 0.4 | 3.0 | GO:0000774 | adenyl-nucleotide exchange factor activity(GO:0000774) |
| 0.4 | 1.7 | GO:0016531 | copper chaperone activity(GO:0016531) |
| 0.4 | 2.1 | GO:0016782 | transferase activity, transferring sulfur-containing groups(GO:0016782) |
| 0.4 | 3.4 | GO:0070001 | aspartic-type endopeptidase activity(GO:0004190) aspartic-type peptidase activity(GO:0070001) |
| 0.4 | 2.1 | GO:0015923 | alpha-mannosidase activity(GO:0004559) mannosidase activity(GO:0015923) |
| 0.4 | 1.2 | GO:0098518 | polynucleotide phosphatase activity(GO:0098518) |
| 0.4 | 2.3 | GO:0004029 | aldehyde dehydrogenase (NAD) activity(GO:0004029) aldehyde dehydrogenase [NAD(P)+] activity(GO:0004030) |
| 0.4 | 1.2 | GO:0072349 | modified amino acid transmembrane transporter activity(GO:0072349) |
| 0.4 | 3.8 | GO:0022838 | substrate-specific channel activity(GO:0022838) |
| 0.4 | 1.4 | GO:0008195 | phosphatidate phosphatase activity(GO:0008195) |
| 0.4 | 2.1 | GO:0042124 | glucanosyltransferase activity(GO:0042123) 1,3-beta-glucanosyltransferase activity(GO:0042124) |
| 0.4 | 1.4 | GO:0008169 | C-methyltransferase activity(GO:0008169) |
| 0.3 | 8.7 | GO:0004553 | hydrolase activity, hydrolyzing O-glycosyl compounds(GO:0004553) |
| 0.3 | 0.3 | GO:0019902 | phosphatase binding(GO:0019902) protein phosphatase binding(GO:0019903) |
| 0.3 | 2.0 | GO:0005375 | copper ion transmembrane transporter activity(GO:0005375) |
| 0.3 | 1.0 | GO:0000156 | phosphorelay response regulator activity(GO:0000156) |
| 0.3 | 2.2 | GO:0000014 | single-stranded DNA endodeoxyribonuclease activity(GO:0000014) |
| 0.3 | 0.3 | GO:0015151 | alpha-glucoside transmembrane transporter activity(GO:0015151) glucoside transmembrane transporter activity(GO:0042947) |
| 0.3 | 0.6 | GO:0048256 | 5'-flap endonuclease activity(GO:0017108) flap endonuclease activity(GO:0048256) |
| 0.3 | 1.2 | GO:0015193 | L-proline transmembrane transporter activity(GO:0015193) |
| 0.3 | 3.2 | GO:0016409 | palmitoyltransferase activity(GO:0016409) |
| 0.3 | 1.2 | GO:0004180 | carboxypeptidase activity(GO:0004180) |
| 0.3 | 1.4 | GO:0018456 | aryl-alcohol dehydrogenase (NAD+) activity(GO:0018456) |
| 0.3 | 1.1 | GO:0004708 | MAP kinase kinase activity(GO:0004708) |
| 0.3 | 3.1 | GO:0030983 | mismatched DNA binding(GO:0030983) |
| 0.3 | 8.1 | GO:0008234 | cysteine-type peptidase activity(GO:0008234) |
| 0.3 | 1.0 | GO:0016774 | phosphotransferase activity, carboxyl group as acceptor(GO:0016774) |
| 0.3 | 0.8 | GO:0004584 | dolichyl-phosphate-mannose-glycolipid alpha-mannosyltransferase activity(GO:0004584) |
| 0.3 | 0.3 | GO:0016706 | oxidoreductase activity, acting on paired donors, with incorporation or reduction of molecular oxygen, 2-oxoglutarate as one donor, and incorporation of one atom each of oxygen into both donors(GO:0016706) |
| 0.3 | 1.3 | GO:0052742 | phosphatidylinositol kinase activity(GO:0052742) |
| 0.2 | 0.5 | GO:0008309 | double-stranded DNA exodeoxyribonuclease activity(GO:0008309) |
| 0.2 | 2.1 | GO:0016413 | O-acetyltransferase activity(GO:0016413) |
| 0.2 | 2.1 | GO:0004252 | serine-type endopeptidase activity(GO:0004252) |
| 0.2 | 1.6 | GO:0008379 | thioredoxin peroxidase activity(GO:0008379) |
| 0.2 | 0.7 | GO:0016813 | hydrolase activity, acting on carbon-nitrogen (but not peptide) bonds, in linear amidines(GO:0016813) |
| 0.2 | 0.9 | GO:0030246 | carbohydrate binding(GO:0030246) |
| 0.2 | 2.1 | GO:0016209 | antioxidant activity(GO:0016209) |
| 0.2 | 1.1 | GO:0031072 | heat shock protein binding(GO:0031072) |
| 0.2 | 1.5 | GO:0051184 | cofactor transporter activity(GO:0051184) |
| 0.2 | 1.0 | GO:0004535 | poly(A)-specific ribonuclease activity(GO:0004535) |
| 0.2 | 0.2 | GO:0035591 | MAP-kinase scaffold activity(GO:0005078) signaling adaptor activity(GO:0035591) |
| 0.2 | 15.0 | GO:0000981 | RNA polymerase II transcription factor activity, sequence-specific DNA binding(GO:0000981) |
| 0.2 | 0.6 | GO:0030332 | cyclin binding(GO:0030332) |
| 0.2 | 3.4 | GO:0051087 | chaperone binding(GO:0051087) |
| 0.2 | 0.2 | GO:0016615 | malate dehydrogenase activity(GO:0016615) |
| 0.2 | 1.4 | GO:0004012 | phospholipid-translocating ATPase activity(GO:0004012) |
| 0.2 | 0.4 | GO:0015085 | calcium ion transmembrane transporter activity(GO:0015085) |
| 0.2 | 1.8 | GO:0035064 | methylated histone binding(GO:0035064) |
| 0.2 | 0.5 | GO:0070006 | metalloaminopeptidase activity(GO:0070006) |
| 0.1 | 2.2 | GO:0004222 | metalloendopeptidase activity(GO:0004222) |
| 0.1 | 0.4 | GO:0043325 | phosphatidylinositol-3,4-bisphosphate binding(GO:0043325) |
| 0.1 | 0.7 | GO:0008409 | 5'-3' exonuclease activity(GO:0008409) |
| 0.1 | 0.4 | GO:0008236 | serine-type peptidase activity(GO:0008236) |
| 0.1 | 0.5 | GO:0003916 | DNA topoisomerase activity(GO:0003916) |
| 0.1 | 1.1 | GO:0016675 | cytochrome-c oxidase activity(GO:0004129) heme-copper terminal oxidase activity(GO:0015002) oxidoreductase activity, acting on a heme group of donors(GO:0016675) oxidoreductase activity, acting on a heme group of donors, oxygen as acceptor(GO:0016676) |
| 0.1 | 1.0 | GO:0034979 | NAD-dependent histone deacetylase activity(GO:0017136) NAD-dependent protein deacetylase activity(GO:0034979) |
| 0.1 | 0.5 | GO:0000268 | peroxisome targeting sequence binding(GO:0000268) |
| 0.1 | 1.3 | GO:0032947 | protein complex scaffold(GO:0032947) |
| 0.1 | 9.2 | GO:0019787 | ubiquitin-like protein transferase activity(GO:0019787) |
| 0.1 | 4.3 | GO:0042626 | hydrolase activity, acting on acid anhydrides, catalyzing transmembrane movement of substances(GO:0016820) ATPase activity, coupled to transmembrane movement of substances(GO:0042626) |
| 0.1 | 0.3 | GO:0004723 | calcium-dependent protein serine/threonine phosphatase activity(GO:0004723) |
| 0.1 | 0.1 | GO:0004075 | biotin carboxylase activity(GO:0004075) |
| 0.1 | 0.7 | GO:0010181 | FMN binding(GO:0010181) |
| 0.1 | 0.4 | GO:0000400 | four-way junction DNA binding(GO:0000400) |
| 0.1 | 0.6 | GO:0004169 | dolichyl-phosphate-mannose-protein mannosyltransferase activity(GO:0004169) |
| 0.1 | 0.5 | GO:0016742 | hydroxymethyl-, formyl- and related transferase activity(GO:0016742) |
| 0.1 | 0.6 | GO:0005089 | Rho guanyl-nucleotide exchange factor activity(GO:0005089) |
| 0.1 | 0.3 | GO:0050839 | cell adhesion molecule binding(GO:0050839) |
| 0.1 | 0.3 | GO:0001128 | RNA polymerase II transcription coactivator activity involved in preinitiation complex assembly(GO:0001128) |
| 0.1 | 0.3 | GO:0046527 | glucosyltransferase activity(GO:0046527) |
| 0.1 | 0.1 | GO:0016717 | oxidoreductase activity, acting on paired donors, with oxidation of a pair of donors resulting in the reduction of molecular oxygen to two molecules of water(GO:0016717) |
| 0.1 | 0.2 | GO:0003840 | gamma-glutamyltransferase activity(GO:0003840) |
| 0.1 | 0.5 | GO:0016892 | endoribonuclease activity, producing 3'-phosphomonoesters(GO:0016892) |
| 0.1 | 0.3 | GO:0070336 | flap-structured DNA binding(GO:0070336) |
| 0.1 | 0.7 | GO:0004693 | cyclin-dependent protein serine/threonine kinase activity(GO:0004693) cyclin-dependent protein kinase activity(GO:0097472) |
| 0.1 | 0.4 | GO:0019776 | Atg8 ligase activity(GO:0019776) |
| 0.1 | 0.7 | GO:0001102 | RNA polymerase II activating transcription factor binding(GO:0001102) |
| 0.1 | 0.2 | GO:0015216 | purine nucleotide transmembrane transporter activity(GO:0015216) |
| 0.1 | 0.6 | GO:0019200 | carbohydrate kinase activity(GO:0019200) |
| 0.1 | 0.4 | GO:0005381 | iron ion transmembrane transporter activity(GO:0005381) |
| 0.1 | 0.9 | GO:0008519 | ammonium transmembrane transporter activity(GO:0008519) |
| 0.1 | 0.3 | GO:0008172 | S-methyltransferase activity(GO:0008172) |
| 0.1 | 0.5 | GO:0000026 | alpha-1,2-mannosyltransferase activity(GO:0000026) |
| 0.1 | 0.1 | GO:0016530 | metallochaperone activity(GO:0016530) |
| 0.1 | 0.7 | GO:0008237 | metallopeptidase activity(GO:0008237) |
| 0.1 | 0.1 | GO:0001129 | transcription factor activity, RNA polymerase II basal transcription factor binding(GO:0001083) RNA polymerase II transcription factor activity, TBP-class protein binding, involved in preinitiation complex assembly(GO:0001129) |
| 0.1 | 1.3 | GO:0005509 | calcium ion binding(GO:0005509) |
| 0.1 | 0.9 | GO:0015171 | amino acid transmembrane transporter activity(GO:0015171) |
| 0.1 | 0.5 | GO:0016884 | carbon-nitrogen ligase activity, with glutamine as amido-N-donor(GO:0016884) |
| 0.1 | 0.2 | GO:0000702 | oxidized base lesion DNA N-glycosylase activity(GO:0000702) |
| 0.1 | 0.8 | GO:0045182 | translation regulator activity(GO:0045182) |
| 0.1 | 0.1 | GO:0001091 | RNA polymerase II basal transcription factor binding(GO:0001091) |
| 0.1 | 0.1 | GO:0019842 | vitamin binding(GO:0019842) |
| 0.0 | 0.4 | GO:0019888 | protein phosphatase regulator activity(GO:0019888) |
| 0.0 | 0.2 | GO:0002161 | aminoacyl-tRNA editing activity(GO:0002161) |
| 0.0 | 0.8 | GO:0003713 | transcription coactivator activity(GO:0003713) |
| 0.0 | 0.7 | GO:0008081 | phosphoric diester hydrolase activity(GO:0008081) |
| 0.0 | 0.4 | GO:0042054 | histone methyltransferase activity(GO:0042054) |
| 0.0 | 0.1 | GO:0016671 | oxidoreductase activity, acting on a sulfur group of donors, disulfide as acceptor(GO:0016671) |
| 0.0 | 0.6 | GO:0004725 | protein tyrosine phosphatase activity(GO:0004725) |
| 0.0 | 0.5 | GO:0015266 | protein channel activity(GO:0015266) |
| 0.0 | 0.1 | GO:0004663 | Rab geranylgeranyltransferase activity(GO:0004663) |
| 0.0 | 0.1 | GO:0000150 | recombinase activity(GO:0000150) |
| 0.0 | 0.3 | GO:0031369 | translation initiation factor binding(GO:0031369) |
| 0.0 | 0.3 | GO:0001098 | basal transcription machinery binding(GO:0001098) basal RNA polymerase II transcription machinery binding(GO:0001099) |
| 0.0 | 0.3 | GO:0000384 | first spliceosomal transesterification activity(GO:0000384) |
| 0.0 | 0.1 | GO:0008641 | small protein activating enzyme activity(GO:0008641) |
| 0.0 | 0.6 | GO:0016836 | hydro-lyase activity(GO:0016836) |
| 0.0 | 0.0 | GO:0015081 | monovalent cation:proton antiporter activity(GO:0005451) sodium ion transmembrane transporter activity(GO:0015081) solute:cation antiporter activity(GO:0015298) solute:proton antiporter activity(GO:0015299) sodium:proton antiporter activity(GO:0015385) cation:cation antiporter activity(GO:0015491) |
| 0.0 | 0.1 | GO:0016653 | oxidoreductase activity, acting on NAD(P)H, heme protein as acceptor(GO:0016653) |
| 0.0 | 0.4 | GO:0061733 | histone acetyltransferase activity(GO:0004402) peptide-lysine-N-acetyltransferase activity(GO:0061733) |
| 0.0 | 0.0 | GO:0000995 | transcription factor activity, core RNA polymerase III binding(GO:0000995) TFIIIB-type transcription factor activity(GO:0001026) |
| 0.0 | 0.1 | GO:0001135 | transcription factor activity, RNA polymerase II transcription factor recruiting(GO:0001135) |
Gene overrepresentation in curated gene sets: canonical pathways category:
| Log-likelihood per target | Total log-likelihood | Term | Description |
|---|---|---|---|
| 4.3 | 12.9 | PID HNF3B PATHWAY | FOXA2 and FOXA3 transcription factor networks |
| 1.9 | 5.7 | PID IL4 2PATHWAY | IL4-mediated signaling events |
| 0.9 | 4.5 | PID ERA GENOMIC PATHWAY | Validated nuclear estrogen receptor alpha network |
| 0.8 | 0.8 | PID AR PATHWAY | Coregulation of Androgen receptor activity |
| 0.6 | 3.6 | PID MYC ACTIV PATHWAY | Validated targets of C-MYC transcriptional activation |
| 0.4 | 1.4 | PID AVB3 INTEGRIN PATHWAY | Integrins in angiogenesis |
| 0.3 | 1.0 | NABA ECM REGULATORS | Genes encoding enzymes and their regulators involved in the remodeling of the extracellular matrix |
| 0.3 | 1.0 | PID CMYB PATHWAY | C-MYB transcription factor network |
| 0.2 | 0.2 | PID ANGIOPOIETIN RECEPTOR PATHWAY | Angiopoietin receptor Tie2-mediated signaling |
| 0.2 | 0.6 | NABA SECRETED FACTORS | Genes encoding secreted soluble factors |
| 0.2 | 0.6 | PID ERBB4 PATHWAY | ErbB4 signaling events |
| 0.1 | 226.6 | PID P53 DOWNSTREAM PATHWAY | Direct p53 effectors |
| 0.1 | 0.1 | PID ERBB1 RECEPTOR PROXIMAL PATHWAY | EGF receptor (ErbB1) signaling pathway |
| 0.1 | 0.8 | PID FANCONI PATHWAY | Fanconi anemia pathway |
| 0.1 | 0.2 | PID FOXO PATHWAY | FoxO family signaling |
| 0.0 | 0.0 | PID TCR PATHWAY | TCR signaling in naïve CD4+ T cells |
Gene overrepresentation in curated gene sets: REACTOME pathways category:
| Log-likelihood per target | Total log-likelihood | Term | Description |
|---|---|---|---|
| 4.6 | 13.7 | REACTOME RESPIRATORY ELECTRON TRANSPORT | Genes involved in Respiratory electron transport |
| 2.0 | 6.0 | REACTOME ACTIVATION OF CHAPERONE GENES BY XBP1S | Genes involved in Activation of Chaperone Genes by XBP1(S) |
| 1.4 | 12.3 | REACTOME GLUCONEOGENESIS | Genes involved in Gluconeogenesis |
| 0.6 | 1.8 | REACTOME MITOCHONDRIAL PROTEIN IMPORT | Genes involved in Mitochondrial Protein Import |
| 0.5 | 1.1 | REACTOME SHC1 EVENTS IN ERBB4 SIGNALING | Genes involved in SHC1 events in ERBB4 signaling |
| 0.4 | 0.4 | REACTOME LAGGING STRAND SYNTHESIS | Genes involved in Lagging Strand Synthesis |
| 0.4 | 3.5 | REACTOME METABOLISM OF AMINO ACIDS AND DERIVATIVES | Genes involved in Metabolism of amino acids and derivatives |
| 0.4 | 1.1 | REACTOME INTEGRIN CELL SURFACE INTERACTIONS | Genes involved in Integrin cell surface interactions |
| 0.3 | 0.3 | REACTOME SIGNALING BY ROBO RECEPTOR | Genes involved in Signaling by Robo receptor |
| 0.2 | 2.1 | REACTOME MEIOTIC RECOMBINATION | Genes involved in Meiotic Recombination |
| 0.2 | 0.4 | REACTOME RIG I MDA5 MEDIATED INDUCTION OF IFN ALPHA BETA PATHWAYS | Genes involved in RIG-I/MDA5 mediated induction of IFN-alpha/beta pathways |
| 0.2 | 0.2 | REACTOME SIGNALING BY NOTCH | Genes involved in Signaling by NOTCH |
| 0.2 | 0.7 | REACTOME HEMOSTASIS | Genes involved in Hemostasis |
| 0.1 | 226.0 | REACTOME CHONDROITIN SULFATE BIOSYNTHESIS | Genes involved in Chondroitin sulfate biosynthesis |
| 0.1 | 0.4 | REACTOME MEIOSIS | Genes involved in Meiosis |
| 0.1 | 0.1 | REACTOME PI3K EVENTS IN ERBB2 SIGNALING | Genes involved in PI3K events in ERBB2 signaling |
| 0.1 | 0.4 | REACTOME E2F ENABLED INHIBITION OF PRE REPLICATION COMPLEX FORMATION | Genes involved in E2F-enabled inhibition of pre-replication complex formation |
| 0.1 | 0.2 | REACTOME SYNTHESIS OF PIPS AT THE EARLY ENDOSOME MEMBRANE | Genes involved in Synthesis of PIPs at the early endosome membrane |
| 0.0 | 0.1 | REACTOME NETRIN1 SIGNALING | Genes involved in Netrin-1 signaling |
| 0.0 | 0.6 | REACTOME BIOSYNTHESIS OF THE N GLYCAN PRECURSOR DOLICHOL LIPID LINKED OLIGOSACCHARIDE LLO AND TRANSFER TO A NASCENT PROTEIN | Genes involved in Biosynthesis of the N-glycan precursor (dolichol lipid-linked oligosaccharide, LLO) and transfer to a nascent protein |
| 0.0 | 0.4 | REACTOME FATTY ACID TRIACYLGLYCEROL AND KETONE BODY METABOLISM | Genes involved in Fatty acid, triacylglycerol, and ketone body metabolism |
| 0.0 | 0.1 | REACTOME PHOSPHORYLATION OF THE APC C | Genes involved in Phosphorylation of the APC/C |