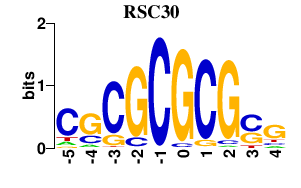
Results for RSC30
Z-value: 0.67
Motif logo
Transcription factors associated with RSC30
| Gene Symbol | Gene ID | Gene Info |
|---|---|---|
|
RSC30
|
S000001098 | Component of the RSC chromatin remodeling complex |
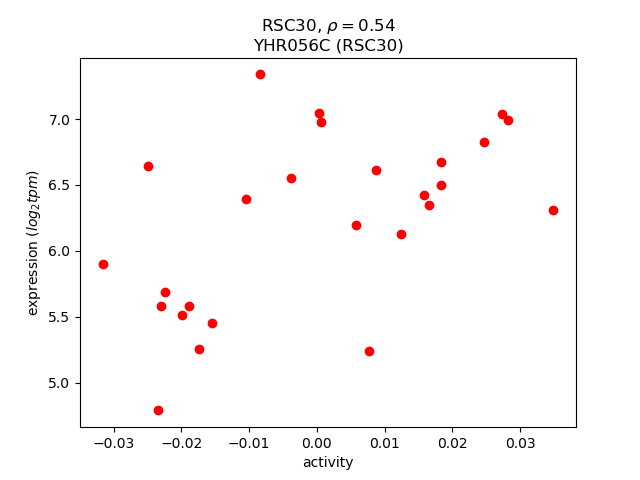
Activity-expression correlation:
Activity profile of RSC30 motif
Sorted Z-values of RSC30 motif
| Promoter | Log-likelihood | Transcript | Gene | Gene Info |
|---|---|---|---|---|
| YOR348C | 6.74 |
PUT4
|
Proline permease, required for high-affinity transport of proline; also transports the toxic proline analog azetidine-2-carboxylate (AzC); PUT4 transcription is repressed in ammonia-grown cells |
|
| YIL057C | 3.52 |
Putative protein of unknown function; expression induced under carbon limitation and repressed under high glucose |
||
| YGR067C | 3.22 |
Putative protein of unknown function; contains a zinc finger motif similar to that of Adr1p |
||
| YJR115W | 2.69 |
Putative protein of unknown function |
||
| YOR345C | 2.69 |
Dubious ORF unlikely to encode a protein, based on available experimental and comparative sequence data; overlaps the verified gene REV1; null mutant displays increased resistance to antifungal agents gliotoxin, cycloheximide and H2O2 |
||
| YKL109W | 2.68 |
HAP4
|
Subunit of the heme-activated, glucose-repressed Hap2p/3p/4p/5p CCAAT-binding complex, a transcriptional activator and global regulator of respiratory gene expression; provides the principal activation function of the complex |
|
| YML089C | 2.63 |
Dubious open reading frame unlikely to encode a functional protein, based on available experimental and comparative sequence data; expression induced by calcium shortage |
||
| YGL062W | 2.58 |
PYC1
|
Pyruvate carboxylase isoform, cytoplasmic enzyme that converts pyruvate to oxaloacetate; highly similar to isoform Pyc2p but differentially regulated; mutations in the human homolog are associated with lactic acidosis |
|
| YPL026C | 2.55 |
SKS1
|
Putative serine/threonine protein kinase; involved in the adaptation to low concentrations of glucose independent of the SNF3 regulated pathway |
|
| YOR346W | 2.53 |
REV1
|
Deoxycytidyl transferase, forms a complex with the subunits of DNA polymerase zeta, Rev3p and Rev7p; involved in repair of abasic sites in damaged DNA |
|
| YKL031W | 2.48 |
Dubious open reading frame, unlikely to encode a protein; not conserved in closely related Saccharomyces species |
||
| YOR072W | 2.41 |
Dubious open reading frame unlikely to encode a protein, based on experimental and comparative sequence data; partially overlaps the dubious gene YOR072W-A; diploid deletion strains are methotrexate, paraquat and wortmannin sensitive |
||
| YPL024W | 2.31 |
RMI1
|
Involved in response to DNA damage; null mutants have increased rates of recombination and delayed S phase; interacts physically and genetically with Sgs1p (RecQ family member) and Top3p (topoisomerase III) |
|
| YAR050W | 2.29 |
FLO1
|
Lectin-like protein involved in flocculation, cell wall protein that binds to mannose chains on the surface of other cells, confers floc-forming ability that is chymotrypsin sensitive and heat resistant; similar to Flo5p |
|
| YPR036W-A | 2.18 |
Protein of unknown function; transcription is regulated by Pdr1p |
||
| YER065C | 2.10 |
ICL1
|
Isocitrate lyase, catalyzes the formation of succinate and glyoxylate from isocitrate, a key reaction of the glyoxylate cycle; expression of ICL1 is induced by growth on ethanol and repressed by growth on glucose |
|
| YOR071C | 2.00 |
NRT1
|
High-affinity nicotinamide riboside transporter; also transports thiamine with low affinity; shares sequence similarity with Thi7p and Thi72p; proposed to be involved in 5-fluorocytosine sensitivity |
|
| YJL045W | 1.96 |
Minor succinate dehydrogenase isozyme; homologous to Sdh1p, the major isozyme reponsible for the oxidation of succinate and transfer of electrons to ubiquinone; induced during the diauxic shift in a Cat8p-dependent manner |
||
| YER088C | 1.95 |
DOT6
|
Protein of unknown function, involved in telomeric gene silencing and filamentation |
|
| YLR296W | 1.92 |
Dubious open reading frame unlikely to encode a protein, based on available experimental and comparative sequence data |
||
| YPR150W | 1.84 |
Dubious open reading frame unlikely to encode a protein, based on available experimental and comparative sequence data; partially overlaps the verified gene SUE1/YPR151C |
||
| YDL222C | 1.77 |
FMP45
|
Integral membrane protein localized to mitochondria (untagged protein) and eisosomes, immobile patches at the cortex associated with endocytosis; sporulation and sphingolipid content are altered in mutants; has homologs SUR7 and YNL194C |
|
| YOR072W-A | 1.76 |
Dubious open reading frame unlikely to encode a protein, based on available experimental and comparative sequence data; partially overlaps the uncharacterized ORF YOR072W; originally identified by fungal homology and RT-PCR |
||
| YJR078W | 1.74 |
BNA2
|
Putative tryptophan 2,3-dioxygenase or indoleamine 2,3-dioxygenase, required for the de novo biosynthesis of NAD from tryptophan via kynurenine; expression regulated by Hst1p and Aft2p |
|
| YCR005C | 1.73 |
CIT2
|
Citrate synthase, catalyzes the condensation of acetyl coenzyme A and oxaloacetate to form citrate, peroxisomal isozyme involved in glyoxylate cycle; expression is controlled by Rtg1p and Rtg2p transcription factors |
|
| YBR105C | 1.70 |
VID24
|
Peripheral membrane protein located at Vid (vacuole import and degradation) vesicles; regulates fructose-1,6-bisphosphatase (FBPase) targeting to the vacuole; involved in proteasome-dependent catabolite degradation of FBPase |
|
| YML090W | 1.70 |
Dubious open reading frame unlikely to encode a protein, based on available experimental and comparative sequence data; partially overlaps the dubious ORF YML089C; exhibits growth defect on a non-fermentable (respiratory) carbon source |
||
| YAR047C | 1.65 |
Dubious open reading frame unlikely to encode a protein, based on available experimental and comparative sequence data |
||
| YOR152C | 1.64 |
Putative protein of unknown function; has no similarity to any known protein; YOR152C is not an essential gene |
||
| YER150W | 1.63 |
SPI1
|
GPI-anchored cell wall protein involved in weak acid resistance; basal expression requires Msn2p/Msn4p; expression is induced under conditions of stress and during the diauxic shift; similar to Sed1p |
|
| YBL015W | 1.63 |
ACH1
|
Acetyl-coA hydrolase, primarily localized to mitochondria; phosphorylated; required for acetate utilization and for diploid pseudohyphal growth |
|
| YDR343C | 1.53 |
HXT6
|
High-affinity glucose transporter of the major facilitator superfamily, nearly identical to Hxt7p, expressed at high basal levels relative to other HXTs, repression of expression by high glucose requires SNF3 |
|
| YJL067W | 1.52 |
Dubious ORF unlikely to encode a functional protein, based on available experimental and comparative sequence data |
||
| YAR035W | 1.47 |
YAT1
|
Outer mitochondrial carnitine acetyltransferase, minor ethanol-inducible enzyme involved in transport of activated acyl groups from the cytoplasm into the mitochondrial matrix; phosphorylated |
|
| YDL210W | 1.45 |
UGA4
|
Permease that serves as a gamma-aminobutyrate (GABA) transport protein involved in the utilization of GABA as a nitrogen source; catalyzes the transport of putrescine and delta-aminolevulinic acid (ALA); localized to the vacuolar membrane |
|
| YJR095W | 1.44 |
SFC1
|
Mitochondrial succinate-fumarate transporter, transports succinate into and fumarate out of the mitochondrion; required for ethanol and acetate utilization |
|
| YPR065W | 1.43 |
ROX1
|
Heme-dependent repressor of hypoxic genes; contains an HMG domain that is responsible for DNA bending activity |
|
| YOR192C | 1.39 |
THI72
|
Transporter of thiamine or related compound; shares sequence similarity with Thi7p |
|
| YMR194C-B | 1.38 |
Putative protein of unknown function |
||
| YOR120W | 1.36 |
GCY1
|
Putative NADP(+) coupled glycerol dehydrogenase, proposed to be involved in an alternative pathway for glycerol catabolism; member of the aldo-keto reductase (AKR) family |
|
| YLR295C | 1.35 |
ATP14
|
Subunit h of the F0 sector of mitochondrial F1F0 ATP synthase, which is a large, evolutionarily conserved enzyme complex required for ATP synthesis |
|
| YFL030W | 1.35 |
AGX1
|
Alanine:glyoxylate aminotransferase (AGT), catalyzes the synthesis of glycine from glyoxylate, which is one of three pathways for glycine biosynthesis in yeast; has similarity to mammalian and plant alanine:glyoxylate aminotransferases |
|
| YML091C | 1.33 |
RPM2
|
Protein subunit of mitochondrial RNase P, has roles in nuclear transcription, cytoplasmic and mitochondrial RNA processing, and mitochondrial translation; distributed to mitochondria, cytoplasmic processing bodies, and the nucleus |
|
| YBR297W | 1.32 |
MAL33
|
MAL-activator protein, part of complex locus MAL3; nonfunctional in genomic reference strain S288C |
|
| YOL084W | 1.31 |
PHM7
|
Protein of unknown function, expression is regulated by phosphate levels; green fluorescent protein (GFP)-fusion protein localizes to the cell periphery and vacuole |
|
| YLR236C | 1.29 |
Dubious open reading frame unlikely to encode a functional protein, based on available experimental and comparative sequence data |
||
| YFR033C | 1.27 |
QCR6
|
Subunit 6 of the ubiquinol cytochrome-c reductase complex, which is a component of the mitochondrial inner membrane electron transport chain; highly acidic protein; required for maturation of cytochrome c1 |
|
| YPL230W | 1.26 |
USV1
|
Putative transcription factor containing a C2H2 zinc finger; mutation affects transcriptional regulation of genes involved in protein folding, ATP binding, and cell wall biosynthesis |
|
| YBR201C-A | 1.25 |
Putative protein of unknown function |
||
| YAR023C | 1.25 |
Putative integral membrane protein, member of DUP240 gene family |
||
| YMR103C | 1.25 |
Dubious open reading frame unlikely to encode a protein, based on available experimental and comparative sequence data |
||
| YNL305C | 1.25 |
Putative protein of unknown function; green fluorescent protein (GFP)-fusion protein localizes to the vacuole; YNL305C is not an essential gene |
||
| YBL033C | 1.21 |
RIB1
|
GTP cyclohydrolase II; catalyzes the first step of the riboflavin biosynthesis pathway |
|
| YPL061W | 1.20 |
ALD6
|
Cytosolic aldehyde dehydrogenase, activated by Mg2+ and utilizes NADP+ as the preferred coenzyme; required for conversion of acetaldehyde to acetate; constitutively expressed; locates to the mitochondrial outer surface upon oxidative stress |
|
| YHR139C | 1.17 |
SPS100
|
Protein required for spore wall maturation; expressed during sporulation; may be a component of the spore wall |
|
| YLR235C | 1.17 |
Dubious open reading frame unlikely to encode a protein, based on available experimental and comparative sequence data; partially overlaps the verified gene TOP3 |
||
| YGL045W | 1.17 |
RIM8
|
Protein of unknown function, involved in the proteolytic activation of Rim101p in response to alkaline pH; has similarity to A. nidulans PalF |
|
| YOL060C | 1.17 |
MAM3
|
Protein required for normal mitochondrial morphology, has similarity to hemolysins |
|
| YLR377C | 1.15 |
FBP1
|
Fructose-1,6-bisphosphatase, key regulatory enzyme in the gluconeogenesis pathway, required for glucose metabolism |
|
| YMR195W | 1.15 |
ICY1
|
Protein of unknown function, required for viability in rich media of cells lacking mitochondrial DNA; mutants have an invasive growth defect with elongated morphology; induced by amino acid starvation |
|
| YOR139C | 1.15 |
Hypothetical protein |
||
| YAL039C | 1.14 |
CYC3
|
Cytochrome c heme lyase (holocytochrome c synthase), attaches heme to apo-cytochrome c (Cyc1p or Cyc7p) in the mitochondrial intermembrane space; human ortholog may have a role in microphthalmia with linear skin defects (MLS) |
|
| YKL032C | 1.12 |
IXR1
|
Protein that binds DNA containing intrastrand cross-links formed by cisplatin, contains two HMG (high mobility group box) domains, which confer the ability to bend cisplatin-modified DNA; mediates aerobic transcriptional repression of COX5b |
|
| YDR277C | 1.11 |
MTH1
|
Negative regulator of the glucose-sensing signal transduction pathway, required for repression of transcription by Rgt1p; interacts with Rgt1p and the Snf3p and Rgt2p glucose sensors; phosphorylated by Yck1p, triggering Mth1p degradation |
|
| YKL171W | 1.11 |
Putative protein of unknown function; predicted protein kinase; implicated in proteasome function; epitope-tagged protein localizes to the cytoplasm |
||
| YFR029W | 1.10 |
PTR3
|
Component of the SPS plasma membrane amino acid sensor system (Ssy1p-Ptr3p-Ssy5p), which senses external amino acid concentration and transmits intracellular signals that result in regulation of expression of amino acid permease genes |
|
| YIL099W | 1.08 |
SGA1
|
Intracellular sporulation-specific glucoamylase involved in glycogen degradation; induced during starvation of a/a diploids late in sporulation, but dispensable for sporulation |
|
| YAR070C | 1.08 |
Dubious open reading frame unlikely to encode a protein, based on available experimental and comparative sequence data |
||
| YDR259C | 1.07 |
YAP6
|
Putative basic leucine zipper (bZIP) transcription factor; overexpression increases sodium and lithium tolerance |
|
| YFL024C | 1.07 |
EPL1
|
Component of NuA4, which is an essential histone H4/H2A acetyltransferase complex; homologous to Drosophila Enhancer of Polycomb |
|
| YPR127W | 1.07 |
Putative protein of unknown function; expression is activated by transcription factor YRM1/YOR172W; green fluorescent protein (GFP)-fusion protein localizes to both the cytoplasm and the nucleus |
||
| YHR033W | 1.07 |
Putative protein of unknown function; epitope-tagged protein localizes to the cytoplasm |
||
| YIL125W | 1.04 |
KGD1
|
Component of the mitochondrial alpha-ketoglutarate dehydrogenase complex, which catalyzes a key step in the tricarboxylic acid (TCA) cycle, the oxidative decarboxylation of alpha-ketoglutarate to form succinyl-CoA |
|
| YDL067C | 1.04 |
COX9
|
Subunit VIIa of cytochrome c oxidase, which is the terminal member of the mitochondrial inner membrane electron transport chain |
|
| YOR186C-A | 1.03 |
Identified by gene-trapping, microarray-based expression analysis, and genome-wide homology searching |
||
| YOL085W-A | 1.01 |
Dubious open reading frame unlikely to encode a protein, based on available experimental and comparative sequence data; partially overlaps the dubious ORF YOL085C |
||
| YPL250C | 1.01 |
ICY2
|
Protein of unknown function; mobilized into polysomes upon a shift from a fermentable to nonfermentable carbon source; potential Cdc28p substrate |
|
| YDR377W | 1.00 |
ATP17
|
Subunit f of the F0 sector of mitochondrial F1F0 ATP synthase, which is a large, evolutionarily conserved enzyme complex required for ATP synthesis |
|
| YCR025C | 1.00 |
Dubious open reading frame unlikely to encode a protein, based on available experimental and comparative sequence data; YCR025C is not an essential gene |
||
| YPL262W | 0.99 |
FUM1
|
Fumarase, converts fumaric acid to L-malic acid in the TCA cycle; cytosolic and mitochondrial localization determined by the N-terminal mitochondrial targeting sequence and protein conformation; phosphorylated in mitochondria |
|
| YMR181C | 0.98 |
Protein of unknown function; mRNA transcribed as part of a bicistronic transcript with a predicted transcriptional repressor RGM1/YMR182C; mRNA is destroyed by nonsense-mediated decay (NMD); YMR181C is not an essential gene |
||
| YOR192C-C | 0.98 |
Putative protein of unknown function; identified by expression profiling and mass spectrometry |
||
| YPR013C | 0.97 |
Putative zinc finger protein; YPR013C is not an essential gene |
||
| YNR073C | 0.97 |
Putative mannitol dehydrogenase |
||
| YOR140W | 0.96 |
SFL1
|
Transcriptional repressor and activator; involved in repression of flocculation-related genes, and activation of stress responsive genes; negatively regulated by cAMP-dependent protein kinase A subunit Tpk2p |
|
| YBL064C | 0.95 |
PRX1
|
Mitochondrial peroxiredoxin (1-Cys Prx) with thioredoxin peroxidase activity, has a role in reduction of hydroperoxides; induced during respiratory growth and under conditions of oxidative stress; phosphorylated |
|
| YNL091W | 0.92 |
NST1
|
Protein of unknown function, mediates sensitivity to salt stress; interacts physically with the splicing factor Msl1p and also displays genetic interaction with MSL1 |
|
| YLR438W | 0.91 |
CAR2
|
L-ornithine transaminase (OTAse), catalyzes the second step of arginine degradation, expression is dually-regulated by allophanate induction and a specific arginine induction process; not nitrogen catabolite repression sensitive |
|
| YGL177W | 0.88 |
Dubious open reading frame unlikely to encode a functional protein, based on available experimental and comparative sequence data |
||
| YAR069C | 0.88 |
Dubious open reading frame unlikely to encode a protein, based on available experimental and comparative sequence data |
||
| YJR048W | 0.87 |
CYC1
|
Cytochrome c, isoform 1; electron carrier of the mitochondrial intermembrane space that transfers electrons from ubiquinone-cytochrome c oxidoreductase to cytochrome c oxidase during cellular respiration |
|
| YOR235W | 0.86 |
IRC13
|
Dubious open reading frame unlikely to encode a protein, based on available experimental and comparative sequence data; null mutant displays increased levels of spontaneous Rad52 foci |
|
| YMR306C-A | 0.86 |
Dubious open reading frame unlikely to encode a functional protein, based on available experimental and comparative sequence data |
||
| YHR176W | 0.85 |
FMO1
|
Flavin-containing monooxygenase, localized to the cytoplasmic face of the ER membrane; catalyzes oxidation of biological thiols to maintain the ER redox buffer ratio for correct folding of disulfide-bonded proteins |
|
| YPR192W | 0.85 |
AQY1
|
Spore-specific water channel that mediates the transport of water across cell membranes, developmentally controlled; may play a role in spore maturation, probably by allowing water outflow, may be involved in freeze tolerance |
|
| YDR043C | 0.84 |
NRG1
|
Transcriptional repressor that recruits the Cyc8p-Tup1p complex to promoters; mediates glucose repression and negatively regulates a variety of processes including filamentous growth and alkaline pH response |
|
| YIL101C | 0.83 |
XBP1
|
Transcriptional repressor that binds to promoter sequences of the cyclin genes, CYS3, and SMF2; expression is induced by stress or starvation during mitosis, and late in meiosis; member of the Swi4p/Mbp1p family; potential Cdc28p substrate |
|
| YKL163W | 0.82 |
PIR3
|
O-glycosylated covalently-bound cell wall protein required for cell wall stability; expression is cell cycle regulated, peaking in M/G1 and also subject to regulation by the cell integrity pathway |
|
| YKL085W | 0.82 |
MDH1
|
Mitochondrial malate dehydrogenase, catalyzes interconversion of malate and oxaloacetate; involved in the tricarboxylic acid (TCA) cycle; phosphorylated |
|
| YLR054C | 0.81 |
OSW2
|
Protein of unknown function proposed to be involved in the assembly of the spore wall |
|
| YDR169C | 0.81 |
STB3
|
Protein that binds Sin3p in a two-hybrid assay |
|
| YHR211W | 0.81 |
FLO5
|
Lectin-like cell wall protein (flocculin) involved in flocculation, binds to mannose chains on the surface of other cells, confers floc-forming ability that is chymotrypsin resistant but heat labile; similar to Flo1p |
|
| YEL049W | 0.81 |
PAU2
|
Part of 23-member seripauperin multigene family encoded mainly in subtelomeric regions, active during alcoholic fermentation, regulated by anaerobiosis, negatively regulated by oxygen, repressed by heme |
|
| YDR119W-A | 0.79 |
Putative protein of unknown function |
||
| YFL064C | 0.79 |
Putative protein of unknown function |
||
| YLR297W | 0.79 |
Putative protein of unknown function; green fluorescent protein (GFP)-fusion protein localizes to the vacuole; YLR297W is not an essential gene; induced by treatment with 8-methoxypsoralen and UVA irradiation |
||
| YKL217W | 0.78 |
JEN1
|
Lactate transporter, required for uptake of lactate and pyruvate; phosphorylated; expression is derepressed by transcriptional activator Cat8p during respiratory growth, and repressed in the presence of glucose, fructose, and mannose |
|
| YDL181W | 0.76 |
INH1
|
Protein that inhibits ATP hydrolysis by the F1F0-ATP synthase; inhibitory function is enhanced by stabilizing proteins Stf1p and Stf2p; has similarity to Stf1p; has a calmodulin-binding motif and binds calmodulin in vitro |
|
| YFR034C | 0.76 |
PHO4
|
Basic helix-loop-helix (bHLH) transcription factor of the myc-family; binds cooperatively with Pho2p to the PHO5 promoter; function is regulated by phosphorylation at multiple sites and by phosphate availability |
|
| YJR077C | 0.76 |
MIR1
|
Mitochondrial phosphate carrier, imports inorganic phosphate into mitochondria; functionally redundant with Pic2p but more abundant than Pic2p under normal conditions; phosphorylated |
|
| YMR135C | 0.75 |
GID8
|
Protein of unknown function, involved in proteasome-dependent catabolite inactivation of fructose-1,6-bisphosphatase; contains LisH and CTLH domains, like Vid30p; dosage-dependent regulator of START |
|
| YNL033W | 0.74 |
Putative protein of unknown function |
||
| YLR437C-A | 0.74 |
Dubious open reading frame unlikely to encode a protein, based on available experimental and comparative sequence data; partially overlaps the verified ORF CAR2/YLR438W |
||
| YOR338W | 0.74 |
Putative protein of unknown function; YOR338W transcription is regulated by Azf1p and its transcript is a specific target of the G protein effector Scp160p; identified as being required for sporulation in a high-throughput mutant screen |
||
| YPL058C | 0.72 |
PDR12
|
Plasma membrane ATP-binding cassette (ABC) transporter, weak-acid-inducible multidrug transporter required for weak organic acid resistance; induced by sorbate and benzoate and regulated by War1p; mutants exhibit sorbate hypersensitivity |
|
| YLR237W | 0.72 |
THI7
|
Plasma membrane transporter responsible for the uptake of thiamine, member of the major facilitator superfamily of transporters; mutation of human ortholog causes thiamine-responsive megaloblastic anemia |
|
| YIL055C | 0.71 |
Putative protein of unknown function |
||
| YBR240C | 0.70 |
THI2
|
Zinc finger protein of the Zn(II)2Cys6 type, probable transcriptional activator of thiamine biosynthetic genes |
|
| YCL025C | 0.70 |
AGP1
|
Low-affinity amino acid permease with broad substrate range, involved in uptake of asparagine, glutamine, and other amino acids; expression is regulated by the SPS plasma membrane amino acid sensor system (Ssy1p-Ptr3p-Ssy5p) |
|
| YFL059W | 0.69 |
SNZ3
|
Member of a stationary phase-induced gene family; transcription of SNZ2 is induced prior to diauxic shift, and also in the absence of thiamin in a Thi2p-dependent manner; forms a coregulated gene pair with SNO3 |
|
| YGR258C | 0.69 |
RAD2
|
Single-stranded DNA endonuclease, cleaves single-stranded DNA during nucleotide excision repair to excise damaged DNA; subunit of Nucleotide Excision Repair Factor 3 (NEF3); homolog of human XPG protein |
|
| YPL025C | 0.69 |
Hypothetical protein |
||
| YLR176C | 0.69 |
RFX1
|
Major transcriptional repressor of DNA-damage-regulated genes, recruits repressors Tup1p and Cyc8p to their promoters; involved in DNA damage and replication checkpoint pathway; similar to a family of mammalian DNA binding RFX1-4 proteins |
|
| YMR017W | 0.69 |
SPO20
|
Meiosis-specific subunit of the t-SNARE complex, required for prospore membrane formation during sporulation; similar to but not functionally redundant with Sec9p; SNAP-25 homolog |
|
| YDR242W | 0.68 |
AMD2
|
Putative amidase |
|
| YIR027C | 0.68 |
DAL1
|
Allantoinase, converts allantoin to allantoate in the first step of allantoin degradation; expression sensitive to nitrogen catabolite repression |
|
| YOR138C | 0.68 |
RUP1
|
Protein involved in regulation of Rsp5p, which is an essential HECT ubiquitin ligase; required for binding of Rsp5p to Ubp2p; contains an UBA domain |
|
| YDR452W | 0.67 |
PPN1
|
Vacuolar endopolyphosphatase with a role in phosphate metabolism; functions as a homodimer |
|
| YPR054W | 0.67 |
SMK1
|
Middle sporulation-specific mitogen-activated protein kinase (MAPK) required for production of the outer spore wall layers; negatively regulates activity of the glucan synthase subunit Gsc2p |
|
| YGL146C | 0.67 |
Putative protein of unknown function, contains two putative transmembrane spans, shows no significant homology to any other known protein sequence, YGL146C is not an essential gene |
||
| YDR466W | 0.67 |
PKH3
|
Protein kinase with similarity to mammalian phosphoinositide-dependent kinase 1 (PDK1) and yeast Pkh1p and Pkh2p, two redundant upstream activators of Pkc1p; identified as a multicopy suppressor of a pkh1 pkh2 double mutant |
|
| YBR284W | 0.66 |
Putative protein of unknown function; YBR284W is not an essential gene; null mutant exhibits decreased resistance to rapamycin and wortmannin |
||
| YOR394W | 0.66 |
PAU21
|
Hypothetical protein |
|
| YHR015W | 0.66 |
MIP6
|
Putative RNA-binding protein, interacts with Mex67p, which is a component of the nuclear pore involved in nuclear mRNA export |
|
| YNL104C | 0.65 |
LEU4
|
Alpha-isopropylmalate synthase (2-isopropylmalate synthase); the main isozyme responsible for the first step in the leucine biosynthesis pathway |
|
| YGL117W | 0.65 |
Putative protein of unknown function |
||
| YGR121C | 0.64 |
MEP1
|
Ammonium permease; belongs to a ubiquitous family of cytoplasmic membrane proteins that transport only ammonium (NH4+); expression is under the nitrogen catabolite repression regulation |
|
| YIL155C | 0.64 |
GUT2
|
Mitochondrial glycerol-3-phosphate dehydrogenase; expression is repressed by both glucose and cAMP and derepressed by non-fermentable carbon sources in a Snf1p, Rsf1p, Hap2/3/4/5 complex dependent manner |
|
| YPL015C | 0.63 |
HST2
|
Cytoplasmic member of the silencing information regulator 2 (Sir2) family of NAD(+)-dependent protein deacetylases; modulates nucleolar (rDNA) and telomeric silencing; possesses NAD(+)-dependent histone deacetylase activity in vitro |
|
| YOR344C | 0.63 |
TYE7
|
Serine-rich protein that contains a basic-helix-loop-helix (bHLH) DNA binding motif; binds E-boxes of glycolytic genes and contributes to their activation; may function as a transcriptional activator in Ty1-mediated gene expression |
|
| YPL164C | 0.63 |
MLH3
|
Protein involved in DNA mismatch repair and crossing-over during meiotic recombination; forms a complex with Mlh1p; mammalian homolog is implicated mammalian microsatellite instability |
|
| YIL100C-A | 0.62 |
Dubious open reading frame unlikely to encode a functional protein, based on available experimental and comparative sequence data |
||
| YFR034W-A | 0.62 |
Dubious ORF unlikely to encode a protein, based on available experimental and comparative sequence data; partially overlaps YFR035C; identified by gene-trapping, microarray expression analysis, and genome-wide homology searching |
||
| YJL100W | 0.62 |
LSB6
|
Type II phosphatidylinositol 4-kinase that binds Las17p, which is a homolog of human Wiskott-Aldrich Syndrome protein involved in actin patch assembly and actin polymerization |
|
| YPL282C | 0.61 |
PAU22
|
Hypothetical protein |
|
| YDR231C | 0.61 |
COX20
|
Mitochondrial inner membrane protein, required for proteolytic processing of Cox2p and its assembly into cytochrome c oxidase |
|
| YNL103W | 0.61 |
MET4
|
Leucine-zipper transcriptional activator, responsible for the regulation of the sulfur amino acid pathway, requires different combinations of the auxiliary factors Cbf1p, Met28p, Met31p and Met32p |
|
| YBR006W | 0.61 |
UGA2
|
Succinate semialdehyde dehydrogenase involved in the utilization of gamma-aminobutyrate (GABA) as a nitrogen source; part of the 4-aminobutyrate and glutamate degradation pathways; localized to the cytoplasm |
|
| YNL125C | 0.61 |
ESBP6
|
Protein with similarity to monocarboxylate permeases, appears not to be involved in transport of monocarboxylates such as lactate, pyruvate or acetate across the plasma membrane |
|
| YPL135W | 0.60 |
ISU1
|
Conserved protein of the mitochondrial matrix, performs a scaffolding function during assembly of iron-sulfur clusters, interacts physically and functionally with yeast frataxin (Yfh1p); isu1 isu2 double mutant is inviable |
|
| YDL174C | 0.60 |
DLD1
|
D-lactate dehydrogenase, oxidizes D-lactate to pyruvate, transcription is heme-dependent, repressed by glucose, and derepressed in ethanol or lactate; located in the mitochondrial inner membrane |
|
| YLR111W | 0.60 |
Dubious open reading frame unlikely to encode a protein, based on available experimental and comparative sequence data |
||
| YER069W | 0.59 |
ARG5,6
|
Protein that is processed in the mitochondrion to yield acetylglutamate kinase and N-acetyl-gamma-glutamyl-phosphate reductase, which catalyze the 2nd and 3rd steps in arginine biosynthesis; enzymes form a complex with Arg2p |
|
| YHR071W | 0.59 |
PCL5
|
Cyclin, interacts with Pho85p cyclin-dependent kinase (Cdk), induced by Gcn4p at level of transcription, specifically required for Gcn4p degradation, may be sensor of cellular protein biosynthetic capacity |
|
| YKR097W | 0.58 |
PCK1
|
Phosphoenolpyruvate carboxykinase, key enzyme in gluconeogenesis, catalyzes early reaction in carbohydrate biosynthesis, glucose represses transcription and accelerates mRNA degradation, regulated by Mcm1p and Cat8p, located in the cytosol |
|
| YDL007C-A | 0.58 |
Putative protein of unknown function |
||
| YFR012W | 0.58 |
Putative protein of unknown function |
||
| YDL221W | 0.58 |
Dubious open reading frame unlikely to encode a protein, based on available experimental and comparative sequence data; partially overlaps the 3' end of essential gene CDC13 |
||
| YNR047W | 0.58 |
Putative protein kinase that, when overexpressed, interferes with pheromone-induced growth arrest; localizes to the cytoplasm; potential Cdc28p substrate |
||
| YNL283C | 0.56 |
WSC2
|
Partially redundant sensor-transducer of the stress-activated PKC1-MPK1 signaling pathway involved in maintenance of cell wall integrity and recovery from heat shock; secretory pathway Wsc2p is required for the arrest of secretion response |
|
| YIL045W | 0.56 |
PIG2
|
Putative type-1 protein phosphatase targeting subunit that tethers Glc7p type-1 protein phosphatase to Gsy2p glycogen synthase |
|
| YJL103C | 0.56 |
GSM1
|
Putative zinc cluster protein of unknown function; proposed to be involved in the regulation of energy metabolism, based on patterns of expression and sequence analysis |
|
| YML133C | 0.56 |
Putative protein of unknown function with similarity to helicases; the authentic, non-tagged protein is detected in highly purified mitochondria in high-throughput studies; YML133C contains an intron |
||
| YLR399C | 0.55 |
BDF1
|
Protein involved in transcription initiation at TATA-containing promoters; associates with the basal transcription factor TFIID; contains two bromodomains; corresponds to the C-terminal region of mammalian TAF1; redundant with Bdf2p |
|
| YMR069W | 0.55 |
NAT4
|
N alpha-acetyl-transferase, involved in acetylation of the N-terminal residues of histones H4 and H2A |
|
| YNL019C | 0.55 |
Putative protein of unknown function |
||
| YPR005C | 0.54 |
HAL1
|
Cytoplasmic protein involved in halotolerance; decreases intracellular Na+ (via Ena1p) and increases intracellular K+ by decreasing efflux; expression repressed by Ssn6p-Tup1p and Sko1p and induced by NaCl, KCl, and sorbitol through Gcn4p |
|
| YMR063W | 0.53 |
RIM9
|
Protein of unknown function, involved in the proteolytic activation of Rim101p in response to alkaline pH; has similarity to A. nidulans PalI; putative membrane protein |
|
| YIL100W | 0.53 |
Dubious open reading frame unlikely to encode a protein, based on available experimental and comparative sequence data; completely overlaps the dubious ORF YIL100C-A |
||
| YFL060C | 0.53 |
SNO3
|
Protein of unknown function, nearly identical to Sno2p; expression is induced before the diauxic shift and also in the absence of thiamin |
|
| YEL033W | 0.53 |
MTC7
|
Predicted metabolic role based on network analysis derived from ChIP experiments, a large-scale deletion study and localization of transcription factor binding sites; null mutant is sensitive to temperature oscillation in a cdc13-1 mutant |
|
| YBR001C | 0.52 |
NTH2
|
Putative neutral trehalase, required for thermotolerance and may mediate resistance to other cellular stresses |
|
| YJL116C | 0.51 |
NCA3
|
Protein that functions with Nca2p to regulate mitochondrial expression of subunits 6 (Atp6p) and 8 (Atp8p ) of the Fo-F1 ATP synthase; member of the SUN family |
|
| YOR032C | 0.50 |
HMS1
|
Basic helix-loop-helix (bHLH) protein with similarity to myc-family transcription factors; overexpression confers hyperfilamentous growth and suppresses the pseudohyphal filamentation defect of a diploid mep1 mep2 homozygous null mutant |
|
| YKR095W | 0.49 |
MLP1
|
Myosin-like protein associated with the nuclear envelope, connects the nuclear pore complex with the nuclear interior; involved with Tel1p in telomere length control; involved with Pml1p and Pml39p in nuclear retention of unspliced mRNAs |
|
| YJL005W | 0.49 |
CYR1
|
Adenylate cyclase, required for cAMP production and cAMP-dependent protein kinase signaling; the cAMP pathway controls a variety of cellular processes, including metabolism, cell cycle, stress response, stationary phase, and sporulation |
|
| YHR145C | 0.49 |
Dubious open reading frame unlikely to encode a functional protein, based on available experimental and comparative sequence data |
||
| YNL243W | 0.49 |
SLA2
|
Transmembrane actin-binding protein involved in membrane cytoskeleton assembly and cell polarization; adaptor protein that links actin to clathrin and endocytosis; present in the actin cortical patch of the emerging bud tip; dimer in vivo |
|
| YBL084C | 0.49 |
CDC27
|
Subunit of the Anaphase-Promoting Complex/Cyclosome (APC/C), which is a ubiquitin-protein ligase required for degradation of anaphase inhibitors, including mitotic cyclins, during the metaphase/anaphase transition |
|
| YER068C-A | 0.49 |
Dubious open reading frame unlikely to encode a functional protein, based on available experimental and comparative sequence data |
||
| YFL063W | 0.49 |
Dubious open reading frame, based on available experimental and comparative sequence data |
||
| YNL282W | 0.49 |
POP3
|
Subunit of both RNase MRP, which cleaves pre-rRNA, and nuclear RNase P, which cleaves tRNA precursors to generate mature 5' ends |
|
| YKL161C | 0.48 |
Protein kinase implicated in the Slt2p mitogen-activated (MAP) kinase signaling pathway; associates with Rlm1p |
||
| YMR306W | 0.47 |
FKS3
|
Protein involved in spore wall assembly, has similarity to 1,3-beta-D-glucan synthase catalytic subunits Fks1p and Gsc2p; the authentic, non-tagged protein is detected in highly purified mitochondria in high-throughput studies |
|
| YEL028W | 0.47 |
Dubious open reading frame unlikely to encode a protein, based on available experimental and comparative sequence data |
||
| YNL014W | 0.47 |
HEF3
|
Translational elongation factor EF-3; paralog of YEF3 and member of the ABC superfamily; stimulates EF-1 alpha-dependent binding of aminoacyl-tRNA by the ribosome; normally expressed in zinc deficient cells |
|
| YGR144W | 0.47 |
THI4
|
Thiazole synthase, catalyzes formation of the thiazole moiety of thiamin pyrophosphate; required for thiamine biosynthesis and for mitochondrial genome stability |
|
| YOR374W | 0.47 |
ALD4
|
Mitochondrial aldehyde dehydrogenase, required for growth on ethanol and conversion of acetaldehyde to acetate; phosphorylated; activity is K+ dependent; utilizes NADP+ or NAD+ equally as coenzymes; expression is glucose repressed |
|
| YBR077C | 0.46 |
SLM4
|
Component of the EGO complex, which is involved in the regulation of microautophagy, and of the GSE complex, which is required for proper sorting of amino acid permease Gap1p; gene exhibits synthetic genetic interaction with MSS4 |
|
| YJL102W | 0.46 |
MEF2
|
Mitochondrial elongation factor involved in translational elongation |
|
| YBR035C | 0.46 |
PDX3
|
Pyridoxine (pyridoxamine) phosphate oxidase, has homologs in E. coli and Myxococcus xanthus; transcription is under the general control of nitrogen metabolism |
|
| YEL009C | 0.46 |
GCN4
|
Transcriptional activator of amino acid biosynthetic genes in response to amino acid starvation; expression is tightly regulated at both the transcriptional and translational levels |
|
| YNL245C | 0.45 |
CWC25
|
Component of a complex containing Cef1p, involved in pre-mRNA splicing; has similarity to S. pombe Cwf25p |
|
| YKR067W | 0.44 |
GPT2
|
Glycerol-3-phosphate/dihydroxyacetone phosphate dual substrate-specific sn-1 acyltransferase located in lipid particles and the ER; involved in the stepwise acylation of glycerol-3-phosphate and dihydroxyacetone in lipid biosynthesis |
|
| YLR140W | 0.44 |
Dubious open reading frame unlikely to encode a functional protein; overlaps essential RRN5 gene which encodes a member of the UAF transcription factor involved in transcription of rDNA by RNA polymerase I |
||
| YPL054W | 0.43 |
LEE1
|
Zinc-finger protein of unknown function |
|
| YBR179C | 0.43 |
FZO1
|
Mitochondrial integral membrane protein involved in mitochondrial fusion and maintenance of the mitochondrial genome; contains N-terminal GTPase domain |
|
| YOR236W | 0.43 |
DFR1
|
Dihydrofolate reductase, part of the dTTP biosynthetic pathway, involved in folate metabolism, possibly required for mitochondrial function |
|
| YBL100C | 0.43 |
Dubious open reading frame unlikely to encode a protein, based on available experimental and comparative sequence data; almost completely overlaps the 5' end of ATP1 |
||
| YOR285W | 0.42 |
Protein of unknown function, localized to the mitochondrial outer membrane |
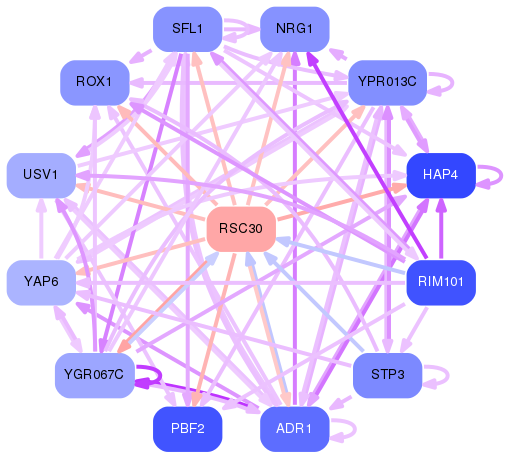
Network of associatons between targets according to the STRING database.

First level regulatory network of RSC30
Gene Ontology Analysis
Gene overrepresentation in biological process category:
| Log-likelihood per target | Total log-likelihood | Term | Description |
|---|---|---|---|
| 1.7 | 6.8 | GO:0015804 | neutral amino acid transport(GO:0015804) |
| 1.4 | 4.1 | GO:0015888 | thiamine transport(GO:0015888) |
| 0.6 | 1.8 | GO:0006545 | glycine biosynthetic process(GO:0006545) |
| 0.6 | 1.8 | GO:1900460 | negative regulation of invasive growth in response to glucose limitation by negative regulation of transcription from RNA polymerase II promoter(GO:1900460) |
| 0.6 | 2.4 | GO:0043388 | positive regulation of DNA binding(GO:0043388) regulation of DNA binding(GO:0051101) |
| 0.6 | 1.7 | GO:0051469 | vesicle fusion with vacuole(GO:0051469) |
| 0.6 | 1.7 | GO:0019413 | acetate biosynthetic process(GO:0019413) |
| 0.5 | 3.0 | GO:0000128 | flocculation(GO:0000128) flocculation via cell wall protein-carbohydrate interaction(GO:0000501) |
| 0.5 | 1.5 | GO:0009437 | amino-acid betaine metabolic process(GO:0006577) carnitine metabolic process(GO:0009437) |
| 0.5 | 1.4 | GO:0015740 | C4-dicarboxylate transport(GO:0015740) |
| 0.5 | 1.4 | GO:0097201 | negative regulation of transcription from RNA polymerase II promoter in response to stress(GO:0097201) |
| 0.5 | 1.4 | GO:0042843 | D-xylose catabolic process(GO:0042843) |
| 0.4 | 3.9 | GO:0006097 | glyoxylate cycle(GO:0006097) |
| 0.4 | 2.6 | GO:0043457 | regulation of cellular respiration(GO:0043457) |
| 0.4 | 1.6 | GO:0006083 | acetate metabolic process(GO:0006083) |
| 0.4 | 1.1 | GO:0018063 | protein-heme linkage(GO:0017003) protein-tetrapyrrole linkage(GO:0017006) cytochrome c-heme linkage(GO:0018063) |
| 0.3 | 1.7 | GO:0034354 | 'de novo' NAD biosynthetic process from tryptophan(GO:0034354) 'de novo' NAD biosynthetic process(GO:0034627) |
| 0.3 | 0.6 | GO:0045981 | positive regulation of nucleotide metabolic process(GO:0045981) positive regulation of purine nucleotide metabolic process(GO:1900544) |
| 0.3 | 0.9 | GO:0005993 | trehalose catabolic process(GO:0005993) |
| 0.3 | 0.3 | GO:0034310 | ethanol catabolic process(GO:0006068) primary alcohol catabolic process(GO:0034310) |
| 0.3 | 0.6 | GO:0006538 | glutamate catabolic process(GO:0006538) |
| 0.3 | 0.9 | GO:0032780 | negative regulation of ATPase activity(GO:0032780) |
| 0.3 | 3.3 | GO:0015758 | glucose transport(GO:0015758) |
| 0.3 | 1.2 | GO:0015847 | putrescine transport(GO:0015847) |
| 0.3 | 2.5 | GO:0070987 | error-free translesion synthesis(GO:0070987) |
| 0.3 | 1.1 | GO:0071456 | cellular response to hypoxia(GO:0071456) |
| 0.3 | 1.1 | GO:0043200 | response to amino acid(GO:0043200) |
| 0.3 | 1.0 | GO:0006103 | 2-oxoglutarate metabolic process(GO:0006103) |
| 0.3 | 1.0 | GO:0006848 | pyruvate transport(GO:0006848) |
| 0.3 | 0.8 | GO:0072488 | ammonium transmembrane transport(GO:0072488) |
| 0.2 | 2.5 | GO:0006122 | mitochondrial electron transport, ubiquinol to cytochrome c(GO:0006122) |
| 0.2 | 1.2 | GO:0005980 | glycogen catabolic process(GO:0005980) |
| 0.2 | 0.7 | GO:0030656 | regulation of vitamin metabolic process(GO:0030656) positive regulation of vitamin metabolic process(GO:0046136) positive regulation of sulfur metabolic process(GO:0051176) regulation of thiamine biosynthetic process(GO:0070623) positive regulation of thiamine biosynthetic process(GO:0090180) |
| 0.2 | 0.9 | GO:0055129 | L-proline biosynthetic process(GO:0055129) |
| 0.2 | 0.7 | GO:0045596 | negative regulation of cell differentiation(GO:0045596) |
| 0.2 | 0.7 | GO:0006798 | polyphosphate catabolic process(GO:0006798) |
| 0.2 | 1.3 | GO:0042407 | cristae formation(GO:0042407) |
| 0.2 | 0.6 | GO:0045950 | negative regulation of mitotic recombination(GO:0045950) |
| 0.2 | 0.6 | GO:0033499 | galactose catabolic process via UDP-galactose(GO:0033499) |
| 0.2 | 0.6 | GO:0006592 | ornithine biosynthetic process(GO:0006592) |
| 0.2 | 0.2 | GO:0044109 | cellular alcohol catabolic process(GO:0044109) |
| 0.2 | 0.8 | GO:0016036 | cellular response to phosphate starvation(GO:0016036) |
| 0.2 | 1.3 | GO:0000023 | maltose metabolic process(GO:0000023) |
| 0.2 | 0.6 | GO:0006119 | oxidative phosphorylation(GO:0006119) |
| 0.2 | 0.5 | GO:0006108 | malate metabolic process(GO:0006108) |
| 0.2 | 1.4 | GO:0042816 | pyridoxine metabolic process(GO:0008614) pyridoxine biosynthetic process(GO:0008615) vitamin B6 metabolic process(GO:0042816) vitamin B6 biosynthetic process(GO:0042819) |
| 0.2 | 0.7 | GO:0006075 | (1->3)-beta-D-glucan biosynthetic process(GO:0006075) |
| 0.2 | 2.1 | GO:0000436 | carbon catabolite activation of transcription from RNA polymerase II promoter(GO:0000436) |
| 0.2 | 1.2 | GO:0009231 | riboflavin metabolic process(GO:0006771) riboflavin biosynthetic process(GO:0009231) |
| 0.2 | 1.6 | GO:0070086 | ubiquitin-dependent endocytosis(GO:0070086) |
| 0.2 | 1.2 | GO:0055071 | cellular manganese ion homeostasis(GO:0030026) manganese ion homeostasis(GO:0055071) |
| 0.2 | 0.8 | GO:0007187 | G-protein coupled receptor signaling pathway, coupled to cyclic nucleotide second messenger(GO:0007187) adenylate cyclase-modulating G-protein coupled receptor signaling pathway(GO:0007188) |
| 0.2 | 1.0 | GO:0000255 | allantoin metabolic process(GO:0000255) allantoin catabolic process(GO:0000256) |
| 0.2 | 0.2 | GO:0009448 | gamma-aminobutyric acid metabolic process(GO:0009448) gamma-aminobutyric acid catabolic process(GO:0009450) |
| 0.2 | 1.1 | GO:0016239 | positive regulation of macroautophagy(GO:0016239) |
| 0.1 | 1.0 | GO:0006123 | mitochondrial electron transport, cytochrome c to oxygen(GO:0006123) |
| 0.1 | 0.6 | GO:0016241 | regulation of macroautophagy(GO:0016241) negative regulation of macroautophagy(GO:0016242) negative regulation of response to external stimulus(GO:0032102) negative regulation of response to extracellular stimulus(GO:0032105) negative regulation of response to nutrient levels(GO:0032108) negative regulation of sequence-specific DNA binding transcription factor activity(GO:0043433) |
| 0.1 | 1.7 | GO:0046686 | response to cadmium ion(GO:0046686) |
| 0.1 | 0.7 | GO:0033683 | nucleotide-excision repair, DNA incision(GO:0033683) |
| 0.1 | 1.1 | GO:0045721 | negative regulation of gluconeogenesis(GO:0045721) |
| 0.1 | 0.6 | GO:0019405 | alditol catabolic process(GO:0019405) glycerol catabolic process(GO:0019563) |
| 0.1 | 0.5 | GO:0015886 | heme transport(GO:0015886) |
| 0.1 | 0.6 | GO:0008053 | mitochondrial fusion(GO:0008053) |
| 0.1 | 0.4 | GO:0015856 | cytosine transport(GO:0015856) purine-containing compound transmembrane transport(GO:0072530) |
| 0.1 | 0.6 | GO:0090294 | nitrogen catabolite activation of transcription from RNA polymerase II promoter(GO:0001080) nitrogen catabolite activation of transcription(GO:0090294) |
| 0.1 | 0.5 | GO:0072414 | cellular response to biotic stimulus(GO:0071216) response to cell cycle checkpoint signaling(GO:0072396) response to mitotic cell cycle checkpoint signaling(GO:0072414) response to spindle checkpoint signaling(GO:0072417) response to mitotic spindle checkpoint signaling(GO:0072476) response to mitotic cell cycle spindle assembly checkpoint signaling(GO:0072479) response to spindle assembly checkpoint signaling(GO:0072485) negative regulation of protein import into nucleus during spindle assembly checkpoint(GO:1901925) |
| 0.1 | 1.3 | GO:0015986 | energy coupled proton transport, down electrochemical gradient(GO:0015985) ATP synthesis coupled proton transport(GO:0015986) |
| 0.1 | 2.2 | GO:0006094 | gluconeogenesis(GO:0006094) |
| 0.1 | 1.0 | GO:0000196 | MAPK cascade involved in cell wall organization or biogenesis(GO:0000196) |
| 0.1 | 0.6 | GO:0031507 | heterochromatin assembly(GO:0031507) |
| 0.1 | 0.4 | GO:0046341 | CDP-diacylglycerol biosynthetic process(GO:0016024) CDP-diacylglycerol metabolic process(GO:0046341) |
| 0.1 | 0.7 | GO:0010906 | regulation of glucose metabolic process(GO:0010906) |
| 0.1 | 0.3 | GO:0071630 | nucleus-associated proteasomal ubiquitin-dependent protein catabolic process(GO:0071630) |
| 0.1 | 1.5 | GO:0009651 | response to salt stress(GO:0009651) |
| 0.1 | 0.2 | GO:0046688 | response to copper ion(GO:0046688) |
| 0.1 | 0.3 | GO:0030037 | actin filament reorganization involved in cell cycle(GO:0030037) actin filament reorganization(GO:0090527) |
| 0.1 | 0.2 | GO:0006013 | mannose metabolic process(GO:0006013) |
| 0.1 | 0.6 | GO:0045003 | double-strand break repair via synthesis-dependent strand annealing(GO:0045003) |
| 0.1 | 0.2 | GO:0010513 | positive regulation of phosphatidylinositol biosynthetic process(GO:0010513) |
| 0.1 | 0.2 | GO:0015851 | nucleobase transport(GO:0015851) |
| 0.1 | 0.4 | GO:0006089 | lactate metabolic process(GO:0006089) |
| 0.1 | 0.6 | GO:0009228 | thiamine biosynthetic process(GO:0009228) thiamine-containing compound biosynthetic process(GO:0042724) |
| 0.1 | 0.4 | GO:0000920 | cell separation after cytokinesis(GO:0000920) |
| 0.1 | 1.0 | GO:0006099 | tricarboxylic acid cycle(GO:0006099) citrate metabolic process(GO:0006101) |
| 0.1 | 1.7 | GO:0000183 | chromatin silencing at rDNA(GO:0000183) |
| 0.1 | 0.2 | GO:0006390 | transcription from mitochondrial promoter(GO:0006390) |
| 0.1 | 0.1 | GO:0043270 | positive regulation of ion transport(GO:0043270) |
| 0.1 | 2.3 | GO:0070591 | ascospore wall assembly(GO:0030476) spore wall assembly(GO:0042244) spore wall biogenesis(GO:0070590) ascospore wall biogenesis(GO:0070591) fungal-type cell wall assembly(GO:0071940) |
| 0.1 | 0.2 | GO:0061408 | positive regulation of transcription from RNA polymerase II promoter in response to heat stress(GO:0061408) |
| 0.1 | 1.0 | GO:0001101 | response to acid chemical(GO:0001101) |
| 0.1 | 0.2 | GO:0031055 | chromatin remodeling at centromere(GO:0031055) |
| 0.1 | 0.2 | GO:0042744 | hydrogen peroxide metabolic process(GO:0042743) hydrogen peroxide catabolic process(GO:0042744) |
| 0.1 | 0.5 | GO:0034965 | intronic snoRNA processing(GO:0031070) intronic box C/D snoRNA processing(GO:0034965) |
| 0.1 | 0.3 | GO:0045041 | protein import into mitochondrial intermembrane space(GO:0045041) |
| 0.1 | 0.2 | GO:0030970 | retrograde protein transport, ER to cytosol(GO:0030970) endoplasmic reticulum to cytosol transport(GO:1903513) |
| 0.1 | 1.1 | GO:0061726 | mitophagy(GO:0000422) mitochondrion disassembly(GO:0061726) |
| 0.1 | 0.1 | GO:0019388 | galactose catabolic process(GO:0019388) |
| 0.0 | 0.5 | GO:0051181 | cofactor transport(GO:0051181) |
| 0.0 | 0.6 | GO:0033617 | mitochondrial respiratory chain complex IV assembly(GO:0033617) |
| 0.0 | 0.6 | GO:0046854 | lipid phosphorylation(GO:0046834) phosphatidylinositol phosphorylation(GO:0046854) |
| 0.0 | 0.1 | GO:0006335 | DNA replication-dependent nucleosome assembly(GO:0006335) DNA replication-dependent nucleosome organization(GO:0034723) |
| 0.0 | 0.5 | GO:0031145 | anaphase-promoting complex-dependent catabolic process(GO:0031145) |
| 0.0 | 0.3 | GO:0006814 | sodium ion transport(GO:0006814) |
| 0.0 | 0.6 | GO:0031321 | ascospore-type prospore assembly(GO:0031321) |
| 0.0 | 0.3 | GO:0046580 | negative regulation of Ras protein signal transduction(GO:0046580) negative regulation of small GTPase mediated signal transduction(GO:0051058) |
| 0.0 | 0.8 | GO:0016579 | protein deubiquitination(GO:0016579) |
| 0.0 | 0.2 | GO:0071322 | cellular response to carbohydrate stimulus(GO:0071322) |
| 0.0 | 0.2 | GO:0032845 | negative regulation of telomere maintenance(GO:0032205) negative regulation of homeostatic process(GO:0032845) |
| 0.0 | 0.4 | GO:0000722 | telomere maintenance via recombination(GO:0000722) |
| 0.0 | 0.3 | GO:0006635 | fatty acid beta-oxidation(GO:0006635) |
| 0.0 | 0.1 | GO:0006086 | acetyl-CoA biosynthetic process(GO:0006085) acetyl-CoA biosynthetic process from pyruvate(GO:0006086) |
| 0.0 | 0.4 | GO:0007121 | bipolar cellular bud site selection(GO:0007121) |
| 0.0 | 0.1 | GO:0050810 | regulation of steroid metabolic process(GO:0019218) regulation of ergosterol biosynthetic process(GO:0032443) regulation of steroid biosynthetic process(GO:0050810) |
| 0.0 | 0.1 | GO:0071248 | response to iron ion(GO:0010039) regulation of transcription from RNA polymerase II promoter in response to iron(GO:0034395) cellular response to metal ion(GO:0071248) cellular response to iron ion(GO:0071281) |
| 0.0 | 0.4 | GO:0006749 | glutathione metabolic process(GO:0006749) |
| 0.0 | 0.1 | GO:0048211 | Golgi vesicle docking(GO:0048211) |
| 0.0 | 0.2 | GO:0006279 | premeiotic DNA replication(GO:0006279) |
| 0.0 | 0.2 | GO:0060963 | positive regulation of ribosomal protein gene transcription from RNA polymerase II promoter(GO:0060963) |
| 0.0 | 0.9 | GO:0009060 | aerobic respiration(GO:0009060) |
| 0.0 | 0.1 | GO:0006813 | potassium ion transport(GO:0006813) |
| 0.0 | 0.5 | GO:0016226 | iron-sulfur cluster assembly(GO:0016226) metallo-sulfur cluster assembly(GO:0031163) |
| 0.0 | 0.2 | GO:0005978 | glycogen biosynthetic process(GO:0005978) |
| 0.0 | 0.2 | GO:0042149 | cellular response to glucose starvation(GO:0042149) |
| 0.0 | 0.1 | GO:0007039 | protein catabolic process in the vacuole(GO:0007039) |
| 0.0 | 0.0 | GO:0045913 | positive regulation of cellular carbohydrate metabolic process(GO:0010676) positive regulation of carbohydrate metabolic process(GO:0045913) |
| 0.0 | 0.2 | GO:0000349 | generation of catalytic spliceosome for first transesterification step(GO:0000349) |
| 0.0 | 0.2 | GO:0006359 | regulation of transcription from RNA polymerase III promoter(GO:0006359) |
| 0.0 | 0.2 | GO:0070058 | tRNA gene clustering(GO:0070058) |
| 0.0 | 0.5 | GO:1902534 | membrane invagination(GO:0010324) lysosomal microautophagy(GO:0016237) single-organism membrane invagination(GO:1902534) |
| 0.0 | 0.1 | GO:0000272 | polysaccharide catabolic process(GO:0000272) |
| 0.0 | 0.1 | GO:0016584 | nucleosome positioning(GO:0016584) |
| 0.0 | 0.2 | GO:0009065 | glutamine family amino acid catabolic process(GO:0009065) |
| 0.0 | 0.1 | GO:0045910 | negative regulation of DNA recombination(GO:0045910) |
| 0.0 | 0.3 | GO:0034401 | chromatin organization involved in regulation of transcription(GO:0034401) |
| 0.0 | 0.1 | GO:0009098 | leucine biosynthetic process(GO:0009098) |
| 0.0 | 0.1 | GO:0006816 | calcium ion transport(GO:0006816) |
| 0.0 | 0.7 | GO:0035825 | reciprocal meiotic recombination(GO:0007131) reciprocal DNA recombination(GO:0035825) |
| 0.0 | 0.4 | GO:0098660 | inorganic ion transmembrane transport(GO:0098660) |
| 0.0 | 0.1 | GO:0042435 | tryptophan biosynthetic process(GO:0000162) indole-containing compound biosynthetic process(GO:0042435) indolalkylamine biosynthetic process(GO:0046219) |
| 0.0 | 0.4 | GO:0006184 | obsolete GTP catabolic process(GO:0006184) |
| 0.0 | 0.3 | GO:0030150 | protein import into mitochondrial matrix(GO:0030150) |
| 0.0 | 0.0 | GO:0051180 | vitamin transport(GO:0051180) |
| 0.0 | 0.5 | GO:0016573 | histone acetylation(GO:0016573) |
| 0.0 | 0.1 | GO:0031120 | snRNA pseudouridine synthesis(GO:0031120) snRNA modification(GO:0040031) |
| 0.0 | 0.2 | GO:0001558 | regulation of cell growth(GO:0001558) |
| 0.0 | 0.1 | GO:0019935 | cAMP-mediated signaling(GO:0019933) cyclic-nucleotide-mediated signaling(GO:0019935) |
| 0.0 | 0.1 | GO:0031087 | deadenylation-independent decapping of nuclear-transcribed mRNA(GO:0031087) |
| 0.0 | 0.3 | GO:0009408 | response to heat(GO:0009408) |
| 0.0 | 0.1 | GO:0032258 | CVT pathway(GO:0032258) |
Gene overrepresentation in cellular component category:
| Log-likelihood per target | Total log-likelihood | Term | Description |
|---|---|---|---|
| 0.8 | 2.3 | GO:0031422 | RecQ helicase-Topo III complex(GO:0031422) |
| 0.7 | 2.7 | GO:0016602 | CCAAT-binding factor complex(GO:0016602) |
| 0.4 | 2.8 | GO:0034657 | GID complex(GO:0034657) |
| 0.3 | 1.0 | GO:0045240 | mitochondrial alpha-ketoglutarate dehydrogenase complex(GO:0005947) mitochondrial oxoglutarate dehydrogenase complex(GO:0009353) dihydrolipoyl dehydrogenase complex(GO:0045240) oxoglutarate dehydrogenase complex(GO:0045252) |
| 0.3 | 1.0 | GO:0045239 | tricarboxylic acid cycle enzyme complex(GO:0045239) |
| 0.3 | 2.4 | GO:0045263 | mitochondrial proton-transporting ATP synthase complex, coupling factor F(o)(GO:0000276) proton-transporting ATP synthase complex, coupling factor F(o)(GO:0045263) |
| 0.2 | 1.9 | GO:0005750 | mitochondrial respiratory chain complex III(GO:0005750) respiratory chain complex III(GO:0045275) |
| 0.2 | 1.6 | GO:0042597 | periplasmic space(GO:0042597) |
| 0.2 | 1.8 | GO:0030677 | ribonuclease P complex(GO:0030677) |
| 0.2 | 1.1 | GO:0032777 | Piccolo NuA4 histone acetyltransferase complex(GO:0032777) |
| 0.1 | 1.2 | GO:0009898 | cytoplasmic side of plasma membrane(GO:0009898) |
| 0.1 | 1.8 | GO:0033698 | Rpd3L complex(GO:0033698) |
| 0.1 | 0.5 | GO:0000148 | 1,3-beta-D-glucan synthase complex(GO:0000148) |
| 0.1 | 2.1 | GO:0070469 | respiratory chain(GO:0070469) |
| 0.1 | 0.4 | GO:0031932 | TORC2 complex(GO:0031932) |
| 0.1 | 0.7 | GO:0000112 | nucleotide-excision repair factor 3 complex(GO:0000112) |
| 0.1 | 0.2 | GO:0030061 | mitochondrial crista(GO:0030061) |
| 0.1 | 1.2 | GO:0005619 | ascospore wall(GO:0005619) |
| 0.1 | 0.5 | GO:0034448 | EGO complex(GO:0034448) |
| 0.1 | 1.6 | GO:0031306 | intrinsic component of mitochondrial outer membrane(GO:0031306) integral component of mitochondrial outer membrane(GO:0031307) |
| 0.1 | 1.3 | GO:0019897 | extrinsic component of plasma membrane(GO:0019897) |
| 0.1 | 1.9 | GO:0042763 | prospore membrane(GO:0005628) intracellular immature spore(GO:0042763) ascospore-type prospore(GO:0042764) |
| 0.1 | 0.6 | GO:0000795 | synaptonemal complex(GO:0000795) |
| 0.1 | 0.3 | GO:0045261 | mitochondrial proton-transporting ATP synthase complex, catalytic core F(1)(GO:0000275) proton-transporting ATP synthase complex, catalytic core F(1)(GO:0045261) |
| 0.1 | 0.2 | GO:0005784 | Sec61 translocon complex(GO:0005784) |
| 0.0 | 0.1 | GO:0046658 | anchored component of plasma membrane(GO:0046658) |
| 0.0 | 0.3 | GO:0016272 | prefoldin complex(GO:0016272) |
| 0.0 | 0.1 | GO:0033186 | CAF-1 complex(GO:0033186) |
| 0.0 | 7.1 | GO:0005743 | mitochondrial inner membrane(GO:0005743) |
| 0.0 | 0.2 | GO:0033309 | SBF transcription complex(GO:0033309) |
| 0.0 | 1.9 | GO:0031225 | anchored component of membrane(GO:0031225) |
| 0.0 | 0.6 | GO:0000812 | Swr1 complex(GO:0000812) |
| 0.0 | 0.2 | GO:0070772 | PAS complex(GO:0070772) |
| 0.0 | 0.1 | GO:0005967 | mitochondrial pyruvate dehydrogenase complex(GO:0005967) pyruvate dehydrogenase complex(GO:0045254) |
| 0.0 | 0.4 | GO:0005769 | early endosome(GO:0005769) |
| 0.0 | 0.4 | GO:0005686 | U2 snRNP(GO:0005686) |
| 0.0 | 0.5 | GO:0005680 | anaphase-promoting complex(GO:0005680) |
| 0.0 | 0.2 | GO:0000164 | protein phosphatase type 1 complex(GO:0000164) |
| 0.0 | 0.2 | GO:0043614 | multi-eIF complex(GO:0043614) |
| 0.0 | 0.1 | GO:0016587 | Isw1 complex(GO:0016587) |
| 0.0 | 3.1 | GO:0098852 | fungal-type vacuole membrane(GO:0000329) lytic vacuole membrane(GO:0098852) |
| 0.0 | 0.4 | GO:0009295 | nucleoid(GO:0009295) mitochondrial nucleoid(GO:0042645) |
| 0.0 | 1.0 | GO:0000323 | storage vacuole(GO:0000322) lytic vacuole(GO:0000323) fungal-type vacuole(GO:0000324) |
| 0.0 | 0.3 | GO:0008023 | transcription elongation factor complex(GO:0008023) |
| 0.0 | 0.2 | GO:0071012 | U2-type catalytic step 1 spliceosome(GO:0071006) catalytic step 1 spliceosome(GO:0071012) |
| 0.0 | 0.1 | GO:0005853 | eukaryotic translation elongation factor 1 complex(GO:0005853) |
| 0.0 | 0.3 | GO:0048471 | perinuclear region of cytoplasm(GO:0048471) |
| 0.0 | 0.1 | GO:0070775 | NuA3 histone acetyltransferase complex(GO:0033100) H3 histone acetyltransferase complex(GO:0070775) |
| 0.0 | 2.3 | GO:0005759 | mitochondrial matrix(GO:0005759) |
| 0.0 | 0.1 | GO:0097346 | INO80-type complex(GO:0097346) |
| 0.0 | 0.1 | GO:0031933 | nuclear heterochromatin(GO:0005720) nuclear telomeric heterochromatin(GO:0005724) telomeric heterochromatin(GO:0031933) |
| 0.0 | 0.7 | GO:0005643 | nuclear pore(GO:0005643) |
| 0.0 | 0.1 | GO:0000782 | telomere cap complex(GO:0000782) nuclear telomere cap complex(GO:0000783) |
Gene overrepresentation in molecular function category:
| Log-likelihood per target | Total log-likelihood | Term | Description |
|---|---|---|---|
| 1.5 | 6.1 | GO:0015193 | L-proline transmembrane transporter activity(GO:0015193) |
| 0.8 | 3.1 | GO:0005537 | mannose binding(GO:0005537) |
| 0.6 | 1.9 | GO:0016289 | CoA hydrolase activity(GO:0016289) |
| 0.6 | 1.7 | GO:0004108 | citrate (Si)-synthase activity(GO:0004108) citrate synthase activity(GO:0036440) |
| 0.5 | 5.0 | GO:0015205 | nucleobase transmembrane transporter activity(GO:0015205) |
| 0.5 | 1.5 | GO:0016406 | carnitine O-acetyltransferase activity(GO:0004092) carnitine O-acyltransferase activity(GO:0016406) |
| 0.5 | 1.4 | GO:0015489 | putrescine transmembrane transporter activity(GO:0015489) |
| 0.4 | 2.3 | GO:0000400 | four-way junction DNA binding(GO:0000400) |
| 0.4 | 1.4 | GO:0015556 | C4-dicarboxylate transmembrane transporter activity(GO:0015556) |
| 0.3 | 1.4 | GO:0004032 | alditol:NADP+ 1-oxidoreductase activity(GO:0004032) |
| 0.3 | 1.0 | GO:0004458 | D-lactate dehydrogenase (cytochrome) activity(GO:0004458) |
| 0.3 | 0.9 | GO:0004555 | alpha,alpha-trehalase activity(GO:0004555) trehalase activity(GO:0015927) |
| 0.3 | 2.1 | GO:0016833 | oxo-acid-lyase activity(GO:0016833) |
| 0.3 | 1.2 | GO:0016885 | ligase activity, forming carbon-carbon bonds(GO:0016885) |
| 0.3 | 1.7 | GO:0004030 | aldehyde dehydrogenase (NAD) activity(GO:0004029) aldehyde dehydrogenase [NAD(P)+] activity(GO:0004030) |
| 0.3 | 1.0 | GO:0016624 | oxidoreductase activity, acting on the aldehyde or oxo group of donors, disulfide as acceptor(GO:0016624) |
| 0.2 | 2.7 | GO:0046933 | proton-transporting ATP synthase activity, rotational mechanism(GO:0046933) |
| 0.2 | 1.2 | GO:0050308 | sugar-phosphatase activity(GO:0050308) |
| 0.2 | 1.7 | GO:0016702 | oxidoreductase activity, acting on single donors with incorporation of molecular oxygen(GO:0016701) oxidoreductase activity, acting on single donors with incorporation of molecular oxygen, incorporation of two atoms of oxygen(GO:0016702) |
| 0.2 | 0.9 | GO:0001094 | TFIID-class transcription factor binding(GO:0001094) |
| 0.2 | 1.7 | GO:0016681 | ubiquinol-cytochrome-c reductase activity(GO:0008121) oxidoreductase activity, acting on diphenols and related substances as donors(GO:0016679) oxidoreductase activity, acting on diphenols and related substances as donors, cytochrome as acceptor(GO:0016681) |
| 0.2 | 1.8 | GO:0004526 | ribonuclease P activity(GO:0004526) |
| 0.2 | 0.5 | GO:0030060 | L-malate dehydrogenase activity(GO:0030060) |
| 0.2 | 0.7 | GO:0015295 | solute:proton symporter activity(GO:0015295) |
| 0.2 | 1.2 | GO:0019238 | cyclohydrolase activity(GO:0019238) |
| 0.2 | 0.8 | GO:0005315 | inorganic phosphate transmembrane transporter activity(GO:0005315) |
| 0.2 | 0.5 | GO:0003843 | 1,3-beta-D-glucan synthase activity(GO:0003843) |
| 0.2 | 3.0 | GO:0001102 | RNA polymerase II activating transcription factor binding(GO:0001102) |
| 0.2 | 0.5 | GO:0043325 | phosphatidylinositol-3,4-bisphosphate binding(GO:0043325) |
| 0.1 | 1.9 | GO:0001135 | transcription factor activity, RNA polymerase II transcription factor recruiting(GO:0001135) |
| 0.1 | 0.9 | GO:0016846 | carbon-sulfur lyase activity(GO:0016846) |
| 0.1 | 0.3 | GO:0000150 | recombinase activity(GO:0000150) |
| 0.1 | 0.6 | GO:0004430 | 1-phosphatidylinositol 4-kinase activity(GO:0004430) |
| 0.1 | 3.6 | GO:0003684 | damaged DNA binding(GO:0003684) |
| 0.1 | 0.7 | GO:0000978 | RNA polymerase II core promoter proximal region sequence-specific DNA binding(GO:0000978) |
| 0.1 | 0.7 | GO:0016888 | endodeoxyribonuclease activity, producing 5'-phosphomonoesters(GO:0016888) |
| 0.1 | 0.5 | GO:0015217 | ATP transmembrane transporter activity(GO:0005347) ATP:ADP antiporter activity(GO:0005471) ADP transmembrane transporter activity(GO:0015217) |
| 0.1 | 0.6 | GO:0070403 | NAD+ binding(GO:0070403) |
| 0.1 | 0.6 | GO:0030983 | mismatched DNA binding(GO:0030983) |
| 0.1 | 0.4 | GO:0017017 | MAP kinase tyrosine/serine/threonine phosphatase activity(GO:0017017) MAP kinase phosphatase activity(GO:0033549) |
| 0.1 | 1.0 | GO:0001103 | RNA polymerase II repressing transcription factor binding(GO:0001103) |
| 0.1 | 0.5 | GO:0016774 | phosphotransferase activity, carboxyl group as acceptor(GO:0016774) |
| 0.1 | 0.7 | GO:0000014 | single-stranded DNA endodeoxyribonuclease activity(GO:0000014) |
| 0.1 | 0.6 | GO:0004707 | MAP kinase activity(GO:0004707) |
| 0.1 | 0.5 | GO:0008198 | ferrous iron binding(GO:0008198) |
| 0.1 | 1.0 | GO:0015002 | cytochrome-c oxidase activity(GO:0004129) heme-copper terminal oxidase activity(GO:0015002) oxidoreductase activity, acting on a heme group of donors(GO:0016675) oxidoreductase activity, acting on a heme group of donors, oxygen as acceptor(GO:0016676) |
| 0.1 | 0.4 | GO:0031683 | G-protein beta/gamma-subunit complex binding(GO:0031683) |
| 0.1 | 1.8 | GO:0016769 | transaminase activity(GO:0008483) transferase activity, transferring nitrogenous groups(GO:0016769) |
| 0.1 | 0.3 | GO:0004088 | carbamoyl-phosphate synthase (glutamine-hydrolyzing) activity(GO:0004088) |
| 0.1 | 0.2 | GO:0070577 | lysine-acetylated histone binding(GO:0070577) |
| 0.1 | 0.1 | GO:0016898 | lactate dehydrogenase activity(GO:0004457) oxidoreductase activity, acting on the CH-OH group of donors, cytochrome as acceptor(GO:0016898) |
| 0.1 | 0.2 | GO:0050833 | pyruvate transmembrane transporter activity(GO:0050833) |
| 0.1 | 0.6 | GO:0015293 | symporter activity(GO:0015293) |
| 0.1 | 0.7 | GO:0016884 | carbon-nitrogen ligase activity, with glutamine as amido-N-donor(GO:0016884) |
| 0.1 | 0.5 | GO:0030246 | carbohydrate binding(GO:0030246) |
| 0.1 | 0.8 | GO:0005199 | structural constituent of cell wall(GO:0005199) |
| 0.1 | 0.5 | GO:0016638 | oxidoreductase activity, acting on the CH-NH2 group of donors(GO:0016638) |
| 0.1 | 0.8 | GO:0038023 | transmembrane signaling receptor activity(GO:0004888) signaling receptor activity(GO:0038023) transmembrane receptor activity(GO:0099600) |
| 0.1 | 1.7 | GO:0004402 | histone acetyltransferase activity(GO:0004402) peptide-lysine-N-acetyltransferase activity(GO:0061733) |
| 0.1 | 0.4 | GO:0008379 | thioredoxin peroxidase activity(GO:0008379) |
| 0.1 | 0.5 | GO:0051184 | cofactor transporter activity(GO:0051184) |
| 0.1 | 0.9 | GO:0003746 | translation elongation factor activity(GO:0003746) |
| 0.1 | 0.4 | GO:0004364 | glutathione transferase activity(GO:0004364) |
| 0.1 | 0.3 | GO:0015081 | sodium ion transmembrane transporter activity(GO:0015081) |
| 0.1 | 0.4 | GO:0016668 | oxidoreductase activity, acting on a sulfur group of donors, NAD(P) as acceptor(GO:0016668) |
| 0.0 | 0.4 | GO:0016413 | O-acetyltransferase activity(GO:0016413) |
| 0.0 | 0.1 | GO:0004559 | alpha-mannosidase activity(GO:0004559) mannosidase activity(GO:0015923) |
| 0.0 | 0.8 | GO:0003713 | transcription coactivator activity(GO:0003713) |
| 0.0 | 0.2 | GO:0050072 | m7G(5')pppN diphosphatase activity(GO:0050072) |
| 0.0 | 0.1 | GO:0004864 | protein phosphatase inhibitor activity(GO:0004864) phosphatase inhibitor activity(GO:0019212) |
| 0.0 | 0.3 | GO:0015450 | P-P-bond-hydrolysis-driven protein transmembrane transporter activity(GO:0015450) |
| 0.0 | 0.1 | GO:0016417 | S-acyltransferase activity(GO:0016417) |
| 0.0 | 0.1 | GO:0004450 | isocitrate dehydrogenase (NADP+) activity(GO:0004450) |
| 0.0 | 0.2 | GO:0090599 | alpha-glucosidase activity(GO:0090599) |
| 0.0 | 0.1 | GO:0010521 | telomerase inhibitor activity(GO:0010521) |
| 0.0 | 3.9 | GO:0000981 | RNA polymerase II transcription factor activity, sequence-specific DNA binding(GO:0000981) |
| 0.0 | 0.4 | GO:0044389 | ubiquitin protein ligase binding(GO:0031625) ubiquitin-like protein ligase binding(GO:0044389) |
| 0.0 | 0.4 | GO:0008599 | protein phosphatase type 1 regulator activity(GO:0008599) |
| 0.0 | 0.1 | GO:0008195 | phosphatidate phosphatase activity(GO:0008195) |
| 0.0 | 0.7 | GO:0005484 | SNAP receptor activity(GO:0005484) |
| 0.0 | 0.3 | GO:0000993 | RNA polymerase II core binding(GO:0000993) |
| 0.0 | 0.2 | GO:0031369 | translation initiation factor binding(GO:0031369) |
| 0.0 | 0.1 | GO:0004614 | phosphoglucomutase activity(GO:0004614) |
| 0.0 | 0.2 | GO:0004601 | peroxidase activity(GO:0004601) oxidoreductase activity, acting on peroxide as acceptor(GO:0016684) |
| 0.0 | 0.5 | GO:0043021 | ribonucleoprotein complex binding(GO:0043021) |
| 0.0 | 0.1 | GO:0005384 | manganese ion transmembrane transporter activity(GO:0005384) |
| 0.0 | 0.1 | GO:0015175 | neutral amino acid transmembrane transporter activity(GO:0015175) |
| 0.0 | 0.1 | GO:0004180 | carboxypeptidase activity(GO:0004180) |
| 0.0 | 0.2 | GO:0015616 | DNA translocase activity(GO:0015616) |
| 0.0 | 0.2 | GO:0000384 | first spliceosomal transesterification activity(GO:0000384) |
| 0.0 | 0.2 | GO:0004712 | protein serine/threonine/tyrosine kinase activity(GO:0004712) |
| 0.0 | 0.1 | GO:0016832 | aldehyde-lyase activity(GO:0016832) |
| 0.0 | 0.1 | GO:0046912 | transferase activity, transferring acyl groups, acyl groups converted into alkyl on transfer(GO:0046912) |
| 0.0 | 0.0 | GO:0015088 | copper uptake transmembrane transporter activity(GO:0015088) |
| 0.0 | 0.0 | GO:0051183 | vitamin transporter activity(GO:0051183) |
| 0.0 | 0.1 | GO:0017025 | TBP-class protein binding(GO:0017025) |
| 0.0 | 0.1 | GO:0098847 | single-stranded telomeric DNA binding(GO:0043047) sequence-specific single stranded DNA binding(GO:0098847) |
Gene overrepresentation in curated gene sets: canonical pathways category:
| Log-likelihood per target | Total log-likelihood | Term | Description |
|---|---|---|---|
| 0.5 | 1.6 | PID IL4 2PATHWAY | IL4-mediated signaling events |
| 0.5 | 0.5 | PID TCR PATHWAY | TCR signaling in naïve CD4+ T cells |
| 0.3 | 0.8 | PID ERBB2 ERBB3 PATHWAY | ErbB2/ErbB3 signaling events |
| 0.3 | 2.3 | PID FANCONI PATHWAY | Fanconi anemia pathway |
| 0.2 | 0.6 | PID HNF3B PATHWAY | FOXA2 and FOXA3 transcription factor networks |
| 0.2 | 0.4 | PID ANGIOPOIETIN RECEPTOR PATHWAY | Angiopoietin receptor Tie2-mediated signaling |
| 0.2 | 0.8 | PID ERA GENOMIC PATHWAY | Validated nuclear estrogen receptor alpha network |
| 0.0 | 29.3 | PID TELOMERASE PATHWAY | Regulation of Telomerase |
| 0.0 | 0.0 | SA G1 AND S PHASES | Cdk2, 4, and 6 bind cyclin D in G1, while cdk2/cyclin E promotes the G1/S transition. |
Gene overrepresentation in curated gene sets: REACTOME pathways category:
| Log-likelihood per target | Total log-likelihood | Term | Description |
|---|---|---|---|
| 0.4 | 0.8 | REACTOME ACTIVATION OF CHAPERONE GENES BY XBP1S | Genes involved in Activation of Chaperone Genes by XBP1(S) |
| 0.3 | 0.9 | REACTOME RESPIRATORY ELECTRON TRANSPORT ATP SYNTHESIS BY CHEMIOSMOTIC COUPLING AND HEAT PRODUCTION BY UNCOUPLING PROTEINS | Genes involved in Respiratory electron transport, ATP synthesis by chemiosmotic coupling, and heat production by uncoupling proteins. |
| 0.3 | 0.8 | REACTOME PI3K EVENTS IN ERBB2 SIGNALING | Genes involved in PI3K events in ERBB2 signaling |
| 0.2 | 2.7 | REACTOME DNA REPAIR | Genes involved in DNA Repair |
| 0.2 | 0.9 | REACTOME BIOLOGICAL OXIDATIONS | Genes involved in Biological oxidations |
| 0.2 | 1.7 | REACTOME GLUCONEOGENESIS | Genes involved in Gluconeogenesis |
| 0.1 | 0.5 | REACTOME AUTODEGRADATION OF CDH1 BY CDH1 APC C | Genes involved in Autodegradation of Cdh1 by Cdh1:APC/C |
| 0.1 | 0.6 | REACTOME MEIOTIC RECOMBINATION | Genes involved in Meiotic Recombination |
| 0.1 | 0.1 | REACTOME GLUCOSE METABOLISM | Genes involved in Glucose metabolism |
| 0.0 | 0.4 | REACTOME METABOLISM OF AMINO ACIDS AND DERIVATIVES | Genes involved in Metabolism of amino acids and derivatives |
| 0.0 | 0.2 | REACTOME CHROMOSOME MAINTENANCE | Genes involved in Chromosome Maintenance |
| 0.0 | 29.2 | REACTOME CHONDROITIN SULFATE BIOSYNTHESIS | Genes involved in Chondroitin sulfate biosynthesis |
| 0.0 | 0.0 | REACTOME NETRIN1 SIGNALING | Genes involved in Netrin-1 signaling |