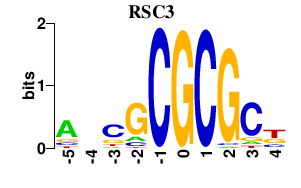
Results for RSC3
Z-value: 1.64
Motif logo
Transcription factors associated with RSC3
| Gene Symbol | Gene ID | Gene Info |
|---|---|---|
|
RSC3
|
S000002711 | Component of the RSC chromatin remodeling complex |
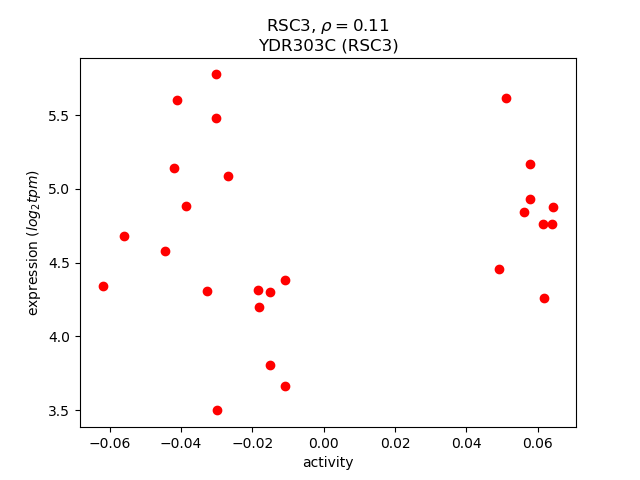
Activity-expression correlation:
Activity profile of RSC3 motif
Sorted Z-values of RSC3 motif
| Promoter | Log-likelihood | Transcript | Gene | Gene Info |
|---|---|---|---|---|
| YGR108W | 14.05 |
CLB1
|
B-type cyclin involved in cell cycle progression; activates Cdc28p to promote the transition from G2 to M phase; accumulates during G2 and M, then targeted via a destruction box motif for ubiquitin-mediated degradation by the proteasome |
|
| YCR018C | 12.99 |
SRD1
|
Protein involved in the processing of pre-rRNA to mature rRNA; contains a C2/C2 zinc finger motif; srd1 mutation suppresses defects caused by the rrp1-1 mutation |
|
| YOL086C | 11.93 |
ADH1
|
Alcohol dehydrogenase, fermentative isozyme active as homo- or heterotetramers; required for the reduction of acetaldehyde to ethanol, the last step in the glycolytic pathway |
|
| YJL190C | 10.64 |
RPS22A
|
Protein component of the small (40S) ribosomal subunit; nearly identical to Rps22Bp and has similarity to E. coli S8 and rat S15a ribosomal proteins |
|
| YJR094W-A | 10.14 |
RPL43B
|
Protein component of the large (60S) ribosomal subunit, identical to Rpl43Ap and has similarity to rat L37a ribosomal protein |
|
| YPL250W-A | 9.41 |
Identified by fungal homology and RT-PCR |
||
| YDL023C | 9.37 |
Dubious open reading frame, unlikely to encode a protein; not conserved in other Saccharomyces species; overlaps the verified gene GPD1; deletion confers sensitivity to GSAO; deletion in cyr1 mutant results in loss of stress resistance |
||
| YKL096W-A | 9.17 |
CWP2
|
Covalently linked cell wall mannoprotein, major constituent of the cell wall; plays a role in stabilizing the cell wall; involved in low pH resistance; precursor is GPI-anchored |
|
| YDR133C | 8.56 |
Dubious open reading frame unlikely to encode a protein, based on available experimental and comparative sequence data; partially overlaps YDR134C |
||
| YGL148W | 8.38 |
ARO2
|
Bifunctional chorismate synthase and flavin reductase, catalyzes the conversion of 5-enolpyruvylshikimate 3-phosphate (EPSP) to form chorismate, which is a precursor to aromatic amino acids |
|
| YER177W | 8.25 |
BMH1
|
14-3-3 protein, major isoform; controls proteome at post-transcriptional level, binds proteins and DNA, involved in regulation of many processes including exocytosis, vesicle transport, Ras/MAPK signaling, and rapamycin-sensitive signaling |
|
| YDL055C | 8.13 |
PSA1
|
GDP-mannose pyrophosphorylase (mannose-1-phosphate guanyltransferase), synthesizes GDP-mannose from GTP and mannose-1-phosphate in cell wall biosynthesis; required for normal cell wall structure |
|
| YMR199W | 8.01 |
CLN1
|
G1 cyclin involved in regulation of the cell cycle; activates Cdc28p kinase to promote the G1 to S phase transition; late G1 specific expression depends on transcription factor complexes, MBF (Swi6p-Mbp1p) and SBF (Swi6p-Swi4p) |
|
| YDL022W | 7.89 |
GPD1
|
NAD-dependent glycerol-3-phosphate dehydrogenase, key enzyme of glycerol synthesis, essential for growth under osmotic stress; expression regulated by high-osmolarity glycerol response pathway; homolog of Gpd2p |
|
| YDL047W | 7.78 |
SIT4
|
Type 2A-related serine-threonine phosphatase that functions in the G1/S transition of the mitotic cycle; cytoplasmic and nuclear protein that modulates functions mediated by Pkc1p including cell wall and actin cytoskeleton organization |
|
| YDL022C-A | 7.75 |
Dubious open reading frame unlikely to encode a protein; partially overlaps the verified gene DIA3; identified by fungal homology and RT-PCR |
||
| YNL030W | 7.29 |
HHF2
|
One of two identical histone H4 proteins (see also HHF1); core histone required for chromatin assembly and chromosome function; contributes to telomeric silencing; N-terminal domain involved in maintaining genomic integrity |
|
| YER131W | 7.18 |
RPS26B
|
Protein component of the small (40S) ribosomal subunit; nearly identical to Rps26Ap and has similarity to rat S26 ribosomal protein |
|
| YNL301C | 7.10 |
RPL18B
|
Protein component of the large (60S) ribosomal subunit, identical to Rpl18Ap and has similarity to rat L18 ribosomal protein |
|
| YLR110C | 7.02 |
CCW12
|
Cell wall mannoprotein, mutants are defective in mating and agglutination, expression is downregulated by alpha-factor |
|
| YKR094C | 6.67 |
RPL40B
|
Fusion protein, identical to Rpl40Ap, that is cleaved to yield ubiquitin and a ribosomal protein of the large (60S) ribosomal subunit with similarity to rat L40; ubiquitin may facilitate assembly of the ribosomal protein into ribosomes |
|
| YHR216W | 6.41 |
IMD2
|
Inosine monophosphate dehydrogenase, catalyzes the first step of GMP biosynthesis, expression is induced by mycophenolic acid resulting in resistance to the drug, expression is repressed by nutrient limitation |
|
| YPL112C | 6.41 |
PEX25
|
Peripheral peroxisomal membrane peroxin required for the regulation of peroxisome size and maintenance, recruits GTPase Rho1p to peroxisomes, induced by oleate, interacts with homologous protein Pex27p |
|
| YOL039W | 6.37 |
RPP2A
|
Ribosomal protein P2 alpha, a component of the ribosomal stalk, which is involved in the interaction between translational elongation factors and the ribosome; regulates the accumulation of P1 (Rpp1Ap and Rpp1Bp) in the cytoplasm |
|
| YDR344C | 6.27 |
Dubious open reading frame unlikely to encode a functional protein, based on available experimental and comparative sequence data |
||
| YOR315W | 6.17 |
SFG1
|
Nuclear protein, putative transcription factor required for growth of superficial pseudohyphae (which do not invade the agar substrate) but not for invasive pseudohyphal growth; may act together with Phd1p; potential Cdc28p substrate |
|
| YDR509W | 6.09 |
Dubious open reading frame unlikely to encode a functional protein, based on available experimental and comparative sequence data |
||
| YKL152C | 6.01 |
GPM1
|
Tetrameric phosphoglycerate mutase, mediates the conversion of 3-phosphoglycerate to 2-phosphoglycerate during glycolysis and the reverse reaction during gluconeogenesis |
|
| YDR508C | 5.96 |
GNP1
|
High-affinity glutamine permease, also transports Leu, Ser, Thr, Cys, Met and Asn; expression is fully dependent on Grr1p and modulated by the Ssy1p-Ptr3p-Ssy5p (SPS) sensor of extracellular amino acids |
|
| YBL063W | 5.79 |
KIP1
|
Kinesin-related motor protein required for mitotic spindle assembly and chromosome segregation; functionally redundant with Cin8p |
|
| YOR096W | 5.79 |
RPS7A
|
Protein component of the small (40S) ribosomal subunit, nearly identical to Rps7Bp; interacts with Kti11p; deletion causes hypersensitivity to zymocin; has similarity to rat S7 and Xenopus S8 ribosomal proteins |
|
| YNL300W | 5.77 |
Glycosylphosphatidylinositol-dependent cell wall protein, expression is periodic and decreases in respone to ergosterol perturbation or upon entry into stationary phase; depletion increases resistance to lactic acid |
||
| YHR070C-A | 5.69 |
Dubious open reading frame unlikely to encode a protein, based on available experimental and comparative sequence data; overlaps the verified gene TRM5/YHR070W |
||
| YMR102C | 5.67 |
Protein of unknown function; transcription is activated by paralogous transcription factors Yrm1p and Yrr1p along with genes involved in multidrug resistance; mutant shows increased resistance to azoles; YMR102C is not an essential gene |
||
| YLR406C | 5.64 |
RPL31B
|
Protein component of the large (60S) ribosomal subunit, nearly identical to Rpl31Ap and has similarity to rat L31 ribosomal protein; associates with the karyopherin Sxm1p |
|
| YOL085C | 5.62 |
Dubious open reading frame unlikely to encode a protein, based on experimental and comparative sequence data; partially overlaps the dubious gene YOL085W-A |
||
| YPL177C | 5.62 |
CUP9
|
Homeodomain-containing transcriptional repressor of PTR2, which encodes a major peptide transporter; imported peptides activate ubiquitin-dependent proteolysis, resulting in degradation of Cup9p and de-repression of PTR2 transcription |
|
| YOL155C | 5.50 |
HPF1
|
Haze-protective mannoprotein that reduces the particle size of aggregated proteins in white wines |
|
| YDR044W | 5.45 |
HEM13
|
Coproporphyrinogen III oxidase, an oxygen requiring enzyme that catalyzes the sixth step in the heme biosynthetic pathway; localizes to the mitochondrial inner membrane; transcription is repressed by oxygen and heme (via Rox1p and Hap1p) |
|
| YOL040C | 5.40 |
RPS15
|
Protein component of the small (40S) ribosomal subunit; has similarity to E. coli S19 and rat S15 ribosomal proteins |
|
| YGR180C | 5.35 |
RNR4
|
Ribonucleotide-diphosphate reductase (RNR), small subunit; the RNR complex catalyzes the rate-limiting step in dNTP synthesis and is regulated by DNA replication and DNA damage checkpoint pathways via localization of the small subunits |
|
| YMR246W | 5.29 |
FAA4
|
Long chain fatty acyl-CoA synthetase, regulates protein modification during growth in the presence of ethanol, functions to incorporate palmitic acid into phospholipids and neutral lipids |
|
| YLR154C | 5.25 |
RNH203
|
Ribonuclease H2 subunit, required for RNase H2 activity |
|
| YFR055W | 5.17 |
IRC7
|
Putative cystathionine beta-lyase; involved in copper ion homeostasis and sulfur metabolism; null mutant displays increased levels of spontaneous Rad52p foci; expression induced by nitrogen limitation in a GLN3, GAT1-dependent manner |
|
| YGR138C | 5.12 |
TPO2
|
Polyamine transport protein specific for spermine; localizes to the plasma membrane; transcription of TPO2 is regulated by Haa1p; member of the major facilitator superfamily |
|
| YNR054C | 5.01 |
ESF2
|
Essential nucleolar protein involved in pre-18S rRNA processing; binds to RNA and stimulates ATPase activity of Dbp8; involved in assembly of the small subunit (SSU) processome |
|
| YNL182C | 4.87 |
IPI3
|
Essential component of the Rix1 complex (Rix1p, Ipi1p, Ipi3p) that is required for processing of ITS2 sequences from 35S pre-rRNA; highly conserved and contains WD40 motifs; Rix1 complex associates with Mdn1p in pre-60S ribosomal particles |
|
| YER146W | 4.84 |
LSM5
|
Lsm (Like Sm) protein; part of heteroheptameric complexes (Lsm2p-7p and either Lsm1p or 8p): cytoplasmic Lsm1p complex involved in mRNA decay; nuclear Lsm8p complex part of U6 snRNP and possibly involved in processing tRNA, snoRNA, and rRNA |
|
| YPL079W | 4.76 |
RPL21B
|
Protein component of the large (60S) ribosomal subunit, nearly identical to Rpl21Ap and has similarity to rat L21 ribosomal protein |
|
| YGL201C | 4.69 |
MCM6
|
Protein involved in DNA replication; component of the Mcm2-7 hexameric complex that binds chromatin as a part of the pre-replicative complex |
|
| YNR016C | 4.66 |
ACC1
|
Acetyl-CoA carboxylase, biotin containing enzyme that catalyzes the carboxylation of acetyl-CoA to form malonyl-CoA; required for de novo biosynthesis of long-chain fatty acids |
|
| YFR056C | 4.60 |
Dubious open reading frame unlikely to encode a protein based on available experimental and comparative sequence data; partially overlaps the uncharacterized gene YFR055W |
||
| YML088W | 4.56 |
UFO1
|
F-box receptor protein, subunit of the Skp1-Cdc53-F-box receptor (SCF) E3 ubiquitin ligase complex; binds to phosphorylated Ho endonuclease, allowing its ubiquitylation by SCF and subsequent degradation |
|
| YDR345C | 4.55 |
HXT3
|
Low affinity glucose transporter of the major facilitator superfamily, expression is induced in low or high glucose conditions |
|
| YGR181W | 4.44 |
TIM13
|
Mitochondrial intermembrane space protein, forms a complex with TIm8p that mediates import and insertion of a subset of polytopic inner membrane proteins; may prevent aggregation of incoming proteins in a chaperone-like manner |
|
| YKL218C | 4.41 |
SRY1
|
3-hydroxyaspartate dehydratase, deaminates L-threo-3-hydroxyaspartate to form oxaloacetate and ammonia; required for survival in the presence of hydroxyaspartate |
|
| YGL147C | 4.41 |
RPL9A
|
Protein component of the large (60S) ribosomal subunit, nearly identical to Rpl9Bp and has similarity to E. coli L6 and rat L9 ribosomal proteins |
|
| YOL107W | 4.40 |
Putative protein of unknown function; green fluorescent protein (GFP)-fusion protein localizes to the cytoplasm and colocalizes in a punctate pattern with the early golgi/COPI vesicles; YOL107W is not an essential protein |
||
| YLR154W-B | 4.37 |
Dubious open reading frame unlikely to encode a protein; encoded within the the 25S rRNA gene on the opposite strand |
||
| YOR108W | 4.35 |
LEU9
|
Alpha-isopropylmalate synthase II (2-isopropylmalate synthase), catalyzes the first step in the leucine biosynthesis pathway; the minor isozyme, responsible for the residual alpha-IPMS activity detected in a leu4 null mutant |
|
| YGR052W | 4.24 |
FMP48
|
Putative protein of unknown function; the authentic, non-tagged protein is detected in highly purified mitochondria in high-throughput studies; induced by treatment with 8-methoxypsoralen and UVA irradiation |
|
| YHR174W | 4.19 |
ENO2
|
Enolase II, a phosphopyruvate hydratase that catalyzes the conversion of 2-phosphoglycerate to phosphoenolpyruvate during glycolysis and the reverse reaction during gluconeogenesis; expression is induced in response to glucose |
|
| YDL048C | 4.19 |
STP4
|
Protein containing a Kruppel-type zinc-finger domain; has similarity to Stp1p, Stp2p, and Stp3p |
|
| YKL063C | 4.17 |
Putative protein of unknown function; green fluorescent protein (GFP)-fusion protein localizes to the Golgi |
||
| YNR009W | 4.16 |
NRM1
|
Transcriptional co-repressor of MBF (MCB binding factor)-regulated gene expression; Nrm1p associates stably with promoters via MBF to repress transcription upon exit from G1 phase |
|
| YLR154W-A | 4.13 |
Dubious open reading frame unlikely to encode a protein; encoded within the the 25S rRNA gene on the opposite strand |
||
| YCR102W-A | 4.05 |
Dubious open reading frame unlikely to encode a protein, based on available experimental and comparative sequence data |
||
| YGL179C | 4.03 |
TOS3
|
Protein kinase, related to and functionally redundant with Elm1p and Sak1p for the phosphorylation and activation of Snf1p; functionally orthologous to LKB1, a mammalian kinase associated with Peutz-Jeghers cancer-susceptibility syndrome |
|
| YJR114W | 3.94 |
Dubious open reading frame unlikely to encode a protein, based on available experimental and comparative sequence data; partially overlaps the verified ORF RSM7/YJR113C |
||
| YDR064W | 3.86 |
RPS13
|
Protein component of the small (40S) ribosomal subunit; has similarity to E. coli S15 and rat S13 ribosomal proteins |
|
| YDR497C | 3.86 |
ITR1
|
Myo-inositol transporter with strong similarity to the minor myo-inositol transporter Itr2p, member of the sugar transporter superfamily; expression is repressed by inositol and choline via Opi1p and derepressed via Ino2p and Ino4p |
|
| YNL031C | 3.85 |
HHT2
|
One of two identical histone H3 proteins (see also HHT1); core histone required for chromatin assembly, involved in heterochromatin-mediated telomeric and HM silencing; regulated by acetylation, methylation, and mitotic phosphorylation |
|
| YIL118W | 3.81 |
RHO3
|
Non-essential small GTPase of the Rho/Rac subfamily of Ras-like proteins involved in the establishment of cell polarity; GTPase activity positively regulated by the GTPase activating protein (GAP) Rgd1p |
|
| YNL079C | 3.81 |
TPM1
|
Major isoform of tropomyosin; binds to and stabilizes actin cables and filaments, which direct polarized cell growth and the distribution of several organelles; acetylated by the NatB complex and acetylated form binds actin most efficiently |
|
| YNL078W | 3.73 |
NIS1
|
Protein localized in the bud neck at G2/M phase; physically interacts with septins; possibly involved in a mitotic signaling network |
|
| YOR008C-A | 3.71 |
Putative protein of unknown function, includes a potential transmembrane domain; deletion results in slightly lengthened telomeres |
||
| YBR126W-A | 3.71 |
Dubious ORF unlikely to encode a protein, based on available experimental and comparative sequence data; partially overlaps the dubious ORF YBR126W-B; identified by gene-trapping, microarray analysis, and genome-wide homology searches |
||
| YGR060W | 3.69 |
ERG25
|
C-4 methyl sterol oxidase, catalyzes the first of three steps required to remove two C-4 methyl groups from an intermediate in ergosterol biosynthesis; mutants accumulate the sterol intermediate 4,4-dimethylzymosterol |
|
| YBR189W | 3.63 |
RPS9B
|
Protein component of the small (40S) ribosomal subunit; nearly identical to Rps9Ap and has similarity to E. coli S4 and rat S9 ribosomal proteins |
|
| YDR447C | 3.62 |
RPS17B
|
Ribosomal protein 51 (rp51) of the small (40s) subunit; nearly identical to Rps17Ap and has similarity to rat S17 ribosomal protein |
|
| YJR113C | 3.62 |
RSM7
|
Mitochondrial ribosomal protein of the small subunit, has similarity to E. coli S7 ribosomal protein |
|
| YDR465C | 3.62 |
RMT2
|
Arginine methyltransferase; ribosomal protein L12 is a substrate |
|
| YDR033W | 3.59 |
MRH1
|
Protein that localizes primarily to the plasma membrane, also found at the nuclear envelope; the authentic, non-tagged protein is detected in mitochondria in a phosphorylated state; has similarity to Hsp30p and Yro2p |
|
| YPL249C-A | 3.53 |
RPL36B
|
Protein component of the large (60S) ribosomal subunit, nearly identical to Rpl36Ap and has similarity to rat L36 ribosomal protein; binds to 5.8 S rRNA |
|
| YAL038W | 3.51 |
CDC19
|
Pyruvate kinase, functions as a homotetramer in glycolysis to convert phosphoenolpyruvate to pyruvate, the input for aerobic (TCA cycle) or anaerobic (glucose fermentation) respiration |
|
| YIL056W | 3.49 |
VHR1
|
Transcriptional activator, required for the vitamin H-responsive element (VHRE) mediated induction of VHT1 (Vitamin H transporter) and BIO5 (biotin biosynthesis intermediate transporter) in response to low biotin concentrations |
|
| YPL014W | 3.49 |
Putative protein of unknown function; green fluorescent protein (GFP)-fusion protein localizes to the cytoplasm and to the nucleus |
||
| YNR001W-A | 3.44 |
Dubious open reading frame unlikely to encode a functional protein; identified by homology |
||
| YKR074W | 3.42 |
AIM29
|
Putative protein of unknown function; epitope-tagged protein localizes to the cytoplasm; null mutant displays increased frequency of mitochondrial genome loss (petite formation) |
|
| YGR106C | 3.41 |
VOA1
|
Putative protein of unknown function; green fluorescent protein (GFP)-fusion protein localizes to the vacuolar memebrane |
|
| YKL110C | 3.40 |
KTI12
|
Protein that plays a role, with Elongator complex, in modification of wobble nucleosides in tRNA; involved in sensitivity to G1 arrest induced by zymocin; interacts with chromatin throughout the genome; also interacts with Cdc19p |
|
| YGR121W-A | 3.35 |
Putative protein of unknown function |
||
| YPL037C | 3.35 |
EGD1
|
Subunit beta1 of the nascent polypeptide-associated complex (NAC) involved in protein targeting, associated with cytoplasmic ribosomes; enhances DNA binding of the Gal4p activator; homolog of human BTF3b |
|
| YML063W | 3.35 |
RPS1B
|
Ribosomal protein 10 (rp10) of the small (40S) subunit; nearly identical to Rps1Ap and has similarity to rat S3a ribosomal protein |
|
| YLR314C | 3.33 |
CDC3
|
Component of the septin ring of the mother-bud neck that is required for cytokinesis; septins recruit proteins to the neck and can act as a barrier to diffusion at the membrane, and they comprise the 10nm filaments seen with EM |
|
| YGR139W | 3.26 |
Dubious ORF unlikely to encode a functional protein, based on available experimental and comparative sequence data |
||
| YGR140W | 3.23 |
CBF2
|
Essential kinetochore protein, component of the CBF3 multisubunit complex that binds to the CDEIII region of the centromere; Cbf2p also binds to the CDEII region possibly forming a different multimeric complex, ubiquitinated in vivo |
|
| YOL127W | 3.21 |
RPL25
|
Primary rRNA-binding ribosomal protein component of the large (60S) ribosomal subunit, has similarity to E. coli L23 and rat L23a ribosomal proteins; binds to 26S rRNA via a conserved C-terminal motif |
|
| YCL024W | 3.16 |
KCC4
|
Protein kinase of the bud neck involved in the septin checkpoint, associates with septin proteins, negatively regulates Swe1p by phosphorylation, shows structural homology to bud neck kinases Gin4p and Hsl1p |
|
| YDR309C | 3.12 |
GIC2
|
Redundant rho-like GTPase Cdc42p effector; homolog of Gic1p; involved in initiation of budding and cellular polarization; interacts with Cdc42p via the Cdc42/Rac-interactive binding (CRIB) domain and with PI(4,5)P2 via a polybasic region |
|
| YPL197C | 3.11 |
Dubious open reading frame unlikely to encode a protein, based on experimental and comparative sequence data; partially overlaps the ribosomal gene RPB7B |
||
| YGR118W | 3.11 |
RPS23A
|
Ribosomal protein 28 (rp28) of the small (40S) ribosomal subunit, required for translational accuracy; nearly identical to Rps23Bp and similar to E. coli S12 and rat S23 ribosomal proteins; deletion of both RPS23A and RPS23B is lethal |
|
| YER019C-A | 3.08 |
SBH2
|
Ssh1p-Sss1p-Sbh2p complex component, involved in protein translocation into the endoplasmic reticulum; homologous to Sbh1p |
|
| YGR050C | 3.07 |
Dubious open reading frame unlikely to encode a protein, based on available experimental and comparative sequence data |
||
| YKL209C | 3.06 |
STE6
|
Plasma membrane ATP-binding cassette (ABC) transporter required for the export of a-factor, catalyzes ATP hydrolysis coupled to a-factor transport; contains 12 transmembrane domains and two ATP binding domains; expressed only in MATa cells |
|
| YMR194C-A | 3.04 |
Dubious open reading frame unlikely to encode a functional protein, based on available experimental and comparative sequence data |
||
| YGR107W | 3.03 |
Dubious open reading frame unlikely to encode a protein, based on available experimental and comparative sequence data |
||
| YBL085W | 3.00 |
BOI1
|
Protein implicated in polar growth, functionally redundant with Boi2p; interacts with bud-emergence protein Bem1p; contains an SH3 (src homology 3) domain and a PH (pleckstrin homology) domain |
|
| YIL053W | 3.00 |
RHR2
|
Constitutively expressed isoform of DL-glycerol-3-phosphatase; involved in glycerol biosynthesis, induced in response to both anaerobic and, along with the Hor2p/Gpp2p isoform, osmotic stress |
|
| YLR257W | 2.98 |
Putative protein of unknown function |
||
| YBR106W | 2.96 |
PHO88
|
Probable membrane protein, involved in phosphate transport; pho88 pho86 double null mutant exhibits enhanced synthesis of repressible acid phosphatase at high inorganic phosphate concentrations |
|
| YBR283C | 2.93 |
SSH1
|
Subunit of the Ssh1 translocon complex; Sec61p homolog involved in co-translational pathway of protein translocation; not essential |
|
| YOR376W-A | 2.92 |
Putative protein of unknown function; identified by fungal homology and RT-PCR |
||
| YIL114C | 2.90 |
POR2
|
Putative mitochondrial porin (voltage-dependent anion channel), related to Por1p but not required for mitochondrial membrane permeability or mitochondrial osmotic stability |
|
| YJR009C | 2.88 |
TDH2
|
Glyceraldehyde-3-phosphate dehydrogenase, isozyme 2, involved in glycolysis and gluconeogenesis; tetramer that catalyzes the reaction of glyceraldehyde-3-phosphate to 1,3 bis-phosphoglycerate; detected in the cytoplasm and cell-wall |
|
| YLR109W | 2.86 |
AHP1
|
Thiol-specific peroxiredoxin, reduces hydroperoxides to protect against oxidative damage; function in vivo requires covalent conjugation to Urm1p |
|
| YGR151C | 2.82 |
Dubious open reading frame unlikely to encode a protein, based on available experimental and comparative sequence data; overlaps almost completely with the verified ORF RSR1/BUD1/YGR152C |
||
| YJR043C | 2.78 |
POL32
|
Third subunit of DNA polymerase delta, involved in chromosomal DNA replication; required for error-prone DNA synthesis in the presence of DNA damage and processivity; interacts with Hys2p, PCNA (Pol30p), and Pol1p |
|
| YOR277C | 2.77 |
Dubious open reading frame unlikely to encode a protein, based on available experimental and comparative sequence data; almost completely overlaps the verified gene CAF20 |
||
| YBL032W | 2.77 |
HEK2
|
RNA binding protein with similarity to hnRNP-K that localizes to the cytoplasm and to subtelomeric DNA; required for the proper localization of ASH1 mRNA; involved in the regulation of telomere position effect and telomere length |
|
| YKL119C | 2.73 |
VPH2
|
Integral membrane protein required for vacuolar H+-ATPase (V-ATPase) function, although not an actual component of the V-ATPase complex; functions in the assembly of the V-ATPase; localized to the endoplasmic reticulum (ER) |
|
| YDR450W | 2.69 |
RPS18A
|
Protein component of the small (40S) ribosomal subunit; nearly identical to Rps18Bp and has similarity to E. coli S13 and rat S18 ribosomal proteins |
|
| YPL198W | 2.67 |
RPL7B
|
Protein component of the large (60S) ribosomal subunit, nearly identical to Rpl7Ap and has similarity to E. coli L30 and rat L7 ribosomal proteins; contains a conserved C-terminal Nucleic acid Binding Domain (NDB2) |
|
| YCR104W | 2.67 |
PAU3
|
Part of 23-member seripauperin multigene family encoded mainly in subtelomeric regions, active during alcoholic fermentation, regulated by anaerobiosis, negatively regulated by oxygen, repressed by heme |
|
| YDL211C | 2.66 |
Putative protein of unknown function; green fluorescent protein (GFP)-fusion protein localizes to the vacuole |
||
| YCL023C | 2.65 |
Dubious open reading frame unlikely to encode a protein, based on available experimental and comparative sequence data; partially overlaps verified ORF KCC4 |
||
| YKL096W | 2.65 |
CWP1
|
Cell wall mannoprotein, linked to a beta-1,3- and beta-1,6-glucan heteropolymer through a phosphodiester bond; involved in cell wall organization |
|
| YHR020W | 2.65 |
Protein of unknown function that may interact with ribosomes, based on co-purification experiments; has similarity to proline-tRNA ligase; YHR020W is an essential gene |
||
| YGR037C | 2.65 |
ACB1
|
Acyl-CoA-binding protein, transports newly synthesized acyl-CoA esters from fatty acid synthetase (Fas1p-Fas2p) to acyl-CoA-consuming processes |
|
| YER130C | 2.64 |
Hypothetical protein |
||
| YLR437C | 2.64 |
Putative protein of unknown function; epitope tagged protein localizes to the cytoplasm |
||
| YOR317W | 2.61 |
FAA1
|
Long chain fatty acyl-CoA synthetase with a preference for C12:0-C16:0 fatty acids; involved in the activation of imported fatty acids; localized to both lipid particles and mitochondrial outer membrane; essential for stationary phase |
|
| YJR123W | 2.60 |
RPS5
|
Protein component of the small (40S) ribosomal subunit, the least basic of the non-acidic ribosomal proteins; phosphorylated in vivo; essential for viability; has similarity to E. coli S7 and rat S5 ribosomal proteins |
|
| YBR126C | 2.58 |
TPS1
|
Synthase subunit of trehalose-6-phosphate synthase/phosphatase complex, which synthesizes the storage carbohydrate trehalose; also found in a monomeric form; expression is induced by the stress response and repressed by the Ras-cAMP pathway |
|
| YLR420W | 2.58 |
URA4
|
Dihydroorotase, catalyzes the third enzymatic step in the de novo biosynthesis of pyrimidines, converting carbamoyl-L-aspartate into dihydroorotate |
|
| YMR112C | 2.58 |
MED11
|
Subunit of the RNA polymerase II mediator complex; associates with core polymerase subunits to form the RNA polymerase II holoenzyme; essential protein |
|
| YJR118C | 2.57 |
ILM1
|
Protein of unknown function; may be involved in mitochondrial DNA maintenance; required for slowed DNA synthesis-induced filamentous growth |
|
| YCR102C | 2.52 |
Putative protein of unknown function; involved in copper metabolism; similar to C.carbonum toxD gene; YCR102C is not an essential gene |
||
| YNL327W | 2.51 |
EGT2
|
Glycosylphosphatidylinositol (GPI)-anchored cell wall endoglucanase required for proper cell separation after cytokinesis, expression is activated by Swi5p and tightly regulated in a cell cycle-dependent manner |
|
| YGR086C | 2.50 |
PIL1
|
Primary component of eisosomes, which are large immobile cell cortex structures associated with endocytosis; null mutants show activation of Pkc1p/Ypk1p stress resistance pathways; detected in phosphorylated state in mitochondria |
|
| YLL064C | 2.50 |
PAU18
|
Hypothetical protein |
|
| YKL073W | 2.50 |
LHS1
|
Molecular chaperone of the endoplasmic reticulum lumen, involved in polypeptide translocation and folding; member of the Hsp70 family; localizes to the lumen of the ER; regulated by the unfolded protein response pathway |
|
| YDR072C | 2.50 |
IPT1
|
Inositolphosphotransferase 1, involved in synthesis of mannose-(inositol-P)2-ceramide (M(IP)2C), which is the most abundant sphingolipid in cells, mutation confers resistance to the antifungals syringomycin E and DmAMP1 in some growth media |
|
| YPR052C | 2.45 |
NHP6A
|
High-mobility group non-histone chromatin protein, functionally redundant with Nhp6Bp; homologous to mammalian high mobility group proteins 1 and 2; acts to recruit transcription factor Rcs1p to certain promoters |
|
| YGR234W | 2.45 |
YHB1
|
Nitric oxide oxidoreductase, flavohemoglobin involved in nitric oxide detoxification; plays a role in the oxidative and nitrosative stress responses |
|
| YDR047W | 2.44 |
HEM12
|
Uroporphyrinogen decarboxylase, catalyzes the fifth step in the heme biosynthetic pathway; localizes to both the cytoplasm and nucleus; activity inhibited by Cu2+, Zn2+, Fe2+, Fe3+ and sulfhydryl-specific reagents |
|
| YOR342C | 2.43 |
Putative protein of unknown function; green fluorescent protein (GFP)-fusion protein localizes to the cytoplasm and the nucleus |
||
| YKL030W | 2.42 |
Dubious open reading frame, unlikely to encode a protein; not conserved in closely related Saccharomyces species; partially overlaps the verified gene MAE1 |
||
| YOR312C | 2.42 |
RPL20B
|
Protein component of the large (60S) ribosomal subunit, nearly identical to Rpl20Ap and has similarity to rat L18a ribosomal protein |
|
| YCR019W | 2.35 |
MAK32
|
Protein necessary for structural stability of L-A double-stranded RNA-containing particles |
|
| YDL226C | 2.34 |
GCS1
|
ADP-ribosylation factor GTPase activating protein (ARF GAP), involved in ER-Golgi transport; shares functional similarity with Glo3p |
|
| YEL027W | 2.30 |
CUP5
|
Proteolipid subunit of the vacuolar H(+)-ATPase V0 sector (subunit c; dicyclohexylcarbodiimide binding subunit); required for vacuolar acidification and important for copper and iron metal ion homeostasis |
|
| YAR071W | 2.30 |
PHO11
|
One of three repressible acid phosphatases, a glycoprotein that is transported to the cell surface by the secretory pathway; induced by phosphate starvation and coordinately regulated by PHO4 and PHO2 |
|
| YER088C-A | 2.29 |
Dubious open reading frame unlikely to encode a functional protein, based on available experimental and comparative sequence data |
||
| YFR025C | 2.29 |
HIS2
|
Histidinolphosphatase, catalyzes the eighth step in histidine biosynthesis; mutations cause histidine auxotrophy and sensitivity to Cu, Co, and Ni salts; transcription is regulated by general amino acid control |
|
| YMR113W | 2.27 |
FOL3
|
Dihydrofolate synthetase, involved in folic acid biosynthesis; catalyzes the conversion of dihydropteroate to dihydrofolate in folate coenzyme biosynthesis |
|
| YIL169C | 2.25 |
Putative protein of unknown function; serine/threonine rich and highly similar to YOL155C, a putative glucan alpha-1,4-glucosidase; transcript is induced in both high and low pH environments; YIL169C is a non-essential gene |
||
| YOR314W | 2.24 |
Dubious open reading frame unlikely to encode a protein, based on available experimental and comparative sequence data |
||
| YPL090C | 2.23 |
RPS6A
|
Protein component of the small (40S) ribosomal subunit; identical to Rps6Bp and has similarity to rat S6 ribosomal protein |
|
| YJR105W | 2.23 |
ADO1
|
Adenosine kinase, required for the utilization of S-adenosylmethionine (AdoMet); may be involved in recycling adenosine produced through the methyl cycle |
|
| YJL048C | 2.22 |
UBX6
|
UBX (ubiquitin regulatory X) domain-containing protein that interacts with Cdc48p, transcription is repressed when cells are grown in media containing inositol and choline |
|
| YOR375C | 2.22 |
GDH1
|
NADP(+)-dependent glutamate dehydrogenase, synthesizes glutamate from ammonia and alpha-ketoglutarate; rate of alpha-ketoglutarate utilization differs from Gdh3p; expression regulated by nitrogen and carbon sources |
|
| YNL178W | 2.20 |
RPS3
|
Protein component of the small (40S) ribosomal subunit, has apurinic/apyrimidinic (AP) endonuclease activity; essential for viability; has similarity to E. coli S3 and rat S3 ribosomal proteins |
|
| YNL338W | 2.20 |
Dubious open reading frame unlikely to encode a protein, based on available experimental and comparative sequence data; completely overlaps TEL14L-XC, which is Telomeric X element Core sequence on the left arm of Chromosome XIV |
||
| YBR009C | 2.19 |
HHF1
|
One of two identical histone H4 proteins (see also HHF2); core histone required for chromatin assembly and chromosome function; contributes to telomeric silencing; N-terminal domain involved in maintaining genomic integrity |
|
| YHR144C | 2.18 |
DCD1
|
Deoxycytidine monophosphate (dCMP) deaminase required for dCTP and dTTP synthesis; expression is NOT cell cycle regulated |
|
| YDR451C | 2.18 |
YHP1
|
One of two homeobox transcriptional repressors (see also Yox1p), that bind to Mcm1p and to early cell cycle box (ECB) elements of cell cycle regulated genes, thereby restricting ECB-mediated transcription to the M/G1 interval |
|
| YOL012C | 2.17 |
HTZ1
|
Histone variant H2AZ, exchanged for histone H2A in nucleosomes by the SWR1 complex; involved in transcriptional regulation through prevention of the spread of silent heterochromatin |
|
| YCL058C | 2.16 |
FYV5
|
Protein of unknown function, required for survival upon exposure to K1 killer toxin; involved in ion homeostasis |
|
| YGR051C | 2.13 |
Dubious open reading frame unlikely to encode a protein, based on available experimental and comparative sequence data; YGR051C is not an essential gene |
||
| YOL080C | 2.13 |
REX4
|
Putative RNA exonuclease possibly involved in pre-rRNA processing and ribosome assembly |
|
| YKL118W | 2.09 |
Dubious open reading frame, unlikely to encode a protein; partially overlaps the verified gene VPH2 |
||
| YPL066W | 2.07 |
Putative protein of unknown function; green fluorescent protein (GFP)-fusion protein localizes to the bud neck and cytoplasm; null mutant is viable and exhibits growth defect on a non-fermentable (respiratory) carbon source |
||
| YKR041W | 2.07 |
Putative protein of unknown function; green fluorescent protein (GFP)-fusion protein localizes to the cytoplasm and nucleus |
||
| YOL079W | 2.07 |
Dubious open reading frame, unlikely to encode a functional protein; based on available experimental and comparative sequence data |
||
| YDR240C | 2.04 |
SNU56
|
Component of U1 snRNP required for mRNA splicing via spliceosome; yeast specific, no metazoan counterpart; interacts with mRNA in commitment complex |
|
| YFL034C-A | 2.03 |
RPL22B
|
Protein component of the large (60S) ribosomal subunit, has similarity to Rpl22Ap and to rat L22 ribosomal protein |
|
| YKL051W | 2.00 |
SFK1
|
Plasma membrane protein that may act together with or upstream of Stt4p to generate normal levels of the essential phospholipid PI4P, at least partially mediates proper localization of Stt4p to the plasma membrane |
|
| YNL089C | 2.00 |
Dubious open reading frame unlikely to encode a functional protein; almost completely overlaps YNL090W/RHO2 which encodes a small GTPase of the Rho/Rac subfamily of Ras-like proteins |
||
| YGL050W | 1.97 |
TYW3
|
tRNA methyltransferase required for synthesis of wybutosine, a modified guanosine found at the 3'-position adjacent to the anticodon of phenylalanine tRNA which supports reading frame maintenance by stabilizing codon-anticodon interactions |
|
| YEL020C-B | 1.96 |
Dubious open reading frame unlikely to encode a protein; partially overlaps verified gene YEL020W-A; identified by fungal homology and RT-PCR |
||
| YLR351C | 1.95 |
NIT3
|
Nit protein, one of two proteins in S. cerevisiae with similarity to the Nit domain of NitFhit from fly and worm and to the mouse and human Nit protein which interacts with the Fhit tumor suppressor; nitrilase superfamily member |
|
| YPR102C | 1.94 |
RPL11A
|
Protein component of the large (60S) ribosomal subunit, nearly identical to Rpl11Bp; involved in ribosomal assembly; depletion causes degradation of proteins and RNA of the 60S subunit; has similarity to E. coli L5 and rat L11 |
|
| YLR108C | 1.94 |
Protein of unknown function; green fluorescent protein (GFP)-fusion protein localizes to the nucleus; YLR108C is not an esssential gene |
||
| YMR119W | 1.90 |
ASI1
|
Putative integral membrane E3 ubiquitin ligase; acts with Asi2p and Asi3p to ensure the fidelity of SPS-sensor signalling by maintaining the dormant repressed state of gene expression in the absence of inducing signals |
|
| YLR002C | 1.89 |
NOC3
|
Protein that forms a nuclear complex with Noc2p that binds to 66S ribosomal precursors to mediate their intranuclear transport; also binds to chromatin to promote the association of DNA replication factors and replication initiation |
|
| YLR400W | 1.89 |
Dubious open reading frame unlikely to encode a functional protein, based on available experimental and comparative sequence data |
||
| YGR242W | 1.88 |
Dubious open reading frame unlikely to encode a protein, based on available experimental and comparative sequence data; partially overlaps the verified ORF YAP1802/YGR241C |
||
| YHR019C | 1.86 |
DED81
|
Cytosolic asparaginyl-tRNA synthetase, required for protein synthesis, catalyzes the specific attachment of asparagine to its cognate tRNA |
|
| YOR349W | 1.86 |
CIN1
|
Tubulin folding factor D involved in beta-tubulin (Tub2p) folding; isolated as mutant with increased chromosome loss and sensitivity to benomyl |
|
| YOR050C | 1.85 |
Hypothetical protein |
||
| YMR049C | 1.84 |
ERB1
|
Protein required for maturation of the 25S and 5.8S ribosomal RNAs; constituent of 66S pre-ribosomal particles; homologous to mammalian Bop1 |
|
| YJR143C | 1.84 |
PMT4
|
Protein O-mannosyltransferase, transfers mannose residues from dolichyl phosphate-D-mannose to protein serine/threonine residues; appears to form homodimers in vivo and does not complex with other Pmt proteins; target for new antifungals |
|
| YKL074C | 1.81 |
MUD2
|
Protein involved in early pre-mRNA splicing; component of the pre-mRNA-U1 snRNP complex, the commitment complex; interacts with Msl5p/BBP splicing factor and Sub2p; similar to metazoan splicing factor U2AF65 |
|
| YOL011W | 1.81 |
PLB3
|
Phospholipase B (lysophospholipase) involved in phospholipid metabolism; hydrolyzes phosphatidylinositol and phosphatidylserine and displays transacylase activity in vitro |
|
| YER003C | 1.81 |
PMI40
|
Mannose-6-phosphate isomerase, catalyzes the interconversion of fructose-6-P and mannose-6-P; required for early steps in protein mannosylation |
|
| YLR154W-C | 1.80 |
TAR1
|
Mitochondrial protein of unknown function, overexpression suppresses an rpo41 mutation affecting mitochondrial RNA polymerase; encoded within the 25S rRNA gene on the opposite strand |
|
| YPR053C | 1.80 |
Dubious open reading frame unlikely to encode a protein, based on available experimental and comparative sequence data; partially overlaps verified gene NHP6A/YPR052C |
||
| YMR177W | 1.79 |
MMT1
|
Putative metal transporter involved in mitochondrial iron accumulation; closely related to Mmt2p |
|
| YDR091C | 1.79 |
RLI1
|
Essential iron-sulfur protein required for ribosome biogenesis and translation initiation; facilitates binding of a multifactor complex (MFC) of translation initiation factors to the small ribosomal subunit; predicted ABC family ATPase |
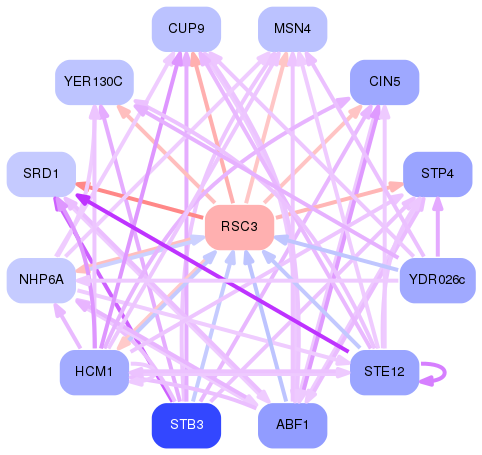
Network of associatons between targets according to the STRING database.

First level regulatory network of RSC3
Gene Ontology Analysis
Gene overrepresentation in biological process category:
| Log-likelihood per target | Total log-likelihood | Term | Description |
|---|---|---|---|
| 3.3 | 9.9 | GO:0019673 | GDP-mannose biosynthetic process(GO:0009298) GDP-mannose metabolic process(GO:0019673) |
| 3.3 | 9.9 | GO:0051436 | negative regulation of ubiquitin-protein ligase activity involved in mitotic cell cycle(GO:0051436) regulation of ubiquitin-protein ligase activity involved in mitotic cell cycle(GO:0051439) negative regulation of ubiquitin protein ligase activity(GO:1904667) |
| 3.1 | 12.4 | GO:0035337 | fatty-acyl-CoA metabolic process(GO:0035337) |
| 2.1 | 8.4 | GO:0009423 | chorismate biosynthetic process(GO:0009423) |
| 2.0 | 19.9 | GO:0006116 | NADH oxidation(GO:0006116) |
| 1.9 | 5.8 | GO:2000877 | regulation of oligopeptide transport by regulation of transcription from RNA polymerase II promoter(GO:0035950) negative regulation of oligopeptide transport by negative regulation of transcription from RNA polymerase II promoter(GO:0035952) regulation of dipeptide transport by regulation of transcription from RNA polymerase II promoter(GO:0035953) negative regulation of dipeptide transport by negative regulation of transcription from RNA polymerase II promoter(GO:0035955) negative regulation of oligopeptide transport(GO:2000877) negative regulation of dipeptide transport(GO:2000879) |
| 1.9 | 5.8 | GO:0006183 | GTP biosynthetic process(GO:0006183) GTP metabolic process(GO:0046039) |
| 1.9 | 5.8 | GO:0030541 | plasmid partitioning(GO:0030541) |
| 1.8 | 5.4 | GO:0009186 | deoxyribonucleoside diphosphate metabolic process(GO:0009186) |
| 1.8 | 7.0 | GO:0098609 | agglutination involved in conjugation with cellular fusion(GO:0000752) agglutination involved in conjugation(GO:0000771) heterophilic cell-cell adhesion via plasma membrane cell adhesion molecules(GO:0007157) cell-cell adhesion(GO:0098609) adhesion between unicellular organisms(GO:0098610) multi organism cell adhesion(GO:0098740) cell-cell adhesion via plasma-membrane adhesion molecules(GO:0098742) |
| 1.7 | 5.2 | GO:0000098 | sulfur amino acid catabolic process(GO:0000098) |
| 1.7 | 11.8 | GO:0010696 | positive regulation of spindle pole body separation(GO:0010696) |
| 1.5 | 5.9 | GO:0000296 | spermine transport(GO:0000296) |
| 1.4 | 9.5 | GO:0043137 | DNA replication, removal of RNA primer(GO:0043137) |
| 1.3 | 24.0 | GO:0006407 | rRNA export from nucleus(GO:0006407) rRNA transport(GO:0051029) |
| 1.3 | 2.6 | GO:0015909 | long-chain fatty acid transport(GO:0015909) |
| 1.3 | 6.4 | GO:0060277 | obsolete negative regulation of transcription involved in G1 phase of mitotic cell cycle(GO:0060277) |
| 1.3 | 8.9 | GO:0006782 | protoporphyrinogen IX biosynthetic process(GO:0006782) protoporphyrinogen IX metabolic process(GO:0046501) |
| 1.3 | 8.8 | GO:0034729 | histone H3-K79 methylation(GO:0034729) |
| 1.2 | 3.6 | GO:0018216 | peptidyl-arginine modification(GO:0018195) peptidyl-arginine methylation(GO:0018216) |
| 1.1 | 3.3 | GO:0051083 | 'de novo' cotranslational protein folding(GO:0051083) |
| 1.0 | 5.2 | GO:0070911 | global genome nucleotide-excision repair(GO:0070911) |
| 1.0 | 3.8 | GO:0090337 | regulation of formin-nucleated actin cable assembly(GO:0090337) positive regulation of formin-nucleated actin cable assembly(GO:0090338) |
| 1.0 | 4.8 | GO:0044070 | regulation of anion transport(GO:0044070) |
| 0.9 | 3.7 | GO:0031590 | wybutosine metabolic process(GO:0031590) wybutosine biosynthetic process(GO:0031591) |
| 0.9 | 2.8 | GO:0019419 | sulfate assimilation, phosphoadenylyl sulfate reduction by phosphoadenylyl-sulfate reductase (thioredoxin)(GO:0019379) sulfate reduction(GO:0019419) |
| 0.9 | 3.6 | GO:0031565 | obsolete cytokinesis checkpoint(GO:0031565) |
| 0.9 | 2.6 | GO:0009221 | deoxyribonucleoside monophosphate biosynthetic process(GO:0009157) deoxyribonucleoside monophosphate metabolic process(GO:0009162) pyrimidine deoxyribonucleoside monophosphate metabolic process(GO:0009176) pyrimidine deoxyribonucleoside monophosphate biosynthetic process(GO:0009177) pyrimidine deoxyribonucleotide metabolic process(GO:0009219) pyrimidine deoxyribonucleotide biosynthetic process(GO:0009221) 2'-deoxyribonucleotide biosynthetic process(GO:0009265) 2'-deoxyribonucleotide metabolic process(GO:0009394) deoxyribose phosphate biosynthetic process(GO:0046385) |
| 0.8 | 4.2 | GO:0051597 | response to methylmercury(GO:0051597) cellular response to methylmercury(GO:0071406) |
| 0.8 | 1.6 | GO:0061422 | positive regulation of transcription from RNA polymerase II promoter in response to alkaline pH(GO:0061422) |
| 0.8 | 2.4 | GO:0019401 | glycerol biosynthetic process(GO:0006114) alditol biosynthetic process(GO:0019401) |
| 0.8 | 3.9 | GO:0045903 | positive regulation of translational fidelity(GO:0045903) |
| 0.8 | 2.3 | GO:0046901 | tetrahydrofolylpolyglutamate metabolic process(GO:0046900) tetrahydrofolylpolyglutamate biosynthetic process(GO:0046901) |
| 0.8 | 1.5 | GO:0001676 | long-chain fatty acid metabolic process(GO:0001676) |
| 0.7 | 10.5 | GO:0006450 | regulation of translational fidelity(GO:0006450) |
| 0.7 | 4.5 | GO:0007119 | budding cell isotropic bud growth(GO:0007119) |
| 0.7 | 2.2 | GO:0019676 | ammonia assimilation cycle(GO:0019676) |
| 0.7 | 10.3 | GO:0000028 | ribosomal small subunit assembly(GO:0000028) |
| 0.7 | 5.9 | GO:0016559 | peroxisome fission(GO:0016559) |
| 0.7 | 6.4 | GO:0042219 | cellular modified amino acid catabolic process(GO:0042219) |
| 0.7 | 89.0 | GO:0002181 | cytoplasmic translation(GO:0002181) |
| 0.7 | 6.2 | GO:0006268 | DNA unwinding involved in DNA replication(GO:0006268) |
| 0.7 | 2.7 | GO:0070070 | proton-transporting V-type ATPase complex assembly(GO:0070070) vacuolar proton-transporting V-type ATPase complex assembly(GO:0070072) |
| 0.7 | 7.9 | GO:0000921 | septin ring assembly(GO:0000921) |
| 0.7 | 2.6 | GO:0019357 | nicotinate nucleotide biosynthetic process(GO:0019357) nicotinate nucleotide salvage(GO:0019358) pyridine nucleotide salvage(GO:0019365) nicotinate nucleotide metabolic process(GO:0046497) |
| 0.6 | 1.9 | GO:0044209 | AMP salvage(GO:0044209) |
| 0.6 | 2.5 | GO:0031204 | posttranslational protein targeting to membrane, translocation(GO:0031204) |
| 0.6 | 2.5 | GO:0009240 | isopentenyl diphosphate biosynthetic process(GO:0009240) isopentenyl diphosphate biosynthetic process, mevalonate pathway(GO:0019287) isopentenyl diphosphate metabolic process(GO:0046490) |
| 0.6 | 1.8 | GO:1900101 | regulation of endoplasmic reticulum unfolded protein response(GO:1900101) |
| 0.6 | 1.8 | GO:0000348 | mRNA branch site recognition(GO:0000348) |
| 0.6 | 4.1 | GO:0009098 | leucine biosynthetic process(GO:0009098) |
| 0.5 | 1.6 | GO:0043171 | peptide catabolic process(GO:0043171) |
| 0.5 | 15.2 | GO:0046939 | nucleotide phosphorylation(GO:0046939) |
| 0.5 | 3.0 | GO:0048255 | RNA stabilization(GO:0043489) mRNA stabilization(GO:0048255) |
| 0.5 | 1.5 | GO:0042538 | hyperosmotic salinity response(GO:0042538) |
| 0.5 | 4.4 | GO:0045039 | protein import into mitochondrial inner membrane(GO:0045039) |
| 0.5 | 1.9 | GO:0030497 | fatty acid elongation(GO:0030497) |
| 0.5 | 2.4 | GO:0070941 | eisosome assembly(GO:0070941) |
| 0.5 | 1.4 | GO:0030037 | actin filament reorganization involved in cell cycle(GO:0030037) actin filament reorganization(GO:0090527) |
| 0.5 | 0.5 | GO:0070189 | kynurenine metabolic process(GO:0070189) |
| 0.5 | 11.3 | GO:0002098 | tRNA wobble base modification(GO:0002097) tRNA wobble uridine modification(GO:0002098) |
| 0.4 | 7.2 | GO:0036388 | pre-replicative complex assembly involved in nuclear cell cycle DNA replication(GO:0006267) pre-replicative complex assembly(GO:0036388) pre-replicative complex assembly involved in cell cycle DNA replication(GO:1902299) |
| 0.4 | 1.8 | GO:0070940 | dephosphorylation of RNA polymerase II C-terminal domain(GO:0070940) |
| 0.4 | 4.6 | GO:0007109 | obsolete cytokinesis, completion of separation(GO:0007109) |
| 0.4 | 2.4 | GO:0006491 | N-glycan processing(GO:0006491) |
| 0.4 | 1.2 | GO:1900434 | filamentous growth of a population of unicellular organisms in response to starvation(GO:0036170) regulation of filamentous growth of a population of unicellular organisms in response to starvation(GO:1900434) positive regulation of filamentous growth of a population of unicellular organisms in response to starvation(GO:1900436) |
| 0.4 | 2.3 | GO:0070898 | RNA polymerase III transcriptional preinitiation complex assembly(GO:0070898) |
| 0.4 | 1.9 | GO:0046219 | tryptophan biosynthetic process(GO:0000162) indole-containing compound biosynthetic process(GO:0042435) indolalkylamine biosynthetic process(GO:0046219) |
| 0.4 | 1.9 | GO:0072668 | obsolete tubulin complex biogenesis(GO:0072668) |
| 0.4 | 1.8 | GO:0006673 | inositolphosphoceramide metabolic process(GO:0006673) |
| 0.4 | 3.5 | GO:0006817 | phosphate ion transport(GO:0006817) |
| 0.4 | 1.1 | GO:0046416 | D-amino acid metabolic process(GO:0046416) |
| 0.3 | 7.8 | GO:0006885 | regulation of pH(GO:0006885) |
| 0.3 | 1.3 | GO:0009099 | valine biosynthetic process(GO:0009099) |
| 0.3 | 1.0 | GO:0051320 | mitotic S phase(GO:0000084) S phase(GO:0051320) |
| 0.3 | 0.6 | GO:0031384 | regulation of initiation of mating projection growth(GO:0031384) |
| 0.3 | 3.6 | GO:0007120 | axial cellular bud site selection(GO:0007120) |
| 0.3 | 1.5 | GO:0045722 | positive regulation of gluconeogenesis(GO:0045722) |
| 0.3 | 1.7 | GO:0043666 | regulation of phosphoprotein phosphatase activity(GO:0043666) |
| 0.3 | 5.4 | GO:0006614 | cotranslational protein targeting to membrane(GO:0006613) SRP-dependent cotranslational protein targeting to membrane(GO:0006614) |
| 0.3 | 1.7 | GO:0001009 | transcription from RNA polymerase III type 2 promoter(GO:0001009) transcription from a RNA polymerase III hybrid type promoter(GO:0001041) |
| 0.3 | 0.8 | GO:0090153 | regulation of sphingolipid biosynthetic process(GO:0090153) negative regulation of sphingolipid biosynthetic process(GO:0090155) regulation of membrane lipid metabolic process(GO:1905038) |
| 0.3 | 2.2 | GO:0033014 | porphyrin-containing compound biosynthetic process(GO:0006779) heme biosynthetic process(GO:0006783) tetrapyrrole biosynthetic process(GO:0033014) |
| 0.3 | 1.3 | GO:0006972 | hyperosmotic response(GO:0006972) |
| 0.3 | 0.8 | GO:1901985 | positive regulation of histone acetylation(GO:0035066) positive regulation of protein acetylation(GO:1901985) positive regulation of peptidyl-lysine acetylation(GO:2000758) |
| 0.3 | 1.1 | GO:0015680 | intracellular copper ion transport(GO:0015680) |
| 0.3 | 0.8 | GO:0015691 | cadmium ion transport(GO:0015691) |
| 0.3 | 0.8 | GO:0006624 | vacuolar protein processing(GO:0006624) |
| 0.3 | 2.6 | GO:0006547 | histidine biosynthetic process(GO:0000105) histidine metabolic process(GO:0006547) imidazole-containing compound metabolic process(GO:0052803) |
| 0.3 | 0.8 | GO:0010674 | negative regulation of transcription from RNA polymerase II promoter involved in meiotic cell cycle(GO:0010674) |
| 0.3 | 0.3 | GO:0071478 | cellular response to radiation(GO:0071478) cellular response to light stimulus(GO:0071482) |
| 0.3 | 1.0 | GO:1902931 | negative regulation of alcohol biosynthetic process(GO:1902931) |
| 0.2 | 0.7 | GO:0046495 | nicotinamide riboside metabolic process(GO:0046495) pyridine nucleoside metabolic process(GO:0070637) |
| 0.2 | 0.7 | GO:0023021 | termination of signal transduction(GO:0023021) termination of G-protein coupled receptor signaling pathway(GO:0038032) |
| 0.2 | 2.6 | GO:0015833 | peptide transport(GO:0015833) |
| 0.2 | 0.9 | GO:0006285 | base-excision repair, AP site formation(GO:0006285) |
| 0.2 | 1.3 | GO:0032508 | DNA duplex unwinding(GO:0032508) |
| 0.2 | 0.6 | GO:0006384 | transcription initiation from RNA polymerase III promoter(GO:0006384) |
| 0.2 | 0.8 | GO:0001927 | exocyst assembly(GO:0001927) |
| 0.2 | 0.8 | GO:0018196 | peptidyl-asparagine modification(GO:0018196) protein N-linked glycosylation via asparagine(GO:0018279) |
| 0.2 | 1.0 | GO:0035268 | protein mannosylation(GO:0035268) protein O-linked mannosylation(GO:0035269) mannosylation(GO:0097502) |
| 0.2 | 0.8 | GO:1900461 | positive regulation of cell growth(GO:0030307) positive regulation of pseudohyphal growth by positive regulation of transcription from RNA polymerase II promoter(GO:1900461) positive regulation of pseudohyphal growth(GO:2000222) |
| 0.2 | 1.5 | GO:0048017 | inositol lipid-mediated signaling(GO:0048017) |
| 0.2 | 2.6 | GO:0030488 | tRNA methylation(GO:0030488) |
| 0.2 | 3.7 | GO:0006334 | nucleosome assembly(GO:0006334) |
| 0.2 | 1.1 | GO:0043555 | regulation of translation in response to stress(GO:0043555) |
| 0.2 | 0.4 | GO:0043068 | positive regulation of cell death(GO:0010942) positive regulation of apoptotic process(GO:0043065) positive regulation of programmed cell death(GO:0043068) |
| 0.2 | 2.5 | GO:0031110 | regulation of microtubule polymerization or depolymerization(GO:0031110) |
| 0.2 | 1.2 | GO:0001402 | signal transduction involved in filamentous growth(GO:0001402) |
| 0.2 | 1.1 | GO:0044205 | 'de novo' pyrimidine nucleobase biosynthetic process(GO:0006207) 'de novo' UMP biosynthetic process(GO:0044205) |
| 0.2 | 0.5 | GO:0030308 | negative regulation of cell growth(GO:0030308) negative regulation of pseudohyphal growth(GO:2000221) |
| 0.2 | 0.3 | GO:1901352 | regulation of phosphatidylglycerol biosynthetic process(GO:1901351) negative regulation of phosphatidylglycerol biosynthetic process(GO:1901352) |
| 0.2 | 1.7 | GO:0000056 | ribosomal small subunit export from nucleus(GO:0000056) |
| 0.2 | 0.7 | GO:0042990 | regulation of transcription factor import into nucleus(GO:0042990) |
| 0.2 | 0.5 | GO:0046473 | phosphatidic acid biosynthetic process(GO:0006654) phosphatidic acid metabolic process(GO:0046473) |
| 0.2 | 1.5 | GO:0032889 | regulation of vacuole fusion, non-autophagic(GO:0032889) regulation of vacuole organization(GO:0044088) |
| 0.2 | 1.3 | GO:0015891 | siderophore transport(GO:0015891) |
| 0.2 | 2.1 | GO:0019682 | pentose-phosphate shunt(GO:0006098) glyceraldehyde-3-phosphate metabolic process(GO:0019682) |
| 0.2 | 29.1 | GO:0006364 | rRNA processing(GO:0006364) |
| 0.2 | 1.1 | GO:0007323 | peptide pheromone maturation(GO:0007323) |
| 0.2 | 3.0 | GO:0006633 | fatty acid biosynthetic process(GO:0006633) |
| 0.2 | 0.8 | GO:0015780 | nucleotide-sugar transport(GO:0015780) |
| 0.2 | 3.0 | GO:0007096 | regulation of exit from mitosis(GO:0007096) |
| 0.2 | 1.4 | GO:0032120 | ascospore-type prospore membrane assembly(GO:0032120) membrane biogenesis(GO:0044091) membrane assembly(GO:0071709) |
| 0.2 | 0.5 | GO:2000220 | regulation of pseudohyphal growth(GO:2000220) |
| 0.2 | 2.1 | GO:0042797 | tRNA transcription(GO:0009304) tRNA transcription from RNA polymerase III promoter(GO:0042797) |
| 0.1 | 0.6 | GO:0034501 | protein localization to kinetochore(GO:0034501) |
| 0.1 | 0.9 | GO:0006362 | transcription elongation from RNA polymerase I promoter(GO:0006362) |
| 0.1 | 3.5 | GO:0000079 | regulation of cyclin-dependent protein serine/threonine kinase activity(GO:0000079) regulation of cyclin-dependent protein kinase activity(GO:1904029) |
| 0.1 | 0.9 | GO:0000290 | deadenylation-dependent decapping of nuclear-transcribed mRNA(GO:0000290) |
| 0.1 | 1.5 | GO:0007009 | plasma membrane organization(GO:0007009) |
| 0.1 | 0.5 | GO:0032958 | inositol phosphate biosynthetic process(GO:0032958) |
| 0.1 | 3.0 | GO:0006879 | cellular iron ion homeostasis(GO:0006879) |
| 0.1 | 1.8 | GO:0009636 | response to toxic substance(GO:0009636) |
| 0.1 | 0.3 | GO:0009847 | spore germination(GO:0009847) |
| 0.1 | 0.5 | GO:0070588 | calcium ion transmembrane transport(GO:0070588) |
| 0.1 | 1.3 | GO:0016075 | rRNA catabolic process(GO:0016075) |
| 0.1 | 0.5 | GO:0015883 | FAD transport(GO:0015883) |
| 0.1 | 0.2 | GO:0034030 | coenzyme A biosynthetic process(GO:0015937) nucleoside bisphosphate biosynthetic process(GO:0033866) ribonucleoside bisphosphate biosynthetic process(GO:0034030) purine nucleoside bisphosphate biosynthetic process(GO:0034033) |
| 0.1 | 0.6 | GO:0007021 | tubulin complex assembly(GO:0007021) |
| 0.1 | 1.1 | GO:0006283 | transcription-coupled nucleotide-excision repair(GO:0006283) |
| 0.1 | 2.8 | GO:0006487 | protein N-linked glycosylation(GO:0006487) |
| 0.1 | 0.3 | GO:0007050 | cell cycle arrest(GO:0007050) |
| 0.1 | 3.1 | GO:0006418 | tRNA aminoacylation for protein translation(GO:0006418) |
| 0.1 | 1.8 | GO:0046785 | microtubule nucleation(GO:0007020) microtubule polymerization(GO:0046785) |
| 0.1 | 1.8 | GO:0006999 | nuclear pore organization(GO:0006999) |
| 0.1 | 0.1 | GO:0010921 | regulation of phosphatase activity(GO:0010921) |
| 0.1 | 1.0 | GO:0006272 | leading strand elongation(GO:0006272) |
| 0.1 | 0.4 | GO:0006596 | polyamine biosynthetic process(GO:0006596) |
| 0.1 | 1.7 | GO:0043094 | cellular metabolic compound salvage(GO:0043094) |
| 0.1 | 0.2 | GO:0006269 | DNA replication, synthesis of RNA primer(GO:0006269) |
| 0.1 | 0.3 | GO:0015740 | C4-dicarboxylate transport(GO:0015740) |
| 0.1 | 0.7 | GO:0045053 | protein retention in Golgi apparatus(GO:0045053) |
| 0.1 | 0.3 | GO:1903313 | negative regulation of translational initiation(GO:0045947) positive regulation of mRNA metabolic process(GO:1903313) |
| 0.1 | 1.2 | GO:0042790 | transcription of nuclear large rRNA transcript from RNA polymerase I promoter(GO:0042790) |
| 0.1 | 3.0 | GO:0007124 | pseudohyphal growth(GO:0007124) |
| 0.1 | 1.4 | GO:0030148 | sphingolipid biosynthetic process(GO:0030148) |
| 0.1 | 1.9 | GO:0042147 | retrograde transport, endosome to Golgi(GO:0042147) |
| 0.1 | 0.2 | GO:0071462 | response to water(GO:0009415) cellular response to water stimulus(GO:0071462) |
| 0.1 | 0.5 | GO:0051090 | regulation of sequence-specific DNA binding transcription factor activity(GO:0051090) |
| 0.1 | 0.4 | GO:0009306 | protein secretion(GO:0009306) |
| 0.1 | 0.3 | GO:0018344 | protein geranylgeranylation(GO:0018344) |
| 0.1 | 0.4 | GO:0036297 | interstrand cross-link repair(GO:0036297) |
| 0.1 | 1.4 | GO:0098876 | Golgi to plasma membrane transport(GO:0006893) vesicle-mediated transport to the plasma membrane(GO:0098876) |
| 0.1 | 0.5 | GO:0018345 | protein palmitoylation(GO:0018345) |
| 0.1 | 1.6 | GO:0006890 | retrograde vesicle-mediated transport, Golgi to ER(GO:0006890) |
| 0.1 | 5.7 | GO:0032543 | mitochondrial translation(GO:0032543) |
| 0.1 | 0.2 | GO:0046341 | CDP-diacylglycerol biosynthetic process(GO:0016024) CDP-diacylglycerol metabolic process(GO:0046341) |
| 0.1 | 0.1 | GO:0031684 | heterotrimeric G-protein complex cycle(GO:0031684) |
| 0.1 | 0.4 | GO:0030011 | maintenance of cell polarity(GO:0030011) |
| 0.1 | 0.4 | GO:0006490 | oligosaccharide-lipid intermediate biosynthetic process(GO:0006490) |
| 0.1 | 0.7 | GO:0000055 | ribosomal large subunit export from nucleus(GO:0000055) |
| 0.0 | 0.2 | GO:0032988 | spliceosomal complex disassembly(GO:0000390) ribonucleoprotein complex disassembly(GO:0032988) |
| 0.0 | 0.6 | GO:0016925 | protein sumoylation(GO:0016925) |
| 0.0 | 0.9 | GO:0030150 | protein import into mitochondrial matrix(GO:0030150) |
| 0.0 | 0.1 | GO:0006086 | acetyl-CoA biosynthetic process from pyruvate(GO:0006086) |
| 0.0 | 0.1 | GO:0035459 | cargo loading into vesicle(GO:0035459) cargo loading into COPII-coated vesicle(GO:0090110) |
| 0.0 | 1.0 | GO:0006400 | tRNA modification(GO:0006400) |
| 0.0 | 0.2 | GO:0022615 | protein import into peroxisome matrix, docking(GO:0016560) protein to membrane docking(GO:0022615) |
| 0.0 | 0.2 | GO:0090158 | regulation of phosphatidylinositol dephosphorylation(GO:0060304) endoplasmic reticulum membrane organization(GO:0090158) |
| 0.0 | 0.1 | GO:0019405 | alditol catabolic process(GO:0019405) glycerol catabolic process(GO:0019563) |
| 0.0 | 0.1 | GO:0034402 | recruitment of 3'-end processing factors to RNA polymerase II holoenzyme complex(GO:0034402) positive regulation of translational initiation(GO:0045948) |
| 0.0 | 0.4 | GO:0031498 | nucleosome disassembly(GO:0006337) chromatin disassembly(GO:0031498) protein-DNA complex disassembly(GO:0032986) |
| 0.0 | 0.3 | GO:0051495 | positive regulation of cytoskeleton organization(GO:0051495) |
| 0.0 | 0.1 | GO:0032781 | positive regulation of ATPase activity(GO:0032781) |
| 0.0 | 0.0 | GO:1903530 | regulation of exocytosis(GO:0017157) regulation of secretion(GO:0051046) regulation of secretion by cell(GO:1903530) |
| 0.0 | 0.4 | GO:0042144 | vacuole fusion, non-autophagic(GO:0042144) |
| 0.0 | 0.2 | GO:0006388 | tRNA splicing, via endonucleolytic cleavage and ligation(GO:0006388) |
| 0.0 | 0.4 | GO:0042273 | ribosomal large subunit biogenesis(GO:0042273) |
| 0.0 | 0.0 | GO:0010978 | gene silencing involved in chronological cell aging(GO:0010978) gene silencing by RNA(GO:0031047) |
| 0.0 | 0.2 | GO:0006515 | misfolded or incompletely synthesized protein catabolic process(GO:0006515) |
| 0.0 | 0.1 | GO:0070816 | phosphorylation of RNA polymerase II C-terminal domain(GO:0070816) |
| 0.0 | 0.1 | GO:0015677 | copper ion import(GO:0015677) |
| 0.0 | 0.1 | GO:0016574 | histone ubiquitination(GO:0016574) |
| 0.0 | 0.1 | GO:0006665 | sphingolipid metabolic process(GO:0006665) |
| 0.0 | 0.1 | GO:0000917 | barrier septum assembly(GO:0000917) cell septum assembly(GO:0090529) |
| 0.0 | 0.2 | GO:0006891 | intra-Golgi vesicle-mediated transport(GO:0006891) |
Gene overrepresentation in cellular component category:
| Log-likelihood per target | Total log-likelihood | Term | Description |
|---|---|---|---|
| 2.5 | 7.6 | GO:0009331 | glycerol-3-phosphate dehydrogenase complex(GO:0009331) |
| 2.3 | 6.8 | GO:0032299 | ribonuclease H2 complex(GO:0032299) |
| 2.0 | 6.0 | GO:0071261 | Ssh1 translocon complex(GO:0071261) |
| 1.7 | 5.0 | GO:0030428 | cell septum(GO:0030428) |
| 1.6 | 4.9 | GO:0097344 | Rix1 complex(GO:0097344) |
| 1.5 | 4.4 | GO:0042719 | mitochondrial intermembrane space protein transporter complex(GO:0042719) |
| 1.4 | 16.3 | GO:0000788 | nuclear nucleosome(GO:0000788) |
| 1.3 | 5.4 | GO:0005971 | ribonucleoside-diphosphate reductase complex(GO:0005971) |
| 1.1 | 3.3 | GO:0005854 | nascent polypeptide-associated complex(GO:0005854) |
| 1.1 | 2.2 | GO:0000786 | nucleosome(GO:0000786) |
| 1.1 | 65.2 | GO:0022627 | cytosolic small ribosomal subunit(GO:0022627) |
| 1.0 | 4.2 | GO:0030907 | MBF transcription complex(GO:0030907) |
| 1.0 | 2.9 | GO:0046930 | pore complex(GO:0046930) |
| 1.0 | 5.8 | GO:0005871 | kinesin complex(GO:0005871) |
| 0.9 | 2.8 | GO:0043625 | delta DNA polymerase complex(GO:0043625) |
| 0.9 | 5.5 | GO:0042555 | MCM complex(GO:0042555) |
| 0.8 | 3.3 | GO:0032160 | septin filament array(GO:0032160) |
| 0.8 | 2.5 | GO:0032301 | MutSalpha complex(GO:0032301) |
| 0.8 | 68.7 | GO:0022625 | cytosolic large ribosomal subunit(GO:0022625) |
| 0.7 | 3.7 | GO:0030478 | actin cap(GO:0030478) |
| 0.7 | 2.9 | GO:0031518 | CBF3 complex(GO:0031518) |
| 0.7 | 2.7 | GO:0044462 | cell wall part(GO:0044426) external encapsulating structure part(GO:0044462) |
| 0.6 | 5.1 | GO:0005688 | U6 snRNP(GO:0005688) |
| 0.6 | 1.8 | GO:0070545 | PeBoW complex(GO:0070545) |
| 0.6 | 10.0 | GO:0000307 | cyclin-dependent protein kinase holoenzyme complex(GO:0000307) |
| 0.6 | 2.3 | GO:0005793 | endoplasmic reticulum-Golgi intermediate compartment(GO:0005793) |
| 0.6 | 4.0 | GO:0032432 | actin filament bundle(GO:0032432) |
| 0.5 | 1.6 | GO:0000015 | phosphopyruvate hydratase complex(GO:0000015) |
| 0.5 | 5.3 | GO:0032161 | cellular bud neck septin structure(GO:0000399) cleavage apparatus septin structure(GO:0032161) |
| 0.5 | 2.0 | GO:0005946 | alpha,alpha-trehalose-phosphate synthase complex (UDP-forming)(GO:0005946) |
| 0.5 | 6.4 | GO:0031231 | integral component of peroxisomal membrane(GO:0005779) intrinsic component of peroxisomal membrane(GO:0031231) |
| 0.4 | 2.4 | GO:0017059 | serine C-palmitoyltransferase complex(GO:0017059) SPOTS complex(GO:0035339) |
| 0.4 | 1.9 | GO:0030689 | Noc complex(GO:0030689) |
| 0.4 | 1.5 | GO:0030906 | retromer, cargo-selective complex(GO:0030906) |
| 0.4 | 1.1 | GO:0005662 | DNA replication factor A complex(GO:0005662) |
| 0.4 | 2.2 | GO:0032126 | eisosome(GO:0032126) |
| 0.4 | 2.5 | GO:0072686 | mitotic spindle(GO:0072686) |
| 0.4 | 1.8 | GO:0005641 | nuclear envelope lumen(GO:0005641) |
| 0.4 | 3.9 | GO:0000243 | commitment complex(GO:0000243) |
| 0.3 | 1.4 | GO:0000938 | GARP complex(GO:0000938) |
| 0.3 | 1.4 | GO:0031428 | box C/D snoRNP complex(GO:0031428) |
| 0.3 | 4.2 | GO:0019005 | SCF ubiquitin ligase complex(GO:0019005) |
| 0.3 | 0.9 | GO:0034518 | mRNA cap binding complex(GO:0005845) RNA cap binding complex(GO:0034518) |
| 0.3 | 1.7 | GO:0000127 | transcription factor TFIIIC complex(GO:0000127) |
| 0.3 | 0.8 | GO:0000814 | ESCRT II complex(GO:0000814) |
| 0.3 | 9.5 | GO:0005811 | lipid particle(GO:0005811) |
| 0.2 | 0.5 | GO:0044453 | nuclear membrane part(GO:0044453) |
| 0.2 | 16.9 | GO:0005576 | extracellular region(GO:0005576) |
| 0.2 | 1.2 | GO:0031262 | Ndc80 complex(GO:0031262) |
| 0.2 | 2.8 | GO:0005637 | nuclear inner membrane(GO:0005637) |
| 0.2 | 1.0 | GO:0032545 | CURI complex(GO:0032545) |
| 0.2 | 1.7 | GO:0030008 | TRAPP complex(GO:0030008) |
| 0.2 | 0.8 | GO:0005797 | Golgi medial cisterna(GO:0005797) |
| 0.2 | 0.6 | GO:0070985 | TFIIK complex(GO:0070985) |
| 0.2 | 1.0 | GO:0031389 | DNA replication factor C complex(GO:0005663) Rad17 RFC-like complex(GO:0031389) Elg1 RFC-like complex(GO:0031391) |
| 0.2 | 0.8 | GO:0005940 | septin ring(GO:0005940) |
| 0.2 | 1.5 | GO:0008250 | oligosaccharyltransferase complex(GO:0008250) |
| 0.2 | 1.3 | GO:0005697 | telomerase holoenzyme complex(GO:0005697) |
| 0.2 | 0.7 | GO:0005967 | mitochondrial pyruvate dehydrogenase complex(GO:0005967) pyruvate dehydrogenase complex(GO:0045254) |
| 0.2 | 1.3 | GO:0034455 | t-UTP complex(GO:0034455) |
| 0.2 | 5.7 | GO:0015935 | small ribosomal subunit(GO:0015935) |
| 0.2 | 0.9 | GO:0000500 | RNA polymerase I upstream activating factor complex(GO:0000500) |
| 0.2 | 1.2 | GO:0000346 | transcription export complex(GO:0000346) |
| 0.2 | 2.7 | GO:0005666 | DNA-directed RNA polymerase III complex(GO:0005666) |
| 0.2 | 2.5 | GO:0005788 | endoplasmic reticulum lumen(GO:0005788) |
| 0.1 | 0.4 | GO:0000229 | cytoplasmic chromosome(GO:0000229) mitochondrial chromosome(GO:0000262) |
| 0.1 | 6.2 | GO:0030686 | 90S preribosome(GO:0030686) |
| 0.1 | 0.9 | GO:0005736 | DNA-directed RNA polymerase I complex(GO:0005736) |
| 0.1 | 0.8 | GO:0034045 | pre-autophagosomal structure membrane(GO:0034045) |
| 0.1 | 1.8 | GO:0034399 | nuclear periphery(GO:0034399) |
| 0.1 | 0.4 | GO:0000930 | gamma-tubulin small complex, spindle pole body(GO:0000928) gamma-tubulin complex(GO:0000930) gamma-tubulin small complex(GO:0008275) |
| 0.1 | 1.3 | GO:0008540 | proteasome regulatory particle, base subcomplex(GO:0008540) |
| 0.1 | 0.9 | GO:0000145 | exocyst(GO:0000145) |
| 0.1 | 0.8 | GO:0005671 | Ada2/Gcn5/Ada3 transcription activator complex(GO:0005671) |
| 0.1 | 0.3 | GO:0000120 | RNA polymerase I transcription factor complex(GO:0000120) |
| 0.1 | 1.0 | GO:0000137 | Golgi cis cisterna(GO:0000137) |
| 0.1 | 0.4 | GO:0033254 | vacuolar transporter chaperone complex(GO:0033254) |
| 0.1 | 1.3 | GO:0090544 | SWI/SNF complex(GO:0016514) BAF-type complex(GO:0090544) |
| 0.1 | 1.2 | GO:0031225 | anchored component of membrane(GO:0031225) |
| 0.1 | 0.7 | GO:0033180 | vacuolar proton-transporting V-type ATPase, V1 domain(GO:0000221) proton-transporting V-type ATPase, V1 domain(GO:0033180) |
| 0.1 | 0.5 | GO:0005853 | eukaryotic translation elongation factor 1 complex(GO:0005853) |
| 0.1 | 3.4 | GO:0030134 | ER to Golgi transport vesicle(GO:0030134) |
| 0.1 | 12.9 | GO:0005933 | cellular bud(GO:0005933) |
| 0.1 | 0.1 | GO:0070762 | nuclear pore transmembrane ring(GO:0070762) |
| 0.1 | 0.3 | GO:0032116 | SMC loading complex(GO:0032116) |
| 0.1 | 0.3 | GO:0031502 | dolichyl-phosphate-mannose-protein mannosyltransferase complex(GO:0031502) |
| 0.1 | 0.9 | GO:0005744 | mitochondrial inner membrane presequence translocase complex(GO:0005744) |
| 0.1 | 0.4 | GO:0019773 | proteasome core complex, alpha-subunit complex(GO:0019773) |
| 0.1 | 0.3 | GO:0031080 | nuclear pore outer ring(GO:0031080) |
| 0.1 | 1.2 | GO:0000784 | nuclear chromosome, telomeric region(GO:0000784) |
| 0.1 | 0.2 | GO:0042788 | polysomal ribosome(GO:0042788) |
| 0.1 | 2.7 | GO:0031965 | nuclear membrane(GO:0031965) |
| 0.1 | 0.2 | GO:0017053 | transcriptional repressor complex(GO:0017053) |
| 0.0 | 0.3 | GO:0032045 | guanyl-nucleotide exchange factor complex(GO:0032045) |
| 0.0 | 0.4 | GO:0031228 | integral component of Golgi membrane(GO:0030173) intrinsic component of Golgi membrane(GO:0031228) |
| 0.0 | 0.9 | GO:0005887 | integral component of plasma membrane(GO:0005887) |
| 0.0 | 0.3 | GO:0005658 | alpha DNA polymerase:primase complex(GO:0005658) |
| 0.0 | 8.7 | GO:0005789 | endoplasmic reticulum membrane(GO:0005789) |
| 0.0 | 0.4 | GO:0032806 | carboxy-terminal domain protein kinase complex(GO:0032806) |
| 0.0 | 0.2 | GO:0016471 | vacuolar proton-transporting V-type ATPase complex(GO:0016471) proton-transporting V-type ATPase complex(GO:0033176) |
| 0.0 | 2.4 | GO:0005783 | endoplasmic reticulum(GO:0005783) |
| 0.0 | 0.3 | GO:0005885 | Arp2/3 protein complex(GO:0005885) |
| 0.0 | 0.7 | GO:0070847 | core mediator complex(GO:0070847) |
| 0.0 | 4.4 | GO:0005794 | Golgi apparatus(GO:0005794) |
| 0.0 | 0.1 | GO:0000811 | GINS complex(GO:0000811) |
| 0.0 | 0.6 | GO:0005844 | polysome(GO:0005844) |
| 0.0 | 0.1 | GO:0071008 | U2-type post-mRNA release spliceosomal complex(GO:0071008) |
| 0.0 | 0.9 | GO:0000315 | organellar large ribosomal subunit(GO:0000315) mitochondrial large ribosomal subunit(GO:0005762) |
| 0.0 | 0.5 | GO:0005635 | nuclear envelope(GO:0005635) |
| 0.0 | 0.0 | GO:0070823 | HDA1 complex(GO:0070823) |
| 0.0 | 1.8 | GO:0005730 | nucleolus(GO:0005730) |
| 0.0 | 0.6 | GO:0005840 | ribosome(GO:0005840) |
| 0.0 | 0.3 | GO:0000502 | proteasome complex(GO:0000502) |
| 0.0 | 0.1 | GO:0016586 | RSC complex(GO:0016586) |
Gene overrepresentation in molecular function category:
| Log-likelihood per target | Total log-likelihood | Term | Description |
|---|---|---|---|
| 3.3 | 9.9 | GO:0051219 | phosphoprotein binding(GO:0051219) |
| 2.8 | 8.4 | GO:0016838 | carbon-oxygen lyase activity, acting on phosphates(GO:0016838) |
| 2.7 | 8.1 | GO:0070568 | guanylyltransferase activity(GO:0070568) |
| 2.4 | 9.4 | GO:0004467 | long-chain fatty acid-CoA ligase activity(GO:0004467) |
| 2.1 | 6.4 | GO:0003938 | IMP dehydrogenase activity(GO:0003938) |
| 2.0 | 12.0 | GO:0004022 | alcohol dehydrogenase (NAD) activity(GO:0004022) |
| 1.9 | 5.8 | GO:0004619 | phosphoglycerate mutase activity(GO:0004619) |
| 1.7 | 6.8 | GO:0004523 | RNA-DNA hybrid ribonuclease activity(GO:0004523) |
| 1.5 | 5.9 | GO:0000297 | spermine transmembrane transporter activity(GO:0000297) |
| 1.4 | 5.5 | GO:0016634 | oxidoreductase activity, acting on the CH-CH group of donors, oxygen as acceptor(GO:0016634) |
| 1.3 | 5.4 | GO:0016725 | ribonucleoside-diphosphate reductase activity, thioredoxin disulfide as acceptor(GO:0004748) oxidoreductase activity, acting on CH or CH2 groups(GO:0016725) oxidoreductase activity, acting on CH or CH2 groups, disulfide as acceptor(GO:0016728) ribonucleoside-diphosphate reductase activity(GO:0061731) |
| 1.3 | 5.3 | GO:0009378 | four-way junction helicase activity(GO:0009378) |
| 1.3 | 4.0 | GO:0072341 | modified amino acid binding(GO:0072341) |
| 1.3 | 3.9 | GO:0015166 | polyol transmembrane transporter activity(GO:0015166) |
| 1.2 | 3.6 | GO:0016273 | arginine N-methyltransferase activity(GO:0016273) protein-arginine N-methyltransferase activity(GO:0016274) |
| 1.1 | 4.4 | GO:0016841 | ammonia-lyase activity(GO:0016841) |
| 1.0 | 3.1 | GO:0015440 | peptide-transporting ATPase activity(GO:0015440) |
| 1.0 | 2.9 | GO:0015288 | anion channel activity(GO:0005253) voltage-gated anion channel activity(GO:0008308) porin activity(GO:0015288) wide pore channel activity(GO:0022829) |
| 1.0 | 3.9 | GO:0070181 | small ribosomal subunit rRNA binding(GO:0070181) |
| 1.0 | 2.9 | GO:0004365 | glyceraldehyde-3-phosphate dehydrogenase (NAD+) (phosphorylating) activity(GO:0004365) glyceraldehyde-3-phosphate dehydrogenase (NAD(P)+) (phosphorylating) activity(GO:0043891) |
| 0.9 | 11.1 | GO:0005199 | structural constituent of cell wall(GO:0005199) |
| 0.9 | 9.1 | GO:0001133 | RNA polymerase II transcription factor activity, sequence-specific transcription regulatory region DNA binding(GO:0001133) |
| 0.9 | 9.1 | GO:0031386 | protein tag(GO:0031386) |
| 0.8 | 4.0 | GO:0017048 | Rho GTPase binding(GO:0017048) |
| 0.8 | 2.3 | GO:0004326 | tetrahydrofolylpolyglutamate synthase activity(GO:0004326) |
| 0.7 | 5.8 | GO:0003777 | microtubule motor activity(GO:0003777) |
| 0.7 | 2.8 | GO:0008310 | single-stranded DNA exodeoxyribonuclease activity(GO:0008297) single-stranded DNA 3'-5' exodeoxyribonuclease activity(GO:0008310) |
| 0.7 | 2.7 | GO:0015665 | alcohol transmembrane transporter activity(GO:0015665) |
| 0.7 | 2.0 | GO:0003825 | alpha,alpha-trehalose-phosphate synthase (UDP-forming) activity(GO:0003825) |
| 0.6 | 129.3 | GO:0003735 | structural constituent of ribosome(GO:0003735) |
| 0.6 | 1.9 | GO:0003841 | 1-acylglycerol-3-phosphate O-acyltransferase activity(GO:0003841) |
| 0.6 | 2.4 | GO:0016661 | oxidoreductase activity, acting on other nitrogenous compounds as donors(GO:0016661) |
| 0.6 | 18.6 | GO:0046982 | protein heterodimerization activity(GO:0046982) |
| 0.6 | 14.8 | GO:0016538 | cyclin-dependent protein serine/threonine kinase regulator activity(GO:0016538) |
| 0.6 | 2.2 | GO:0019206 | nucleoside kinase activity(GO:0019206) |
| 0.6 | 2.2 | GO:0016639 | oxidoreductase activity, acting on the CH-NH2 group of donors, NAD or NADP as acceptor(GO:0016639) |
| 0.5 | 1.6 | GO:0004634 | phosphopyruvate hydratase activity(GO:0004634) |
| 0.5 | 4.9 | GO:0005545 | 1-phosphatidylinositol binding(GO:0005545) |
| 0.5 | 4.2 | GO:0016861 | intramolecular oxidoreductase activity, interconverting aldoses and ketoses(GO:0016861) |
| 0.5 | 1.5 | GO:0009922 | fatty acid elongase activity(GO:0009922) |
| 0.5 | 3.0 | GO:0003993 | acid phosphatase activity(GO:0003993) |
| 0.5 | 1.9 | GO:0016886 | ligase activity, forming phosphoric ester bonds(GO:0016886) |
| 0.5 | 1.8 | GO:0036002 | pre-mRNA binding(GO:0036002) |
| 0.5 | 1.8 | GO:0004622 | lysophospholipase activity(GO:0004622) |
| 0.4 | 2.7 | GO:0016709 | oxidoreductase activity, acting on paired donors, with incorporation or reduction of molecular oxygen, NAD(P)H as one donor, and incorporation of one atom of oxygen(GO:0016709) |
| 0.4 | 1.3 | GO:0016671 | oxidoreductase activity, acting on a sulfur group of donors, disulfide as acceptor(GO:0016671) |
| 0.4 | 1.7 | GO:0008157 | protein phosphatase 1 binding(GO:0008157) |
| 0.4 | 1.2 | GO:0008251 | adenosine deaminase activity(GO:0004000) tRNA-specific adenosine deaminase activity(GO:0008251) |
| 0.4 | 2.4 | GO:0042123 | glucanosyltransferase activity(GO:0042123) 1,3-beta-glucanosyltransferase activity(GO:0042124) |
| 0.4 | 8.1 | GO:0015926 | glucosidase activity(GO:0015926) |
| 0.4 | 2.6 | GO:0016799 | hydrolase activity, hydrolyzing N-glycosyl compounds(GO:0016799) |
| 0.4 | 1.1 | GO:0004376 | glycolipid mannosyltransferase activity(GO:0004376) |
| 0.4 | 2.2 | GO:0000774 | adenyl-nucleotide exchange factor activity(GO:0000774) |
| 0.4 | 2.6 | GO:0005086 | ARF guanyl-nucleotide exchange factor activity(GO:0005086) |
| 0.4 | 2.6 | GO:0019237 | centromeric DNA binding(GO:0019237) |
| 0.4 | 2.1 | GO:0016846 | carbon-sulfur lyase activity(GO:0016846) |
| 0.3 | 2.1 | GO:0004169 | dolichyl-phosphate-mannose-protein mannosyltransferase activity(GO:0004169) |
| 0.3 | 10.1 | GO:0004722 | protein serine/threonine phosphatase activity(GO:0004722) |
| 0.3 | 1.7 | GO:0002161 | aminoacyl-tRNA editing activity(GO:0002161) |
| 0.3 | 2.3 | GO:0005216 | ion channel activity(GO:0005216) |
| 0.3 | 6.4 | GO:0042803 | protein homodimerization activity(GO:0042803) |
| 0.3 | 3.8 | GO:0070491 | repressing transcription factor binding(GO:0070491) |
| 0.3 | 3.8 | GO:0051015 | actin filament binding(GO:0051015) |
| 0.3 | 0.9 | GO:0000339 | RNA cap binding(GO:0000339) |
| 0.3 | 2.2 | GO:0019239 | deaminase activity(GO:0019239) |
| 0.3 | 1.6 | GO:0015173 | aromatic amino acid transmembrane transporter activity(GO:0015173) |
| 0.3 | 0.9 | GO:0008902 | hydroxymethylpyrimidine kinase activity(GO:0008902) phosphomethylpyrimidine kinase activity(GO:0008972) |
| 0.3 | 6.0 | GO:0008175 | tRNA methyltransferase activity(GO:0008175) |
| 0.3 | 1.8 | GO:0005516 | calmodulin binding(GO:0005516) |
| 0.3 | 1.5 | GO:0030943 | mitochondrion targeting sequence binding(GO:0030943) |
| 0.3 | 4.0 | GO:0001671 | ATPase activator activity(GO:0001671) |
| 0.3 | 1.7 | GO:0001004 | RNA polymerase III type 2 promoter sequence-specific DNA binding(GO:0001003) transcription factor activity, RNA polymerase III promoter sequence-specific binding, TFIIIB recruiting(GO:0001004) transcription factor activity, RNA polymerase III type 1 promoter sequence-specific binding, TFIIIB recruiting(GO:0001005) transcription factor activity, RNA polymerase III type 2 promoter sequence-specific binding, TFIIIB recruiting(GO:0001008) RNA polymerase III type 2 promoter DNA binding(GO:0001031) RNA polymerase III transcription factor activity, sequence-specific DNA binding(GO:0001034) |
| 0.3 | 2.2 | GO:1901681 | sulfur compound binding(GO:1901681) |
| 0.3 | 2.3 | GO:0005310 | dicarboxylic acid transmembrane transporter activity(GO:0005310) |
| 0.2 | 1.1 | GO:0004017 | adenylate kinase activity(GO:0004017) |
| 0.2 | 0.7 | GO:0016717 | oxidoreductase activity, acting on paired donors, with oxidation of a pair of donors resulting in the reduction of molecular oxygen to two molecules of water(GO:0016717) |
| 0.2 | 0.9 | GO:0001168 | transcription factor activity, RNA polymerase I upstream control element sequence-specific binding(GO:0001168) |
| 0.2 | 0.6 | GO:0016624 | pyruvate dehydrogenase activity(GO:0004738) oxidoreductase activity, acting on the aldehyde or oxo group of donors, disulfide as acceptor(GO:0016624) |
| 0.2 | 3.0 | GO:0015035 | protein disulfide oxidoreductase activity(GO:0015035) |
| 0.2 | 1.0 | GO:0000033 | alpha-1,3-mannosyltransferase activity(GO:0000033) |
| 0.2 | 0.6 | GO:0019901 | protein kinase binding(GO:0019901) |
| 0.2 | 0.6 | GO:0005519 | cytoskeletal regulatory protein binding(GO:0005519) |
| 0.2 | 0.6 | GO:0004488 | methylenetetrahydrofolate dehydrogenase (NADP+) activity(GO:0004488) |
| 0.2 | 1.5 | GO:0004579 | oligosaccharyl transferase activity(GO:0004576) dolichyl-diphosphooligosaccharide-protein glycotransferase activity(GO:0004579) |
| 0.2 | 1.7 | GO:0001078 | transcriptional repressor activity, RNA polymerase II core promoter proximal region sequence-specific binding(GO:0001078) transcriptional repressor activity, RNA polymerase II transcription regulatory region sequence-specific binding(GO:0001227) |
| 0.2 | 1.1 | GO:0005375 | copper ion transmembrane transporter activity(GO:0005375) |
| 0.2 | 2.1 | GO:0008320 | protein transmembrane transporter activity(GO:0008320) macromolecule transmembrane transporter activity(GO:0022884) |
| 0.2 | 1.0 | GO:0016408 | C-acyltransferase activity(GO:0016408) |
| 0.2 | 5.0 | GO:0015631 | tubulin binding(GO:0015631) |
| 0.2 | 2.6 | GO:0051087 | chaperone binding(GO:0051087) |
| 0.2 | 0.3 | GO:0001163 | RNA polymerase I regulatory region sequence-specific DNA binding(GO:0001163) |
| 0.2 | 0.5 | GO:0031370 | eukaryotic initiation factor 4G binding(GO:0031370) |
| 0.2 | 1.0 | GO:0003689 | DNA clamp loader activity(GO:0003689) protein-DNA loading ATPase activity(GO:0033170) |
| 0.2 | 2.7 | GO:0001056 | RNA polymerase III activity(GO:0001056) |
| 0.2 | 2.5 | GO:0008408 | 3'-5' exonuclease activity(GO:0008408) |
| 0.2 | 0.5 | GO:0004311 | farnesyltranstransferase activity(GO:0004311) |
| 0.2 | 0.8 | GO:0005338 | nucleotide-sugar transmembrane transporter activity(GO:0005338) |
| 0.1 | 0.7 | GO:0070300 | phosphatidic acid binding(GO:0070300) |
| 0.1 | 1.3 | GO:0030295 | protein kinase activator activity(GO:0030295) |
| 0.1 | 5.7 | GO:0008565 | protein transporter activity(GO:0008565) |
| 0.1 | 0.7 | GO:0001129 | RNA polymerase II transcription factor activity, TBP-class protein binding, involved in preinitiation complex assembly(GO:0001129) |
| 0.1 | 0.9 | GO:0001054 | RNA polymerase I activity(GO:0001054) |
| 0.1 | 0.5 | GO:0015230 | FAD transmembrane transporter activity(GO:0015230) |
| 0.1 | 2.8 | GO:0003779 | actin binding(GO:0003779) |
| 0.1 | 0.2 | GO:0017070 | U6 snRNA binding(GO:0017070) |
| 0.1 | 0.6 | GO:0005092 | GDP-dissociation inhibitor activity(GO:0005092) |
| 0.1 | 0.5 | GO:0003705 | transcription factor activity, RNA polymerase II distal enhancer sequence-specific binding(GO:0003705) |
| 0.1 | 3.1 | GO:0004812 | aminoacyl-tRNA ligase activity(GO:0004812) ligase activity, forming carbon-oxygen bonds(GO:0016875) ligase activity, forming aminoacyl-tRNA and related compounds(GO:0016876) |
| 0.1 | 1.5 | GO:0016831 | carboxy-lyase activity(GO:0016831) |
| 0.1 | 7.4 | GO:0003924 | GTPase activity(GO:0003924) |
| 0.1 | 1.5 | GO:0070566 | adenylyltransferase activity(GO:0070566) |
| 0.1 | 0.5 | GO:0004661 | protein geranylgeranyltransferase activity(GO:0004661) |
| 0.1 | 0.8 | GO:0080025 | phosphatidylinositol-3,5-bisphosphate binding(GO:0080025) |
| 0.1 | 2.7 | GO:0000030 | mannosyltransferase activity(GO:0000030) |
| 0.1 | 0.4 | GO:0016655 | oxidoreductase activity, acting on NAD(P)H, quinone or similar compound as acceptor(GO:0016655) |
| 0.1 | 0.4 | GO:0047429 | nucleoside-triphosphate diphosphatase activity(GO:0047429) |
| 0.1 | 1.6 | GO:0005200 | structural constituent of cytoskeleton(GO:0005200) |
| 0.1 | 1.0 | GO:0008301 | DNA binding, bending(GO:0008301) |
| 0.1 | 0.3 | GO:0008526 | phosphatidylcholine transporter activity(GO:0008525) phosphatidylinositol transporter activity(GO:0008526) |
| 0.1 | 0.9 | GO:0019207 | kinase regulator activity(GO:0019207) |
| 0.1 | 1.0 | GO:0050661 | NADP binding(GO:0050661) |
| 0.1 | 0.8 | GO:0003714 | transcription corepressor activity(GO:0003714) |
| 0.1 | 1.8 | GO:0030674 | protein binding, bridging(GO:0030674) |
| 0.1 | 0.5 | GO:0016409 | palmitoyltransferase activity(GO:0016409) |
| 0.1 | 0.6 | GO:0008375 | acetylglucosaminyltransferase activity(GO:0008375) |
| 0.0 | 0.2 | GO:0070546 | L-phenylalanine aminotransferase activity(GO:0070546) L-phenylalanine:2-oxoglutarate aminotransferase activity(GO:0080130) |
| 0.0 | 0.8 | GO:0016763 | transferase activity, transferring pentosyl groups(GO:0016763) |
| 0.0 | 0.8 | GO:0032266 | phosphatidylinositol-3-phosphate binding(GO:0032266) |
| 0.0 | 0.2 | GO:0008601 | protein phosphatase type 2A regulator activity(GO:0008601) |
| 0.0 | 0.4 | GO:0015079 | potassium ion transmembrane transporter activity(GO:0015079) |
| 0.0 | 0.2 | GO:0004180 | carboxypeptidase activity(GO:0004180) |
| 0.0 | 0.2 | GO:0004707 | MAP kinase activity(GO:0004707) |
| 0.0 | 0.2 | GO:0016744 | transferase activity, transferring aldehyde or ketonic groups(GO:0016744) |
| 0.0 | 0.6 | GO:0030515 | snoRNA binding(GO:0030515) |
| 0.0 | 0.9 | GO:0004004 | ATP-dependent RNA helicase activity(GO:0004004) |
| 0.0 | 0.1 | GO:0032934 | steroid binding(GO:0005496) sterol binding(GO:0032934) |
| 0.0 | 0.1 | GO:0017150 | tRNA dihydrouridine synthase activity(GO:0017150) |
| 0.0 | 0.4 | GO:0017056 | structural constituent of nuclear pore(GO:0017056) |
| 0.0 | 0.1 | GO:0003724 | RNA helicase activity(GO:0003724) |
| 0.0 | 0.1 | GO:0017112 | Rab guanyl-nucleotide exchange factor activity(GO:0017112) |
| 0.0 | 0.4 | GO:0005085 | guanyl-nucleotide exchange factor activity(GO:0005085) |
| 0.0 | 0.1 | GO:0000049 | tRNA binding(GO:0000049) |
| 0.0 | 0.3 | GO:0003743 | translation initiation factor activity(GO:0003743) |
| 0.0 | 0.0 | GO:0097372 | NAD-dependent histone deacetylase activity (H3-K18 specific)(GO:0097372) |
Gene overrepresentation in curated gene sets: canonical pathways category:
| Log-likelihood per target | Total log-likelihood | Term | Description |
|---|---|---|---|
| 0.5 | 2.7 | PID CXCR4 PATHWAY | CXCR4-mediated signaling events |
| 0.4 | 2.1 | PID PLK1 PATHWAY | PLK1 signaling events |
| 0.3 | 0.6 | ST FAS SIGNALING PATHWAY | Fas Signaling Pathway |
| 0.2 | 0.7 | PID HIF1 TFPATHWAY | HIF-1-alpha transcription factor network |
| 0.2 | 1.6 | PID ATR PATHWAY | ATR signaling pathway |
| 0.1 | 0.3 | PID E2F PATHWAY | E2F transcription factor network |
| 0.1 | 0.3 | PID ERA GENOMIC PATHWAY | Validated nuclear estrogen receptor alpha network |
Gene overrepresentation in curated gene sets: REACTOME pathways category:
| Log-likelihood per target | Total log-likelihood | Term | Description |
|---|---|---|---|
| 2.0 | 7.9 | REACTOME GLYCEROPHOSPHOLIPID BIOSYNTHESIS | Genes involved in Glycerophospholipid biosynthesis |
| 1.8 | 14.1 | REACTOME ACTIVATION OF THE MRNA UPON BINDING OF THE CAP BINDING COMPLEX AND EIFS AND SUBSEQUENT BINDING TO 43S | Genes involved in Activation of the mRNA upon binding of the cap-binding complex and eIFs, and subsequent binding to 43S |
| 1.1 | 4.5 | REACTOME GLYCOLYSIS | Genes involved in Glycolysis |
| 0.8 | 5.5 | REACTOME UNWINDING OF DNA | Genes involved in Unwinding of DNA |
| 0.8 | 6.0 | REACTOME MRNA DECAY BY 5 TO 3 EXORIBONUCLEASE | Genes involved in mRNA Decay by 5' to 3' Exoribonuclease |
| 0.3 | 2.6 | REACTOME PPARA ACTIVATES GENE EXPRESSION | Genes involved in PPARA Activates Gene Expression |
| 0.2 | 1.0 | REACTOME GLOBAL GENOMIC NER GG NER | Genes involved in Global Genomic NER (GG-NER) |
| 0.2 | 1.3 | REACTOME PROTEIN FOLDING | Genes involved in Protein folding |
| 0.2 | 2.2 | REACTOME MITOTIC PROMETAPHASE | Genes involved in Mitotic Prometaphase |
| 0.2 | 2.8 | REACTOME NONSENSE MEDIATED DECAY ENHANCED BY THE EXON JUNCTION COMPLEX | Genes involved in Nonsense Mediated Decay Enhanced by the Exon Junction Complex |
| 0.2 | 0.8 | REACTOME ENDOSOMAL SORTING COMPLEX REQUIRED FOR TRANSPORT ESCRT | Genes involved in Endosomal Sorting Complex Required For Transport (ESCRT) |
| 0.1 | 0.7 | REACTOME GPCR DOWNSTREAM SIGNALING | Genes involved in GPCR downstream signaling |
| 0.1 | 0.8 | REACTOME MITOTIC M M G1 PHASES | Genes involved in Mitotic M-M/G1 phases |
| 0.1 | 0.3 | REACTOME PLATELET ACTIVATION SIGNALING AND AGGREGATION | Genes involved in Platelet activation, signaling and aggregation |
| 0.0 | 0.5 | REACTOME BIOSYNTHESIS OF THE N GLYCAN PRECURSOR DOLICHOL LIPID LINKED OLIGOSACCHARIDE LLO AND TRANSFER TO A NASCENT PROTEIN | Genes involved in Biosynthesis of the N-glycan precursor (dolichol lipid-linked oligosaccharide, LLO) and transfer to a nascent protein |
| 0.0 | 0.2 | REACTOME METABOLISM OF AMINO ACIDS AND DERIVATIVES | Genes involved in Metabolism of amino acids and derivatives |
| 0.0 | 0.0 | REACTOME FATTY ACID TRIACYLGLYCEROL AND KETONE BODY METABOLISM | Genes involved in Fatty acid, triacylglycerol, and ketone body metabolism |