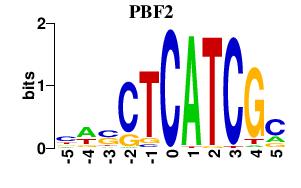
Results for PBF2
Z-value: 2.50
Motif logo
Transcription factors associated with PBF2
| Gene Symbol | Gene ID | Gene Info |
|---|---|---|
|
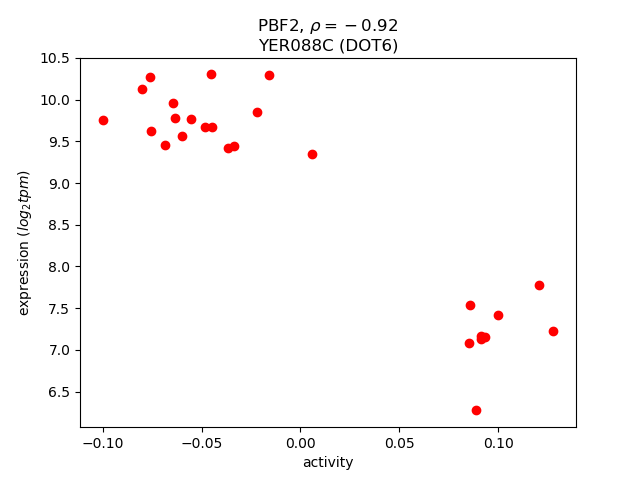
DOT6
|
S000000890 | Protein involved in rRNA and ribosome biogenesis |
Activity-expression correlation:
Activity profile of PBF2 motif
Sorted Z-values of PBF2 motif
| Promoter | Log-likelihood | Transcript | Gene | Gene Info |
|---|---|---|---|---|
| YFR055W | 35.49 |
IRC7
|
Putative cystathionine beta-lyase; involved in copper ion homeostasis and sulfur metabolism; null mutant displays increased levels of spontaneous Rad52p foci; expression induced by nitrogen limitation in a GLN3, GAT1-dependent manner |
|
| YFR056C | 30.52 |
Dubious open reading frame unlikely to encode a protein based on available experimental and comparative sequence data; partially overlaps the uncharacterized gene YFR055W |
||
| YKR092C | 24.83 |
SRP40
|
Nucleolar, serine-rich protein with a role in preribosome assembly or transport; may function as a chaperone of small nucleolar ribonucleoprotein particles (snoRNPs); immunologically and structurally to rat Nopp140 |
|
| YER074W | 18.72 |
RPS24A
|
Protein component of the small (40S) ribosomal subunit; identical to Rps24Bp and has similarity to rat S24 ribosomal protein |
|
| YER073W | 18.37 |
ALD5
|
Mitochondrial aldehyde dehydrogenase, involved in regulation or biosynthesis of electron transport chain components and acetate formation; activated by K+; utilizes NADP+ as the preferred coenzyme; constitutively expressed |
|
| YOR101W | 17.22 |
RAS1
|
GTPase involved in G-protein signaling in the adenylate cyclase activating pathway, plays a role in cell proliferation; localized to the plasma membrane; homolog of mammalian RAS proto-oncogenes |
|
| YOR096W | 16.43 |
RPS7A
|
Protein component of the small (40S) ribosomal subunit, nearly identical to Rps7Bp; interacts with Kti11p; deletion causes hypersensitivity to zymocin; has similarity to rat S7 and Xenopus S8 ribosomal proteins |
|
| YPR148C | 15.11 |
Protein of unknown function that may interact with ribosomes, based on co-purification experiments; green fluorescent protein (GFP)-fusion protein localizes to the cytoplasm in a punctate pattern |
||
| YNL178W | 14.89 |
RPS3
|
Protein component of the small (40S) ribosomal subunit, has apurinic/apyrimidinic (AP) endonuclease activity; essential for viability; has similarity to E. coli S3 and rat S3 ribosomal proteins |
|
| YIR021W | 14.08 |
MRS1
|
Protein required for the splicing of two mitochondrial group I introns (BI3 in COB and AI5beta in COX1); forms a splicing complex, containing four subunits of Mrs1p and two subunits of the BI3-encoded maturase, that binds to the BI3 RNA |
|
| YMR246W | 13.04 |
FAA4
|
Long chain fatty acyl-CoA synthetase, regulates protein modification during growth in the presence of ethanol, functions to incorporate palmitic acid into phospholipids and neutral lipids |
|
| YDL055C | 12.85 |
PSA1
|
GDP-mannose pyrophosphorylase (mannose-1-phosphate guanyltransferase), synthesizes GDP-mannose from GTP and mannose-1-phosphate in cell wall biosynthesis; required for normal cell wall structure |
|
| YOR340C | 12.70 |
RPA43
|
RNA polymerase I subunit A43 |
|
| YLR062C | 12.44 |
BUD28
|
Dubious open reading frame, unlikely to encode a protein; not conserved in closely related Saccharomyces species; 98% of ORF overlaps the verified gene RPL22A; diploid mutant displays a weak budding pattern phenotype in a systematic assay |
|
| YHR128W | 12.31 |
FUR1
|
Uracil phosphoribosyltransferase, synthesizes UMP from uracil; involved in the pyrimidine salvage pathway |
|
| YDL208W | 12.01 |
NHP2
|
Nuclear protein related to mammalian high mobility group (HMG) proteins, essential for function of H/ACA-type snoRNPs, which are involved in 18S rRNA processing |
|
| YGR251W | 11.96 |
Putative protein of unknown function; deletion mutant has defects in pre-rRNA processing; green fluorescent protein (GFP)-fusion protein localizes to both the nucleus and the nucleolus; YGR251W is an essential gene |
||
| YER137C | 11.90 |
Putative protein of unknown function |
||
| YER146W | 11.49 |
LSM5
|
Lsm (Like Sm) protein; part of heteroheptameric complexes (Lsm2p-7p and either Lsm1p or 8p): cytoplasmic Lsm1p complex involved in mRNA decay; nuclear Lsm8p complex part of U6 snRNP and possibly involved in processing tRNA, snoRNA, and rRNA |
|
| YDL148C | 11.39 |
NOP14
|
Nucleolar protein, forms a complex with Noc4p that mediates maturation and nuclear export of 40S ribosomal subunits; also present in the small subunit processome complex, which is required for processing of pre-18S rRNA |
|
| YPL211W | 11.35 |
NIP7
|
Nucleolar protein required for 60S ribosome subunit biogenesis, constituent of 66S pre-ribosomal particles; physically interacts with Nop8p and the exosome subunit Rrp43p |
|
| YOL086C | 11.26 |
ADH1
|
Alcohol dehydrogenase, fermentative isozyme active as homo- or heterotetramers; required for the reduction of acetaldehyde to ethanol, the last step in the glycolytic pathway |
|
| YOL077C | 10.88 |
BRX1
|
Nucleolar protein, constituent of 66S pre-ribosomal particles; depletion leads to defects in rRNA processing and a block in the assembly of large ribosomal subunits; possesses a sigma(70)-like RNA-binding motif |
|
| YOL127W | 10.68 |
RPL25
|
Primary rRNA-binding ribosomal protein component of the large (60S) ribosomal subunit, has similarity to E. coli L23 and rat L23a ribosomal proteins; binds to 26S rRNA via a conserved C-terminal motif |
|
| YLR432W | 10.64 |
IMD3
|
Inosine monophosphate dehydrogenase, catalyzes the first step of GMP biosynthesis, member of a four-gene family in S. cerevisiae, constitutively expressed |
|
| YNL112W | 10.57 |
DBP2
|
Essential ATP-dependent RNA helicase of the DEAD-box protein family, involved in nonsense-mediated mRNA decay and rRNA processing |
|
| YML123C | 10.47 |
PHO84
|
High-affinity inorganic phosphate (Pi) transporter and low-affinity manganese transporter; regulated by Pho4p and Spt7p; mutation confers resistance to arsenate; exit from the ER during maturation requires Pho86p |
|
| YNL248C | 10.39 |
RPA49
|
RNA polymerase I subunit A49 |
|
| YJL010C | 10.14 |
NOP9
|
Essential component of pre-40S ribosomes that is required for early cleavages of 35S pre-rRNA and hence formation of 18S rRNA; binds RNA in vitro and contains multiple pumilio-like repeats |
|
| YBR154C | 9.70 |
RPB5
|
RNA polymerase subunit ABC27, common to RNA polymerases I, II, and III; contacts DNA and affects transactivation |
|
| YMR290C | 9.63 |
HAS1
|
ATP-dependent RNA helicase; localizes to both the nuclear periphery and nucleolus; highly enriched in nuclear pore complex fractions; constituent of 66S pre-ribosomal particles |
|
| YDL051W | 9.58 |
LHP1
|
RNA binding protein required for maturation of tRNA and snRNA precursors; acts as a molecular chaperone for RNAs transcribed by polymerase III; homologous to human La (SS-B) autoantigen |
|
| YOR272W | 9.54 |
YTM1
|
Constituent of 66S pre-ribosomal particles, required for maturation of the large ribosomal subunit |
|
| YGR128C | 9.51 |
UTP8
|
Nucleolar protein required for export of tRNAs from the nucleus; also copurifies with the small subunit (SSU) processome containing the U3 snoRNA that is involved in processing of pre-18S rRNA |
|
| YMR290W-A | 9.50 |
Dubious open reading frame unlikely to encode a functional protein, based on available experimental and comparative sequence data; overlaps 5' end of essential HAS1 gene which encodes an ATP-dependent RNA helicase |
||
| YJL122W | 9.47 |
ALB1
|
Shuttling pre-60S factor; involved in the biogenesis of ribosomal large subunit; interacts directly with Arx1p; responsible for Tif6p recycling defects in absence of Rei1p |
|
| YBL027W | 9.35 |
RPL19B
|
Protein component of the large (60S) ribosomal subunit, nearly identical to Rpl19Ap and has similarity to rat L19 ribosomal protein; rpl19a and rpl19b single null mutations result in slow growth, while the double null mutation is lethal |
|
| YLR355C | 9.31 |
ILV5
|
Acetohydroxyacid reductoisomerase, mitochondrial protein involved in branched-chain amino acid biosynthesis, also required for maintenance of wild-type mitochondrial DNA and found in mitochondrial nucleoids |
|
| YKL081W | 9.27 |
TEF4
|
Translation elongation factor EF-1 gamma |
|
| YBL039C | 9.21 |
URA7
|
Major CTP synthase isozyme (see also URA8), catalyzes the ATP-dependent transfer of the amide nitrogen from glutamine to UTP, forming CTP, the final step in de novo biosynthesis of pyrimidines; involved in phospholipid biosynthesis |
|
| YNL141W | 9.12 |
AAH1
|
Adenine deaminase (adenine aminohydrolase), converts adenine to hypoxanthine; involved in purine salvage; transcriptionally regulated by nutrient levels and growth phase; Aah1p degraded upon entry into quiescence via SCF and the proteasome |
|
| YLR154C | 9.11 |
RNH203
|
Ribonuclease H2 subunit, required for RNase H2 activity |
|
| YEL053W-A | 9.03 |
Dubious open reading frame unlikely to encode a protein, based on available experimental and comparative sequence data; partially overlaps the verified gene YEL054C |
||
| YBL028C | 9.00 |
Protein of unknown function that may interact with ribosomes; green fluorescent protein (GFP)-fusion protein localizes to the nucleolus; predicted to be involved in ribosome biogenesis |
||
| YGL055W | 8.74 |
OLE1
|
Delta(9) fatty acid desaturase, required for monounsaturated fatty acid synthesis and for normal distribution of mitochondria |
|
| YNL113W | 8.74 |
RPC19
|
RNA polymerase subunit, common to RNA polymerases I and III |
|
| YFR054C | 8.74 |
Dubious open reading frame unlikely to encode a functional protein, based on available experimental and comparative sequence data |
||
| YKR093W | 8.69 |
PTR2
|
Integral membrane peptide transporter, mediates transport of di- and tri-peptides; conserved protein that contains 12 transmembrane domains; PTR2 expression is regulated by the N-end rule pathway via repression by Cup9p |
|
| YMR217W | 8.68 |
GUA1
|
GMP synthase, an enzyme that catalyzes the second step in the biosynthesis of GMP from inosine 5'-phosphate (IMP); transcription is not subject to regulation by guanine but is negatively regulated by nutrient starvation |
|
| YIL091C | 8.61 |
Protein required for cell viability |
||
| YPL143W | 8.59 |
RPL33A
|
N-terminally acetylated ribosomal protein L37 of the large (60S) ribosomal subunit, nearly identical to Rpl33Bp and has similarity to rat L35a; rpl33a null mutant exhibits slow growth while rpl33a rpl33b double null mutant is inviable |
|
| YKL164C | 8.59 |
PIR1
|
O-glycosylated protein required for cell wall stability; attached to the cell wall via beta-1,3-glucan; mediates mitochondrial translocation of Apn1p; expression regulated by the cell integrity pathway and by Swi5p during the cell cycle |
|
| YIL118W | 8.56 |
RHO3
|
Non-essential small GTPase of the Rho/Rac subfamily of Ras-like proteins involved in the establishment of cell polarity; GTPase activity positively regulated by the GTPase activating protein (GAP) Rgd1p |
|
| YML121W | 8.55 |
GTR1
|
Cytoplasmic GTP binding protein and negative regulator of the Ran/Tc4 GTPase cycle; component of GSE complex, which is required for sorting of Gap1p; involved in phosphate transport and telomeric silencing; similar to human RagA and RagB |
|
| YLR449W | 8.55 |
FPR4
|
Peptidyl-prolyl cis-trans isomerase (PPIase) (proline isomerase) localized to the nucleus; catalyzes isomerization of proline residues in histones H3 and H4, which affects lysine methylation of those histones |
|
| YPR010C | 8.46 |
RPA135
|
RNA polymerase I subunit A135 |
|
| YPL250W-A | 8.30 |
Identified by fungal homology and RT-PCR |
||
| YKR081C | 8.28 |
RPF2
|
Essential protein involved in the processing of pre-rRNA and the assembly of the 60S ribosomal subunit; interacts with ribosomal protein L11; localizes predominantly to the nucleolus; constituent of 66S pre-ribosomal particles |
|
| YGR151C | 8.24 |
Dubious open reading frame unlikely to encode a protein, based on available experimental and comparative sequence data; overlaps almost completely with the verified ORF RSR1/BUD1/YGR152C |
||
| YLR154W-A | 8.01 |
Dubious open reading frame unlikely to encode a protein; encoded within the the 25S rRNA gene on the opposite strand |
||
| YMR131C | 8.00 |
RRB1
|
Essential nuclear protein involved in early steps of ribosome biogenesis; physically interacts with the ribosomal protein Rpl3p |
|
| YLR009W | 7.96 |
RLP24
|
Essential protein with similarity to Rpl24Ap and Rpl24Bp, associated with pre-60S ribosomal subunits and required for ribosomal large subunit biogenesis |
|
| YJR070C | 7.93 |
LIA1
|
Deoxyhypusine hydroxylase, a HEAT-repeat containing metalloenzyme that catalyses hypusine formation; binds to and is required for the modification of Hyp2p (eIF5A); complements S. pombe mmd1 mutants defective in mitochondrial positioning |
|
| YPL090C | 7.80 |
RPS6A
|
Protein component of the small (40S) ribosomal subunit; identical to Rps6Bp and has similarity to rat S6 ribosomal protein |
|
| YLR154W-B | 7.77 |
Dubious open reading frame unlikely to encode a protein; encoded within the the 25S rRNA gene on the opposite strand |
||
| YKL009W | 7.76 |
MRT4
|
Protein involved in mRNA turnover and ribosome assembly, localizes to the nucleolus |
|
| YOR271C | 7.74 |
FSF1
|
Putative protein, predicted to be an alpha-isopropylmalate carrier; belongs to the sideroblastic-associated protein family; non-tagged protein is detected in purified mitochondria; likely to play a role in iron homeostasis |
|
| YLR075W | 7.73 |
RPL10
|
Protein component of the large (60S) ribosomal subunit, responsible for joining the 40S and 60S subunits; regulates translation initiation; has similarity to rat L10 ribosomal protein and to members of the QM gene family |
|
| YML043C | 7.66 |
RRN11
|
Protein required for rDNA transcription by RNA polymerase I, component of the core factor (CF) of rDNA transcription factor, which also contains Rrn6p and Rrn7p |
|
| YMR049C | 7.60 |
ERB1
|
Protein required for maturation of the 25S and 5.8S ribosomal RNAs; constituent of 66S pre-ribosomal particles; homologous to mammalian Bop1 |
|
| YHR066W | 7.59 |
SSF1
|
Constituent of 66S pre-ribosomal particles, required for ribosomal large subunit maturation; functionally redundant with Ssf2p; member of the Brix family |
|
| YNL175C | 7.56 |
NOP13
|
Protein of unknown function, localizes to the nucleolus and nucleoplasm; contains an RNA recognition motif (RRM) and has similarity to Nop12p, which is required for processing of pre-18S rRNA |
|
| YOR004W | 7.49 |
UTP23
|
Essential nucleolar protein that is a component of the SSU (small subunit) processome involved in 40S ribosomal subunit biogenesis; has homology to PINc domain protein Fcf1p, although the PINc domain of Utp23p is not required for function |
|
| YJR071W | 7.45 |
Dubious open reading frame unlikely to encode a functional protein, based on available experimental and comparative sequence data |
||
| YPL212C | 7.45 |
PUS1
|
tRNA:pseudouridine synthase, introduces pseudouridines at positions 26-28, 34-36, 65, and 67 of tRNA; nuclear protein that appears to be involved in tRNA export; also acts on U2 snRNA |
|
| YDL022C-A | 7.35 |
Dubious open reading frame unlikely to encode a protein; partially overlaps the verified gene DIA3; identified by fungal homology and RT-PCR |
||
| YDL112W | 7.33 |
TRM3
|
2'-O-ribose methyltransferase, catalyzes the ribose methylation of the guanosine nucleotide at position 18 of tRNAs |
|
| YDL023C | 7.30 |
Dubious open reading frame, unlikely to encode a protein; not conserved in other Saccharomyces species; overlaps the verified gene GPD1; deletion confers sensitivity to GSAO; deletion in cyr1 mutant results in loss of stress resistance |
||
| YKL096W-A | 7.21 |
CWP2
|
Covalently linked cell wall mannoprotein, major constituent of the cell wall; plays a role in stabilizing the cell wall; involved in low pH resistance; precursor is GPI-anchored |
|
| YLR068W | 7.21 |
FYV7
|
Protein of unknown function, required for survival upon exposure to K1 killer toxin; involved in processing the 35S rRNA primary transcript to generate the 20S and 27SA2 pre-rRNA transcripts |
|
| YIR026C | 7.20 |
YVH1
|
Protein phosphatase involved in vegetative growth at low temperatures, sporulation, and glycogen accumulation; transcription induced by low temperature and nitrogen starvation; member of the dual-specificity family of protein phosphatases |
|
| YDL014W | 7.17 |
NOP1
|
Nucleolar protein, component of the small subunit processome complex, which is required for processing of pre-18S rRNA; has similarity to mammalian fibrillarin |
|
| YNR053C | 7.17 |
NOG2
|
Putative GTPase that associates with pre-60S ribosomal subunits in the nucleolus and is required for their nuclear export and maturation |
|
| YAL059W | 7.10 |
ECM1
|
Protein of unknown function, localized in the nucleoplasm and the nucleolus, genetically interacts with MTR2 in 60S ribosomal protein subunit export |
|
| YLR406C | 7.01 |
RPL31B
|
Protein component of the large (60S) ribosomal subunit, nearly identical to Rpl31Ap and has similarity to rat L31 ribosomal protein; associates with the karyopherin Sxm1p |
|
| YDR087C | 6.98 |
RRP1
|
Essential evolutionarily conserved nucleolar protein necessary for biogenesis of 60S ribosomal subunits and processing of pre-rRNAs to mature rRNAs, associated with several distinct 66S pre-ribosomal particles |
|
| YLR349W | 6.95 |
Dubious open reading frame unlikely to encode a protein, based on available experimental and comparative sequence data; overlaps the verified ORF DIC1/YLR348C |
||
| YJL148W | 6.95 |
RPA34
|
RNA polymerase I subunit A34.5 |
|
| YGL029W | 6.94 |
CGR1
|
Protein involved in nucleolar integrity and processing of the pre-rRNA for the 60S ribosome subunit; transcript is induced in response to cytotoxic stress but not genotoxic stress |
|
| YPL093W | 6.91 |
NOG1
|
Putative GTPase that associates with free 60S ribosomal subunits in the nucleolus and is required for 60S ribosomal subunit biogenesis; constituent of 66S pre-ribosomal particles; member of the ODN family of nucleolar G-proteins |
|
| YDR399W | 6.90 |
HPT1
|
Dimeric hypoxanthine-guanine phosphoribosyltransferase, catalyzes the formation of both inosine monophosphate and guanosine monophosphate; mutations in the human homolog HPRT1 can cause Lesch-Nyhan syndrome and Kelley-Seegmiller syndrome |
|
| YPR163C | 6.87 |
TIF3
|
Translation initiation factor eIF-4B, has RNA annealing activity; contains an RNA recognition motif and binds to single-stranded RNA |
|
| YFR001W | 6.72 |
LOC1
|
Nuclear protein involved in asymmetric localization of ASH1 mRNA; binds double-stranded RNA in vitro; constituent of 66S pre-ribosomal particles |
|
| YLR348C | 6.69 |
DIC1
|
Mitochondrial dicarboxylate carrier, integral membrane protein, catalyzes a dicarboxylate-phosphate exchange across the inner mitochondrial membrane, transports cytoplasmic dicarboxylates into the mitochondrial matrix |
|
| YOL041C | 6.64 |
NOP12
|
Nucleolar protein, required for pre-25S rRNA processing; contains an RNA recognition motif (RRM) and has similarity to Nop13p, Nsr1p, and putative orthologs in Drosophila and S. pombe |
|
| YHR148W | 6.60 |
IMP3
|
Component of the SSU processome, which is required for pre-18S rRNA processing, essential protein that interacts with Mpp10p and mediates interactions of Imp4p and Mpp10p with U3 snoRNA |
|
| YDR465C | 6.60 |
RMT2
|
Arginine methyltransferase; ribosomal protein L12 is a substrate |
|
| YGL078C | 6.59 |
DBP3
|
Putative ATP-dependent RNA helicase of the DEAD-box family involved in ribosomal biogenesis |
|
| YDL150W | 6.58 |
RPC53
|
RNA polymerase III subunit C53 |
|
| YGR280C | 6.53 |
PXR1
|
Essential protein involved in rRNA and snoRNA maturation; competes with TLC1 RNA for binding to Est2p, suggesting a role in negative regulation of telomerase; human homolog inhibits telomerase; contains a G-patch RNA interacting domain |
|
| YGR155W | 6.43 |
CYS4
|
Cystathionine beta-synthase, catalyzes the synthesis of cystathionine from serine and homocysteine, the first committed step in cysteine biosynthesis |
|
| YCR018C | 6.42 |
SRD1
|
Protein involved in the processing of pre-rRNA to mature rRNA; contains a C2/C2 zinc finger motif; srd1 mutation suppresses defects caused by the rrp1-1 mutation |
|
| YOL076W | 6.42 |
MDM20
|
Non-catalytic subunit of the NatB N-terminal acetyltransferase, which catalyzes N-acetylation of proteins with specific N-terminal sequences; involved in mitochondrial inheritance and actin assembly |
|
| YOR108W | 6.42 |
LEU9
|
Alpha-isopropylmalate synthase II (2-isopropylmalate synthase), catalyzes the first step in the leucine biosynthesis pathway; the minor isozyme, responsible for the residual alpha-IPMS activity detected in a leu4 null mutant |
|
| YOR153W | 6.42 |
PDR5
|
Plasma membrane ATP-binding cassette (ABC) transporter, short-lived multidrug transporter actively regulated by Pdr1p; also involved in steroid transport, cation resistance, and cellular detoxification during exponential growth |
|
| YDR385W | 6.37 |
EFT2
|
Elongation factor 2 (EF-2), also encoded by EFT1; catalyzes ribosomal translocation during protein synthesis; contains diphthamide, the unique posttranslationally modified histidine residue specifically ADP-ribosylated by diphtheria toxin |
|
| YKL172W | 6.35 |
EBP2
|
Essential protein required for the maturation of 25S rRNA and 60S ribosomal subunit assembly, localizes to the nucleolus; constituent of 66S pre-ribosomal particles |
|
| YPL108W | 6.35 |
Cytoplasmic protein of unknown function; non-essential gene that is induced in a GDH1 deleted strain with altered redox metabolism; GFP-fusion protein is induced in response to the DNA-damaging agent MMS |
||
| YOR310C | 6.30 |
NOP58
|
Protein involved in pre-rRNA processing, 18S rRNA synthesis, and snoRNA synthesis; component of the small subunit processome complex, which is required for processing of pre-18S rRNA |
|
| YGR214W | 6.29 |
RPS0A
|
Protein component of the small (40S) ribosomal subunit, nearly identical to Rps0Bp; required for maturation of 18S rRNA along with Rps0Bp; deletion of either RPS0 gene reduces growth rate, deletion of both genes is lethal |
|
| YGR159C | 6.24 |
NSR1
|
Nucleolar protein that binds nuclear localization sequences, required for pre-rRNA processing and ribosome biogenesis |
|
| YGR123C | 6.24 |
PPT1
|
Protein serine/threonine phosphatase with similarity to human phosphatase PP5; present in both the nucleus and cytoplasm; expressed during logarithmic growth; computational analyses suggest roles in phosphate metabolism and rRNA processing |
|
| YER102W | 6.20 |
RPS8B
|
Protein component of the small (40S) ribosomal subunit; identical to Rps8Ap and has similarity to rat S8 ribosomal protein |
|
| YLR196W | 6.18 |
PWP1
|
Protein with WD-40 repeats involved in rRNA processing; associates with trans-acting ribosome biogenesis factors; similar to beta-transducin superfamily |
|
| YGL120C | 6.18 |
PRP43
|
RNA helicase in the DEAH-box family, functions in both RNA polymerase I and polymerase II transcript metabolism, involved in release of the lariat-intron from the spliceosome |
|
| YKR024C | 6.17 |
DBP7
|
Putative ATP-dependent RNA helicase of the DEAD-box family involved in ribosomal biogenesis |
|
| YOL080C | 6.11 |
REX4
|
Putative RNA exonuclease possibly involved in pre-rRNA processing and ribosome assembly |
|
| YDR060W | 6.07 |
MAK21
|
Constituent of 66S pre-ribosomal particles, required for large (60S) ribosomal subunit biogenesis; involved in nuclear export of pre-ribosomes; required for maintenance of dsRNA virus; homolog of human CAATT-binding protein |
|
| YDL022W | 6.06 |
GPD1
|
NAD-dependent glycerol-3-phosphate dehydrogenase, key enzyme of glycerol synthesis, essential for growth under osmotic stress; expression regulated by high-osmolarity glycerol response pathway; homolog of Gpd2p |
|
| YGR108W | 6.04 |
CLB1
|
B-type cyclin involved in cell cycle progression; activates Cdc28p to promote the transition from G2 to M phase; accumulates during G2 and M, then targeted via a destruction box motif for ubiquitin-mediated degradation by the proteasome |
|
| YGR245C | 6.02 |
SDA1
|
Highly conserved nuclear protein required for actin cytoskeleton organization and passage through Start, plays a critical role in G1 events, binds Nap1p, also involved in 60S ribosome biogenesis |
|
| YCL059C | 5.99 |
KRR1
|
Essential nucleolar protein required for the synthesis of 18S rRNA and for the assembly of 40S ribosomal subunit |
|
| YGR145W | 5.99 |
ENP2
|
Essential nucleolar protein of unknown function; contains WD repeats, interacts with Mpp10p and Bfr2p, and has homology to Spb1p |
|
| YAL025C | 5.98 |
MAK16
|
Essential nuclear protein, constituent of 66S pre-ribosomal particles; required for maturation of 25S and 5.8S rRNAs; required for maintenance of M1 satellite double-stranded RNA of the L-A virus |
|
| YLR409C | 5.96 |
UTP21
|
Possible U3 snoRNP protein involved in maturation of pre-18S rRNA, based on computational analysis of large-scale protein-protein interaction data |
|
| YLL008W | 5.95 |
DRS1
|
Nucleolar DEAD-box protein required for ribosome assembly and function, including synthesis of 60S ribosomal subunits; constituent of 66S pre-ribosomal particles |
|
| YBR249C | 5.93 |
ARO4
|
3-deoxy-D-arabino-heptulosonate-7-phosphate (DAHP) synthase, catalyzes the first step in aromatic amino acid biosynthesis and is feedback-inhibited by tyrosine or high concentrations of phenylalanine or tryptophan |
|
| YLR180W | 5.91 |
SAM1
|
S-adenosylmethionine synthetase, catalyzes transfer of the adenosyl group of ATP to the sulfur atom of methionine; one of two differentially regulated isozymes (Sam1p and Sam2p) |
|
| YFL015W-A | 5.91 |
Dubious open reading frame unlikely to encode a functional protein, based on available experimental and comparative sequence data |
||
| YOL079W | 5.89 |
Dubious open reading frame, unlikely to encode a functional protein; based on available experimental and comparative sequence data |
||
| YJL050W | 5.87 |
MTR4
|
Dead-box family ATP dependent helicase required for mRNA export from the nucleus; co-factor of the exosome complex, required for 3' end formation of 5.8S rRNA |
|
| YBR142W | 5.86 |
MAK5
|
Essential nucleolar protein, putative DEAD-box RNA helicase required for maintenance of M1 dsRNA virus; involved in biogenesis of large (60S) ribosomal subunits |
|
| YHR089C | 5.81 |
GAR1
|
Protein component of the H/ACA snoRNP pseudouridylase complex, involved in the modification and cleavage of the 18S pre-rRNA |
|
| YDR120C | 5.79 |
TRM1
|
tRNA methyltransferase, localizes to both the nucleus and mitochondrion to produce the modified base N2,N2-dimethylguanosine in tRNAs in both compartments |
|
| YFR031C-A | 5.76 |
RPL2A
|
Protein component of the large (60S) ribosomal subunit, identical to Rpl2Bp and has similarity to E. coli L2 and rat L8 ribosomal proteins |
|
| YFL015C | 5.75 |
Dubious open reading frame unlikely to encode a protein; partially overlaps dubious ORF YFL015W-A; YFL015C is not an essential gene |
||
| YKL099C | 5.73 |
UTP11
|
Nucleolar protein, component of the small subunit (SSU) processome containing the U3 snoRNA that is involved in processing of pre-18S rRNA |
|
| YNL247W | 5.68 |
Essential protein of unknown function; may interact with ribosomes, based on co-purification experiments |
||
| YGR103W | 5.68 |
NOP7
|
Nucleolar protein involved in rRNA processing and 60S ribosomal subunit biogenesis; constituent of several different pre-ribosomal particles; required for exit from G0 and the initiation of cell proliferation |
|
| YJL200C | 5.64 |
ACO2
|
Putative mitochondrial aconitase isozyme; similarity to Aco1p, an aconitase required for the TCA cycle; expression induced during growth on glucose, by amino acid starvation via Gcn4p, and repressed on ethanol |
|
| YER126C | 5.63 |
NSA2
|
Protein constituent of 66S pre-ribosomal particles, contributes to processing of the 27S pre-rRNA |
|
| YNL114C | 5.63 |
Dubious open reading frame unlikely to encode a protein, based on available experimental and comparative sequence data; completely overlaps the verified ORF RPC19/YNL113W, an RNA polymerase subunit |
||
| YNR003C | 5.56 |
RPC34
|
RNA polymerase III subunit C34; interacts with TFIIIB70 and is a key determinant in pol III recruitment by the preinitiation complex |
|
| YPL012W | 5.55 |
RRP12
|
Protein required for export of the ribosomal subunits; associates with the RNA components of the pre-ribosomes; contains HEAT-repeats |
|
| YNL002C | 5.54 |
RLP7
|
Nucleolar protein with similarity to large ribosomal subunit L7 proteins; constituent of 66S pre-ribosomal particles; plays an essential role in processing of precursors to the large ribosomal subunit RNAs |
|
| YNL065W | 5.53 |
AQR1
|
Plasma membrane multidrug transporter of the major facilitator superfamily, confers resistance to short-chain monocarboxylic acids and quinidine; involved in the excretion of excess amino acids |
|
| YLR129W | 5.52 |
DIP2
|
Nucleolar protein, specifically associated with the U3 snoRNA, part of the large ribonucleoprotein complex known as the small subunit (SSU) processome, required for 18S rRNA biogenesis, part of the active pre-rRNA processing complex |
|
| YDR398W | 5.51 |
UTP5
|
Nucleolar protein, component of the small subunit (SSU) processome containing the U3 snoRNA that is involved in processing of pre-18S rRNA |
|
| YIR012W | 5.51 |
SQT1
|
Essential protein involved in a late step of 60S ribosomal subunit assembly or modification; contains multiple WD repeats; interacts with Qsr1p in a two-hybrid assay |
|
| YDR033W | 5.49 |
MRH1
|
Protein that localizes primarily to the plasma membrane, also found at the nuclear envelope; the authentic, non-tagged protein is detected in mitochondria in a phosphorylated state; has similarity to Hsp30p and Yro2p |
|
| YHR070C-A | 5.48 |
Dubious open reading frame unlikely to encode a protein, based on available experimental and comparative sequence data; overlaps the verified gene TRM5/YHR070W |
||
| YCL036W | 5.45 |
GFD2
|
Protein of unknown function, identified as a high-copy suppressor of a dbp5 mutation |
|
| YKL014C | 5.45 |
URB1
|
Nucleolar protein required for the normal accumulation of 25S and 5.8S rRNAs, associated with the 27SA2 pre-ribosomal particle; proposed to be involved in the biogenesis of the 60S ribosomal subunit |
|
| YOR243C | 5.45 |
PUS7
|
Pseudouridine synthase, catalyzes pseudouridylation at position 35 in U2 snRNA, position 13 in cytoplasmic tRNAs, and position 35 in pre-tRNA(Tyr); Asp(256) mutation abolishes activity; conserved in archaea, some bacteria, and vertebrates |
|
| YNL089C | 5.42 |
Dubious open reading frame unlikely to encode a functional protein; almost completely overlaps YNL090W/RHO2 which encodes a small GTPase of the Rho/Rac subfamily of Ras-like proteins |
||
| YIL056W | 5.41 |
VHR1
|
Transcriptional activator, required for the vitamin H-responsive element (VHRE) mediated induction of VHT1 (Vitamin H transporter) and BIO5 (biotin biosynthesis intermediate transporter) in response to low biotin concentrations |
|
| YER001W | 5.40 |
MNN1
|
Alpha-1,3-mannosyltransferase, integral membrane glycoprotein of the Golgi complex, required for addition of alpha1,3-mannose linkages to N-linked and O-linked oligosaccharides, one of five S. cerevisiae proteins of the MNN1 family |
|
| YJL009W | 5.35 |
Dubious open reading frame unlikely to encode a protein, based on available experimental and comparative sequence data; partially overlaps CCT8/YJL008C, a verified gene encoding a subunit of the cytosolic chaperonin Cct ring complex |
||
| YBR244W | 5.35 |
GPX2
|
Phospholipid hydroperoxide glutathione peroxidase induced by glucose starvation that protects cells from phospholipid hydroperoxides and nonphospholipid peroxides during oxidative stress |
|
| YHR052W | 5.35 |
CIC1
|
Essential protein that interacts with proteasome components and has a potential role in proteasome substrate specificity; also copurifies with 66S pre-ribosomal particles |
|
| YDL153C | 5.33 |
SAS10
|
Component of the small (ribosomal) subunit (SSU) processosome required for pre-18S rRNa processing; essential nucleolar protein that, when overproduced, disrupts silencing |
|
| YLL011W | 5.32 |
SOF1
|
Essential protein required for biogenesis of 40S (small) ribosomal subunit; has similarity to the beta subunit of trimeric G-proteins and the splicing factor Prp4p |
|
| YBL092W | 5.31 |
RPL32
|
Protein component of the large (60S) ribosomal subunit, has similarity to rat L32 ribosomal protein; overexpression disrupts telomeric silencing |
|
| YDR279W | 5.30 |
RNH202
|
Ribonuclease H2 subunit, required for RNase H2 activity |
|
| YPL086C | 5.27 |
ELP3
|
Subunit of Elongator complex, which is required for modification of wobble nucleosides in tRNA; exhibits histone acetyltransferase activity that is directed to histones H3 and H4; disruption confers resistance to K. lactis zymotoxin |
|
| YPL239W | 5.25 |
YAR1
|
Cytoplasmic ankyrin-repeat containing protein of unknown function, proposed to link the processes of 40S ribosomal subunit biogenesis and adaptation to osmotic and oxidative stress; expression repressed by heat shock |
|
| YLR363W-A | 5.21 |
Putative protein of unknown function; green fluorescent protein (GFP)-fusion protein localizes to the nucleus |
||
| YDR101C | 5.21 |
ARX1
|
Shuttling pre-60S factor; involved in the biogenesis of ribosomal large subunit biogenesis; interacts directly with Alb1; responsible for Tif6 recycling defects in absence of Rei1; associated with the ribosomal export complex |
|
| YOR206W | 5.20 |
NOC2
|
Protein that forms a nucleolar complex with Mak21p that binds to 90S and 66S pre-ribosomes, as well as a nuclear complex with Noc3p that binds to 66S pre-ribosomes; both complexes mediate intranuclear transport of ribosomal precursors |
|
| YPL043W | 5.19 |
NOP4
|
Nucleolar protein, essential for processing and maturation of 27S pre-rRNA and large ribosomal subunit biogenesis; constituent of 66S pre-ribosomal particles; contains four RNA recognition motifs (RRMs) |
|
| YKL078W | 5.17 |
DHR2
|
Predominantly nucleolar DEAH-box ATP-dependent RNA helicase, required for 18S rRNA synthesis |
|
| YDR450W | 5.15 |
RPS18A
|
Protein component of the small (40S) ribosomal subunit; nearly identical to Rps18Bp and has similarity to E. coli S13 and rat S18 ribosomal proteins |
|
| YBR126W-A | 5.15 |
Dubious ORF unlikely to encode a protein, based on available experimental and comparative sequence data; partially overlaps the dubious ORF YBR126W-B; identified by gene-trapping, microarray analysis, and genome-wide homology searches |
||
| YHR197W | 5.14 |
RIX1
|
Essential component of the Rix1 complex (Rix1p, Ipi1p, Ipi3p) that is required for processing of ITS2 sequences from 35S pre-rRNA; Rix1 complex associates with Mdn1p in pre-60S ribosomal particles |
|
| YER049W | 5.13 |
TPA1
|
Protein of unknown function; interacts with Sup45p (eRF1), Sup35p (eRF3) and Pab1p; has a role in translation termination efficiency, mRNA poly(A) tail length and mRNA stability |
|
| YOR376W-A | 5.13 |
Putative protein of unknown function; identified by fungal homology and RT-PCR |
||
| YOR025W | 5.12 |
HST3
|
Member of the Sir2 family of NAD(+)-dependent protein deacetylases; involved along with Hst4p in telomeric silencing, cell cycle progression, radiation resistance, genomic stability and short-chain fatty acid metabolism |
|
| YHR181W | 5.12 |
SVP26
|
Integral membrane protein of the early Golgi apparatus and endoplasmic reticulum, involved in COP II vesicle transport; may also function to promote retention of proteins in the early Golgi compartment |
|
| YHR169W | 5.10 |
DBP8
|
Putative ATP-dependent RNA helicase of the DEAD-box family involved in biogenesis of the 40S ribosomal subunit |
|
| YLR413W | 5.09 |
Putative protein of unknown function; YLR413W is not an essential gene |
||
| YDR021W | 5.08 |
FAL1
|
Nucleolar protein required for maturation of 18S rRNA, member of the eIF4A subfamily of DEAD-box ATP-dependent RNA helicases |
|
| YNL110C | 5.06 |
NOP15
|
Constituent of 66S pre-ribosomal particles, involved in 60S ribosomal subunit biogenesis; localizes to both nucleolus and cytoplasm |
|
| YGR086C | 5.06 |
PIL1
|
Primary component of eisosomes, which are large immobile cell cortex structures associated with endocytosis; null mutants show activation of Pkc1p/Ypk1p stress resistance pathways; detected in phosphorylated state in mitochondria |
|
| YHR196W | 5.02 |
UTP9
|
Nucleolar protein, component of the small subunit (SSU) processome containing the U3 snoRNA that is involved in processing of pre-18S rRNA |
|
| YJR145C | 5.01 |
RPS4A
|
Protein component of the small (40S) ribosomal subunit; mutation affects 20S pre-rRNA processing; identical to Rps4Bp and has similarity to rat S4 ribosomal protein |
|
| YMR123W | 5.00 |
PKR1
|
V-ATPase assembly factor, functions with other V-ATPase assembly factors in the ER to efficiently assemble the V-ATPase membrane sector (V0); overproduction confers resistance to Pichia farinosa killer toxin |
|
| YBL070C | 4.99 |
Dubious open reading frame unlikely to encode a protein, based on available experimental and comparative sequence data |
||
| YBR118W | 4.96 |
TEF2
|
Translational elongation factor EF-1 alpha; also encoded by TEF1; functions in the binding reaction of aminoacyl-tRNA (AA-tRNA) to ribosomes |
|
| YJL069C | 4.95 |
UTP18
|
Possible U3 snoRNP protein involved in maturation of pre-18S rRNA, based on computational analysis of large-scale protein-protein interaction data |
|
| YJR094W-A | 4.95 |
RPL43B
|
Protein component of the large (60S) ribosomal subunit, identical to Rpl43Ap and has similarity to rat L37a ribosomal protein |
|
| YEL001C | 4.95 |
IRC22
|
Putative protein of unknown function; green fluorescent protein (GFP)-fusion localizes to the ER; YEL001C is non-essential; null mutant displays increased levels of spontaneous Rad52p foci |
|
| YGR200C | 4.93 |
ELP2
|
Subunit of Elongator complex, which is required for modification of wobble nucleosides in tRNA; target of Kluyveromyces lactis zymocin |
|
| YGL171W | 4.92 |
ROK1
|
ATP-dependent RNA helicase of the DEAD box family; required for 18S rRNA synthesis |
|
| YCR016W | 4.92 |
Putative protein of unknown function; green fluorescent protein (GFP)-fusion protein localizes to the nucleolus and nucleus; YCR016W is not an essential gene |
||
| YDR083W | 4.92 |
RRP8
|
Nucleolar protein involved in rRNA processing, pre-rRNA cleavage at site A2; also involved in telomere maintenance; mutation is synthetically lethal with a gar1 mutation |
|
| YDR361C | 4.89 |
BCP1
|
Essential protein involved in nuclear export of Mss4p, which is a lipid kinase that generates phosphatidylinositol 4,5-biphosphate and plays a role in actin cytoskeleton organization and vesicular transport |
|
| YLR154W-C | 4.84 |
TAR1
|
Mitochondrial protein of unknown function, overexpression suppresses an rpo41 mutation affecting mitochondrial RNA polymerase; encoded within the 25S rRNA gene on the opposite strand |
|
| YPL266W | 4.84 |
DIM1
|
Essential 18S rRNA dimethylase (dimethyladenosine transferase), responsible for conserved m6(2)Am6(2)A dimethylation in 3'-terminal loop of 18S rRNA, part of 90S and 40S pre-particles in nucleolus, involved in pre-ribosomal RNA processing |
|
| YHR144C | 4.82 |
DCD1
|
Deoxycytidine monophosphate (dCMP) deaminase required for dCTP and dTTP synthesis; expression is NOT cell cycle regulated |
|
| YHR149C | 4.81 |
SKG6
|
Integral membrane protein that localizes primarily to growing sites such as the bud tip or the cell periphery; potential Cdc28p substrate; Skg6p interacts with Zds1p and Zds2p |
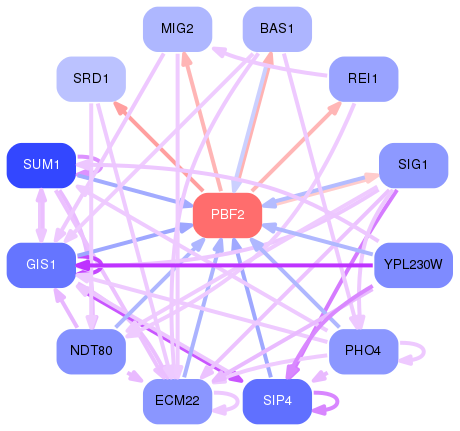
Network of associatons between targets according to the STRING database.

First level regulatory network of PBF2
Gene Ontology Analysis
Gene overrepresentation in biological process category:
| Log-likelihood per target | Total log-likelihood | Term | Description |
|---|---|---|---|
| 11.8 | 35.5 | GO:0000098 | sulfur amino acid catabolic process(GO:0000098) |
| 6.0 | 29.9 | GO:0006177 | GMP biosynthetic process(GO:0006177) |
| 5.9 | 17.8 | GO:0007189 | adenylate cyclase-activating G-protein coupled receptor signaling pathway(GO:0007189) |
| 5.7 | 17.1 | GO:0034310 | ethanol catabolic process(GO:0006068) primary alcohol catabolic process(GO:0034310) |
| 5.1 | 20.2 | GO:0031118 | rRNA pseudouridine synthesis(GO:0031118) |
| 4.3 | 12.9 | GO:0040031 | snRNA pseudouridine synthesis(GO:0031120) snRNA modification(GO:0040031) |
| 4.3 | 12.9 | GO:0009298 | GDP-mannose biosynthetic process(GO:0009298) GDP-mannose metabolic process(GO:0019673) |
| 4.1 | 12.4 | GO:0046083 | purine nucleobase salvage(GO:0043096) adenine metabolic process(GO:0046083) |
| 4.0 | 4.0 | GO:0046037 | GMP metabolic process(GO:0046037) |
| 4.0 | 7.9 | GO:0008612 | peptidyl-lysine modification to peptidyl-hypusine(GO:0008612) |
| 3.8 | 106.5 | GO:0000480 | endonucleolytic cleavage in 5'-ETS of tricistronic rRNA transcript (SSU-rRNA, 5.8S rRNA, LSU-rRNA)(GO:0000480) |
| 3.8 | 15.1 | GO:0043097 | pyrimidine ribonucleotide salvage(GO:0010138) pyrimidine nucleotide salvage(GO:0032262) pyrimidine nucleoside salvage(GO:0043097) UMP salvage(GO:0044206) |
| 3.6 | 119.4 | GO:0000027 | ribosomal large subunit assembly(GO:0000027) |
| 3.6 | 10.7 | GO:0018195 | peptidyl-arginine modification(GO:0018195) peptidyl-arginine methylation(GO:0018216) |
| 3.4 | 162.1 | GO:0042273 | ribosomal large subunit biogenesis(GO:0042273) |
| 3.3 | 13.4 | GO:0035337 | fatty-acyl-CoA metabolic process(GO:0035337) |
| 3.3 | 9.9 | GO:0071049 | nuclear retention of pre-mRNA with aberrant 3'-ends at the site of transcription(GO:0071049) |
| 3.2 | 12.9 | GO:0031167 | rRNA methylation(GO:0031167) |
| 3.2 | 57.5 | GO:0042790 | transcription of nuclear large rRNA transcript from RNA polymerase I promoter(GO:0042790) |
| 3.1 | 9.2 | GO:0009209 | CTP biosynthetic process(GO:0006241) pyrimidine ribonucleoside triphosphate metabolic process(GO:0009208) pyrimidine ribonucleoside triphosphate biosynthetic process(GO:0009209) CTP metabolic process(GO:0046036) |
| 2.9 | 8.7 | GO:0033559 | unsaturated fatty acid biosynthetic process(GO:0006636) unsaturated fatty acid metabolic process(GO:0033559) |
| 2.8 | 28.4 | GO:0000056 | ribosomal small subunit export from nucleus(GO:0000056) |
| 2.8 | 31.1 | GO:0006817 | phosphate ion transport(GO:0006817) |
| 2.7 | 49.4 | GO:0009304 | tRNA transcription(GO:0009304) tRNA transcription from RNA polymerase III promoter(GO:0042797) |
| 2.5 | 144.7 | GO:0000462 | maturation of SSU-rRNA from tricistronic rRNA transcript (SSU-rRNA, 5.8S rRNA, LSU-rRNA)(GO:0000462) |
| 2.3 | 55.5 | GO:0000054 | ribosomal subunit export from nucleus(GO:0000054) ribosome localization(GO:0033750) establishment of ribosome localization(GO:0033753) |
| 2.3 | 40.8 | GO:0030488 | tRNA methylation(GO:0030488) |
| 2.2 | 6.7 | GO:0034473 | U1 snRNA 3'-end processing(GO:0034473) |
| 2.1 | 6.4 | GO:0045901 | positive regulation of translational elongation(GO:0045901) |
| 2.1 | 8.4 | GO:0090338 | regulation of formin-nucleated actin cable assembly(GO:0090337) positive regulation of formin-nucleated actin cable assembly(GO:0090338) |
| 2.1 | 14.5 | GO:0043137 | DNA replication, removal of RNA primer(GO:0043137) |
| 2.1 | 8.3 | GO:0031057 | negative regulation of histone modification(GO:0031057) |
| 2.1 | 2.1 | GO:0031590 | wybutosine metabolic process(GO:0031590) wybutosine biosynthetic process(GO:0031591) |
| 2.1 | 172.7 | GO:0006364 | rRNA processing(GO:0006364) |
| 2.0 | 6.1 | GO:0018206 | N-terminal peptidyl-methionine acetylation(GO:0017196) peptidyl-methionine modification(GO:0018206) |
| 1.9 | 7.6 | GO:0042780 | tRNA 3'-end processing(GO:0042780) |
| 1.9 | 9.4 | GO:0009098 | leucine biosynthetic process(GO:0009098) |
| 1.8 | 5.5 | GO:0031384 | regulation of initiation of mating projection growth(GO:0031384) |
| 1.8 | 14.7 | GO:0000376 | Group I intron splicing(GO:0000372) RNA splicing, via transesterification reactions with guanosine as nucleophile(GO:0000376) |
| 1.8 | 5.4 | GO:0009186 | deoxyribonucleoside diphosphate metabolic process(GO:0009186) |
| 1.7 | 6.7 | GO:0000296 | spermine transport(GO:0000296) |
| 1.6 | 9.9 | GO:0009099 | valine biosynthetic process(GO:0009099) |
| 1.6 | 4.8 | GO:0009219 | deoxyribonucleoside monophosphate biosynthetic process(GO:0009157) deoxyribonucleoside monophosphate metabolic process(GO:0009162) pyrimidine deoxyribonucleoside monophosphate metabolic process(GO:0009176) pyrimidine deoxyribonucleoside monophosphate biosynthetic process(GO:0009177) pyrimidine deoxyribonucleotide metabolic process(GO:0009219) pyrimidine deoxyribonucleotide biosynthetic process(GO:0009221) 2'-deoxyribonucleotide biosynthetic process(GO:0009265) 2'-deoxyribonucleotide metabolic process(GO:0009394) deoxyribose phosphate biosynthetic process(GO:0046385) |
| 1.6 | 6.4 | GO:0014070 | response to organic cyclic compound(GO:0014070) response to cycloheximide(GO:0046898) |
| 1.6 | 10.9 | GO:1902707 | glucose catabolic process(GO:0006007) glycolytic fermentation to ethanol(GO:0019655) glycolytic fermentation(GO:0019660) hexose catabolic process to ethanol(GO:1902707) |
| 1.5 | 4.6 | GO:0046900 | tetrahydrofolylpolyglutamate metabolic process(GO:0046900) tetrahydrofolylpolyglutamate biosynthetic process(GO:0046901) |
| 1.5 | 6.1 | GO:0070070 | proton-transporting V-type ATPase complex assembly(GO:0070070) vacuolar proton-transporting V-type ATPase complex assembly(GO:0070072) |
| 1.5 | 5.9 | GO:0006072 | glycerol-3-phosphate metabolic process(GO:0006072) |
| 1.5 | 5.9 | GO:0009423 | chorismate biosynthetic process(GO:0009423) |
| 1.5 | 7.4 | GO:0006015 | 5-phosphoribose 1-diphosphate biosynthetic process(GO:0006015) 5-phosphoribose 1-diphosphate metabolic process(GO:0046391) |
| 1.5 | 5.9 | GO:0046500 | S-adenosylmethionine metabolic process(GO:0046500) |
| 1.5 | 4.4 | GO:0006529 | asparagine biosynthetic process(GO:0006529) |
| 1.5 | 4.4 | GO:0015740 | sulfate transport(GO:0008272) C4-dicarboxylate transport(GO:0015740) |
| 1.5 | 1.5 | GO:0032785 | negative regulation of DNA-templated transcription, elongation(GO:0032785) |
| 1.4 | 7.1 | GO:0017182 | peptidyl-diphthamide metabolic process(GO:0017182) peptidyl-diphthamide biosynthetic process from peptidyl-histidine(GO:0017183) |
| 1.4 | 7.0 | GO:0070814 | hydrogen sulfide metabolic process(GO:0070813) hydrogen sulfide biosynthetic process(GO:0070814) |
| 1.3 | 3.9 | GO:0000028 | ribosomal small subunit assembly(GO:0000028) |
| 1.3 | 7.7 | GO:0042274 | ribosomal small subunit biogenesis(GO:0042274) |
| 1.3 | 3.8 | GO:0006567 | threonine catabolic process(GO:0006567) |
| 1.3 | 1.3 | GO:0032447 | protein urmylation(GO:0032447) |
| 1.2 | 4.9 | GO:0002943 | tRNA dihydrouridine synthesis(GO:0002943) |
| 1.2 | 4.9 | GO:0031565 | obsolete cytokinesis checkpoint(GO:0031565) |
| 1.1 | 4.5 | GO:1900434 | filamentous growth of a population of unicellular organisms in response to starvation(GO:0036170) regulation of filamentous growth of a population of unicellular organisms in response to starvation(GO:1900434) positive regulation of filamentous growth of a population of unicellular organisms in response to starvation(GO:1900436) |
| 1.1 | 6.6 | GO:0006491 | N-glycan processing(GO:0006491) |
| 1.1 | 3.3 | GO:0046416 | D-amino acid metabolic process(GO:0046416) |
| 1.1 | 6.5 | GO:0070941 | eisosome assembly(GO:0070941) |
| 1.1 | 2.2 | GO:0070525 | tRNA threonylcarbamoyladenosine metabolic process(GO:0070525) |
| 1.0 | 106.2 | GO:0002181 | cytoplasmic translation(GO:0002181) |
| 1.0 | 20.7 | GO:0002098 | tRNA wobble base modification(GO:0002097) tRNA wobble uridine modification(GO:0002098) |
| 0.9 | 6.5 | GO:0042938 | dipeptide transport(GO:0042938) |
| 0.9 | 3.7 | GO:0006657 | CDP-choline pathway(GO:0006657) |
| 0.9 | 3.6 | GO:0042710 | biofilm formation(GO:0042710) |
| 0.9 | 0.9 | GO:0061418 | regulation of transcription from RNA polymerase II promoter in response to hypoxia(GO:0061418) |
| 0.8 | 5.9 | GO:0010696 | positive regulation of spindle pole body separation(GO:0010696) |
| 0.8 | 4.8 | GO:0071267 | L-methionine biosynthetic process from methylthioadenosine(GO:0019509) amino acid salvage(GO:0043102) L-methionine salvage(GO:0071267) |
| 0.8 | 5.4 | GO:0006855 | drug transmembrane transport(GO:0006855) |
| 0.7 | 3.0 | GO:0071326 | cellular glucose homeostasis(GO:0001678) carbohydrate mediated signaling(GO:0009756) hexose mediated signaling(GO:0009757) sugar mediated signaling pathway(GO:0010182) glucose mediated signaling pathway(GO:0010255) carbohydrate homeostasis(GO:0033500) glucose homeostasis(GO:0042593) cellular response to monosaccharide stimulus(GO:0071326) cellular response to hexose stimulus(GO:0071331) cellular response to glucose stimulus(GO:0071333) |
| 0.7 | 7.3 | GO:0006415 | translational termination(GO:0006415) |
| 0.7 | 3.6 | GO:0034503 | protein localization to nucleolar rDNA repeats(GO:0034503) |
| 0.7 | 7.0 | GO:0051231 | mitotic spindle elongation(GO:0000022) spindle elongation(GO:0051231) |
| 0.7 | 2.8 | GO:0048313 | Golgi inheritance(GO:0048313) |
| 0.7 | 2.0 | GO:0042255 | ribosome assembly(GO:0042255) |
| 0.6 | 1.9 | GO:0019676 | ammonia assimilation cycle(GO:0019676) |
| 0.6 | 4.4 | GO:0031365 | N-terminal protein amino acid modification(GO:0031365) |
| 0.6 | 1.3 | GO:0034472 | snRNA processing(GO:0016180) snRNA 3'-end processing(GO:0034472) nuclear polyadenylation-dependent mRNA catabolic process(GO:0071042) polyadenylation-dependent mRNA catabolic process(GO:0071047) |
| 0.6 | 1.2 | GO:0071038 | tRNA catabolic process(GO:0016078) nuclear polyadenylation-dependent tRNA catabolic process(GO:0071038) |
| 0.6 | 3.1 | GO:0042435 | tryptophan biosynthetic process(GO:0000162) indole-containing compound biosynthetic process(GO:0042435) indolalkylamine biosynthetic process(GO:0046219) |
| 0.6 | 2.4 | GO:0006596 | polyamine biosynthetic process(GO:0006596) |
| 0.6 | 2.4 | GO:0010688 | negative regulation of ribosomal protein gene transcription from RNA polymerase II promoter(GO:0010688) |
| 0.6 | 5.8 | GO:0045053 | protein retention in Golgi apparatus(GO:0045053) |
| 0.6 | 2.3 | GO:0048279 | vesicle fusion with endoplasmic reticulum(GO:0048279) |
| 0.6 | 0.6 | GO:0006528 | asparagine metabolic process(GO:0006528) |
| 0.6 | 1.7 | GO:0043171 | peptide catabolic process(GO:0043171) |
| 0.6 | 1.7 | GO:0051083 | 'de novo' cotranslational protein folding(GO:0051083) |
| 0.6 | 1.1 | GO:0031684 | heterotrimeric G-protein complex cycle(GO:0031684) |
| 0.6 | 2.2 | GO:0006285 | base-excision repair, AP site formation(GO:0006285) |
| 0.6 | 1.7 | GO:0006003 | fructose 2,6-bisphosphate metabolic process(GO:0006003) |
| 0.6 | 4.5 | GO:0016559 | peroxisome fission(GO:0016559) |
| 0.6 | 15.5 | GO:0006414 | translational elongation(GO:0006414) |
| 0.5 | 2.1 | GO:0009240 | isopentenyl diphosphate biosynthetic process(GO:0009240) isopentenyl diphosphate biosynthetic process, mevalonate pathway(GO:0019287) isopentenyl diphosphate metabolic process(GO:0046490) |
| 0.5 | 1.1 | GO:0044209 | AMP salvage(GO:0044209) |
| 0.5 | 1.6 | GO:0045948 | positive regulation of translational initiation(GO:0045948) |
| 0.5 | 2.1 | GO:0045048 | protein insertion into ER membrane(GO:0045048) |
| 0.5 | 3.6 | GO:0046501 | protoporphyrinogen IX biosynthetic process(GO:0006782) protoporphyrinogen IX metabolic process(GO:0046501) |
| 0.5 | 3.0 | GO:0035437 | protein retention in ER lumen(GO:0006621) maintenance of protein localization in endoplasmic reticulum(GO:0035437) |
| 0.5 | 4.0 | GO:0042219 | cellular modified amino acid catabolic process(GO:0042219) |
| 0.5 | 5.4 | GO:0006446 | regulation of translational initiation(GO:0006446) |
| 0.5 | 0.5 | GO:0032261 | purine nucleotide salvage(GO:0032261) |
| 0.4 | 2.2 | GO:0055074 | cellular calcium ion homeostasis(GO:0006874) calcium ion homeostasis(GO:0055074) |
| 0.4 | 2.2 | GO:0032988 | ribonucleoprotein complex disassembly(GO:0032988) |
| 0.4 | 2.1 | GO:0046655 | folic acid metabolic process(GO:0046655) folic acid biosynthetic process(GO:0046656) |
| 0.4 | 2.1 | GO:0070898 | RNA polymerase III transcriptional preinitiation complex assembly(GO:0070898) |
| 0.4 | 0.8 | GO:0007000 | nucleolus organization(GO:0007000) |
| 0.4 | 1.2 | GO:0070827 | chromatin maintenance(GO:0070827) |
| 0.4 | 1.6 | GO:0006566 | threonine metabolic process(GO:0006566) threonine biosynthetic process(GO:0009088) |
| 0.4 | 13.8 | GO:0008033 | tRNA processing(GO:0008033) |
| 0.4 | 1.6 | GO:0030030 | cell projection organization(GO:0030030) cell projection assembly(GO:0030031) |
| 0.4 | 4.0 | GO:0001402 | signal transduction involved in filamentous growth(GO:0001402) |
| 0.4 | 1.2 | GO:0033241 | regulation of cellular amine catabolic process(GO:0033241) |
| 0.4 | 1.2 | GO:0038032 | termination of signal transduction(GO:0023021) termination of G-protein coupled receptor signaling pathway(GO:0038032) |
| 0.4 | 1.1 | GO:0006114 | glycerol biosynthetic process(GO:0006114) alditol biosynthetic process(GO:0019401) |
| 0.4 | 7.5 | GO:0046785 | microtubule nucleation(GO:0007020) microtubule polymerization(GO:0046785) |
| 0.4 | 0.7 | GO:0042992 | negative regulation of transcription factor import into nucleus(GO:0042992) |
| 0.4 | 2.5 | GO:0006641 | neutral lipid metabolic process(GO:0006638) acylglycerol metabolic process(GO:0006639) triglyceride metabolic process(GO:0006641) |
| 0.4 | 4.3 | GO:0030011 | maintenance of cell polarity(GO:0030011) |
| 0.4 | 2.5 | GO:0006672 | ceramide metabolic process(GO:0006672) ceramide biosynthetic process(GO:0046513) |
| 0.4 | 2.8 | GO:0015833 | peptide transport(GO:0015833) |
| 0.4 | 1.4 | GO:0042559 | folic acid-containing compound biosynthetic process(GO:0009396) pteridine-containing compound biosynthetic process(GO:0042559) |
| 0.4 | 1.8 | GO:0006658 | phosphatidylserine metabolic process(GO:0006658) |
| 0.3 | 2.0 | GO:0009231 | riboflavin metabolic process(GO:0006771) riboflavin biosynthetic process(GO:0009231) |
| 0.3 | 0.3 | GO:0006363 | termination of RNA polymerase I transcription(GO:0006363) |
| 0.3 | 8.1 | GO:0016129 | ergosterol biosynthetic process(GO:0006696) phytosteroid biosynthetic process(GO:0016129) cellular alcohol biosynthetic process(GO:0044108) cellular lipid biosynthetic process(GO:0097384) |
| 0.3 | 1.0 | GO:0090399 | replicative senescence(GO:0090399) |
| 0.3 | 0.3 | GO:0048211 | Golgi vesicle docking(GO:0048211) |
| 0.3 | 3.2 | GO:0071966 | fungal-type cell wall chitin biosynthetic process(GO:0034221) fungal-type cell wall polysaccharide biosynthetic process(GO:0051278) fungal-type cell wall polysaccharide metabolic process(GO:0071966) |
| 0.3 | 26.2 | GO:0006913 | nucleocytoplasmic transport(GO:0006913) |
| 0.3 | 4.0 | GO:0000011 | vacuole inheritance(GO:0000011) |
| 0.3 | 0.9 | GO:0009097 | isoleucine biosynthetic process(GO:0009097) |
| 0.3 | 1.2 | GO:0055129 | L-proline biosynthetic process(GO:0055129) |
| 0.3 | 5.4 | GO:0016575 | histone deacetylation(GO:0016575) |
| 0.3 | 1.8 | GO:0043457 | regulation of cellular respiration(GO:0043457) |
| 0.3 | 0.5 | GO:0046184 | pyridoxal phosphate metabolic process(GO:0042822) pyridoxal phosphate biosynthetic process(GO:0042823) aldehyde biosynthetic process(GO:0046184) |
| 0.3 | 4.9 | GO:0006334 | nucleosome assembly(GO:0006334) |
| 0.3 | 1.0 | GO:0031507 | heterochromatin assembly(GO:0031507) |
| 0.3 | 1.5 | GO:0006768 | biotin metabolic process(GO:0006768) biotin biosynthetic process(GO:0009102) |
| 0.2 | 2.5 | GO:0009303 | rRNA transcription(GO:0009303) |
| 0.2 | 2.2 | GO:0045039 | protein import into mitochondrial inner membrane(GO:0045039) |
| 0.2 | 1.9 | GO:0006189 | 'de novo' IMP biosynthetic process(GO:0006189) |
| 0.2 | 2.2 | GO:0007109 | obsolete cytokinesis, completion of separation(GO:0007109) |
| 0.2 | 0.2 | GO:0006952 | defense response(GO:0006952) |
| 0.2 | 1.2 | GO:0070124 | mitochondrial translational initiation(GO:0070124) |
| 0.2 | 1.1 | GO:0006032 | aminoglycan catabolic process(GO:0006026) chitin catabolic process(GO:0006032) amino sugar catabolic process(GO:0046348) glucosamine-containing compound catabolic process(GO:1901072) |
| 0.2 | 1.1 | GO:0016255 | attachment of GPI anchor to protein(GO:0016255) |
| 0.2 | 0.4 | GO:0033262 | regulation of nuclear cell cycle DNA replication(GO:0033262) |
| 0.2 | 1.8 | GO:0008615 | pyridoxine metabolic process(GO:0008614) pyridoxine biosynthetic process(GO:0008615) vitamin B6 metabolic process(GO:0042816) vitamin B6 biosynthetic process(GO:0042819) |
| 0.2 | 5.3 | GO:0006885 | regulation of pH(GO:0006885) |
| 0.2 | 1.7 | GO:0006816 | calcium ion transport(GO:0006816) |
| 0.2 | 5.8 | GO:0006418 | tRNA aminoacylation for protein translation(GO:0006418) |
| 0.2 | 0.8 | GO:0006734 | NADH metabolic process(GO:0006734) |
| 0.2 | 1.8 | GO:0006268 | DNA unwinding involved in DNA replication(GO:0006268) |
| 0.2 | 0.4 | GO:0016578 | histone deubiquitination(GO:0016578) |
| 0.2 | 1.8 | GO:0008298 | intracellular mRNA localization(GO:0008298) |
| 0.2 | 3.4 | GO:0006890 | retrograde vesicle-mediated transport, Golgi to ER(GO:0006890) |
| 0.2 | 1.3 | GO:0006616 | SRP-dependent cotranslational protein targeting to membrane, translocation(GO:0006616) |
| 0.2 | 2.3 | GO:0007009 | plasma membrane organization(GO:0007009) |
| 0.2 | 0.7 | GO:0006999 | nuclear pore organization(GO:0006999) |
| 0.2 | 2.1 | GO:0007120 | axial cellular bud site selection(GO:0007120) |
| 0.2 | 2.7 | GO:0000184 | nuclear-transcribed mRNA catabolic process, nonsense-mediated decay(GO:0000184) |
| 0.2 | 0.5 | GO:0006037 | cell wall chitin metabolic process(GO:0006037) |
| 0.2 | 4.7 | GO:0006487 | protein N-linked glycosylation(GO:0006487) |
| 0.2 | 0.6 | GO:0007535 | donor selection(GO:0007535) |
| 0.2 | 0.6 | GO:0035999 | tetrahydrofolate interconversion(GO:0035999) |
| 0.2 | 0.9 | GO:0046015 | regulation of transcription by glucose(GO:0046015) |
| 0.1 | 0.3 | GO:2000756 | regulation of histone acetylation(GO:0035065) positive regulation of histone acetylation(GO:0035066) regulation of protein acetylation(GO:1901983) positive regulation of protein acetylation(GO:1901985) regulation of peptidyl-lysine acetylation(GO:2000756) positive regulation of peptidyl-lysine acetylation(GO:2000758) |
| 0.1 | 0.9 | GO:0042538 | hyperosmotic salinity response(GO:0042538) |
| 0.1 | 1.3 | GO:0007121 | bipolar cellular bud site selection(GO:0007121) |
| 0.1 | 0.5 | GO:0016036 | cellular response to phosphate starvation(GO:0016036) |
| 0.1 | 0.7 | GO:0000087 | mitotic M phase(GO:0000087) M phase(GO:0000279) |
| 0.1 | 1.1 | GO:0052803 | histidine biosynthetic process(GO:0000105) histidine metabolic process(GO:0006547) imidazole-containing compound metabolic process(GO:0052803) |
| 0.1 | 1.9 | GO:0010499 | proteasomal ubiquitin-independent protein catabolic process(GO:0010499) |
| 0.1 | 0.5 | GO:0048280 | vesicle fusion with Golgi apparatus(GO:0048280) |
| 0.1 | 0.9 | GO:0000350 | generation of catalytic spliceosome for second transesterification step(GO:0000350) |
| 0.1 | 0.9 | GO:0006797 | polyphosphate metabolic process(GO:0006797) |
| 0.1 | 2.0 | GO:0051668 | localization within membrane(GO:0051668) |
| 0.1 | 0.9 | GO:0046351 | trehalose biosynthetic process(GO:0005992) oligosaccharide biosynthetic process(GO:0009312) disaccharide biosynthetic process(GO:0046351) |
| 0.1 | 1.8 | GO:0072384 | establishment of localization by movement along microtubule(GO:0010970) nuclear migration along microtubule(GO:0030473) organelle transport along microtubule(GO:0072384) |
| 0.1 | 0.6 | GO:0016584 | nucleosome positioning(GO:0016584) |
| 0.1 | 0.8 | GO:0051648 | vesicle targeting(GO:0006903) vesicle localization(GO:0051648) establishment of vesicle localization(GO:0051650) |
| 0.1 | 0.2 | GO:0045764 | positive regulation of cellular amino acid metabolic process(GO:0045764) |
| 0.1 | 2.8 | GO:0045324 | late endosome to vacuole transport(GO:0045324) |
| 0.1 | 0.3 | GO:0001015 | snoRNA transcription from an RNA polymerase II promoter(GO:0001015) |
| 0.1 | 0.3 | GO:1901977 | regulation of cell cycle checkpoint(GO:1901976) negative regulation of cell cycle checkpoint(GO:1901977) regulation of DNA damage checkpoint(GO:2000001) negative regulation of DNA damage checkpoint(GO:2000002) negative regulation of response to DNA damage stimulus(GO:2001021) |
| 0.1 | 1.0 | GO:0000289 | nuclear-transcribed mRNA poly(A) tail shortening(GO:0000289) |
| 0.1 | 0.2 | GO:0015781 | pyrimidine nucleotide-sugar transport(GO:0015781) UDP-glucose transport(GO:0015786) |
| 0.1 | 0.5 | GO:0000707 | meiotic DNA recombinase assembly(GO:0000707) DNA recombinase assembly(GO:0000730) |
| 0.1 | 0.1 | GO:0043966 | histone H3 acetylation(GO:0043966) histone H3-K9 acetylation(GO:0043970) histone H3-K14 acetylation(GO:0044154) histone H3-K9 modification(GO:0061647) |
| 0.1 | 1.5 | GO:0000245 | spliceosomal complex assembly(GO:0000245) |
| 0.1 | 0.6 | GO:0032042 | mitochondrial DNA metabolic process(GO:0032042) |
| 0.1 | 0.3 | GO:0006654 | phosphatidic acid biosynthetic process(GO:0006654) phosphatidic acid metabolic process(GO:0046473) |
| 0.1 | 0.7 | GO:0016233 | telomere capping(GO:0016233) |
| 0.1 | 0.4 | GO:0090158 | regulation of phosphatidylinositol dephosphorylation(GO:0060304) endoplasmic reticulum membrane organization(GO:0090158) |
| 0.1 | 0.9 | GO:0016925 | protein sumoylation(GO:0016925) |
| 0.1 | 0.6 | GO:0007323 | peptide pheromone maturation(GO:0007323) |
| 0.1 | 0.4 | GO:0000755 | cytogamy(GO:0000755) |
| 0.1 | 0.4 | GO:0006627 | protein processing involved in protein targeting to mitochondrion(GO:0006627) |
| 0.1 | 0.1 | GO:0016320 | endoplasmic reticulum membrane fusion(GO:0016320) ribophagy(GO:0034517) mitotic spindle disassembly(GO:0051228) spindle disassembly(GO:0051230) |
| 0.1 | 0.6 | GO:0006493 | protein O-linked glycosylation(GO:0006493) |
| 0.1 | 0.9 | GO:0001100 | negative regulation of exit from mitosis(GO:0001100) |
| 0.1 | 1.4 | GO:0006896 | Golgi to vacuole transport(GO:0006896) |
| 0.1 | 0.7 | GO:0006515 | misfolded or incompletely synthesized protein catabolic process(GO:0006515) |
| 0.1 | 1.2 | GO:0006891 | intra-Golgi vesicle-mediated transport(GO:0006891) |
| 0.1 | 1.0 | GO:0006915 | apoptotic process(GO:0006915) cell death(GO:0008219) programmed cell death(GO:0012501) |
| 0.1 | 0.5 | GO:0034314 | Arp2/3 complex-mediated actin nucleation(GO:0034314) |
| 0.1 | 1.6 | GO:0043547 | positive regulation of GTPase activity(GO:0043547) |
| 0.1 | 0.2 | GO:0034975 | protein folding in endoplasmic reticulum(GO:0034975) |
| 0.0 | 0.0 | GO:0030307 | positive regulation of cell growth(GO:0030307) positive regulation of pseudohyphal growth by positive regulation of transcription from RNA polymerase II promoter(GO:1900461) positive regulation of pseudohyphal growth(GO:2000222) |
| 0.0 | 0.4 | GO:0031110 | regulation of microtubule polymerization or depolymerization(GO:0031110) |
| 0.0 | 0.3 | GO:0051177 | synaptonemal complex assembly(GO:0007130) meiotic sister chromatid cohesion(GO:0051177) synaptonemal complex organization(GO:0070193) |
| 0.0 | 0.1 | GO:0015939 | pantothenate metabolic process(GO:0015939) pantothenate biosynthetic process(GO:0015940) |
| 0.0 | 0.2 | GO:0000733 | DNA strand renaturation(GO:0000733) |
| 0.0 | 0.3 | GO:0006614 | cotranslational protein targeting to membrane(GO:0006613) SRP-dependent cotranslational protein targeting to membrane(GO:0006614) |
| 0.0 | 0.1 | GO:0006898 | receptor-mediated endocytosis(GO:0006898) |
| 0.0 | 0.4 | GO:0071173 | mitotic spindle assembly checkpoint(GO:0007094) spindle assembly checkpoint(GO:0071173) |
| 0.0 | 0.6 | GO:0045454 | cell redox homeostasis(GO:0045454) |
| 0.0 | 0.4 | GO:0044848 | biological phase(GO:0044848) |
| 0.0 | 0.8 | GO:0070897 | RNA polymerase II transcriptional preinitiation complex assembly(GO:0051123) DNA-templated transcriptional preinitiation complex assembly(GO:0070897) |
| 0.0 | 0.0 | GO:0000117 | regulation of transcription involved in G2/M transition of mitotic cell cycle(GO:0000117) positive regulation of transcription involved in G2/M transition of mitotic cell cycle(GO:0090282) |
| 0.0 | 0.6 | GO:0006888 | ER to Golgi vesicle-mediated transport(GO:0006888) |
| 0.0 | 0.1 | GO:0009306 | protein secretion(GO:0009306) |
| 0.0 | 0.1 | GO:0070071 | proton-transporting two-sector ATPase complex assembly(GO:0070071) |
| 0.0 | 0.2 | GO:0051666 | actin cortical patch localization(GO:0051666) |
| 0.0 | 0.0 | GO:0031087 | deadenylation-independent decapping of nuclear-transcribed mRNA(GO:0031087) |
| 0.0 | 0.0 | GO:0006784 | heme a biosynthetic process(GO:0006784) heme a metabolic process(GO:0046160) |
| 0.0 | 0.1 | GO:0000920 | cell separation after cytokinesis(GO:0000920) |
| 0.0 | 0.1 | GO:0030472 | mitotic spindle organization in nucleus(GO:0030472) |
| 0.0 | 0.1 | GO:0009249 | protein lipoylation(GO:0009249) |
Gene overrepresentation in cellular component category:
| Log-likelihood per target | Total log-likelihood | Term | Description |
|---|---|---|---|
| 7.6 | 22.8 | GO:0070545 | PeBoW complex(GO:0070545) |
| 5.3 | 26.7 | GO:0030689 | Noc complex(GO:0030689) |
| 5.2 | 72.3 | GO:0005736 | DNA-directed RNA polymerase I complex(GO:0005736) |
| 5.1 | 20.6 | GO:0072588 | box H/ACA snoRNP complex(GO:0031429) box H/ACA RNP complex(GO:0072588) |
| 4.8 | 14.4 | GO:0032299 | ribonuclease H2 complex(GO:0032299) |
| 4.6 | 18.5 | GO:0031428 | box C/D snoRNP complex(GO:0031428) |
| 4.6 | 46.0 | GO:0030688 | preribosome, small subunit precursor(GO:0030688) |
| 4.4 | 26.6 | GO:0034388 | Pwp2p-containing subcomplex of 90S preribosome(GO:0034388) |
| 4.3 | 178.8 | GO:0030687 | preribosome, large subunit precursor(GO:0030687) |
| 4.2 | 12.7 | GO:0034457 | Mpp10 complex(GO:0034457) |
| 3.7 | 21.9 | GO:0034455 | t-UTP complex(GO:0034455) |
| 3.4 | 75.0 | GO:0032040 | small-subunit processome(GO:0032040) |
| 3.2 | 15.9 | GO:0005853 | eukaryotic translation elongation factor 1 complex(GO:0005853) |
| 2.8 | 11.3 | GO:0070860 | RNA polymerase I core factor complex(GO:0070860) |
| 2.7 | 8.1 | GO:0097344 | Rix1 complex(GO:0097344) |
| 2.4 | 9.7 | GO:0042788 | polysomal ribosome(GO:0042788) |
| 2.4 | 11.9 | GO:0043527 | tRNA methyltransferase complex(GO:0043527) |
| 2.3 | 6.8 | GO:0008275 | gamma-tubulin small complex, spindle pole body(GO:0000928) gamma-tubulin complex(GO:0000930) gamma-tubulin small complex(GO:0008275) |
| 2.2 | 22.4 | GO:0005666 | DNA-directed RNA polymerase III complex(GO:0005666) |
| 2.1 | 8.6 | GO:0034448 | EGO complex(GO:0034448) |
| 2.1 | 82.5 | GO:0030684 | preribosome(GO:0030684) |
| 2.0 | 5.9 | GO:0009331 | glycerol-3-phosphate dehydrogenase complex(GO:0009331) |
| 2.0 | 260.2 | GO:0005730 | nucleolus(GO:0005730) |
| 1.5 | 9.2 | GO:0033588 | Elongator holoenzyme complex(GO:0033588) |
| 1.4 | 102.0 | GO:0022625 | cytosolic large ribosomal subunit(GO:0022625) |
| 1.3 | 5.4 | GO:0005971 | ribonucleoside-diphosphate reductase complex(GO:0005971) |
| 1.3 | 5.3 | GO:0031315 | extrinsic component of mitochondrial outer membrane(GO:0031315) |
| 1.2 | 9.9 | GO:0031414 | N-terminal protein acetyltransferase complex(GO:0031414) |
| 1.1 | 5.4 | GO:0030478 | actin cap(GO:0030478) |
| 1.1 | 5.3 | GO:0005851 | eukaryotic translation initiation factor 2B complex(GO:0005851) |
| 1.0 | 2.9 | GO:0042719 | mitochondrial intermembrane space protein transporter complex(GO:0042719) |
| 0.9 | 3.6 | GO:0032160 | septin filament array(GO:0032160) |
| 0.9 | 2.6 | GO:0035649 | Nrd1 complex(GO:0035649) |
| 0.8 | 3.4 | GO:0005946 | alpha,alpha-trehalose-phosphate synthase complex (UDP-forming)(GO:0005946) |
| 0.8 | 2.5 | GO:0000176 | nuclear exosome (RNase complex)(GO:0000176) |
| 0.8 | 2.4 | GO:0097038 | perinuclear endoplasmic reticulum(GO:0097038) |
| 0.8 | 2.4 | GO:0051286 | cell tip(GO:0051286) |
| 0.8 | 4.6 | GO:0005880 | nuclear microtubule(GO:0005880) |
| 0.7 | 2.1 | GO:0043541 | UDP-N-acetylglucosamine transferase complex(GO:0043541) |
| 0.7 | 2.1 | GO:0043529 | GET complex(GO:0043529) |
| 0.7 | 2.0 | GO:0005850 | eukaryotic translation initiation factor 2 complex(GO:0005850) |
| 0.6 | 1.9 | GO:0017102 | methionyl glutamyl tRNA synthetase complex(GO:0017102) |
| 0.6 | 2.5 | GO:0033597 | mitotic checkpoint complex(GO:0033597) |
| 0.6 | 22.5 | GO:0022627 | cytosolic small ribosomal subunit(GO:0022627) |
| 0.6 | 1.9 | GO:0070762 | nuclear pore transmembrane ring(GO:0070762) |
| 0.6 | 6.8 | GO:0005940 | septin ring(GO:0005940) |
| 0.6 | 8.3 | GO:0022626 | cytosolic ribosome(GO:0022626) |
| 0.6 | 1.7 | GO:0005854 | nascent polypeptide-associated complex(GO:0005854) |
| 0.5 | 4.4 | GO:0042597 | periplasmic space(GO:0042597) |
| 0.5 | 3.7 | GO:0051233 | spindle midzone(GO:0051233) |
| 0.5 | 3.6 | GO:0000221 | vacuolar proton-transporting V-type ATPase, V1 domain(GO:0000221) proton-transporting V-type ATPase, V1 domain(GO:0033180) |
| 0.5 | 0.5 | GO:0005688 | U6 snRNP(GO:0005688) |
| 0.5 | 5.9 | GO:0005637 | nuclear inner membrane(GO:0005637) |
| 0.5 | 2.9 | GO:0032126 | eisosome(GO:0032126) |
| 0.5 | 2.4 | GO:0016281 | eukaryotic translation initiation factor 4F complex(GO:0016281) |
| 0.5 | 1.4 | GO:0005845 | mRNA cap binding complex(GO:0005845) |
| 0.4 | 1.8 | GO:0005641 | nuclear envelope lumen(GO:0005641) |
| 0.4 | 1.8 | GO:0005834 | heterotrimeric G-protein complex(GO:0005834) |
| 0.4 | 2.2 | GO:0000408 | EKC/KEOPS complex(GO:0000408) |
| 0.4 | 3.2 | GO:0030126 | COPI vesicle coat(GO:0030126) |
| 0.4 | 2.0 | GO:0016272 | prefoldin complex(GO:0016272) |
| 0.4 | 2.2 | GO:0070772 | PAS complex(GO:0070772) |
| 0.4 | 1.1 | GO:0042406 | extrinsic component of endoplasmic reticulum membrane(GO:0042406) |
| 0.3 | 7.6 | GO:0005844 | polysome(GO:0005844) |
| 0.3 | 1.0 | GO:0032301 | MutSalpha complex(GO:0032301) |
| 0.3 | 4.7 | GO:0098857 | membrane raft(GO:0045121) membrane microdomain(GO:0098857) |
| 0.3 | 2.3 | GO:0000346 | transcription export complex(GO:0000346) |
| 0.3 | 7.3 | GO:0031228 | integral component of Golgi membrane(GO:0030173) intrinsic component of Golgi membrane(GO:0031228) |
| 0.3 | 6.7 | GO:0031298 | replication fork protection complex(GO:0031298) |
| 0.3 | 0.8 | GO:0005662 | DNA replication factor A complex(GO:0005662) |
| 0.3 | 1.1 | GO:0000214 | tRNA-intron endonuclease complex(GO:0000214) |
| 0.3 | 1.0 | GO:0008623 | CHRAC(GO:0008623) |
| 0.2 | 0.5 | GO:0030428 | cell septum(GO:0030428) |
| 0.2 | 0.9 | GO:0033254 | vacuolar transporter chaperone complex(GO:0033254) |
| 0.2 | 1.1 | GO:0042765 | GPI-anchor transamidase complex(GO:0042765) |
| 0.2 | 0.2 | GO:0000172 | ribonuclease MRP complex(GO:0000172) |
| 0.2 | 2.6 | GO:0019897 | extrinsic component of plasma membrane(GO:0019897) |
| 0.2 | 0.8 | GO:0005797 | Golgi medial cisterna(GO:0005797) |
| 0.2 | 0.8 | GO:0000818 | MIS12/MIND type complex(GO:0000444) nuclear MIS12/MIND complex(GO:0000818) |
| 0.2 | 2.3 | GO:0005686 | U2 snRNP(GO:0005686) |
| 0.2 | 2.7 | GO:0010494 | cytoplasmic stress granule(GO:0010494) |
| 0.2 | 3.7 | GO:0070847 | core mediator complex(GO:0070847) |
| 0.2 | 1.3 | GO:0019773 | proteasome core complex, alpha-subunit complex(GO:0019773) |
| 0.2 | 1.7 | GO:0000243 | commitment complex(GO:0000243) |
| 0.2 | 0.5 | GO:0000137 | Golgi cis cisterna(GO:0000137) |
| 0.1 | 0.9 | GO:0035327 | transcriptionally active chromatin(GO:0035327) |
| 0.1 | 5.2 | GO:0030176 | integral component of endoplasmic reticulum membrane(GO:0030176) |
| 0.1 | 2.5 | GO:0031314 | extrinsic component of mitochondrial inner membrane(GO:0031314) |
| 0.1 | 1.1 | GO:0000792 | heterochromatin(GO:0000792) |
| 0.1 | 0.3 | GO:0032045 | guanyl-nucleotide exchange factor complex(GO:0032045) |
| 0.1 | 1.2 | GO:0000142 | cellular bud neck contractile ring(GO:0000142) |
| 0.1 | 0.8 | GO:0016459 | myosin complex(GO:0016459) |
| 0.1 | 2.5 | GO:0031201 | SNARE complex(GO:0031201) |
| 0.1 | 0.8 | GO:0005665 | DNA-directed RNA polymerase II, core complex(GO:0005665) |
| 0.1 | 12.2 | GO:0005759 | mitochondrial matrix(GO:0005759) |
| 0.1 | 0.7 | GO:0000783 | telomere cap complex(GO:0000782) nuclear telomere cap complex(GO:0000783) |
| 0.1 | 0.4 | GO:0071819 | DUBm complex(GO:0071819) |
| 0.1 | 1.5 | GO:0000932 | cytoplasmic mRNA processing body(GO:0000932) |
| 0.1 | 2.9 | GO:0044445 | cytosolic part(GO:0044445) |
| 0.1 | 1.4 | GO:0005881 | cytoplasmic microtubule(GO:0005881) |
| 0.1 | 1.1 | GO:0034399 | nuclear periphery(GO:0034399) |
| 0.1 | 0.6 | GO:0019774 | proteasome core complex, beta-subunit complex(GO:0019774) |
| 0.1 | 2.3 | GO:0005874 | microtubule(GO:0005874) |
| 0.1 | 0.3 | GO:0034990 | mitotic cohesin complex(GO:0030892) nuclear mitotic cohesin complex(GO:0034990) |
| 0.1 | 0.5 | GO:0005885 | Arp2/3 protein complex(GO:0005885) |
| 0.1 | 3.3 | GO:0005643 | nuclear pore(GO:0005643) |
| 0.1 | 7.2 | GO:0005840 | ribosome(GO:0005840) |
| 0.1 | 0.4 | GO:0000835 | cytoplasmic ubiquitin ligase complex(GO:0000153) ER ubiquitin ligase complex(GO:0000835) |
| 0.1 | 0.5 | GO:0030014 | CCR4-NOT complex(GO:0030014) |
| 0.1 | 0.8 | GO:0005788 | endoplasmic reticulum lumen(GO:0005788) |
| 0.1 | 0.7 | GO:0016586 | RSC complex(GO:0016586) |
| 0.0 | 0.6 | GO:0016514 | SWI/SNF complex(GO:0016514) BAF-type complex(GO:0090544) |
| 0.0 | 0.5 | GO:0030137 | COPI-coated vesicle(GO:0030137) |
| 0.0 | 0.6 | GO:0036452 | ESCRT complex(GO:0036452) |
| 0.0 | 0.1 | GO:0070823 | HDA1 complex(GO:0070823) |
| 0.0 | 0.1 | GO:0097196 | Shu complex(GO:0097196) |
| 0.0 | 0.3 | GO:0030127 | COPII vesicle coat(GO:0030127) |
| 0.0 | 0.8 | GO:0005811 | lipid particle(GO:0005811) |
| 0.0 | 0.2 | GO:0034967 | Set3 complex(GO:0034967) |
| 0.0 | 0.0 | GO:0031010 | ISWI-type complex(GO:0031010) |
Gene overrepresentation in molecular function category:
| Log-likelihood per target | Total log-likelihood | Term | Description |
|---|---|---|---|
| 6.9 | 6.9 | GO:0033592 | RNA strand annealing activity(GO:0033592) annealing activity(GO:0097617) |
| 6.4 | 19.2 | GO:0008097 | 5S rRNA binding(GO:0008097) |
| 5.2 | 72.3 | GO:0001054 | RNA polymerase I activity(GO:0001054) |
| 5.1 | 15.2 | GO:0019003 | GDP binding(GO:0019003) |
| 4.9 | 29.6 | GO:0016846 | carbon-sulfur lyase activity(GO:0016846) |
| 4.8 | 14.4 | GO:0003938 | IMP dehydrogenase activity(GO:0003938) |
| 4.7 | 93.1 | GO:0030515 | snoRNA binding(GO:0030515) |
| 4.3 | 12.9 | GO:0070568 | guanylyltransferase activity(GO:0070568) |
| 3.6 | 14.5 | GO:0001046 | core promoter sequence-specific DNA binding(GO:0001046) |
| 3.6 | 14.4 | GO:0004523 | RNA-DNA hybrid ribonuclease activity(GO:0004523) |
| 3.6 | 10.7 | GO:0016433 | rRNA (adenine) methyltransferase activity(GO:0016433) |
| 3.6 | 10.7 | GO:0016273 | arginine N-methyltransferase activity(GO:0016273) protein-arginine N-methyltransferase activity(GO:0016274) |
| 3.1 | 9.3 | GO:0016717 | oxidoreductase activity, acting on paired donors, with oxidation of a pair of donors resulting in the reduction of molecular oxygen to two molecules of water(GO:0016717) |
| 2.9 | 8.8 | GO:0004809 | tRNA (guanine-N2-)-methyltransferase activity(GO:0004809) |
| 2.9 | 17.1 | GO:0003906 | DNA-(apurinic or apyrimidinic site) lyase activity(GO:0003906) |
| 2.8 | 11.1 | GO:0005384 | manganese ion transmembrane transporter activity(GO:0005384) |
| 2.8 | 13.8 | GO:0016423 | tRNA (guanine) methyltransferase activity(GO:0016423) |
| 2.8 | 11.0 | GO:0004467 | long-chain fatty acid-CoA ligase activity(GO:0004467) |
| 2.5 | 76.7 | GO:0004004 | ATP-dependent RNA helicase activity(GO:0004004) |
| 2.4 | 4.8 | GO:0042134 | rRNA primary transcript binding(GO:0042134) |
| 2.3 | 7.0 | GO:0043023 | ribosomal large subunit binding(GO:0043023) |
| 2.2 | 22.4 | GO:0001056 | RNA polymerase III activity(GO:0001056) |
| 2.1 | 8.6 | GO:0005528 | macrolide binding(GO:0005527) FK506 binding(GO:0005528) |
| 2.1 | 2.1 | GO:1904680 | peptide-transporting ATPase activity(GO:0015440) peptide transmembrane transporter activity(GO:1904680) |
| 2.0 | 12.1 | GO:0004030 | aldehyde dehydrogenase (NAD) activity(GO:0004029) aldehyde dehydrogenase [NAD(P)+] activity(GO:0004030) |
| 2.0 | 8.1 | GO:0016841 | ammonia-lyase activity(GO:0016841) |
| 1.9 | 5.8 | GO:0005519 | cytoskeletal regulatory protein binding(GO:0005519) |
| 1.8 | 5.4 | GO:0072341 | modified amino acid binding(GO:0072341) |
| 1.8 | 5.3 | GO:0047066 | phospholipid-hydroperoxide glutathione peroxidase activity(GO:0047066) |
| 1.7 | 5.1 | GO:0015114 | phosphate ion transmembrane transporter activity(GO:0015114) |
| 1.7 | 6.7 | GO:0000297 | spermine transmembrane transporter activity(GO:0000297) |
| 1.7 | 8.3 | GO:0008186 | RNA-dependent ATPase activity(GO:0008186) |
| 1.7 | 8.3 | GO:0003725 | double-stranded RNA binding(GO:0003725) |
| 1.6 | 6.4 | GO:0019206 | nucleoside kinase activity(GO:0019206) |
| 1.6 | 11.1 | GO:0016778 | diphosphotransferase activity(GO:0016778) |
| 1.5 | 4.6 | GO:0004326 | tetrahydrofolylpolyglutamate synthase activity(GO:0004326) |
| 1.5 | 4.6 | GO:0010521 | telomerase inhibitor activity(GO:0010521) |
| 1.5 | 13.7 | GO:0009982 | pseudouridine synthase activity(GO:0009982) |
| 1.5 | 4.4 | GO:0008271 | secondary active sulfate transmembrane transporter activity(GO:0008271) sulfate transmembrane transporter activity(GO:0015116) |
| 1.5 | 8.8 | GO:0004022 | alcohol dehydrogenase (NAD) activity(GO:0004022) |
| 1.4 | 54.9 | GO:0019843 | rRNA binding(GO:0019843) |
| 1.4 | 4.3 | GO:0015166 | polyol transmembrane transporter activity(GO:0015166) |
| 1.4 | 13.8 | GO:0019239 | deaminase activity(GO:0019239) |
| 1.3 | 5.4 | GO:0016728 | ribonucleoside-diphosphate reductase activity, thioredoxin disulfide as acceptor(GO:0004748) oxidoreductase activity, acting on CH or CH2 groups(GO:0016725) oxidoreductase activity, acting on CH or CH2 groups, disulfide as acceptor(GO:0016728) ribonucleoside-diphosphate reductase activity(GO:0061731) |
| 1.3 | 4.0 | GO:0016882 | cyclo-ligase activity(GO:0016882) |
| 1.3 | 2.7 | GO:0001082 | transcription factor activity, RNA polymerase I transcription factor binding(GO:0001082) RNA polymerase I transcription factor binding(GO:0001179) |
| 1.3 | 19.9 | GO:0016705 | oxidoreductase activity, acting on paired donors, with incorporation or reduction of molecular oxygen(GO:0016705) |
| 1.3 | 8.0 | GO:0015198 | oligopeptide transporter activity(GO:0015198) |
| 1.3 | 3.9 | GO:0008559 | xenobiotic-transporting ATPase activity(GO:0008559) xenobiotic transporter activity(GO:0042910) |
| 1.3 | 1.3 | GO:0004602 | glutathione peroxidase activity(GO:0004602) |
| 1.2 | 4.9 | GO:0017150 | tRNA dihydrouridine synthase activity(GO:0017150) |
| 1.2 | 4.8 | GO:0004338 | glucan exo-1,3-beta-glucosidase activity(GO:0004338) |
| 1.2 | 7.2 | GO:0008138 | protein tyrosine/serine/threonine phosphatase activity(GO:0008138) |
| 1.2 | 1.2 | GO:0032296 | ribonuclease III activity(GO:0004525) double-stranded RNA-specific ribonuclease activity(GO:0032296) |
| 1.1 | 19.3 | GO:0016763 | transferase activity, transferring pentosyl groups(GO:0016763) |
| 1.1 | 3.4 | GO:0003825 | alpha,alpha-trehalose-phosphate synthase (UDP-forming) activity(GO:0003825) |
| 1.1 | 5.6 | GO:0005092 | GDP-dissociation inhibitor activity(GO:0005092) |
| 1.1 | 13.4 | GO:0008175 | tRNA methyltransferase activity(GO:0008175) |
| 1.1 | 3.2 | GO:0070336 | flap-structured DNA binding(GO:0070336) |
| 1.1 | 9.6 | GO:0004596 | peptide alpha-N-acetyltransferase activity(GO:0004596) |
| 1.1 | 3.2 | GO:0004100 | chitin synthase activity(GO:0004100) |
| 1.0 | 5.2 | GO:0008443 | phosphofructokinase activity(GO:0008443) |
| 1.0 | 2.9 | GO:0051010 | microtubule plus-end binding(GO:0051010) |
| 0.9 | 8.0 | GO:0008173 | RNA methyltransferase activity(GO:0008173) |
| 0.8 | 148.7 | GO:0003735 | structural constituent of ribosome(GO:0003735) |
| 0.8 | 2.5 | GO:0004652 | polynucleotide adenylyltransferase activity(GO:0004652) |
| 0.8 | 7.9 | GO:0003746 | translation elongation factor activity(GO:0003746) |
| 0.8 | 3.9 | GO:0070403 | NAD+ binding(GO:0070403) |
| 0.8 | 10.7 | GO:0001671 | ATPase activator activity(GO:0001671) |
| 0.8 | 60.8 | GO:0005525 | GTP binding(GO:0005525) guanyl nucleotide binding(GO:0019001) guanyl ribonucleotide binding(GO:0032561) |
| 0.7 | 5.9 | GO:0005310 | dicarboxylic acid transmembrane transporter activity(GO:0005310) |
| 0.7 | 2.1 | GO:0003841 | 1-acylglycerol-3-phosphate O-acyltransferase activity(GO:0003841) |
| 0.7 | 3.5 | GO:0000033 | alpha-1,3-mannosyltransferase activity(GO:0000033) |
| 0.7 | 5.4 | GO:0016861 | intramolecular oxidoreductase activity, interconverting aldoses and ketoses(GO:0016861) |
| 0.7 | 6.6 | GO:0019205 | nucleobase-containing compound kinase activity(GO:0019205) |
| 0.6 | 8.3 | GO:0045182 | translation regulator activity(GO:0045182) |
| 0.6 | 3.2 | GO:0015173 | aromatic amino acid transmembrane transporter activity(GO:0015173) |
| 0.6 | 0.6 | GO:0000171 | ribonuclease MRP activity(GO:0000171) |
| 0.6 | 8.1 | GO:0000049 | tRNA binding(GO:0000049) |
| 0.6 | 22.4 | GO:0016765 | transferase activity, transferring alkyl or aryl (other than methyl) groups(GO:0016765) |
| 0.6 | 2.5 | GO:0050291 | sphingosine N-acyltransferase activity(GO:0050291) |
| 0.6 | 2.4 | GO:0008139 | nuclear localization sequence binding(GO:0008139) |
| 0.6 | 3.0 | GO:0004707 | MAP kinase activity(GO:0004707) |
| 0.6 | 141.6 | GO:0003723 | RNA binding(GO:0003723) |
| 0.6 | 5.6 | GO:0001133 | RNA polymerase II transcription factor activity, sequence-specific transcription regulatory region DNA binding(GO:0001133) |
| 0.5 | 2.7 | GO:0003705 | transcription factor activity, RNA polymerase II distal enhancer sequence-specific binding(GO:0003705) |
| 0.5 | 2.6 | GO:0008198 | ferrous iron binding(GO:0008198) |
| 0.5 | 5.1 | GO:0005516 | calmodulin binding(GO:0005516) |
| 0.5 | 1.0 | GO:0031492 | nucleosomal DNA binding(GO:0031492) |
| 0.5 | 8.4 | GO:0042803 | protein homodimerization activity(GO:0042803) |
| 0.5 | 1.9 | GO:0016639 | oxidoreductase activity, acting on the CH-NH2 group of donors, NAD or NADP as acceptor(GO:0016639) |
| 0.5 | 1.4 | GO:0070567 | cytidylyltransferase activity(GO:0070567) |
| 0.5 | 6.4 | GO:0005506 | iron ion binding(GO:0005506) |
| 0.4 | 2.7 | GO:0004529 | exodeoxyribonuclease activity(GO:0004529) |
| 0.4 | 1.3 | GO:0004128 | cytochrome-b5 reductase activity, acting on NAD(P)H(GO:0004128) |
| 0.4 | 1.3 | GO:0016886 | ligase activity, forming phosphoric ester bonds(GO:0016886) |
| 0.4 | 1.3 | GO:0004930 | G-protein coupled receptor activity(GO:0004930) |
| 0.4 | 1.7 | GO:0051377 | mannose-ethanolamine phosphotransferase activity(GO:0051377) |
| 0.4 | 4.5 | GO:0001083 | transcription factor activity, RNA polymerase II basal transcription factor binding(GO:0001083) |
| 0.4 | 4.3 | GO:0001078 | transcriptional repressor activity, RNA polymerase II core promoter proximal region sequence-specific binding(GO:0001078) |
| 0.4 | 6.4 | GO:0004521 | endoribonuclease activity(GO:0004521) |
| 0.4 | 8.0 | GO:0016836 | hydro-lyase activity(GO:0016836) |
| 0.3 | 1.7 | GO:0017048 | Rho GTPase binding(GO:0017048) |
| 0.3 | 9.2 | GO:0004722 | protein serine/threonine phosphatase activity(GO:0004722) |
| 0.3 | 1.3 | GO:0060590 | ATPase regulator activity(GO:0060590) |
| 0.3 | 2.5 | GO:0016628 | oxidoreductase activity, acting on the CH-CH group of donors, NAD or NADP as acceptor(GO:0016628) |
| 0.3 | 3.3 | GO:0000182 | rDNA binding(GO:0000182) |
| 0.3 | 2.3 | GO:0010181 | FMN binding(GO:0010181) |
| 0.3 | 3.1 | GO:0043495 | protein anchor(GO:0043495) |
| 0.3 | 4.9 | GO:0008017 | microtubule binding(GO:0008017) |
| 0.3 | 1.0 | GO:0008252 | nucleotidase activity(GO:0008252) |
| 0.3 | 6.0 | GO:0004812 | aminoacyl-tRNA ligase activity(GO:0004812) ligase activity, forming carbon-oxygen bonds(GO:0016875) ligase activity, forming aminoacyl-tRNA and related compounds(GO:0016876) |
| 0.3 | 2.0 | GO:0004713 | protein tyrosine kinase activity(GO:0004713) |
| 0.2 | 1.0 | GO:0008172 | S-methyltransferase activity(GO:0008172) |
| 0.2 | 2.4 | GO:0080025 | phosphatidylinositol-3,5-bisphosphate binding(GO:0080025) |
| 0.2 | 0.5 | GO:0004376 | glycolipid mannosyltransferase activity(GO:0004376) |
| 0.2 | 0.7 | GO:0042973 | glucan endo-1,3-beta-D-glucosidase activity(GO:0042973) |
| 0.2 | 0.9 | GO:0008409 | 5'-3' exonuclease activity(GO:0008409) |
| 0.2 | 1.1 | GO:0003923 | GPI-anchor transamidase activity(GO:0003923) |
| 0.2 | 3.1 | GO:0005487 | nucleocytoplasmic transporter activity(GO:0005487) |
| 0.2 | 1.1 | GO:0070546 | L-phenylalanine aminotransferase activity(GO:0070546) L-phenylalanine:2-oxoglutarate aminotransferase activity(GO:0080130) |
| 0.2 | 2.0 | GO:0016620 | oxidoreductase activity, acting on the aldehyde or oxo group of donors, NAD or NADP as acceptor(GO:0016620) |
| 0.2 | 0.8 | GO:0001055 | RNA polymerase II activity(GO:0001055) |
| 0.2 | 0.8 | GO:0009378 | four-way junction helicase activity(GO:0009378) |
| 0.2 | 0.6 | GO:0005262 | calcium channel activity(GO:0005262) |
| 0.2 | 0.8 | GO:0008157 | protein phosphatase 1 binding(GO:0008157) |
| 0.2 | 1.7 | GO:0005496 | steroid binding(GO:0005496) sterol binding(GO:0032934) |
| 0.2 | 0.8 | GO:0034450 | ubiquitin-ubiquitin ligase activity(GO:0034450) |
| 0.2 | 1.7 | GO:0004252 | serine-type endopeptidase activity(GO:0004252) |
| 0.2 | 1.9 | GO:0016780 | phosphotransferase activity, for other substituted phosphate groups(GO:0016780) |
| 0.2 | 1.1 | GO:0000026 | alpha-1,2-mannosyltransferase activity(GO:0000026) |
| 0.2 | 0.5 | GO:0016408 | C-acyltransferase activity(GO:0016408) |
| 0.2 | 0.2 | GO:0004488 | methylenetetrahydrofolate dehydrogenase (NADP+) activity(GO:0004488) |
| 0.2 | 0.5 | GO:0019901 | protein kinase binding(GO:0019901) |
| 0.2 | 4.6 | GO:0046982 | protein heterodimerization activity(GO:0046982) |
| 0.2 | 0.8 | GO:0019238 | cyclohydrolase activity(GO:0019238) |
| 0.2 | 2.6 | GO:0051536 | iron-sulfur cluster binding(GO:0051536) metal cluster binding(GO:0051540) |
| 0.2 | 0.6 | GO:0070577 | lysine-acetylated histone binding(GO:0070577) |
| 0.2 | 0.6 | GO:0051213 | oxidoreductase activity, acting on single donors with incorporation of molecular oxygen(GO:0016701) oxidoreductase activity, acting on single donors with incorporation of molecular oxygen, incorporation of two atoms of oxygen(GO:0016702) dioxygenase activity(GO:0051213) |
| 0.2 | 0.5 | GO:0008144 | drug binding(GO:0008144) |
| 0.1 | 0.9 | GO:0016646 | oxidoreductase activity, acting on the CH-NH group of donors, NAD or NADP as acceptor(GO:0016646) |
| 0.1 | 1.0 | GO:0051920 | thioredoxin peroxidase activity(GO:0008379) peroxiredoxin activity(GO:0051920) |
| 0.1 | 0.6 | GO:0017022 | myosin binding(GO:0017022) |
| 0.1 | 3.3 | GO:0016538 | cyclin-dependent protein serine/threonine kinase regulator activity(GO:0016538) |
| 0.1 | 1.5 | GO:0070003 | threonine-type endopeptidase activity(GO:0004298) threonine-type peptidase activity(GO:0070003) |
| 0.1 | 0.2 | GO:0043142 | single-stranded DNA-dependent ATPase activity(GO:0043142) |
| 0.1 | 2.5 | GO:0005200 | structural constituent of cytoskeleton(GO:0005200) |
| 0.1 | 0.7 | GO:0008408 | 3'-5' exonuclease activity(GO:0008408) |
| 0.1 | 0.5 | GO:0004679 | AMP-activated protein kinase activity(GO:0004679) |
| 0.1 | 0.4 | GO:0016634 | oxidoreductase activity, acting on the CH-CH group of donors, oxygen as acceptor(GO:0016634) |
| 0.1 | 7.1 | GO:0003682 | chromatin binding(GO:0003682) |
| 0.1 | 2.1 | GO:0005484 | SNAP receptor activity(GO:0005484) |
| 0.1 | 0.2 | GO:0016832 | aldehyde-lyase activity(GO:0016832) |
| 0.1 | 0.5 | GO:1901618 | organic hydroxy compound transmembrane transporter activity(GO:1901618) |
| 0.1 | 0.5 | GO:0000009 | alpha-1,6-mannosyltransferase activity(GO:0000009) |
| 0.1 | 0.2 | GO:0001128 | RNA polymerase II transcription coactivator activity involved in preinitiation complex assembly(GO:0001128) |
| 0.1 | 2.2 | GO:0043130 | ubiquitin binding(GO:0043130) |
| 0.1 | 0.9 | GO:0015926 | glucosidase activity(GO:0015926) |
| 0.1 | 1.3 | GO:0008757 | S-adenosylmethionine-dependent methyltransferase activity(GO:0008757) |
| 0.1 | 0.7 | GO:0017056 | structural constituent of nuclear pore(GO:0017056) |
| 0.1 | 0.4 | GO:0043022 | ribosome binding(GO:0043022) |
| 0.0 | 1.1 | GO:0000030 | mannosyltransferase activity(GO:0000030) |
| 0.0 | 0.2 | GO:0042123 | glucanosyltransferase activity(GO:0042123) 1,3-beta-glucanosyltransferase activity(GO:0042124) |
| 0.0 | 0.1 | GO:0032139 | dinucleotide insertion or deletion binding(GO:0032139) |
| 0.0 | 0.2 | GO:0005338 | nucleotide-sugar transmembrane transporter activity(GO:0005338) |
| 0.0 | 0.3 | GO:0019211 | phosphatase activator activity(GO:0019211) |
| 0.0 | 0.1 | GO:0031072 | heat shock protein binding(GO:0031072) |
| 0.0 | 0.6 | GO:0005048 | signal sequence binding(GO:0005048) |
| 0.0 | 0.3 | GO:0046983 | protein dimerization activity(GO:0046983) |
| 0.0 | 0.3 | GO:0042162 | telomeric DNA binding(GO:0042162) |
| 0.0 | 0.2 | GO:0031386 | protein tag(GO:0031386) |
| 0.0 | 1.0 | GO:0005085 | guanyl-nucleotide exchange factor activity(GO:0005085) |
| 0.0 | 1.0 | GO:0060589 | nucleoside-triphosphatase regulator activity(GO:0060589) |
| 0.0 | 0.3 | GO:0015616 | DNA translocase activity(GO:0015616) |
| 0.0 | 0.1 | GO:0004622 | lysophospholipase activity(GO:0004622) |
| 0.0 | 0.1 | GO:0008525 | phosphatidylcholine transporter activity(GO:0008525) phosphatidylinositol transporter activity(GO:0008526) |
| 0.0 | 0.2 | GO:0005509 | calcium ion binding(GO:0005509) |
Gene overrepresentation in curated gene sets: canonical pathways category:
| Log-likelihood per target | Total log-likelihood | Term | Description |
|---|---|---|---|
| 2.4 | 9.8 | NABA CORE MATRISOME | Ensemble of genes encoding core extracellular matrix including ECM glycoproteins, collagens and proteoglycans |
| 2.4 | 2.4 | PID VEGFR1 PATHWAY | VEGFR1 specific signals |
| 1.4 | 5.6 | PID DELTA NP63 PATHWAY | Validated transcriptional targets of deltaNp63 isoforms |
| 1.2 | 3.6 | PID LKB1 PATHWAY | LKB1 signaling events |
| 0.6 | 2.5 | PID P73PATHWAY | p73 transcription factor network |
| 0.5 | 2.1 | PID UPA UPAR PATHWAY | Urokinase-type plasminogen activator (uPA) and uPAR-mediated signaling |
| 0.4 | 1.1 | PID HIF1 TFPATHWAY | HIF-1-alpha transcription factor network |
| 0.4 | 1.1 | PID P38 ALPHA BETA DOWNSTREAM PATHWAY | Signaling mediated by p38-alpha and p38-beta |
| 0.2 | 0.9 | PID PLK1 PATHWAY | PLK1 signaling events |
| 0.1 | 1.2 | NABA MATRISOME | Ensemble of genes encoding extracellular matrix and extracellular matrix-associated proteins |
| 0.1 | 0.4 | PID ERA GENOMIC PATHWAY | Validated nuclear estrogen receptor alpha network |
| 0.0 | 0.1 | PID INTEGRIN A4B1 PATHWAY | Alpha4 beta1 integrin signaling events |
Gene overrepresentation in curated gene sets: REACTOME pathways category:
| Log-likelihood per target | Total log-likelihood | Term | Description |
|---|---|---|---|
| 2.2 | 17.7 | REACTOME ACTIVATION OF THE MRNA UPON BINDING OF THE CAP BINDING COMPLEX AND EIFS AND SUBSEQUENT BINDING TO 43S | Genes involved in Activation of the mRNA upon binding of the cap-binding complex and eIFs, and subsequent binding to 43S |
| 2.0 | 8.0 | REACTOME GLYCEROPHOSPHOLIPID BIOSYNTHESIS | Genes involved in Glycerophospholipid biosynthesis |
| 1.7 | 13.6 | REACTOME MRNA DECAY BY 5 TO 3 EXORIBONUCLEASE | Genes involved in mRNA Decay by 5' to 3' Exoribonuclease |
| 1.7 | 11.6 | REACTOME EXTENSION OF TELOMERES | Genes involved in Extension of Telomeres |
| 1.5 | 3.1 | REACTOME DOWNREGULATION OF ERBB2 ERBB3 SIGNALING | Genes involved in Downregulation of ERBB2:ERBB3 signaling |
| 1.3 | 3.8 | REACTOME CITRIC ACID CYCLE TCA CYCLE | Genes involved in Citric acid cycle (TCA cycle) |
| 1.2 | 19.6 | REACTOME 3 UTR MEDIATED TRANSLATIONAL REGULATION | Genes involved in 3' -UTR-mediated translational regulation |
| 0.7 | 5.6 | REACTOME PPARA ACTIVATES GENE EXPRESSION | Genes involved in PPARA Activates Gene Expression |
| 0.4 | 1.3 | REACTOME SIGNALING BY RHO GTPASES | Genes involved in Signaling by Rho GTPases |
| 0.4 | 2.5 | REACTOME APC CDC20 MEDIATED DEGRADATION OF NEK2A | Genes involved in APC-Cdc20 mediated degradation of Nek2A |
| 0.4 | 0.4 | REACTOME DEADENYLATION DEPENDENT MRNA DECAY | Genes involved in Deadenylation-dependent mRNA decay |
| 0.4 | 2.4 | REACTOME AXON GUIDANCE | Genes involved in Axon guidance |
| 0.3 | 1.0 | REACTOME SULFUR AMINO ACID METABOLISM | Genes involved in Sulfur amino acid metabolism |
| 0.2 | 0.7 | REACTOME CIRCADIAN CLOCK | Genes involved in Circadian Clock |
| 0.1 | 1.0 | REACTOME FORMATION OF TUBULIN FOLDING INTERMEDIATES BY CCT TRIC | Genes involved in Formation of tubulin folding intermediates by CCT/TriC |
| 0.1 | 1.7 | REACTOME TRANSCRIPTION | Genes involved in Transcription |
| 0.1 | 0.8 | REACTOME DNA STRAND ELONGATION | Genes involved in DNA strand elongation |
| 0.1 | 0.3 | REACTOME MEIOTIC SYNAPSIS | Genes involved in Meiotic Synapsis |
| 0.1 | 0.3 | REACTOME SYNTHESIS OF SUBSTRATES IN N GLYCAN BIOSYTHESIS | Genes involved in Synthesis of substrates in N-glycan biosythesis |
| 0.1 | 0.5 | REACTOME SIGNALING BY GPCR | Genes involved in Signaling by GPCR |
| 0.1 | 0.3 | REACTOME APOPTOSIS | Genes involved in Apoptosis |