Results for LYS14
Z-value: 0.68
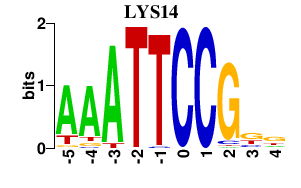
Motif logo
Transcription factors associated with LYS14
| Gene Symbol | Gene ID | Gene Info |
|---|---|---|
|
LYS14
|
S000002441 | Transcriptional activator involved in regulating lysine biosynthesis |
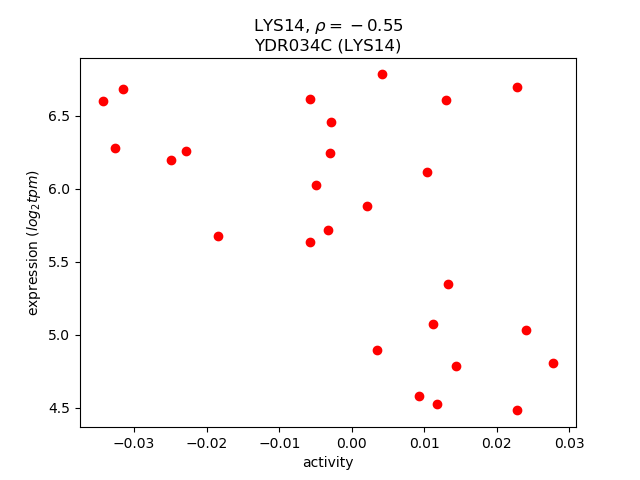
Activity-expression correlation:
Activity profile of LYS14 motif
Sorted Z-values of LYS14 motif
| Promoter | Log-likelihood | Transcript | Gene | Gene Info |
|---|---|---|---|---|
| YFR055W | 7.49 |
IRC7
|
Putative cystathionine beta-lyase; involved in copper ion homeostasis and sulfur metabolism; null mutant displays increased levels of spontaneous Rad52p foci; expression induced by nitrogen limitation in a GLN3, GAT1-dependent manner |
|
| YFR056C | 7.39 |
Dubious open reading frame unlikely to encode a protein based on available experimental and comparative sequence data; partially overlaps the uncharacterized gene YFR055W |
||
| YER131W | 4.51 |
RPS26B
|
Protein component of the small (40S) ribosomal subunit; nearly identical to Rps26Ap and has similarity to rat S26 ribosomal protein |
|
| YDR098C | 3.62 |
GRX3
|
Hydroperoxide and superoxide-radical responsive glutathione-dependent oxidoreductase; monothiol glutaredoxin subfamily member along with Grx4p and Grx5p; protects cells from oxidative damage |
|
| YJR094W-A | 3.34 |
RPL43B
|
Protein component of the large (60S) ribosomal subunit, identical to Rpl43Ap and has similarity to rat L37a ribosomal protein |
|
| YDR345C | 3.20 |
HXT3
|
Low affinity glucose transporter of the major facilitator superfamily, expression is induced in low or high glucose conditions |
|
| YLR154C | 2.82 |
RNH203
|
Ribonuclease H2 subunit, required for RNase H2 activity |
|
| YPR119W | 2.75 |
CLB2
|
B-type cyclin involved in cell cycle progression; activates Cdc28p to promote the transition from G2 to M phase; accumulates during G2 and M, then targeted via a destruction box motif for ubiquitin-mediated degradation by the proteasome |
|
| YKL096W-A | 2.30 |
CWP2
|
Covalently linked cell wall mannoprotein, major constituent of the cell wall; plays a role in stabilizing the cell wall; involved in low pH resistance; precursor is GPI-anchored |
|
| YHR094C | 2.28 |
HXT1
|
Low-affinity glucose transporter of the major facilitator superfamily, expression is induced by Hxk2p in the presence of glucose and repressed by Rgt1p when glucose is limiting |
|
| YER130C | 2.26 |
Hypothetical protein |
||
| YLR154W-B | 2.24 |
Dubious open reading frame unlikely to encode a protein; encoded within the the 25S rRNA gene on the opposite strand |
||
| YLR154W-C | 2.19 |
TAR1
|
Mitochondrial protein of unknown function, overexpression suppresses an rpo41 mutation affecting mitochondrial RNA polymerase; encoded within the 25S rRNA gene on the opposite strand |
|
| YGL157W | 1.97 |
Oxidoreductase, catalyzes NADPH-dependent reduction of the bicyclic diketone bicyclo[2.2.2]octane-2,6-dione (BCO2,6D) to the chiral ketoalcohol (1R,4S,6S)-6-hydroxybicyclo[2.2.2]octane-2-one (BCO2one6ol) |
||
| YPL250W-A | 1.94 |
Identified by fungal homology and RT-PCR |
||
| YMR102C | 1.93 |
Protein of unknown function; transcription is activated by paralogous transcription factors Yrm1p and Yrr1p along with genes involved in multidrug resistance; mutant shows increased resistance to azoles; YMR102C is not an essential gene |
||
| YLR154W-A | 1.87 |
Dubious open reading frame unlikely to encode a protein; encoded within the the 25S rRNA gene on the opposite strand |
||
| YGL097W | 1.84 |
SRM1
|
Nucleotide exchange factor for Gsp1p, localizes to the nucleus, required for nucleocytoplasmic trafficking of macromolecules; suppressor of the pheromone response pathway; potentially phosphorylated by Cdc28p |
|
| YFR054C | 1.78 |
Dubious open reading frame unlikely to encode a functional protein, based on available experimental and comparative sequence data |
||
| YLR257W | 1.73 |
Putative protein of unknown function |
||
| YLR328W | 1.69 |
NMA1
|
Nicotinic acid mononucleotide adenylyltransferase, involved in pathways of NAD biosynthesis, including the de novo, NAD(+) salvage, and nicotinamide riboside salvage pathways |
|
| YDR041W | 1.57 |
RSM10
|
Mitochondrial ribosomal protein of the small subunit, has similarity to E. coli S10 ribosomal protein; essential for viability, unlike most other mitoribosomal proteins |
|
| YDL047W | 1.55 |
SIT4
|
Type 2A-related serine-threonine phosphatase that functions in the G1/S transition of the mitotic cycle; cytoplasmic and nuclear protein that modulates functions mediated by Pkc1p including cell wall and actin cytoskeleton organization |
|
| YGL158W | 1.53 |
RCK1
|
Protein kinase involved in the response to oxidative stress; identified as suppressor of S. pombe cell cycle checkpoint mutations |
|
| YKR092C | 1.51 |
SRP40
|
Nucleolar, serine-rich protein with a role in preribosome assembly or transport; may function as a chaperone of small nucleolar ribonucleoprotein particles (snoRNPs); immunologically and structurally to rat Nopp140 |
|
| YNL043C | 1.42 |
Dubious open reading frame unlikely to encode a protein, based on available experimental and comparative sequence data; partially overlaps the verified gene YIP3/YNL044W |
||
| YJL011C | 1.40 |
RPC17
|
RNA polymerase III subunit C17; physically interacts with C31, C11, and TFIIIB70; may be involved in the recruitment of pol III by the preinitiation complex |
|
| YMR290C | 1.37 |
HAS1
|
ATP-dependent RNA helicase; localizes to both the nuclear periphery and nucleolus; highly enriched in nuclear pore complex fractions; constituent of 66S pre-ribosomal particles |
|
| YNL234W | 1.35 |
Similar to globins and has a functional heme-binding domain; involved in glucose signaling or metabolism; regulated by Rgt1p |
||
| YKL051W | 1.34 |
SFK1
|
Plasma membrane protein that may act together with or upstream of Stt4p to generate normal levels of the essential phospholipid PI4P, at least partially mediates proper localization of Stt4p to the plasma membrane |
|
| YGR138C | 1.29 |
TPO2
|
Polyamine transport protein specific for spermine; localizes to the plasma membrane; transcription of TPO2 is regulated by Haa1p; member of the major facilitator superfamily |
|
| YOR376W-A | 1.27 |
Putative protein of unknown function; identified by fungal homology and RT-PCR |
||
| YDR344C | 1.25 |
Dubious open reading frame unlikely to encode a functional protein, based on available experimental and comparative sequence data |
||
| YGL148W | 1.24 |
ARO2
|
Bifunctional chorismate synthase and flavin reductase, catalyzes the conversion of 5-enolpyruvylshikimate 3-phosphate (EPSP) to form chorismate, which is a precursor to aromatic amino acids |
|
| YMR290W-A | 1.22 |
Dubious open reading frame unlikely to encode a functional protein, based on available experimental and comparative sequence data; overlaps 5' end of essential HAS1 gene which encodes an ATP-dependent RNA helicase |
||
| YGR139W | 1.22 |
Dubious ORF unlikely to encode a functional protein, based on available experimental and comparative sequence data |
||
| YDR002W | 1.21 |
YRB1
|
Ran GTPase binding protein; involved in nuclear protein import and RNA export, ubiquitin-mediated protein degradation during the cell cycle; shuttles between the nucleus and cytoplasm; is essential; homolog of human RanBP1 |
|
| YHR007C | 1.18 |
ERG11
|
Lanosterol 14-alpha-demethylase, catalyzes the C-14 demethylation of lanosterol to form 4,4''-dimethyl cholesta-8,14,24-triene-3-beta-ol in the ergosterol biosynthesis pathway; member of the cytochrome P450 family |
|
| YNR054C | 1.18 |
ESF2
|
Essential nucleolar protein involved in pre-18S rRNA processing; binds to RNA and stimulates ATPase activity of Dbp8; involved in assembly of the small subunit (SSU) processome |
|
| YER117W | 1.17 |
RPL23B
|
Protein component of the large (60S) ribosomal subunit, identical to Rpl23Ap and has similarity to E. coli L14 and rat L23 ribosomal proteins |
|
| YOL136C | 1.14 |
PFK27
|
6-phosphofructo-2-kinase, catalyzes synthesis of fructose-2,6-bisphosphate; inhibited by phosphoenolpyruvate and sn-glycerol 3-phosphate, expression induced by glucose and sucrose, transcriptional regulation involves protein kinase A |
|
| YPR029C | 1.11 |
APL4
|
Gamma-adaptin, large subunit of the clathrin-associated protein (AP-1) complex; binds clathrin; involved in vesicle mediated transport |
|
| YDR040C | 1.11 |
ENA1
|
P-type ATPase sodium pump, involved in Na+ and Li+ efflux to allow salt tolerance |
|
| YKR038C | 1.11 |
KAE1
|
Putative glycoprotease proposed to be in transcription as a component of the EKC protein complex with Bud32p, Cgi121p, Pcc1p, and Gon7p; also identified as a component of the KEOPS protein complex |
|
| YER159C | 1.10 |
BUR6
|
Subunit of a heterodimeric NC2 transcription regulator complex with Ncb2p; complex binds to TBP and can repress transcription by preventing preinitiation complex assembly or stimulate activated transcription; homologous to human NC2alpha |
|
| YER137C | 1.09 |
Putative protein of unknown function |
||
| YNL235C | 1.03 |
Dubious open reading frame unlikely to encode a protein, based on available experimental and comparative sequence data; partially overlaps the verified ORF SIN4/YNL236W, a subunit of the mediator complex |
||
| YKL180W | 1.02 |
RPL17A
|
Protein component of the large (60S) ribosomal subunit, nearly identical to Rpl17Bp and has similarity to E. coli L22 and rat L17 ribosomal proteins; copurifies with the Dam1 complex (aka DASH complex) |
|
| YGR157W | 1.01 |
CHO2
|
Phosphatidylethanolamine methyltransferase (PEMT), catalyzes the first step in the conversion of phosphatidylethanolamine to phosphatidylcholine during the methylation pathway of phosphatidylcholine biosynthesis |
|
| YJR105W | 0.99 |
ADO1
|
Adenosine kinase, required for the utilization of S-adenosylmethionine (AdoMet); may be involved in recycling adenosine produced through the methyl cycle |
|
| YMR015C | 0.97 |
ERG5
|
C-22 sterol desaturase, a cytochrome P450 enzyme that catalyzes the formation of the C-22(23) double bond in the sterol side chain in ergosterol biosynthesis; may be a target of azole antifungal drugs |
|
| YLR325C | 0.96 |
RPL38
|
Protein component of the large (60S) ribosomal subunit, has similarity to rat L38 ribosomal protein |
|
| YMR217W | 0.93 |
GUA1
|
GMP synthase, an enzyme that catalyzes the second step in the biosynthesis of GMP from inosine 5'-phosphate (IMP); transcription is not subject to regulation by guanine but is negatively regulated by nutrient starvation |
|
| YML026C | 0.93 |
RPS18B
|
Protein component of the small (40S) ribosomal subunit; nearly identical to Rps18Ap and has similarity to E. coli S13 and rat S18 ribosomal proteins |
|
| YHL028W | 0.92 |
WSC4
|
ER membrane protein involved in the translocation of soluble secretory proteins and insertion of membrane proteins into the ER membrane; may also have a role in the stress response but has only partial functional overlap with WSC1-3 |
|
| YDR044W | 0.92 |
HEM13
|
Coproporphyrinogen III oxidase, an oxygen requiring enzyme that catalyzes the sixth step in the heme biosynthetic pathway; localizes to the mitochondrial inner membrane; transcription is repressed by oxygen and heme (via Rox1p and Hap1p) |
|
| YLR109W | 0.92 |
AHP1
|
Thiol-specific peroxiredoxin, reduces hydroperoxides to protect against oxidative damage; function in vivo requires covalent conjugation to Urm1p |
|
| YML077W | 0.91 |
BET5
|
Component of the TRAPP (transport protein particle) complex, which plays an essential role in the vesicular transport from endoplasmic reticulum to Golgi |
|
| YDL192W | 0.89 |
ARF1
|
ADP-ribosylation factor, GTPase of the Ras superfamily involved in regulation of coated vesicle formation in intracellular trafficking within the Golgi; functionally interchangeable with Arf2p |
|
| YMR082C | 0.89 |
Dubious open reading frame unlikely to encode a functional protein, based on available experimental and comparative sequence data |
||
| YHR089C | 0.89 |
GAR1
|
Protein component of the H/ACA snoRNP pseudouridylase complex, involved in the modification and cleavage of the 18S pre-rRNA |
|
| YKL128C | 0.89 |
PMU1
|
Putative phosphomutase, contains a region homologous to the active site of phosphomutases; overexpression suppresses the histidine auxotrophy of an ade3 ade16 ade17 triple mutant and the temperature sensitivity of a tps2 mutant |
|
| YGR242W | 0.88 |
Dubious open reading frame unlikely to encode a protein, based on available experimental and comparative sequence data; partially overlaps the verified ORF YAP1802/YGR241C |
||
| YBL072C | 0.84 |
RPS8A
|
Protein component of the small (40S) ribosomal subunit; identical to Rps8Bp and has similarity to rat S8 ribosomal protein |
|
| YDL048C | 0.83 |
STP4
|
Protein containing a Kruppel-type zinc-finger domain; has similarity to Stp1p, Stp2p, and Stp3p |
|
| YPR163C | 0.83 |
TIF3
|
Translation initiation factor eIF-4B, has RNA annealing activity; contains an RNA recognition motif and binds to single-stranded RNA |
|
| YER055C | 0.83 |
HIS1
|
ATP phosphoribosyltransferase, a hexameric enzyme, catalyzes the first step in histidine biosynthesis; mutations cause histidine auxotrophy and sensitivity to Cu, Co, and Ni salts; transcription is regulated by general amino acid control |
|
| YPL263C | 0.82 |
KEL3
|
Cytoplasmic protein of unknown function |
|
| YML075C | 0.81 |
HMG1
|
One of two isozymes of HMG-CoA reductase that catalyzes the conversion of HMG-CoA to mevalonate, which is a rate-limiting step in sterol biosynthesis; localizes to the nuclear envelope; overproduction induces the formation of karmellae |
|
| YKR041W | 0.80 |
Putative protein of unknown function; green fluorescent protein (GFP)-fusion protein localizes to the cytoplasm and nucleus |
||
| YGR241C | 0.80 |
YAP1802
|
Protein involved in clathrin cage assembly; binds Pan1p and clathrin; homologous to Yap1801p, member of the AP180 protein family |
|
| YOR375C | 0.80 |
GDH1
|
NADP(+)-dependent glutamate dehydrogenase, synthesizes glutamate from ammonia and alpha-ketoglutarate; rate of alpha-ketoglutarate utilization differs from Gdh3p; expression regulated by nitrogen and carbon sources |
|
| YKR040C | 0.80 |
Dubious open reading frame unlikely to encode a protein, based on available experimental and comparative sequence data; partially overlaps the uncharacterized ORF YKR041W |
||
| YIL169C | 0.79 |
Putative protein of unknown function; serine/threonine rich and highly similar to YOL155C, a putative glucan alpha-1,4-glucosidase; transcript is induced in both high and low pH environments; YIL169C is a non-essential gene |
||
| YOR063W | 0.78 |
RPL3
|
Protein component of the large (60S) ribosomal subunit, has similarity to E. coli L3 and rat L3 ribosomal proteins; involved in the replication and maintenance of killer double stranded RNA virus |
|
| YKL014C | 0.78 |
URB1
|
Nucleolar protein required for the normal accumulation of 25S and 5.8S rRNAs, associated with the 27SA2 pre-ribosomal particle; proposed to be involved in the biogenesis of the 60S ribosomal subunit |
|
| YOR050C | 0.77 |
Hypothetical protein |
||
| YJL024C | 0.76 |
APS3
|
Small subunit of the clathrin-associated adaptor complex AP-3, which is involved in vacuolar protein sorting; related to the sigma subunit of the mammalian clathrin AP-3 complex; suppressor of loss of casein kinase 1 function |
|
| YER001W | 0.76 |
MNN1
|
Alpha-1,3-mannosyltransferase, integral membrane glycoprotein of the Golgi complex, required for addition of alpha1,3-mannose linkages to N-linked and O-linked oligosaccharides, one of five S. cerevisiae proteins of the MNN1 family |
|
| YPL112C | 0.74 |
PEX25
|
Peripheral peroxisomal membrane peroxin required for the regulation of peroxisome size and maintenance, recruits GTPase Rho1p to peroxisomes, induced by oleate, interacts with homologous protein Pex27p |
|
| YHR092C | 0.74 |
HXT4
|
High-affinity glucose transporter of the major facilitator superfamily, expression is induced by low levels of glucose and repressed by high levels of glucose |
|
| YEL054C | 0.74 |
RPL12A
|
Protein component of the large (60S) ribosomal subunit, nearly identical to Rpl12Bp; rpl12a rpl12b double mutant exhibits slow growth and slow translation; has similarity to E. coli L11 and rat L12 ribosomal proteins |
|
| YGR140W | 0.74 |
CBF2
|
Essential kinetochore protein, component of the CBF3 multisubunit complex that binds to the CDEIII region of the centromere; Cbf2p also binds to the CDEII region possibly forming a different multimeric complex, ubiquitinated in vivo |
|
| YOL014W | 0.74 |
Putative protein of unknown function |
||
| YDR278C | 0.73 |
Dubious open reading frame unlikely to encode a functional protein, based on available experimental and comparative sequence data |
||
| YGR017W | 0.72 |
Putative protein of unknown function; green fluorescent protein (GFP)-fusion protein localizes to both the nucleus and the cytoplasm |
||
| YNL231C | 0.71 |
PDR16
|
Phosphatidylinositol transfer protein (PITP) controlled by the multiple drug resistance regulator Pdr1p, localizes to lipid particles and microsomes, controls levels of various lipids, may regulate lipid synthesis, homologous to Pdr17p |
|
| YOL086C | 0.70 |
ADH1
|
Alcohol dehydrogenase, fermentative isozyme active as homo- or heterotetramers; required for the reduction of acetaldehyde to ethanol, the last step in the glycolytic pathway |
|
| YOR029W | 0.69 |
Dubious open reading frame unlikely to encode a functional protein; based on available experimental and comparative sequence data |
||
| YNL024C | 0.69 |
Putative protein of unknown function with seven beta-strand methyltransferase motif; green fluorescent protein (GFP)-fusion protein localizes to the cytoplasm; YNL024C is not an essential gene |
||
| YGL039W | 0.69 |
Oxidoreductase, catalyzes NADPH-dependent reduction of the bicyclic diketone bicyclo[2.2.2]octane-2,6-dione (BCO2,6D) to the chiral ketoalcohol (1R,4S,6S)-6-hydroxybicyclo[2.2.2]octane-2-one (BCO2one6ol) |
||
| YCR102W-A | 0.69 |
Dubious open reading frame unlikely to encode a protein, based on available experimental and comparative sequence data |
||
| YKR039W | 0.68 |
GAP1
|
General amino acid permease; localization to the plasma membrane is regulated by nitrogen source |
|
| YJR094C | 0.67 |
IME1
|
Master regulator of meiosis that is active only during meiotic events, activates transcription of early meiotic genes through interaction with Ume6p, degraded by the 26S proteasome following phosphorylation by Ime2p |
|
| YKR026C | 0.66 |
GCN3
|
Alpha subunit of the translation initiation factor eIF2B, the guanine-nucleotide exchange factor for eIF2; activity subsequently regulated by phosphorylated eIF2; first identified as a positive regulator of GCN4 expression |
|
| YDR279W | 0.65 |
RNH202
|
Ribonuclease H2 subunit, required for RNase H2 activity |
|
| YDR447C | 0.65 |
RPS17B
|
Ribosomal protein 51 (rp51) of the small (40s) subunit; nearly identical to Rps17Ap and has similarity to rat S17 ribosomal protein |
|
| YMR119W | 0.64 |
ASI1
|
Putative integral membrane E3 ubiquitin ligase; acts with Asi2p and Asi3p to ensure the fidelity of SPS-sensor signalling by maintaining the dormant repressed state of gene expression in the absence of inducing signals |
|
| YDR033W | 0.63 |
MRH1
|
Protein that localizes primarily to the plasma membrane, also found at the nuclear envelope; the authentic, non-tagged protein is detected in mitochondria in a phosphorylated state; has similarity to Hsp30p and Yro2p |
|
| YAR071W | 0.62 |
PHO11
|
One of three repressible acid phosphatases, a glycoprotein that is transported to the cell surface by the secretory pathway; induced by phosphate starvation and coordinately regulated by PHO4 and PHO2 |
|
| YDR215C | 0.61 |
Dubious open reading frame unlikely to encode a protein, based on available experimental and comparative sequence data; null mutant displays elevated sensitivity to expression of a mutant huntingtin fragment or of alpha-synuclein |
||
| YHR045W | 0.61 |
Putative protein of unknown function; green fluorescent protein (GFP)-fusion protein localizes to the endoplasmic reticulum |
||
| YBR106W | 0.61 |
PHO88
|
Probable membrane protein, involved in phosphate transport; pho88 pho86 double null mutant exhibits enhanced synthesis of repressible acid phosphatase at high inorganic phosphate concentrations |
|
| YFR057W | 0.60 |
Putative protein of unknown function |
||
| YOR051C | 0.60 |
Nuclear protein that inhibits replication of Brome mosaic virus in S. cerevisiae, which is a model system for studying replication of positive-strand RNA viruses in their natural hosts |
||
| YLR262C | 0.60 |
YPT6
|
GTPase, Ras-like GTP binding protein involved in the secretory pathway, required for fusion of endosome-derived vesicles with the late Golgi, maturation of the vacuolar carboxypeptidase Y; has similarity to the human GTPase, Rab6 |
|
| YLR108C | 0.60 |
Protein of unknown function; green fluorescent protein (GFP)-fusion protein localizes to the nucleus; YLR108C is not an esssential gene |
||
| YOL103W | 0.59 |
ITR2
|
Myo-inositol transporter with strong similarity to the major myo-inositol transporter Itr1p, member of the sugar transporter superfamily; expressed constitutively |
|
| YIR031C | 0.59 |
DAL7
|
Malate synthase, role in allantoin degradation unknown; expression sensitive to nitrogen catabolite repression and induced by allophanate, an intermediate in allantoin degradation |
|
| YLR420W | 0.58 |
URA4
|
Dihydroorotase, catalyzes the third enzymatic step in the de novo biosynthesis of pyrimidines, converting carbamoyl-L-aspartate into dihydroorotate |
|
| YLR301W | 0.58 |
Protein of unknown function that interacts with Sec72p |
||
| YMR241W | 0.58 |
YHM2
|
Mitochondrial DNA-binding protein, component of the mitochondrial nucleoid structure, involved in mtDNA replication and segregation of mitochondrial genomes; member of the mitochondrial carrier protein family |
|
| YNR001W-A | 0.58 |
Dubious open reading frame unlikely to encode a functional protein; identified by homology |
||
| YGL054C | 0.57 |
ERV14
|
Protein localized to COPII-coated vesicles, involved in vesicle formation and incorporation of specific secretory cargo; required for the delivery of bud-site selection protein Axl2p to cell surface; related to Drosophila cornichon |
|
| YKR093W | 0.57 |
PTR2
|
Integral membrane peptide transporter, mediates transport of di- and tri-peptides; conserved protein that contains 12 transmembrane domains; PTR2 expression is regulated by the N-end rule pathway via repression by Cup9p |
|
| YER048C | 0.56 |
CAJ1
|
Nuclear type II J heat shock protein of the E. coli dnaJ family, contains a leucine zipper-like motif, binds to non-native substrates for presentation to Ssa3p, may function during protein translocation, assembly and disassembly |
|
| YER124C | 0.56 |
DSE1
|
Daughter cell-specific protein, may participate in pathways regulating cell wall metabolism; deletion affects cell separation after division and sensitivity to drugs targeted against the cell wall |
|
| YCL063W | 0.55 |
VAC17
|
Protein involved in vacuole inheritance; acts as a vacuole-specific receptor for myosin Myo2p |
|
| YJL216C | 0.55 |
Protein of unknown function, similar to alpha-D-glucosidases; transcriptionally activated by both Pdr8p and Yrm1p, along with transporters and other genes involved in the pleiotropic drug resistance (PDR) phenomenon |
||
| YDR133C | 0.55 |
Dubious open reading frame unlikely to encode a protein, based on available experimental and comparative sequence data; partially overlaps YDR134C |
||
| YNL042W-B | 0.54 |
Putative protein of unknown function |
||
| YDR240C | 0.54 |
SNU56
|
Component of U1 snRNP required for mRNA splicing via spliceosome; yeast specific, no metazoan counterpart; interacts with mRNA in commitment complex |
|
| YML088W | 0.54 |
UFO1
|
F-box receptor protein, subunit of the Skp1-Cdc53-F-box receptor (SCF) E3 ubiquitin ligase complex; binds to phosphorylated Ho endonuclease, allowing its ubiquitylation by SCF and subsequent degradation |
|
| YBR162C | 0.54 |
TOS1
|
Covalently-bound cell wall protein of unknown function; identified as a cell cycle regulated SBF target gene; deletion mutants are highly resistant to treatment with beta-1,3-glucanase; has sequence similarity to YJL171C |
|
| YBR158W | 0.54 |
AMN1
|
Protein required for daughter cell separation, multiple mitotic checkpoints, and chromosome stability; contains 12 degenerate leucine-rich repeat motifs; expression is induced by the Mitotic Exit Network (MEN) |
|
| YPR148C | 0.53 |
Protein of unknown function that may interact with ribosomes, based on co-purification experiments; green fluorescent protein (GFP)-fusion protein localizes to the cytoplasm in a punctate pattern |
||
| YML106W | 0.53 |
URA5
|
Major orotate phosphoribosyltransferase (OPRTase) isozyme that catalyzes the fifth enzymatic step in de novo biosynthesis of pyrimidines, converting orotate into orotidine-5'-phosphate; minor OPRTase encoded by URA10 |
|
| YDR399W | 0.53 |
HPT1
|
Dimeric hypoxanthine-guanine phosphoribosyltransferase, catalyzes the formation of both inosine monophosphate and guanosine monophosphate; mutations in the human homolog HPRT1 can cause Lesch-Nyhan syndrome and Kelley-Seegmiller syndrome |
|
| YHR149C | 0.53 |
SKG6
|
Integral membrane protein that localizes primarily to growing sites such as the bud tip or the cell periphery; potential Cdc28p substrate; Skg6p interacts with Zds1p and Zds2p |
|
| YOR047C | 0.53 |
STD1
|
Protein involved in control of glucose-regulated gene expression; interacts with protein kinase Snf1p, glucose sensors Snf3p and Rgt2p, and TATA-binding protein Spt15p; acts as a regulator of the transcription factor Rgt1p |
|
| YMR049C | 0.52 |
ERB1
|
Protein required for maturation of the 25S and 5.8S ribosomal RNAs; constituent of 66S pre-ribosomal particles; homologous to mammalian Bop1 |
|
| YJL200C | 0.52 |
ACO2
|
Putative mitochondrial aconitase isozyme; similarity to Aco1p, an aconitase required for the TCA cycle; expression induced during growth on glucose, by amino acid starvation via Gcn4p, and repressed on ethanol |
|
| YLR110C | 0.52 |
CCW12
|
Cell wall mannoprotein, mutants are defective in mating and agglutination, expression is downregulated by alpha-factor |
|
| YLR453C | 0.52 |
RIF2
|
Protein that binds to the Rap1p C-terminus and acts synergistically with Rif1p to help control telomere length and establish telomeric silencing; deletion results in telomere elongation |
|
| YER048W-A | 0.51 |
ISD11
|
Protein required for mitochondrial iron-sulfur cluster biosynthesis |
|
| YPL249C-A | 0.51 |
RPL36B
|
Protein component of the large (60S) ribosomal subunit, nearly identical to Rpl36Ap and has similarity to rat L36 ribosomal protein; binds to 5.8 S rRNA |
|
| YGR251W | 0.51 |
Putative protein of unknown function; deletion mutant has defects in pre-rRNA processing; green fluorescent protein (GFP)-fusion protein localizes to both the nucleus and the nucleolus; YGR251W is an essential gene |
||
| YCR104W | 0.51 |
PAU3
|
Part of 23-member seripauperin multigene family encoded mainly in subtelomeric regions, active during alcoholic fermentation, regulated by anaerobiosis, negatively regulated by oxygen, repressed by heme |
|
| YEL027W | 0.51 |
CUP5
|
Proteolipid subunit of the vacuolar H(+)-ATPase V0 sector (subunit c; dicyclohexylcarbodiimide binding subunit); required for vacuolar acidification and important for copper and iron metal ion homeostasis |
|
| YMR315W | 0.50 |
Putative protein of unknown function; green fluorescent protein (GFP)-fusion protein localizes to the cytoplasm and nucleus; YMR315W is not an essential gene |
||
| YPR170W-A | 0.50 |
Dubious open reading frame unlikely to encode a functional protein, based on available experimental and comparative sequence data; identified by expression profiling and mass spectrometry |
||
| YGL258W | 0.49 |
VEL1
|
Protein of unknown function; highly induced in zinc-depleted conditions and has increased expression in NAP1 deletion mutants |
|
| YPL111W | 0.49 |
CAR1
|
Arginase, responsible for arginine degradation, expression responds to both induction by arginine and nitrogen catabolite repression; disruption enhances freeze tolerance |
|
| YOR342C | 0.49 |
Putative protein of unknown function; green fluorescent protein (GFP)-fusion protein localizes to the cytoplasm and the nucleus |
||
| YPR060C | 0.49 |
ARO7
|
Chorismate mutase, catalyzes the conversion of chorismate to prephenate to initiate the tyrosine/phenylalanine-specific branch of aromatic amino acid biosynthesis |
|
| YDR025W | 0.49 |
RPS11A
|
Protein component of the small (40S) ribosomal subunit; identical to Rps11Bp and has similarity to E. coli S17 and rat S11 ribosomal proteins |
|
| YER031C | 0.49 |
YPT31
|
GTPase of the Ypt/Rab family, very similar to Ypt32p; involved in the exocytic pathway; mediates intra-Golgi traffic or the budding of post-Golgi vesicles from the trans-Golgi |
|
| YOR153W | 0.48 |
PDR5
|
Plasma membrane ATP-binding cassette (ABC) transporter, short-lived multidrug transporter actively regulated by Pdr1p; also involved in steroid transport, cation resistance, and cellular detoxification during exponential growth |
|
| YEL029C | 0.47 |
BUD16
|
Putative pyridoxal kinase, key enzyme in vitamin B6 metabolism; involved in maintaining levels of pyridoxal 5'-phosphate, the active form of vitamin B6; required for genome integrity; homolog of E. coli PdxK; involved in bud-site selection |
|
| YGL037C | 0.47 |
PNC1
|
Nicotinamidase that converts nicotinamide to nicotinic acid as part of the NAD(+) salvage pathway, required for life span extension by calorie restriction; PNC1 expression responds to all known stimuli that extend replicative life span |
|
| YIL056W | 0.46 |
VHR1
|
Transcriptional activator, required for the vitamin H-responsive element (VHRE) mediated induction of VHT1 (Vitamin H transporter) and BIO5 (biotin biosynthesis intermediate transporter) in response to low biotin concentrations |
|
| YIL111W | 0.46 |
COX5B
|
Subunit Vb of cytochrome c oxidase, which is the terminal member of the mitochondrial inner membrane electron transport chain; predominantly expressed during anaerobic growth while its isoform Va (Cox5Ap) is expressed during aerobic growth |
|
| YLR185W | 0.46 |
RPL37A
|
Protein component of the large (60S) ribosomal subunit, has similarity to Rpl37Bp and to rat L37 ribosomal protein |
|
| YOR130C | 0.45 |
ORT1
|
Ornithine transporter of the mitochondrial inner membrane, exports ornithine from mitochondria as part of arginine biosynthesis; human ortholog is associated with hyperammonaemia-hyperornithinaemia-homocitrullinuria (HHH) syndrome |
|
| YNL016W | 0.45 |
PUB1
|
Poly(A)+ RNA-binding protein, abundant mRNP-component protein that binds mRNA and is required for stability of a number of mRNAs; not reported to associate with polyribosomes |
|
| YHR180W-A | 0.45 |
Dubious open reading frame unlikely to encode a protein, based on available experimental and comparative sequence data; partially overlaps dubious ORF YHR180C-B and long terminal repeat YHRCsigma3 |
||
| YEL040W | 0.44 |
UTR2
|
Cell wall protein that functions in the transfer of chitin to beta(1-6)glucan; putative chitin transglycosidase; glycosylphosphatidylinositol (GPI)-anchored protein localized to the bud neck; has a role in cell wall maintenance |
|
| YGR040W | 0.44 |
KSS1
|
Mitogen-activated protein kinase (MAPK) involved in signal transduction pathways that control filamentous growth and pheromone response; the KSS1 gene is nonfunctional in S288C strains and functional in W303 strains |
|
| YNL337W | 0.44 |
Dubious open reading frame unlikely to encode a protein, based on available experimental and comparative sequence data |
||
| YPR170W-B | 0.44 |
Putative protein of unknown function, conserved in fungi; partially overlaps the dubious genes YPR169W-A, YPR170W-A and YRP170C |
||
| YNR072W | 0.43 |
HXT17
|
Hexose transporter, up-regulated in media containing raffinose and galactose at pH 7.7 versus pH 4.7, repressed by high levels of glucose |
|
| YPR063C | 0.43 |
ER-localized protein of unknown function |
||
| YEL001C | 0.43 |
IRC22
|
Putative protein of unknown function; green fluorescent protein (GFP)-fusion localizes to the ER; YEL001C is non-essential; null mutant displays increased levels of spontaneous Rad52p foci |
|
| YLR183C | 0.43 |
TOS4
|
Transcription factor that binds to a number of promoter regions, particularly promoters of some genes involved in pheromone response and cell cycle; potential Cdc28p substrate; expression is induced in G1 by bound SBF |
|
| YDL007W | 0.43 |
RPT2
|
One of six ATPases of the 19S regulatory particle of the 26S proteasome involved in the degradation of ubiquitinated substrates; required for normal peptide hydrolysis by the core 20S particle |
|
| YML111W | 0.43 |
BUL2
|
Component of the Rsp5p E3-ubiquitin ligase complex, involved in intracellular amino acid permease sorting, functions in heat shock element mediated gene expression, essential for growth in stress conditions, functional homolog of BUL1 |
|
| YBR159W | 0.42 |
IFA38
|
Microsomal beta-keto-reductase; contains oleate response element (ORE) sequence in the promoter region; mutants exhibit reduced VLCFA synthesis, accumulate high levels of dihydrosphingosine, phytosphingosine and medium-chain ceramides |
|
| YMR033W | 0.42 |
ARP9
|
Component of both the SWI/SNF and RSC chromatin remodeling complexes; actin-related protein involved in transcriptional regulation |
|
| YPL144W | 0.42 |
POC4
|
Component of a heterodimeric Poc4p-Irc25p chaperone involved in assembly of alpha subunits into the 20S proteasome; may regulate formation of proteasome isoforms with alternative subunits under different conditions |
|
| YPL220W | 0.42 |
RPL1A
|
N-terminally acetylated protein component of the large (60S) ribosomal subunit, nearly identical to Rpl1Bp and has similarity to E. coli L1 and rat L10a ribosomal proteins; rpl1a rpl1b double null mutation is lethal |
|
| YNL280C | 0.41 |
ERG24
|
C-14 sterol reductase, acts in ergosterol biosynthesis; mutants accumulate the abnormal sterol ignosterol (ergosta-8,14 dienol), and are viable under anaerobic growth conditions but inviable on rich medium under aerobic conditions |
|
| YDR088C | 0.41 |
SLU7
|
RNA splicing factor, required for ATP-independent portion of 2nd catalytic step of spliceosomal RNA splicing; interacts with Prp18p; contains zinc knuckle domain |
|
| YFL028C | 0.41 |
CAF16
|
Part of the evolutionarily-conserved CCR4-NOT transcriptional regulatory complex involved in controlling mRNA initiation, elongation, and degradation; putative ABC ATPase; interacts with Ssn2p, Ssn3p, and Ssn8p |
|
| YGR240C | 0.40 |
PFK1
|
Alpha subunit of heterooctameric phosphofructokinase involved in glycolysis, indispensable for anaerobic growth, activated by fructose-2,6-bisphosphate and AMP, mutation inhibits glucose induction of cell cycle-related genes |
|
| YKR027W | 0.40 |
BCH2
|
Member of the ChAPs family of proteins (Chs5p-Arf1p-binding proteins: Bch1p, Bch2p, Bud7p, Chs6p), that forms the exomer complex with Chs5p to mediate export of specific cargo proteins, including Chs3p, from the Golgi to the plasma membrane |
|
| YMR083W | 0.40 |
ADH3
|
Mitochondrial alcohol dehydrogenase isozyme III; involved in the shuttling of mitochondrial NADH to the cytosol under anaerobic conditions and ethanol production |
|
| YKL110C | 0.39 |
KTI12
|
Protein that plays a role, with Elongator complex, in modification of wobble nucleosides in tRNA; involved in sensitivity to G1 arrest induced by zymocin; interacts with chromatin throughout the genome; also interacts with Cdc19p |
|
| YGL031C | 0.39 |
RPL24A
|
Ribosomal protein L30 of the large (60S) ribosomal subunit, nearly identical to Rpl24Bp and has similarity to rat L24 ribosomal protein; not essential for translation but may be required for normal translation rate |
|
| YNR030W | 0.39 |
ALG12
|
Alpha-1,6-mannosyltransferase localized to the ER; responsible for the addition of the alpha-1,6 mannose to dolichol-linked Man7GlcNAc2, acts in the dolichol pathway for N-glycosylation |
|
| YMR194C-A | 0.39 |
Dubious open reading frame unlikely to encode a functional protein, based on available experimental and comparative sequence data |
||
| YKL052C | 0.39 |
ASK1
|
Essential subunit of the Dam1 complex (aka DASH complex), couples kinetochores to the force produced by MT depolymerization thereby aiding in chromosome segregation; phosphorylated during the cell cycle by cyclin-dependent kinases |
|
| YKL097C | 0.39 |
Dubious open reading frame, unlikely to encode a protein; not conserved in closely related Saccharomyces species |
||
| YPR157W | 0.38 |
Putative protein of unknown function; induced by treatment with 8-methoxypsoralen and UVA irradiation |
||
| YER032W | 0.38 |
FIR1
|
Protein involved in 3' mRNA processing, interacts with Ref2p; potential Cdc28p substrate |
|
| YOR028C | 0.38 |
CIN5
|
Basic leucine zipper transcriptional factor of the yAP-1 family that mediates pleiotropic drug resistance and salt tolerance; localizes constitutively to the nucleus |
|
| YPL197C | 0.38 |
Dubious open reading frame unlikely to encode a protein, based on experimental and comparative sequence data; partially overlaps the ribosomal gene RPB7B |
||
| YBR011C | 0.37 |
IPP1
|
Cytoplasmic inorganic pyrophosphatase (PPase), catalyzes the rapid exchange of oxygens from Pi with water, highly expressed and essential for viability, active-site residues show identity to those from E. coli PPase |
|
| YBR012C | 0.36 |
Dubious open reading frame, unlikely to encode a functional protein; expression induced by iron-regulated transcriptional activator Aft2p |
||
| YBR300C | 0.36 |
Dubious open reading frame unlikely to encode a protein, based on available experimental and comparative sequence data; partially overlaps the verified gene YBR301W; YBR300C is not an essential gene |
||
| YOR103C | 0.36 |
OST2
|
Epsilon subunit of the oligosaccharyltransferase complex of the ER lumen, which catalyzes asparagine-linked glycosylation of newly synthesized proteins |
|
| YLR448W | 0.36 |
RPL6B
|
Protein component of the large (60S) ribosomal subunit, has similarity to Rpl6Ap and to rat L6 ribosomal protein; binds to 5.8S rRNA |
|
| YHL018W | 0.36 |
Putative protein of unknown function; green fluorescent protein (GFP)-fusion protein localizes to mitochondria and is induced in response to the DNA-damaging agent MMS |
||
| YDR331W | 0.36 |
GPI8
|
ER membrane glycoprotein subunit of the glycosylphosphatidylinositol transamidase complex that adds glycosylphosphatidylinositol (GPI) anchors to newly synthesized proteins; human PIG-K protein is a functional homolog |
|
| YBR121C | 0.35 |
GRS1
|
Cytoplasmic and mitochondrial glycyl-tRNA synthase that ligates glycine to the cognate anticodon bearing tRNA; transcription termination factor that may interact with the 3'-end of pre-mRNA to promote 3'-end formation |
|
| YGR293C | 0.35 |
Dubious open reading frame unlikely to encode a protein, based on available experimental and comparative sequence data; partially overlaps the uncharacterized ORF YGR294W |
||
| YOR222W | 0.35 |
ODC2
|
Mitochondrial inner membrane transporter, exports 2-oxoadipate and 2-oxoglutarate from the mitochondrial matrix to the cytosol for use in lysine and glutamate biosynthesis and in lysine catabolism |
|
| YMR011W | 0.35 |
HXT2
|
High-affinity glucose transporter of the major facilitator superfamily, expression is induced by low levels of glucose and repressed by high levels of glucose |
|
| YKL153W | 0.35 |
Dubious open reading frame unlikely to encode a protein, based on available experimental and comparative sequence data; transcription of both YLK153W and the overlapping essential gene GPM1 is reduced in the gcr1 null mutant |
||
| YCR106W | 0.35 |
RDS1
|
Zinc cluster transcription factor involved in conferring resistance to cycloheximide |
|
| YGL040C | 0.34 |
HEM2
|
Delta-aminolevulinate dehydratase, a homo-octameric enzyme, catalyzes the conversion of delta-aminolevulinic acid to porphobilinogen, the second step in the heme biosynthetic pathway; localizes to both the cytoplasm and nucleus |
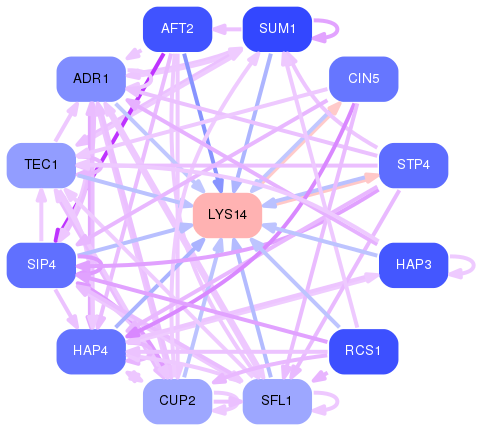
Network of associatons between targets according to the STRING database.

First level regulatory network of LYS14
Gene Ontology Analysis
Gene overrepresentation in biological process category:
| Log-likelihood per target | Total log-likelihood | Term | Description |
|---|---|---|---|
| 2.5 | 7.5 | GO:0000098 | sulfur amino acid catabolic process(GO:0000098) |
| 0.5 | 3.5 | GO:0043137 | DNA replication, removal of RNA primer(GO:0043137) |
| 0.5 | 0.5 | GO:0019357 | nicotinate nucleotide biosynthetic process(GO:0019357) nicotinate nucleotide salvage(GO:0019358) pyridine nucleotide salvage(GO:0019365) nicotinate nucleotide metabolic process(GO:0046497) |
| 0.4 | 7.7 | GO:0006407 | rRNA export from nucleus(GO:0006407) rRNA transport(GO:0051029) |
| 0.4 | 1.6 | GO:0000296 | spermine transport(GO:0000296) |
| 0.4 | 2.7 | GO:0010696 | positive regulation of spindle pole body separation(GO:0010696) |
| 0.4 | 1.1 | GO:0006003 | fructose 2,6-bisphosphate metabolic process(GO:0006003) |
| 0.3 | 1.7 | GO:0046417 | chorismate metabolic process(GO:0046417) |
| 0.3 | 1.5 | GO:0006177 | GMP biosynthetic process(GO:0006177) |
| 0.3 | 0.8 | GO:0045901 | positive regulation of translational elongation(GO:0045901) |
| 0.2 | 0.9 | GO:0009240 | isopentenyl diphosphate biosynthetic process(GO:0009240) isopentenyl diphosphate biosynthetic process, mevalonate pathway(GO:0019287) isopentenyl diphosphate metabolic process(GO:0046490) |
| 0.2 | 2.6 | GO:0000028 | ribosomal small subunit assembly(GO:0000028) |
| 0.2 | 1.3 | GO:0046501 | protoporphyrinogen IX biosynthetic process(GO:0006782) protoporphyrinogen IX metabolic process(GO:0046501) |
| 0.2 | 0.5 | GO:0046495 | nicotinamide riboside metabolic process(GO:0046495) pyridine nucleoside metabolic process(GO:0070637) |
| 0.2 | 1.2 | GO:0043457 | regulation of cellular respiration(GO:0043457) |
| 0.2 | 1.3 | GO:0048017 | inositol lipid-mediated signaling(GO:0048017) |
| 0.2 | 1.4 | GO:0006814 | sodium ion transport(GO:0006814) |
| 0.2 | 1.4 | GO:0006384 | transcription initiation from RNA polymerase III promoter(GO:0006384) |
| 0.2 | 4.5 | GO:0045454 | cell redox homeostasis(GO:0045454) |
| 0.2 | 0.2 | GO:0046037 | GMP metabolic process(GO:0046037) |
| 0.1 | 0.1 | GO:0042454 | ribonucleoside catabolic process(GO:0042454) |
| 0.1 | 0.1 | GO:0032447 | protein urmylation(GO:0032447) |
| 0.1 | 0.6 | GO:0019627 | urea metabolic process(GO:0019627) |
| 0.1 | 1.0 | GO:0031120 | snRNA pseudouridine synthesis(GO:0031120) snRNA modification(GO:0040031) |
| 0.1 | 0.4 | GO:0019676 | ammonia assimilation cycle(GO:0019676) |
| 0.1 | 1.0 | GO:0046677 | response to antibiotic(GO:0046677) |
| 0.1 | 0.6 | GO:0030497 | fatty acid elongation(GO:0030497) |
| 0.1 | 1.6 | GO:0009435 | NAD biosynthetic process(GO:0009435) |
| 0.1 | 0.8 | GO:0044205 | 'de novo' pyrimidine nucleobase biosynthetic process(GO:0006207) 'de novo' UMP biosynthetic process(GO:0044205) |
| 0.1 | 0.4 | GO:0044209 | AMP salvage(GO:0044209) |
| 0.1 | 0.8 | GO:0006491 | N-glycan processing(GO:0006491) |
| 0.1 | 0.3 | GO:0071825 | lipid tube assembly(GO:0060988) protein-lipid complex assembly(GO:0065005) protein-lipid complex subunit organization(GO:0071825) |
| 0.1 | 1.1 | GO:0070525 | tRNA threonylcarbamoyladenosine metabolic process(GO:0070525) |
| 0.1 | 1.2 | GO:0006116 | NADH oxidation(GO:0006116) |
| 0.1 | 0.2 | GO:0070072 | proton-transporting V-type ATPase complex assembly(GO:0070070) vacuolar proton-transporting V-type ATPase complex assembly(GO:0070072) |
| 0.1 | 0.3 | GO:0031565 | obsolete cytokinesis checkpoint(GO:0031565) |
| 0.1 | 0.2 | GO:0009094 | tyrosine biosynthetic process(GO:0006571) L-phenylalanine biosynthetic process(GO:0009094) erythrose 4-phosphate/phosphoenolpyruvate family amino acid biosynthetic process(GO:1902223) |
| 0.1 | 2.8 | GO:0097384 | ergosterol biosynthetic process(GO:0006696) phytosteroid biosynthetic process(GO:0016129) cellular alcohol biosynthetic process(GO:0044108) cellular lipid biosynthetic process(GO:0097384) |
| 0.1 | 14.6 | GO:0002181 | cytoplasmic translation(GO:0002181) |
| 0.1 | 1.0 | GO:0006694 | steroid biosynthetic process(GO:0006694) sterol biosynthetic process(GO:0016126) |
| 0.1 | 0.6 | GO:0071406 | response to methylmercury(GO:0051597) cellular response to methylmercury(GO:0071406) |
| 0.1 | 0.4 | GO:0098742 | agglutination involved in conjugation with cellular fusion(GO:0000752) agglutination involved in conjugation(GO:0000771) heterophilic cell-cell adhesion via plasma membrane cell adhesion molecules(GO:0007157) cell-cell adhesion(GO:0098609) adhesion between unicellular organisms(GO:0098610) multi organism cell adhesion(GO:0098740) cell-cell adhesion via plasma-membrane adhesion molecules(GO:0098742) |
| 0.1 | 0.6 | GO:0000255 | allantoin metabolic process(GO:0000255) allantoin catabolic process(GO:0000256) cellular amide catabolic process(GO:0043605) |
| 0.1 | 0.3 | GO:0006432 | phenylalanyl-tRNA aminoacylation(GO:0006432) |
| 0.1 | 1.0 | GO:0052803 | histidine biosynthetic process(GO:0000105) histidine metabolic process(GO:0006547) imidazole-containing compound metabolic process(GO:0052803) |
| 0.1 | 0.4 | GO:1900434 | filamentous growth of a population of unicellular organisms in response to starvation(GO:0036170) regulation of filamentous growth of a population of unicellular organisms in response to starvation(GO:1900434) positive regulation of filamentous growth of a population of unicellular organisms in response to starvation(GO:1900436) |
| 0.1 | 1.5 | GO:0010383 | cell wall polysaccharide metabolic process(GO:0010383) |
| 0.1 | 2.3 | GO:0006885 | regulation of pH(GO:0006885) |
| 0.1 | 1.1 | GO:0007120 | axial cellular bud site selection(GO:0007120) |
| 0.1 | 0.3 | GO:0009371 | positive regulation of transcription from RNA polymerase II promoter by pheromones(GO:0007329) positive regulation of transcription by pheromones(GO:0009371) |
| 0.1 | 0.7 | GO:0016559 | peroxisome fission(GO:0016559) |
| 0.1 | 0.4 | GO:0051131 | chaperone-mediated protein complex assembly(GO:0051131) |
| 0.1 | 0.2 | GO:0072363 | regulation of glycolytic process by regulation of transcription from RNA polymerase II promoter(GO:0072361) regulation of glycolytic process by positive regulation of transcription from RNA polymerase II promoter(GO:0072363) |
| 0.1 | 0.2 | GO:0009186 | deoxyribonucleoside diphosphate metabolic process(GO:0009186) deoxyribonucleoside triphosphate biosynthetic process(GO:0009202) |
| 0.1 | 0.6 | GO:0042938 | dipeptide transport(GO:0042938) |
| 0.1 | 0.1 | GO:0071902 | positive regulation of protein serine/threonine kinase activity(GO:0071902) |
| 0.1 | 0.4 | GO:0043433 | negative regulation of sequence-specific DNA binding transcription factor activity(GO:0043433) |
| 0.1 | 0.2 | GO:0046855 | phosphorylated carbohydrate dephosphorylation(GO:0046838) inositol phosphate dephosphorylation(GO:0046855) inositol phosphate catabolic process(GO:0071545) |
| 0.1 | 1.7 | GO:0002098 | tRNA wobble base modification(GO:0002097) tRNA wobble uridine modification(GO:0002098) |
| 0.1 | 0.5 | GO:0006488 | dolichol-linked oligosaccharide biosynthetic process(GO:0006488) |
| 0.1 | 0.4 | GO:0016255 | attachment of GPI anchor to protein(GO:0016255) |
| 0.1 | 0.2 | GO:0019255 | glucose 1-phosphate metabolic process(GO:0019255) |
| 0.1 | 0.7 | GO:0051231 | mitotic spindle elongation(GO:0000022) spindle elongation(GO:0051231) |
| 0.1 | 0.4 | GO:0001676 | long-chain fatty acid metabolic process(GO:0001676) |
| 0.1 | 0.5 | GO:0010969 | regulation of pheromone-dependent signal transduction involved in conjugation with cellular fusion(GO:0010969) regulation of signal transduction involved in conjugation with cellular fusion(GO:0060238) |
| 0.1 | 0.7 | GO:0034498 | early endosome to Golgi transport(GO:0034498) |
| 0.1 | 1.0 | GO:0006656 | phosphatidylcholine biosynthetic process(GO:0006656) |
| 0.1 | 0.5 | GO:0016233 | telomere capping(GO:0016233) |
| 0.1 | 0.4 | GO:0042823 | pyridoxal phosphate metabolic process(GO:0042822) pyridoxal phosphate biosynthetic process(GO:0042823) aldehyde biosynthetic process(GO:0046184) |
| 0.1 | 0.2 | GO:0032211 | negative regulation of telomere maintenance via telomerase(GO:0032211) negative regulation of telomere maintenance via telomere lengthening(GO:1904357) |
| 0.1 | 0.4 | GO:0043171 | peptide catabolic process(GO:0043171) |
| 0.1 | 0.1 | GO:0031384 | regulation of initiation of mating projection growth(GO:0031384) |
| 0.1 | 0.2 | GO:0000388 | spliceosome conformational change to release U4 (or U4atac) and U1 (or U11)(GO:0000388) |
| 0.1 | 0.4 | GO:0006901 | vesicle coating(GO:0006901) |
| 0.1 | 0.3 | GO:0045053 | protein retention in Golgi apparatus(GO:0045053) |
| 0.1 | 0.2 | GO:0006596 | polyamine biosynthetic process(GO:0006596) |
| 0.1 | 0.1 | GO:0010695 | regulation of spindle pole body separation(GO:0010695) |
| 0.1 | 0.2 | GO:0060277 | obsolete negative regulation of transcription involved in G1 phase of mitotic cell cycle(GO:0060277) |
| 0.1 | 0.2 | GO:0007535 | donor selection(GO:0007535) |
| 0.1 | 0.4 | GO:0034063 | stress granule assembly(GO:0034063) |
| 0.1 | 0.1 | GO:1904668 | positive regulation of mitotic nuclear division(GO:0045840) positive regulation of mitotic metaphase/anaphase transition(GO:0045842) positive regulation of mitotic sister chromatid separation(GO:1901970) positive regulation of metaphase/anaphase transition of cell cycle(GO:1902101) positive regulation of ubiquitin protein ligase activity(GO:1904668) |
| 0.1 | 0.2 | GO:0006361 | transcription initiation from RNA polymerase I promoter(GO:0006361) |
| 0.1 | 0.4 | GO:0009306 | protein secretion(GO:0009306) |
| 0.1 | 0.9 | GO:0006446 | regulation of translational initiation(GO:0006446) |
| 0.1 | 1.6 | GO:0051445 | regulation of meiotic nuclear division(GO:0040020) regulation of meiotic cell cycle(GO:0051445) |
| 0.0 | 0.6 | GO:0031110 | regulation of microtubule polymerization or depolymerization(GO:0031110) |
| 0.0 | 0.3 | GO:0046513 | ceramide metabolic process(GO:0006672) ceramide biosynthetic process(GO:0046513) |
| 0.0 | 0.5 | GO:0032889 | regulation of vacuole fusion, non-autophagic(GO:0032889) regulation of vacuole organization(GO:0044088) |
| 0.0 | 0.1 | GO:0031047 | gene silencing involved in chronological cell aging(GO:0010978) gene silencing by RNA(GO:0031047) |
| 0.0 | 1.1 | GO:0006891 | intra-Golgi vesicle-mediated transport(GO:0006891) |
| 0.0 | 0.5 | GO:0000011 | vacuole inheritance(GO:0000011) |
| 0.0 | 0.4 | GO:0016584 | nucleosome positioning(GO:0016584) |
| 0.0 | 0.2 | GO:0032878 | regulation of establishment or maintenance of cell polarity(GO:0032878) |
| 0.0 | 0.1 | GO:0006624 | vacuolar protein processing(GO:0006624) |
| 0.0 | 0.4 | GO:0000350 | generation of catalytic spliceosome for second transesterification step(GO:0000350) |
| 0.0 | 1.1 | GO:0006896 | Golgi to vacuole transport(GO:0006896) |
| 0.0 | 0.3 | GO:0034724 | DNA replication-independent nucleosome organization(GO:0034724) |
| 0.0 | 0.4 | GO:0006817 | phosphate ion transport(GO:0006817) |
| 0.0 | 0.3 | GO:0034729 | histone H3-K79 methylation(GO:0034729) |
| 0.0 | 0.3 | GO:0009099 | valine biosynthetic process(GO:0009099) |
| 0.0 | 0.7 | GO:0006378 | mRNA polyadenylation(GO:0006378) |
| 0.0 | 0.5 | GO:0006526 | arginine biosynthetic process(GO:0006526) |
| 0.0 | 0.4 | GO:0006474 | N-terminal protein amino acid acetylation(GO:0006474) |
| 0.0 | 0.1 | GO:1901985 | regulation of histone acetylation(GO:0035065) positive regulation of histone acetylation(GO:0035066) regulation of protein acetylation(GO:1901983) positive regulation of protein acetylation(GO:1901985) regulation of peptidyl-lysine acetylation(GO:2000756) positive regulation of peptidyl-lysine acetylation(GO:2000758) |
| 0.0 | 0.6 | GO:0042147 | retrograde transport, endosome to Golgi(GO:0042147) |
| 0.0 | 0.5 | GO:0001100 | negative regulation of exit from mitosis(GO:0001100) |
| 0.0 | 0.2 | GO:0009097 | isoleucine biosynthetic process(GO:0009097) |
| 0.0 | 0.5 | GO:0031163 | iron-sulfur cluster assembly(GO:0016226) metallo-sulfur cluster assembly(GO:0031163) |
| 0.0 | 0.3 | GO:0030846 | termination of RNA polymerase II transcription, poly(A)-coupled(GO:0030846) |
| 0.0 | 1.2 | GO:0043547 | positive regulation of GTPase activity(GO:0043547) |
| 0.0 | 0.1 | GO:0070827 | chromatin maintenance(GO:0070827) |
| 0.0 | 0.8 | GO:0000463 | maturation of LSU-rRNA from tricistronic rRNA transcript (SSU-rRNA, 5.8S rRNA, LSU-rRNA)(GO:0000463) |
| 0.0 | 0.3 | GO:0042138 | meiotic DNA double-strand break formation(GO:0042138) |
| 0.0 | 0.4 | GO:0006353 | DNA-templated transcription, termination(GO:0006353) |
| 0.0 | 0.1 | GO:0043902 | positive regulation of multi-organism process(GO:0043902) |
| 0.0 | 0.2 | GO:0070911 | global genome nucleotide-excision repair(GO:0070911) |
| 0.0 | 0.2 | GO:0009098 | leucine biosynthetic process(GO:0009098) |
| 0.0 | 0.1 | GO:0031590 | wybutosine metabolic process(GO:0031590) wybutosine biosynthetic process(GO:0031591) |
| 0.0 | 0.5 | GO:0006448 | regulation of translational elongation(GO:0006448) |
| 0.0 | 0.1 | GO:0015883 | FAD transport(GO:0015883) |
| 0.0 | 0.4 | GO:0032986 | nucleosome disassembly(GO:0006337) chromatin disassembly(GO:0031498) protein-DNA complex disassembly(GO:0032986) |
| 0.0 | 0.1 | GO:0031335 | regulation of sulfur amino acid metabolic process(GO:0031335) |
| 0.0 | 0.3 | GO:0000056 | ribosomal small subunit export from nucleus(GO:0000056) |
| 0.0 | 0.1 | GO:0046831 | regulation of mRNA export from nucleus(GO:0010793) regulation of nucleobase-containing compound transport(GO:0032239) regulation of RNA export from nucleus(GO:0046831) regulation of ribonucleoprotein complex localization(GO:2000197) |
| 0.0 | 1.4 | GO:0006888 | ER to Golgi vesicle-mediated transport(GO:0006888) |
| 0.0 | 0.1 | GO:0045048 | protein insertion into ER membrane(GO:0045048) |
| 0.0 | 0.4 | GO:0006513 | protein monoubiquitination(GO:0006513) |
| 0.0 | 0.3 | GO:0009304 | tRNA transcription(GO:0009304) tRNA transcription from RNA polymerase III promoter(GO:0042797) |
| 0.0 | 0.1 | GO:0051125 | regulation of Arp2/3 complex-mediated actin nucleation(GO:0034315) regulation of actin nucleation(GO:0051125) |
| 0.0 | 0.1 | GO:0015780 | nucleotide-sugar transport(GO:0015780) |
| 0.0 | 0.1 | GO:0022615 | protein import into peroxisome matrix, docking(GO:0016560) protein to membrane docking(GO:0022615) |
| 0.0 | 0.8 | GO:0045047 | protein targeting to ER(GO:0045047) |
| 0.0 | 0.5 | GO:0071428 | rRNA-containing ribonucleoprotein complex export from nucleus(GO:0071428) |
| 0.0 | 0.2 | GO:0015846 | polyamine transport(GO:0015846) |
| 0.0 | 3.6 | GO:0006364 | rRNA processing(GO:0006364) |
| 0.0 | 0.1 | GO:0005980 | glycogen catabolic process(GO:0005980) |
| 0.0 | 0.6 | GO:0006487 | protein N-linked glycosylation(GO:0006487) |
| 0.0 | 0.0 | GO:0006658 | phosphatidylserine metabolic process(GO:0006658) |
| 0.0 | 0.1 | GO:0043555 | regulation of translation in response to stress(GO:0043555) |
| 0.0 | 0.3 | GO:0030488 | tRNA methylation(GO:0030488) |
| 0.0 | 0.0 | GO:0000117 | regulation of transcription involved in G2/M transition of mitotic cell cycle(GO:0000117) |
| 0.0 | 0.1 | GO:0034975 | protein folding in endoplasmic reticulum(GO:0034975) |
| 0.0 | 0.1 | GO:0016024 | CDP-diacylglycerol biosynthetic process(GO:0016024) CDP-diacylglycerol metabolic process(GO:0046341) |
| 0.0 | 0.2 | GO:0006882 | cellular zinc ion homeostasis(GO:0006882) zinc ion homeostasis(GO:0055069) |
| 0.0 | 0.6 | GO:0008033 | tRNA processing(GO:0008033) |
| 0.0 | 0.1 | GO:0045292 | mRNA cis splicing, via spliceosome(GO:0045292) |
| 0.0 | 0.1 | GO:0009373 | regulation of transcription by pheromones(GO:0009373) negative regulation of transcription by pheromones(GO:0045996) regulation of transcription from RNA polymerase II promoter by pheromones(GO:0046019) negative regulation of transcription from RNA polymerase II promoter by pheromones(GO:0046020) |
| 0.0 | 0.0 | GO:0034517 | ribophagy(GO:0034517) |
| 0.0 | 0.2 | GO:0030011 | maintenance of cell polarity(GO:0030011) |
| 0.0 | 0.1 | GO:0009636 | response to toxic substance(GO:0009636) |
| 0.0 | 0.3 | GO:0006633 | fatty acid biosynthetic process(GO:0006633) |
| 0.0 | 0.1 | GO:0034503 | protein localization to nucleolar rDNA repeats(GO:0034503) |
| 0.0 | 0.2 | GO:0042790 | transcription of nuclear large rRNA transcript from RNA polymerase I promoter(GO:0042790) |
| 0.0 | 0.0 | GO:0007000 | nucleolus organization(GO:0007000) |
| 0.0 | 0.0 | GO:0008299 | isoprenoid metabolic process(GO:0006720) isoprenoid biosynthetic process(GO:0008299) |
| 0.0 | 0.1 | GO:0046351 | trehalose biosynthetic process(GO:0005992) oligosaccharide biosynthetic process(GO:0009312) disaccharide biosynthetic process(GO:0046351) |
| 0.0 | 0.9 | GO:0016311 | dephosphorylation(GO:0016311) |
| 0.0 | 0.1 | GO:0006415 | translational termination(GO:0006415) |
| 0.0 | 0.3 | GO:0006505 | GPI anchor metabolic process(GO:0006505) |
| 0.0 | 0.2 | GO:0030950 | establishment or maintenance of actin cytoskeleton polarity(GO:0030950) establishment or maintenance of cytoskeleton polarity(GO:0030952) |
| 0.0 | 0.1 | GO:0000027 | ribosomal large subunit assembly(GO:0000027) |
| 0.0 | 0.1 | GO:0006284 | base-excision repair(GO:0006284) |
| 0.0 | 0.3 | GO:0030150 | protein import into mitochondrial matrix(GO:0030150) |
| 0.0 | 0.0 | GO:0015680 | intracellular copper ion transport(GO:0015680) |
| 0.0 | 0.0 | GO:0009071 | serine family amino acid catabolic process(GO:0009071) |
| 0.0 | 0.1 | GO:0045116 | protein neddylation(GO:0045116) |
| 0.0 | 0.3 | GO:0006184 | obsolete GTP catabolic process(GO:0006184) |
| 0.0 | 0.0 | GO:0006857 | oligopeptide transport(GO:0006857) |
| 0.0 | 0.2 | GO:0006730 | one-carbon metabolic process(GO:0006730) |
| 0.0 | 0.0 | GO:0000101 | sulfur amino acid transport(GO:0000101) |
Gene overrepresentation in cellular component category:
| Log-likelihood per target | Total log-likelihood | Term | Description |
|---|---|---|---|
| 1.2 | 3.5 | GO:0032299 | ribonuclease H2 complex(GO:0032299) |
| 0.3 | 1.1 | GO:0017053 | transcriptional repressor complex(GO:0017053) |
| 0.2 | 1.0 | GO:0031429 | box H/ACA snoRNP complex(GO:0031429) box H/ACA RNP complex(GO:0072588) |
| 0.2 | 1.1 | GO:0000408 | EKC/KEOPS complex(GO:0000408) |
| 0.2 | 0.8 | GO:0030123 | AP-3 adaptor complex(GO:0030123) |
| 0.2 | 0.7 | GO:0031518 | CBF3 complex(GO:0031518) |
| 0.2 | 0.5 | GO:0070545 | PeBoW complex(GO:0070545) |
| 0.2 | 0.9 | GO:0005851 | eukaryotic translation initiation factor 2B complex(GO:0005851) |
| 0.2 | 9.8 | GO:0022627 | cytosolic small ribosomal subunit(GO:0022627) |
| 0.1 | 12.4 | GO:0022625 | cytosolic large ribosomal subunit(GO:0022625) |
| 0.1 | 0.8 | GO:0030121 | AP-1 adaptor complex(GO:0030121) |
| 0.1 | 1.1 | GO:0030008 | TRAPP complex(GO:0030008) |
| 0.1 | 0.4 | GO:0000131 | incipient cellular bud site(GO:0000131) |
| 0.1 | 0.6 | GO:0005771 | multivesicular body(GO:0005771) |
| 0.1 | 0.3 | GO:0000015 | phosphopyruvate hydratase complex(GO:0000015) |
| 0.1 | 1.7 | GO:0005666 | DNA-directed RNA polymerase III complex(GO:0005666) |
| 0.1 | 0.3 | GO:0031415 | NatA complex(GO:0031415) |
| 0.1 | 0.5 | GO:0034044 | exomer complex(GO:0034044) |
| 0.1 | 0.6 | GO:0072686 | mitotic spindle(GO:0072686) |
| 0.1 | 0.5 | GO:0034456 | UTP-C complex(GO:0034456) |
| 0.1 | 0.4 | GO:0042765 | GPI-anchor transamidase complex(GO:0042765) |
| 0.1 | 0.2 | GO:0045298 | polar microtubule(GO:0005827) tubulin complex(GO:0045298) |
| 0.1 | 0.4 | GO:0030689 | Noc complex(GO:0030689) |
| 0.1 | 3.0 | GO:0030686 | 90S preribosome(GO:0030686) |
| 0.1 | 0.1 | GO:0032045 | guanyl-nucleotide exchange factor complex(GO:0032045) |
| 0.1 | 0.8 | GO:0030118 | clathrin coat(GO:0030118) |
| 0.1 | 0.7 | GO:0031231 | integral component of peroxisomal membrane(GO:0005779) intrinsic component of peroxisomal membrane(GO:0031231) |
| 0.1 | 0.8 | GO:0022626 | cytosolic ribosome(GO:0022626) |
| 0.1 | 0.4 | GO:0008250 | oligosaccharyltransferase complex(GO:0008250) |
| 0.1 | 0.4 | GO:0042597 | periplasmic space(GO:0042597) |
| 0.1 | 0.2 | GO:0005852 | eukaryotic translation initiation factor 3 complex(GO:0005852) |
| 0.1 | 0.6 | GO:0000243 | commitment complex(GO:0000243) |
| 0.1 | 0.2 | GO:0070860 | RNA polymerase I core factor complex(GO:0070860) |
| 0.1 | 0.8 | GO:0005940 | septin ring(GO:0005940) |
| 0.1 | 0.2 | GO:0005955 | calcineurin complex(GO:0005955) |
| 0.1 | 0.6 | GO:0005637 | nuclear inner membrane(GO:0005637) |
| 0.1 | 0.5 | GO:0005751 | mitochondrial respiratory chain complex IV(GO:0005751) respiratory chain complex IV(GO:0045277) |
| 0.0 | 0.1 | GO:0070823 | HDA1 complex(GO:0070823) |
| 0.0 | 0.8 | GO:0016586 | RSC complex(GO:0016586) |
| 0.0 | 0.5 | GO:0000782 | telomere cap complex(GO:0000782) nuclear telomere cap complex(GO:0000783) |
| 0.0 | 0.3 | GO:0043527 | tRNA methyltransferase complex(GO:0043527) |
| 0.0 | 1.6 | GO:0030134 | ER to Golgi transport vesicle(GO:0030134) |
| 0.0 | 0.1 | GO:0043541 | UDP-N-acetylglucosamine transferase complex(GO:0043541) |
| 0.0 | 0.2 | GO:0000120 | RNA polymerase I transcription factor complex(GO:0000120) RNA polymerase I upstream activating factor complex(GO:0000500) |
| 0.0 | 0.3 | GO:0005671 | Ada2/Gcn5/Ada3 transcription activator complex(GO:0005671) |
| 0.0 | 0.1 | GO:0000148 | 1,3-beta-D-glucan synthase complex(GO:0000148) |
| 0.0 | 0.2 | GO:0044611 | nuclear pore inner ring(GO:0044611) |
| 0.0 | 0.3 | GO:0030126 | COPI vesicle coat(GO:0030126) |
| 0.0 | 0.5 | GO:0019005 | SCF ubiquitin ligase complex(GO:0019005) |
| 0.0 | 0.2 | GO:0031315 | extrinsic component of mitochondrial outer membrane(GO:0031315) |
| 0.0 | 0.4 | GO:0000788 | nuclear nucleosome(GO:0000788) |
| 0.0 | 0.2 | GO:0030897 | HOPS complex(GO:0030897) |
| 0.0 | 0.8 | GO:0010494 | cytoplasmic stress granule(GO:0010494) |
| 0.0 | 0.1 | GO:0046658 | anchored component of plasma membrane(GO:0046658) |
| 0.0 | 1.2 | GO:0015935 | small ribosomal subunit(GO:0015935) |
| 0.0 | 0.2 | GO:0030478 | actin cap(GO:0030478) |
| 0.0 | 2.5 | GO:0005815 | microtubule organizing center(GO:0005815) spindle pole body(GO:0005816) |
| 0.0 | 0.1 | GO:0009331 | glycerol-3-phosphate dehydrogenase complex(GO:0009331) |
| 0.0 | 0.2 | GO:0005742 | mitochondrial outer membrane translocase complex(GO:0005742) |
| 0.0 | 0.1 | GO:0000417 | HIR complex(GO:0000417) |
| 0.0 | 0.1 | GO:0034099 | luminal surveillance complex(GO:0034099) |
| 0.0 | 0.2 | GO:0005665 | DNA-directed RNA polymerase II, core complex(GO:0005665) |
| 0.0 | 0.1 | GO:0005697 | telomerase holoenzyme complex(GO:0005697) |
| 0.0 | 0.4 | GO:0030014 | CCR4-NOT complex(GO:0030014) |
| 0.0 | 0.2 | GO:0005724 | nuclear heterochromatin(GO:0005720) nuclear telomeric heterochromatin(GO:0005724) telomeric heterochromatin(GO:0031933) |
| 0.0 | 0.2 | GO:0005658 | alpha DNA polymerase:primase complex(GO:0005658) |
| 0.0 | 0.0 | GO:0000145 | exocyst(GO:0000145) |
| 0.0 | 0.4 | GO:0045121 | membrane raft(GO:0045121) membrane microdomain(GO:0098857) |
| 0.0 | 0.2 | GO:0017119 | Golgi transport complex(GO:0017119) |
| 0.0 | 0.1 | GO:0033597 | mitotic checkpoint complex(GO:0033597) |
| 0.0 | 0.1 | GO:0033179 | vacuolar proton-transporting V-type ATPase, V0 domain(GO:0000220) proton-transporting V-type ATPase, V0 domain(GO:0033179) |
| 0.0 | 0.4 | GO:0031314 | extrinsic component of mitochondrial inner membrane(GO:0031314) |
| 0.0 | 0.3 | GO:0034399 | nuclear periphery(GO:0034399) |
| 0.0 | 1.8 | GO:0000139 | Golgi membrane(GO:0000139) |
| 0.0 | 3.5 | GO:0005933 | cellular bud(GO:0005933) |
| 0.0 | 0.1 | GO:0016587 | Isw1 complex(GO:0016587) |
| 0.0 | 0.1 | GO:0097344 | Rix1 complex(GO:0097344) |
| 0.0 | 0.8 | GO:0005811 | lipid particle(GO:0005811) |
| 0.0 | 0.3 | GO:0005847 | mRNA cleavage and polyadenylation specificity factor complex(GO:0005847) |
| 0.0 | 0.2 | GO:0008540 | proteasome regulatory particle, base subcomplex(GO:0008540) |
| 0.0 | 0.1 | GO:0005946 | alpha,alpha-trehalose-phosphate synthase complex (UDP-forming)(GO:0005946) |
| 0.0 | 0.5 | GO:0042645 | nucleoid(GO:0009295) mitochondrial nucleoid(GO:0042645) |
| 0.0 | 0.1 | GO:0005641 | nuclear envelope lumen(GO:0005641) |
| 0.0 | 0.1 | GO:0005834 | heterotrimeric G-protein complex(GO:0005834) |
| 0.0 | 0.1 | GO:0000792 | heterochromatin(GO:0000792) |
| 0.0 | 0.1 | GO:0005952 | cAMP-dependent protein kinase complex(GO:0005952) |
| 0.0 | 2.6 | GO:0005730 | nucleolus(GO:0005730) |
| 0.0 | 0.1 | GO:0070772 | PAS complex(GO:0070772) |
| 0.0 | 4.7 | GO:0005783 | endoplasmic reticulum(GO:0005783) |
| 0.0 | 0.2 | GO:0005682 | U5 snRNP(GO:0005682) |
| 0.0 | 0.1 | GO:0031414 | N-terminal protein acetyltransferase complex(GO:0031414) |
| 0.0 | 0.1 | GO:0001405 | presequence translocase-associated import motor(GO:0001405) |
| 0.0 | 2.0 | GO:0005829 | cytosol(GO:0005829) |
Gene overrepresentation in molecular function category:
| Log-likelihood per target | Total log-likelihood | Term | Description |
|---|---|---|---|
| 1.2 | 7.1 | GO:0016846 | carbon-sulfur lyase activity(GO:0016846) |
| 0.9 | 3.5 | GO:0004523 | RNA-DNA hybrid ribonuclease activity(GO:0004523) |
| 0.7 | 2.6 | GO:0015146 | pentose transmembrane transporter activity(GO:0015146) |
| 0.4 | 1.2 | GO:0016838 | carbon-oxygen lyase activity, acting on phosphates(GO:0016838) |
| 0.4 | 1.6 | GO:0000297 | spermine transmembrane transporter activity(GO:0000297) |
| 0.4 | 1.1 | GO:0003873 | 6-phosphofructo-2-kinase activity(GO:0003873) |
| 0.3 | 1.0 | GO:0016717 | oxidoreductase activity, acting on paired donors, with oxidation of a pair of donors resulting in the reduction of molecular oxygen to two molecules of water(GO:0016717) |
| 0.3 | 0.6 | GO:0008443 | phosphofructokinase activity(GO:0008443) |
| 0.3 | 0.8 | GO:0033592 | RNA strand annealing activity(GO:0033592) annealing activity(GO:0097617) |
| 0.3 | 3.5 | GO:0051537 | 2 iron, 2 sulfur cluster binding(GO:0051537) |
| 0.2 | 1.0 | GO:0019206 | nucleoside kinase activity(GO:0019206) |
| 0.2 | 1.2 | GO:0008536 | Ran GTPase binding(GO:0008536) |
| 0.2 | 1.2 | GO:0032451 | demethylase activity(GO:0032451) |
| 0.2 | 0.9 | GO:0016634 | oxidoreductase activity, acting on the CH-CH group of donors, oxygen as acceptor(GO:0016634) |
| 0.2 | 0.6 | GO:0015166 | polyol transmembrane transporter activity(GO:0015166) |
| 0.2 | 1.1 | GO:0004022 | alcohol dehydrogenase (NAD) activity(GO:0004022) |
| 0.2 | 2.0 | GO:0005199 | structural constituent of cell wall(GO:0005199) |
| 0.2 | 1.3 | GO:0017112 | Rab guanyl-nucleotide exchange factor activity(GO:0017112) |
| 0.2 | 0.5 | GO:0016813 | hydrolase activity, acting on carbon-nitrogen (but not peptide) bonds, in linear amidines(GO:0016813) |
| 0.2 | 0.8 | GO:0000033 | alpha-1,3-mannosyltransferase activity(GO:0000033) |
| 0.2 | 0.5 | GO:0072341 | modified amino acid binding(GO:0072341) |
| 0.2 | 0.2 | GO:0004723 | calcium-dependent protein serine/threonine phosphatase activity(GO:0004723) |
| 0.2 | 0.5 | GO:0015114 | phosphate ion transmembrane transporter activity(GO:0015114) |
| 0.1 | 0.7 | GO:0008525 | phosphatidylcholine transporter activity(GO:0008525) phosphatidylinositol transporter activity(GO:0008526) |
| 0.1 | 1.6 | GO:0030276 | clathrin binding(GO:0030276) |
| 0.1 | 0.9 | GO:0008379 | thioredoxin peroxidase activity(GO:0008379) |
| 0.1 | 1.5 | GO:0005516 | calmodulin binding(GO:0005516) |
| 0.1 | 1.7 | GO:0070566 | adenylyltransferase activity(GO:0070566) |
| 0.1 | 1.1 | GO:0031490 | chromatin DNA binding(GO:0031490) |
| 0.1 | 0.6 | GO:0004707 | MAP kinase activity(GO:0004707) |
| 0.1 | 22.5 | GO:0003735 | structural constituent of ribosome(GO:0003735) |
| 0.1 | 0.4 | GO:0034450 | ubiquitin-ubiquitin ligase activity(GO:0034450) |
| 0.1 | 0.4 | GO:0016639 | oxidoreductase activity, acting on the CH-NH2 group of donors, NAD or NADP as acceptor(GO:0016639) |
| 0.1 | 0.3 | GO:0004634 | phosphopyruvate hydratase activity(GO:0004634) |
| 0.1 | 0.4 | GO:0031683 | G-protein beta/gamma-subunit complex binding(GO:0031683) |
| 0.1 | 0.6 | GO:0003993 | acid phosphatase activity(GO:0003993) |
| 0.1 | 1.7 | GO:0001056 | RNA polymerase III activity(GO:0001056) |
| 0.1 | 0.3 | GO:0008559 | xenobiotic-transporting ATPase activity(GO:0008559) xenobiotic transporter activity(GO:0042910) |
| 0.1 | 0.3 | GO:0004826 | phenylalanine-tRNA ligase activity(GO:0004826) |
| 0.1 | 0.3 | GO:0010521 | telomerase inhibitor activity(GO:0010521) |
| 0.1 | 0.4 | GO:0001163 | RNA polymerase I regulatory region sequence-specific DNA binding(GO:0001163) |
| 0.1 | 0.3 | GO:0051219 | phosphoprotein binding(GO:0051219) |
| 0.1 | 0.7 | GO:0019237 | centromeric DNA binding(GO:0019237) |
| 0.1 | 1.0 | GO:0009982 | pseudouridine synthase activity(GO:0009982) |
| 0.1 | 0.3 | GO:0050291 | sphingosine N-acyltransferase activity(GO:0050291) |
| 0.1 | 0.3 | GO:0004809 | tRNA (guanine-N2-)-methyltransferase activity(GO:0004809) |
| 0.1 | 0.8 | GO:0001133 | RNA polymerase II transcription factor activity, sequence-specific transcription regulatory region DNA binding(GO:0001133) |
| 0.1 | 0.4 | GO:0003923 | GPI-anchor transamidase activity(GO:0003923) |
| 0.1 | 1.1 | GO:0003714 | transcription corepressor activity(GO:0003714) |
| 0.1 | 0.3 | GO:0015193 | L-proline transmembrane transporter activity(GO:0015193) |
| 0.1 | 2.5 | GO:0005085 | guanyl-nucleotide exchange factor activity(GO:0005085) |
| 0.1 | 0.5 | GO:0015081 | sodium ion transmembrane transporter activity(GO:0015081) |
| 0.1 | 0.4 | GO:0015198 | oligopeptide transporter activity(GO:0015198) |
| 0.1 | 0.1 | GO:0016706 | oxidoreductase activity, acting on paired donors, with incorporation or reduction of molecular oxygen, 2-oxoglutarate as one donor, and incorporation of one atom each of oxygen into both donors(GO:0016706) |
| 0.1 | 0.8 | GO:0016866 | intramolecular transferase activity(GO:0016866) |
| 0.1 | 0.7 | GO:0030295 | protein kinase activator activity(GO:0030295) |
| 0.1 | 0.6 | GO:0016628 | oxidoreductase activity, acting on the CH-CH group of donors, NAD or NADP as acceptor(GO:0016628) |
| 0.1 | 0.2 | GO:0004128 | cytochrome-b5 reductase activity, acting on NAD(P)H(GO:0004128) |
| 0.1 | 1.3 | GO:0019901 | protein kinase binding(GO:0019901) |
| 0.1 | 1.1 | GO:0016763 | transferase activity, transferring pentosyl groups(GO:0016763) |
| 0.1 | 0.3 | GO:0004075 | biotin carboxylase activity(GO:0004075) |
| 0.1 | 0.3 | GO:0015248 | sterol transporter activity(GO:0015248) |
| 0.1 | 0.4 | GO:0019201 | nucleotide kinase activity(GO:0019201) |
| 0.1 | 0.2 | GO:0001055 | RNA polymerase II activity(GO:0001055) |
| 0.1 | 0.6 | GO:0016884 | carbon-nitrogen ligase activity, with glutamine as amido-N-donor(GO:0016884) |
| 0.1 | 0.4 | GO:0004579 | oligosaccharyl transferase activity(GO:0004576) dolichyl-diphosphooligosaccharide-protein glycotransferase activity(GO:0004579) |
| 0.1 | 0.7 | GO:0003746 | translation elongation factor activity(GO:0003746) |
| 0.1 | 0.8 | GO:0015616 | DNA translocase activity(GO:0015616) |
| 0.1 | 0.2 | GO:0047066 | phospholipid-hydroperoxide glutathione peroxidase activity(GO:0047066) |
| 0.1 | 0.1 | GO:0031370 | eukaryotic initiation factor 4G binding(GO:0031370) |
| 0.1 | 0.7 | GO:0001671 | ATPase activator activity(GO:0001671) |
| 0.0 | 0.4 | GO:0000009 | alpha-1,6-mannosyltransferase activity(GO:0000009) |
| 0.0 | 0.2 | GO:0004551 | nucleotide diphosphatase activity(GO:0004551) |
| 0.0 | 0.5 | GO:0003727 | single-stranded RNA binding(GO:0003727) |
| 0.0 | 1.2 | GO:0004722 | protein serine/threonine phosphatase activity(GO:0004722) |
| 0.0 | 0.1 | GO:0031957 | very long-chain fatty acid-CoA ligase activity(GO:0031957) |
| 0.0 | 0.2 | GO:0004622 | lysophospholipase activity(GO:0004622) |
| 0.0 | 1.3 | GO:0004004 | ATP-dependent RNA helicase activity(GO:0004004) |
| 0.0 | 0.4 | GO:0005216 | ion channel activity(GO:0005216) |
| 0.0 | 0.5 | GO:0004129 | cytochrome-c oxidase activity(GO:0004129) heme-copper terminal oxidase activity(GO:0015002) oxidoreductase activity, acting on a heme group of donors(GO:0016675) oxidoreductase activity, acting on a heme group of donors, oxygen as acceptor(GO:0016676) |
| 0.0 | 0.2 | GO:0000774 | adenyl-nucleotide exchange factor activity(GO:0000774) |
| 0.0 | 0.1 | GO:0004000 | adenosine deaminase activity(GO:0004000) tRNA-specific adenosine deaminase activity(GO:0008251) |
| 0.0 | 1.0 | GO:0008170 | N-methyltransferase activity(GO:0008170) |
| 0.0 | 0.1 | GO:0009922 | fatty acid elongase activity(GO:0009922) |
| 0.0 | 0.2 | GO:0003705 | transcription factor activity, RNA polymerase II distal enhancer sequence-specific binding(GO:0003705) |
| 0.0 | 0.8 | GO:0050661 | NADP binding(GO:0050661) |
| 0.0 | 0.4 | GO:0004596 | peptide alpha-N-acetyltransferase activity(GO:0004596) |
| 0.0 | 0.2 | GO:0070546 | L-phenylalanine aminotransferase activity(GO:0070546) L-phenylalanine:2-oxoglutarate aminotransferase activity(GO:0080130) |
| 0.0 | 0.1 | GO:0005519 | cytoskeletal regulatory protein binding(GO:0005519) |
| 0.0 | 0.2 | GO:0008157 | protein phosphatase 1 binding(GO:0008157) |
| 0.0 | 0.3 | GO:0019842 | vitamin binding(GO:0019842) |
| 0.0 | 2.4 | GO:0003924 | GTPase activity(GO:0003924) |
| 0.0 | 0.5 | GO:0042803 | protein homodimerization activity(GO:0042803) |
| 0.0 | 0.2 | GO:0004033 | aldo-keto reductase (NADP) activity(GO:0004033) alcohol dehydrogenase (NADP+) activity(GO:0008106) |
| 0.0 | 1.9 | GO:0008565 | protein transporter activity(GO:0008565) |
| 0.0 | 0.1 | GO:0097027 | ubiquitin-protein transferase activator activity(GO:0097027) |
| 0.0 | 0.1 | GO:0000339 | RNA cap binding(GO:0000339) |
| 0.0 | 0.5 | GO:0051087 | chaperone binding(GO:0051087) |
| 0.0 | 0.6 | GO:0030515 | snoRNA binding(GO:0030515) |
| 0.0 | 0.4 | GO:0000386 | second spliceosomal transesterification activity(GO:0000386) |
| 0.0 | 0.1 | GO:0015230 | FAD transmembrane transporter activity(GO:0015230) |
| 0.0 | 1.0 | GO:0030674 | protein binding, bridging(GO:0030674) |
| 0.0 | 0.4 | GO:0042162 | telomeric DNA binding(GO:0042162) |
| 0.0 | 0.1 | GO:0003747 | translation release factor activity(GO:0003747) translation termination factor activity(GO:0008079) |
| 0.0 | 0.6 | GO:0008017 | microtubule binding(GO:0008017) |
| 0.0 | 0.2 | GO:0019239 | deaminase activity(GO:0019239) |
| 0.0 | 0.6 | GO:0051540 | iron-sulfur cluster binding(GO:0051536) metal cluster binding(GO:0051540) |
| 0.0 | 0.1 | GO:0004805 | alpha,alpha-trehalose-phosphate synthase (UDP-forming) activity(GO:0003825) trehalose-phosphatase activity(GO:0004805) |
| 0.0 | 0.1 | GO:0004100 | chitin synthase activity(GO:0004100) |
| 0.0 | 0.1 | GO:0019203 | carbohydrate phosphatase activity(GO:0019203) sugar-phosphatase activity(GO:0050308) |
| 0.0 | 0.1 | GO:0034318 | alcohol O-acetyltransferase activity(GO:0004026) alcohol O-acyltransferase activity(GO:0034318) |
| 0.0 | 1.1 | GO:0016853 | isomerase activity(GO:0016853) |
| 0.0 | 1.0 | GO:0016810 | hydrolase activity, acting on carbon-nitrogen (but not peptide) bonds(GO:0016810) |
| 0.0 | 0.1 | GO:0016504 | peptidase activator activity(GO:0016504) |
| 0.0 | 0.1 | GO:0016886 | ligase activity, forming phosphoric ester bonds(GO:0016886) |
| 0.0 | 0.1 | GO:0004690 | cyclic nucleotide-dependent protein kinase activity(GO:0004690) cAMP-dependent protein kinase activity(GO:0004691) |
| 0.0 | 0.1 | GO:0004771 | sterol esterase activity(GO:0004771) |
| 0.0 | 0.2 | GO:0004713 | protein tyrosine kinase activity(GO:0004713) |
| 0.0 | 0.4 | GO:0004721 | phosphoprotein phosphatase activity(GO:0004721) |
| 0.0 | 0.1 | GO:0005338 | nucleotide-sugar transmembrane transporter activity(GO:0005338) |
| 0.0 | 0.1 | GO:0016538 | cyclin-dependent protein serine/threonine kinase regulator activity(GO:0016538) |
| 0.0 | 0.2 | GO:0043495 | protein anchor(GO:0043495) |
| 0.0 | 0.1 | GO:0042134 | rRNA primary transcript binding(GO:0042134) |
| 0.0 | 0.0 | GO:0008601 | protein phosphatase type 2A regulator activity(GO:0008601) |
| 0.0 | 0.1 | GO:0005092 | GDP-dissociation inhibitor activity(GO:0005092) |
| 0.0 | 0.5 | GO:0016875 | aminoacyl-tRNA ligase activity(GO:0004812) ligase activity, forming carbon-oxygen bonds(GO:0016875) ligase activity, forming aminoacyl-tRNA and related compounds(GO:0016876) |
| 0.0 | 0.0 | GO:0008142 | oxysterol binding(GO:0008142) |
| 0.0 | 0.1 | GO:0080025 | phosphatidylinositol-3,5-bisphosphate binding(GO:0080025) |
| 0.0 | 0.1 | GO:0000026 | alpha-1,2-mannosyltransferase activity(GO:0000026) |
| 0.0 | 0.1 | GO:0031386 | protein tag(GO:0031386) |
| 0.0 | 0.2 | GO:0004003 | ATP-dependent DNA helicase activity(GO:0004003) |
| 0.0 | 0.0 | GO:0000403 | Y-form DNA binding(GO:0000403) |
| 0.0 | 0.1 | GO:0051213 | dioxygenase activity(GO:0051213) |
| 0.0 | 0.1 | GO:0008762 | UDP-N-acetylmuramate dehydrogenase activity(GO:0008762) |
| 0.0 | 0.4 | GO:0008237 | metallopeptidase activity(GO:0008237) |
| 0.0 | 0.1 | GO:0017048 | Rho GTPase binding(GO:0017048) |
| 0.0 | 0.1 | GO:0019211 | phosphatase activator activity(GO:0019211) |
| 0.0 | 0.6 | GO:0016757 | transferase activity, transferring glycosyl groups(GO:0016757) |
| 0.0 | 0.0 | GO:0001046 | core promoter sequence-specific DNA binding(GO:0001046) |
| 0.0 | 0.3 | GO:0046982 | protein heterodimerization activity(GO:0046982) |
| 0.0 | 0.1 | GO:0043142 | single-stranded DNA-dependent ATPase activity(GO:0043142) |
| 0.0 | 0.0 | GO:0008309 | double-stranded DNA exodeoxyribonuclease activity(GO:0008309) |
| 0.0 | 0.1 | GO:0016831 | carboxy-lyase activity(GO:0016831) |
Gene overrepresentation in curated gene sets: canonical pathways category:
| Log-likelihood per target | Total log-likelihood | Term | Description |
|---|---|---|---|
| 0.3 | 0.9 | SA G1 AND S PHASES | Cdk2, 4, and 6 bind cyclin D in G1, while cdk2/cyclin E promotes the G1/S transition. |
| 0.1 | 0.3 | PID HIF1 TFPATHWAY | HIF-1-alpha transcription factor network |
| 0.1 | 0.3 | PID SHP2 PATHWAY | SHP2 signaling |
| 0.1 | 0.2 | PID INTEGRIN A4B1 PATHWAY | Alpha4 beta1 integrin signaling events |
| 0.1 | 0.2 | PID DELTA NP63 PATHWAY | Validated transcriptional targets of deltaNp63 isoforms |
| 0.0 | 0.1 | PID TRKR PATHWAY | Neurotrophic factor-mediated Trk receptor signaling |
| 0.0 | 0.1 | PID UPA UPAR PATHWAY | Urokinase-type plasminogen activator (uPA) and uPAR-mediated signaling |
| 0.0 | 0.1 | PID PLK1 PATHWAY | PLK1 signaling events |
Gene overrepresentation in curated gene sets: REACTOME pathways category:
| Log-likelihood per target | Total log-likelihood | Term | Description |
|---|---|---|---|
| 0.3 | 0.9 | REACTOME MHC CLASS II ANTIGEN PRESENTATION | Genes involved in MHC class II antigen presentation |
| 0.2 | 0.5 | REACTOME TCA CYCLE AND RESPIRATORY ELECTRON TRANSPORT | Genes involved in The citric acid (TCA) cycle and respiratory electron transport |
| 0.2 | 0.5 | REACTOME CITRIC ACID CYCLE TCA CYCLE | Genes involved in Citric acid cycle (TCA cycle) |
| 0.1 | 3.2 | REACTOME PEPTIDE CHAIN ELONGATION | Genes involved in Peptide chain elongation |
| 0.1 | 0.4 | REACTOME SIGNALLING TO ERKS | Genes involved in Signalling to ERKs |
| 0.1 | 0.3 | REACTOME ETHANOL OXIDATION | Genes involved in Ethanol oxidation |
| 0.1 | 0.3 | REACTOME GLYCOLYSIS | Genes involved in Glycolysis |
| 0.1 | 0.1 | REACTOME SCF BETA TRCP MEDIATED DEGRADATION OF EMI1 | Genes involved in SCF-beta-TrCP mediated degradation of Emi1 |
| 0.0 | 0.2 | REACTOME GLUCOSE METABOLISM | Genes involved in Glucose metabolism |
| 0.0 | 0.5 | REACTOME BIOSYNTHESIS OF THE N GLYCAN PRECURSOR DOLICHOL LIPID LINKED OLIGOSACCHARIDE LLO AND TRANSFER TO A NASCENT PROTEIN | Genes involved in Biosynthesis of the N-glycan precursor (dolichol lipid-linked oligosaccharide, LLO) and transfer to a nascent protein |
| 0.0 | 0.1 | REACTOME MRNA 3 END PROCESSING | Genes involved in mRNA 3'-end processing |
| 0.0 | 0.1 | REACTOME CLASS A1 RHODOPSIN LIKE RECEPTORS | Genes involved in Class A/1 (Rhodopsin-like receptors) |
| 0.0 | 0.1 | REACTOME PLATELET ACTIVATION SIGNALING AND AGGREGATION | Genes involved in Platelet activation, signaling and aggregation |
| 0.0 | 0.0 | REACTOME POST TRANSLATIONAL PROTEIN MODIFICATION | Genes involved in Post-translational protein modification |
| 0.0 | 0.0 | REACTOME BMAL1 CLOCK NPAS2 ACTIVATES CIRCADIAN EXPRESSION | Genes involved in BMAL1:CLOCK/NPAS2 Activates Circadian Expression |