Project
GSE53960: rat RNA-Seq transcriptomic Bodymap
Navigation
Downloads
Results for Vsx2_Dlx3
Z-value: 0.98
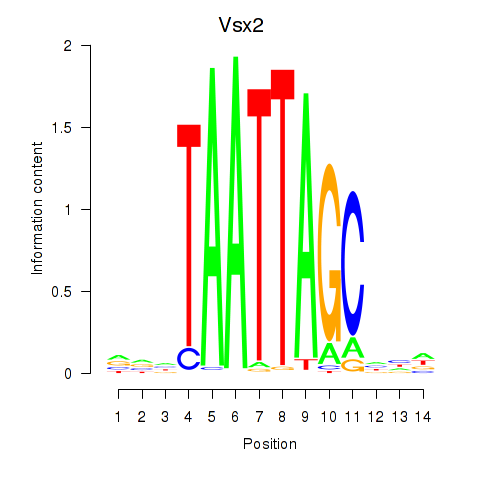
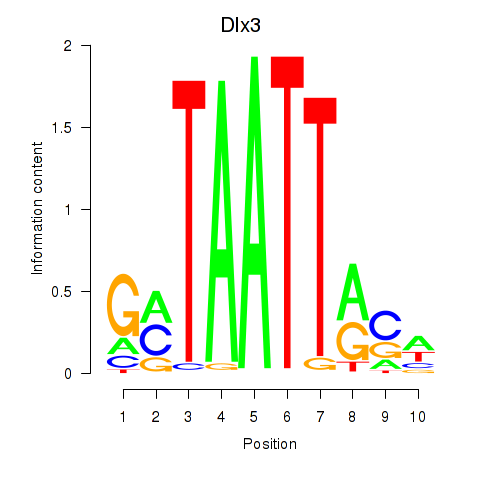
Motif logo
Transcription factors associated with Vsx2_Dlx3
| Gene Symbol | Gene ID | Gene Info |
|---|---|---|
|
Vsx2
|
ENSRNOG00000011918 | visual system homeobox 2 |
|
Dlx3
|
ENSRNOG00000004278 | distal-less homeobox 3 |
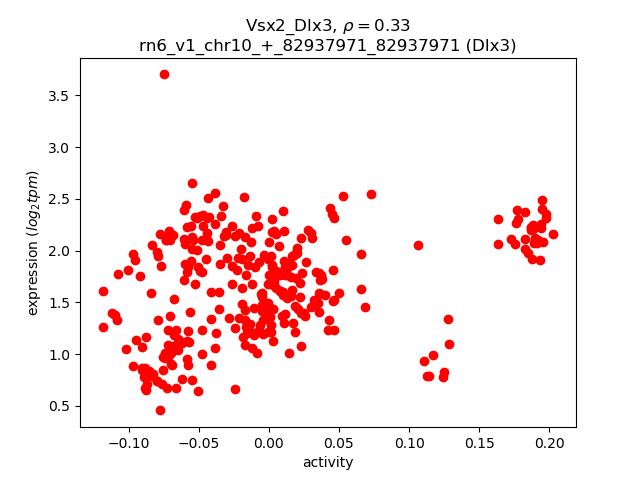
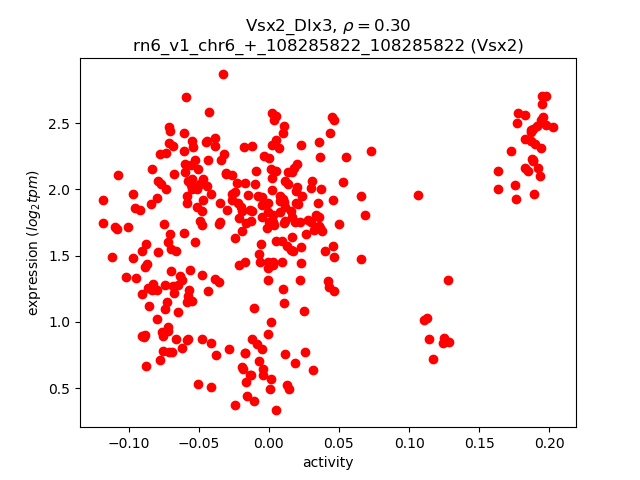
Activity-expression correlation:
| Gene | Promoter | Pearson corr. coef. | P-value | Plot |
|---|---|---|---|---|
| Dlx3 | rn6_v1_chr10_+_82937971_82937971 | 0.33 | 1.1e-09 | Click! |
| Vsx2 | rn6_v1_chr6_+_108285822_108285822 | 0.30 | 4.2e-08 | Click! |
Activity profile of Vsx2_Dlx3 motif
Sorted Z-values of Vsx2_Dlx3 motif
| Promoter | Log-likelihood | Transcript | Gene | Gene Info |
|---|---|---|---|---|
| chr1_-_43638161 | 58.76 |
ENSRNOT00000024460
|
Ipcef1
|
interaction protein for cytohesin exchange factors 1 |
| chr1_+_59156251 | 56.59 |
ENSRNOT00000017442
|
Lix1
|
limb and CNS expressed 1 |
| chr13_-_76049363 | 46.96 |
ENSRNOT00000075865
ENSRNOT00000007455 |
Brinp2
|
BMP/retinoic acid inducible neural specific 2 |
| chr2_-_219262901 | 44.17 |
ENSRNOT00000037068
|
Gpr88
|
G-protein coupled receptor 88 |
| chr14_+_39964588 | 36.97 |
ENSRNOT00000003240
|
Gabrg1
|
gamma-aminobutyric acid type A receptor gamma 1 subunit |
| chr10_-_87248572 | 35.18 |
ENSRNOT00000066637
ENSRNOT00000085677 |
Krt26
|
keratin 26 |
| chr6_+_48452369 | 33.16 |
ENSRNOT00000044310
|
Myt1l
|
myelin transcription factor 1-like |
| chr4_-_55011415 | 32.08 |
ENSRNOT00000056996
|
Grm8
|
glutamate metabotropic receptor 8 |
| chr9_-_85243001 | 30.82 |
ENSRNOT00000020219
|
Scg2
|
secretogranin II |
| chr4_-_4473307 | 30.45 |
ENSRNOT00000045773
|
Dpp6
|
dipeptidyl peptidase like 6 |
| chr4_+_108301129 | 29.65 |
ENSRNOT00000007993
|
LRRTM1
|
leucine rich repeat transmembrane neuronal 1 |
| chr12_-_2174131 | 28.84 |
ENSRNOT00000001313
|
Pcp2
|
Purkinje cell protein 2 |
| chr13_+_31081804 | 27.38 |
ENSRNOT00000041413
|
Cdh7
|
cadherin 7 |
| chr1_+_198383201 | 25.26 |
ENSRNOT00000037405
|
Sez6l2
|
seizure related 6 homolog like 2 |
| chr5_-_17061837 | 24.89 |
ENSRNOT00000011892
|
Penk
|
proenkephalin |
| chr3_-_66417741 | 24.87 |
ENSRNOT00000007662
|
Neurod1
|
neuronal differentiation 1 |
| chr12_-_35979193 | 24.05 |
ENSRNOT00000071104
|
Tmem132b
|
transmembrane protein 132B |
| chr4_+_94696965 | 23.73 |
ENSRNOT00000064696
|
Grid2
|
glutamate ionotropic receptor delta type subunit 2 |
| chr12_-_10335499 | 23.43 |
ENSRNOT00000071567
|
Wasf3
|
WAS protein family, member 3 |
| chr5_-_17061361 | 22.48 |
ENSRNOT00000089318
|
Penk
|
proenkephalin |
| chr18_+_81821127 | 22.42 |
ENSRNOT00000058199
|
Fbxo15
|
F-box protein 15 |
| chr16_-_73152921 | 22.13 |
ENSRNOT00000048602
|
Zmat4
|
zinc finger, matrin type 4 |
| chr2_-_139528162 | 21.44 |
ENSRNOT00000014317
|
Slc7a11
|
solute carrier family 7 member 11 |
| chr3_+_48106099 | 21.12 |
ENSRNOT00000007218
|
Slc4a10
|
solute carrier family 4 member 10 |
| chr11_+_58624198 | 20.44 |
ENSRNOT00000002091
|
Gap43
|
growth associated protein 43 |
| chr11_+_69739384 | 20.34 |
ENSRNOT00000016340
|
Kalrn
|
kalirin, RhoGEF kinase |
| chr7_-_52404774 | 19.69 |
ENSRNOT00000082100
|
Nav3
|
neuron navigator 3 |
| chr18_-_26211445 | 19.03 |
ENSRNOT00000027739
|
Nrep
|
neuronal regeneration related protein |
| chr2_-_173087648 | 18.93 |
ENSRNOT00000091079
|
Iqcj
|
IQ motif containing J |
| chr5_-_130085838 | 18.90 |
ENSRNOT00000035252
|
Elavl4
|
ELAV like RNA binding protein 4 |
| chr12_-_19167015 | 18.83 |
ENSRNOT00000001797
|
Gjc3
|
gap junction protein, gamma 3 |
| chr7_-_76488216 | 18.82 |
ENSRNOT00000080024
|
Ncald
|
neurocalcin delta |
| chr12_-_17186679 | 18.80 |
ENSRNOT00000001730
|
Uncx
|
UNC homeobox |
| chr2_-_179704629 | 17.51 |
ENSRNOT00000083361
ENSRNOT00000077941 |
Gria2
|
glutamate ionotropic receptor AMPA type subunit 2 |
| chr15_+_1054937 | 16.29 |
ENSRNOT00000008154
|
AABR07016841.1
|
|
| chr4_-_17594598 | 15.59 |
ENSRNOT00000008936
|
Sema3e
|
semaphorin 3E |
| chr4_-_135069970 | 15.23 |
ENSRNOT00000008221
|
Cntn3
|
contactin 3 |
| chr13_+_71107465 | 15.02 |
ENSRNOT00000003239
|
Rgs8
|
regulator of G-protein signaling 8 |
| chr7_+_78558701 | 14.71 |
ENSRNOT00000006393
|
Rims2
|
regulating synaptic membrane exocytosis 2 |
| chr1_-_215033460 | 14.26 |
ENSRNOT00000044565
|
Dusp8
|
dual specificity phosphatase 8 |
| chr10_-_66848388 | 13.98 |
ENSRNOT00000018891
|
Omg
|
oligodendrocyte-myelin glycoprotein |
| chr14_-_21128505 | 13.87 |
ENSRNOT00000004776
|
Rufy3
|
RUN and FYVE domain containing 3 |
| chr18_-_12640716 | 13.78 |
ENSRNOT00000020697
|
Klhl14
|
kelch-like family member 14 |
| chr3_+_95715193 | 13.31 |
ENSRNOT00000089525
|
Pax6
|
paired box 6 |
| chr6_-_108660063 | 12.69 |
ENSRNOT00000006240
|
Arel1
|
apoptosis resistant E3 ubiquitin protein ligase 1 |
| chr3_+_54253949 | 12.04 |
ENSRNOT00000010018
|
B3galt1
|
Beta-1,3-galactosyltransferase 1 |
| chr20_+_29655226 | 11.95 |
ENSRNOT00000089059
|
Spock2
|
SPARC/osteonectin, cwcv and kazal like domains proteoglycan 2 |
| chr8_+_33239139 | 10.50 |
ENSRNOT00000011589
|
Arhgap32
|
Rho GTPase activating protein 32 |
| chr6_+_58468155 | 10.38 |
ENSRNOT00000091263
|
Etv1
|
ets variant 1 |
| chr15_+_12827707 | 10.17 |
ENSRNOT00000012452
|
Fezf2
|
Fez family zinc finger 2 |
| chr19_+_25043680 | 9.95 |
ENSRNOT00000043971
|
Adgrl1
|
adhesion G protein-coupled receptor L1 |
| chr8_-_128754514 | 9.76 |
ENSRNOT00000025019
|
Cx3cr1
|
C-X3-C motif chemokine receptor 1 |
| chr7_-_143353925 | 9.29 |
ENSRNOT00000068533
|
Krt71
|
keratin 71 |
| chr7_-_142348232 | 8.82 |
ENSRNOT00000078848
|
Galnt6
|
polypeptide N-acetylgalactosaminyltransferase 6 |
| chr4_-_117575154 | 8.71 |
ENSRNOT00000075813
|
LOC102556148
|
probable N-acetyltransferase CML2-like |
| chr13_-_95250235 | 8.55 |
ENSRNOT00000085648
|
Akt3
|
AKT serine/threonine kinase 3 |
| chr5_+_61474000 | 8.47 |
ENSRNOT00000013930
|
Ccdc180
|
coiled-coil domain containing 180 |
| chr12_+_18679789 | 7.84 |
ENSRNOT00000001863
|
Cyp3a9
|
cytochrome P450, family 3, subfamily a, polypeptide 9 |
| chr20_-_27578244 | 6.97 |
ENSRNOT00000000708
|
Fam26d
|
family with sequence similarity 26, member D |
| chr7_-_145062956 | 6.60 |
ENSRNOT00000055274
|
RGD1563200
|
similar to CDNA sequence BC048502 |
| chr4_-_150485781 | 6.40 |
ENSRNOT00000008763
|
Zfp248
|
zinc finger protein 248 |
| chr1_+_217345545 | 6.38 |
ENSRNOT00000071741
|
Shank2
|
SH3 and multiple ankyrin repeat domains 2 |
| chr5_-_32956159 | 6.33 |
ENSRNOT00000078264
|
Cnbd1
|
cyclic nucleotide binding domain containing 1 |
| chr9_+_66058047 | 6.25 |
ENSRNOT00000071819
|
Cdk15
|
cyclin-dependent kinase 15 |
| chr6_+_132510757 | 5.97 |
ENSRNOT00000080230
|
Evl
|
Enah/Vasp-like |
| chr10_+_90230711 | 5.61 |
ENSRNOT00000055185
|
Tmub2
|
transmembrane and ubiquitin-like domain containing 2 |
| chr5_-_28131133 | 5.50 |
ENSRNOT00000067331
|
Slc26a7
|
solute carrier family 26 member 7 |
| chr13_+_70157522 | 5.23 |
ENSRNOT00000036906
|
Apobec4
|
apolipoprotein B mRNA editing enzyme catalytic polypeptide like 4 |
| chrX_+_131381134 | 5.18 |
ENSRNOT00000007474
|
AABR07041481.1
|
|
| chr5_-_28130803 | 4.88 |
ENSRNOT00000093186
|
Slc26a7
|
solute carrier family 26 member 7 |
| chr7_+_83348694 | 4.30 |
ENSRNOT00000006402
|
Eny2
|
ENY2, transcription and export complex 2 subunit |
| chr7_-_83348487 | 4.02 |
ENSRNOT00000006685
|
Nudcd1
|
NudC domain containing 1 |
| chr9_-_81566096 | 3.93 |
ENSRNOT00000019497
|
Aamp
|
angio-associated, migratory cell protein |
| chr14_-_6793558 | 3.82 |
ENSRNOT00000002927
|
Mepe
|
matrix extracellular phosphoglycoprotein |
| chr4_-_50312608 | 3.76 |
ENSRNOT00000010019
|
Fezf1
|
Fez family zinc finger 1 |
| chr2_-_113616766 | 3.68 |
ENSRNOT00000016858
ENSRNOT00000074723 |
Tmem212
|
transmembrane protein 212 |
| chr18_+_51523758 | 3.61 |
ENSRNOT00000078518
|
Gramd3
|
GRAM domain containing 3 |
| chr9_+_71915421 | 3.58 |
ENSRNOT00000020447
|
Pikfyve
|
phosphoinositide kinase, FYVE-type zinc finger containing |
| chr17_-_45746753 | 3.45 |
ENSRNOT00000077475
|
RGD1564243
|
similar to brain Zn-finger protein |
| chr3_+_47578384 | 3.36 |
ENSRNOT00000082769
|
Psmd14
|
proteasome 26S subunit, non-ATPase 14 |
| chr2_+_145174876 | 3.28 |
ENSRNOT00000040631
|
Mab21l1
|
mab-21 like 1 |
| chr11_-_46693565 | 3.24 |
ENSRNOT00000044900
|
Impg2
|
interphotoreceptor matrix proteoglycan 2 |
| chr13_+_98311827 | 3.10 |
ENSRNOT00000082844
|
Cdc42bpa
|
CDC42 binding protein kinase alpha |
| chr18_-_69780922 | 3.07 |
ENSRNOT00000079093
|
Me2
|
malic enzyme 2 |
| chr13_-_100672731 | 2.92 |
ENSRNOT00000004319
|
Degs1
|
delta(4)-desaturase, sphingolipid 1 |
| chr18_+_66741144 | 2.92 |
ENSRNOT00000021161
|
AABR07032457.1
|
|
| chr19_-_17399548 | 2.86 |
ENSRNOT00000075991
|
Chd9
|
chromodomain helicase DNA binding protein 9 |
| chr9_-_81566642 | 2.85 |
ENSRNOT00000080345
|
Aamp
|
angio-associated, migratory cell protein |
| chr1_-_279277339 | 2.82 |
ENSRNOT00000023667
|
Gfra1
|
GDNF family receptor alpha 1 |
| chr1_+_279633671 | 2.76 |
ENSRNOT00000036012
ENSRNOT00000091669 |
Ccdc172
|
coiled-coil domain containing 172 |
| chr10_+_82032656 | 2.56 |
ENSRNOT00000067751
|
Ankrd40
|
ankyrin repeat domain 40 |
| chr4_+_31333970 | 2.50 |
ENSRNOT00000064866
|
LOC100911994
|
coiled-coil domain-containing protein 132-like |
| chr9_-_65736852 | 2.43 |
ENSRNOT00000087458
|
Trak2
|
trafficking kinesin protein 2 |
| chr7_-_122581777 | 2.40 |
ENSRNOT00000025758
|
Slc25a17
|
solute carrier family 25 member 17 |
| chr1_-_124803363 | 2.29 |
ENSRNOT00000066380
|
Klf13
|
Kruppel-like factor 13 |
| chr5_-_66322567 | 2.25 |
ENSRNOT00000032726
|
Cylc2
|
cylicin 2 |
| chr16_-_6404578 | 2.24 |
ENSRNOT00000051371
|
Cacna1d
|
calcium voltage-gated channel subunit alpha1 D |
| chr2_+_226563050 | 2.12 |
ENSRNOT00000065111
|
Bcar3
|
breast cancer anti-estrogen resistance 3 |
| chr10_+_91217079 | 2.05 |
ENSRNOT00000004218
|
Hexim2
|
hexamethylene bis-acetamide inducible 2 |
| chr3_+_18787606 | 1.94 |
ENSRNOT00000090508
|
AABR07051658.1
|
|
| chr16_-_6404957 | 1.91 |
ENSRNOT00000048459
|
Cacna1d
|
calcium voltage-gated channel subunit alpha1 D |
| chr8_+_107229832 | 1.90 |
ENSRNOT00000045821
|
Faim
|
Fas apoptotic inhibitory molecule |
| chr18_-_61672663 | 1.82 |
ENSRNOT00000022718
|
Cplx4
|
complexin 4 |
| chrX_+_136466779 | 1.66 |
ENSRNOT00000093268
ENSRNOT00000068717 |
Arhgap36
|
Rho GTPase activating protein 36 |
| chr9_-_38495126 | 1.65 |
ENSRNOT00000016933
ENSRNOT00000090385 |
Rab23
|
RAB23, member RAS oncogene family |
| chr4_+_88119838 | 1.60 |
ENSRNOT00000073173
|
Vom1r82
|
vomeronasal 1 receptor 82 |
| chr6_+_73358112 | 1.50 |
ENSRNOT00000041373
|
Arhgap5
|
Rho GTPase activating protein 5 |
| chr9_-_65737538 | 1.38 |
ENSRNOT00000014939
|
Trak2
|
trafficking kinesin protein 2 |
| chr10_+_29606748 | 1.37 |
ENSRNOT00000080720
|
AABR07029467.2
|
|
| chr4_+_61924013 | 1.34 |
ENSRNOT00000090717
|
Bpgm
|
bisphosphoglycerate mutase |
| chr4_+_2053712 | 1.33 |
ENSRNOT00000045086
|
Rnf32
|
ring finger protein 32 |
| chr20_-_11626876 | 1.32 |
ENSRNOT00000001635
|
LOC100361664
|
keratin associated protein 12-1-like |
| chr4_+_6827429 | 1.29 |
ENSRNOT00000071737
|
Rheb
|
Ras homolog enriched in brain |
| chr12_+_46042413 | 1.27 |
ENSRNOT00000046882
|
Ccdc60
|
coiled-coil domain containing 60 |
| chr7_+_71157664 | 1.12 |
ENSRNOT00000005919
|
Sdr9c7
|
short chain dehydrogenase/reductase family 9C, member 7 |
| chr6_+_64252020 | 1.04 |
ENSRNOT00000047296
ENSRNOT00000082105 |
Pnpla8
|
patatin-like phospholipase domain containing 8 |
| chr3_+_19045214 | 0.99 |
ENSRNOT00000070878
|
AABR07051670.1
|
|
| chr1_+_98414226 | 0.93 |
ENSRNOT00000090785
|
Siglecl1
|
SIGLEC family like 1 |
| chr7_-_143967484 | 0.89 |
ENSRNOT00000081758
|
Sp7
|
Sp7 transcription factor |
| chr2_-_33025271 | 0.82 |
ENSRNOT00000074941
|
NEWGENE_1310139
|
microtubule associated serine/threonine kinase family member 4 |
| chr7_+_3173287 | 0.82 |
ENSRNOT00000092037
|
Pym1
|
PYM homolog 1, exon junction complex associated factor |
| chrX_+_78769419 | 0.72 |
ENSRNOT00000003190
|
Tbx22
|
T-box 22 |
| chr17_-_78812111 | 0.67 |
ENSRNOT00000021506
|
Dclre1c
|
DNA cross-link repair 1C |
| chr3_-_57646572 | 0.66 |
ENSRNOT00000076202
|
Mettl8
|
methyltransferase like 8 |
| chr8_-_39551700 | 0.63 |
ENSRNOT00000091894
ENSRNOT00000076025 |
Pknox2
|
PBX/knotted 1 homeobox 2 |
| chr8_+_57983556 | 0.44 |
ENSRNOT00000009562
|
RGD1311251
|
similar to RIKEN cDNA 4930550C14 |
| chr10_-_18131562 | 0.44 |
ENSRNOT00000006676
|
Tlx3
|
T-cell leukemia, homeobox 3 |
| chr3_+_72134731 | 0.43 |
ENSRNOT00000083592
|
Ypel4
|
yippee-like 4 |
| chr16_+_35934970 | 0.35 |
ENSRNOT00000084707
ENSRNOT00000016474 |
Galnt7
|
polypeptide N-acetylgalactosaminyltransferase 7 |
| chr7_-_14364178 | 0.34 |
ENSRNOT00000090673
|
Akap8l
|
A-kinase anchoring protein 8 like |
| chr2_-_98610368 | 0.29 |
ENSRNOT00000011641
|
Zfhx4
|
zinc finger homeobox 4 |
| chr8_+_81863619 | 0.20 |
ENSRNOT00000080608
|
Fam214a
|
family with sequence similarity 214, member A |
Network of associatons between targets according to the STRING database.

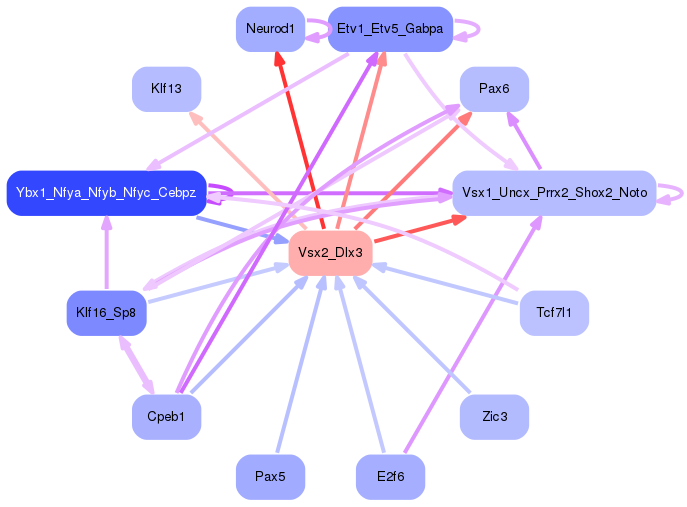
First level regulatory network of Vsx2_Dlx3
Gene Ontology Analysis
Gene overrepresentation in biological process category:
| Log-likelihood per target | Total log-likelihood | Term | Description |
|---|---|---|---|
| 15.8 | 47.4 | GO:0051867 | general adaptation syndrome, behavioral process(GO:0051867) |
| 8.8 | 44.2 | GO:0061743 | motor learning(GO:0061743) |
| 5.0 | 24.9 | GO:0060729 | intestinal epithelial structure maintenance(GO:0060729) |
| 4.4 | 13.3 | GO:0021918 | pancreatic A cell development(GO:0003322) forebrain-midbrain boundary formation(GO:0021905) somatic motor neuron fate commitment(GO:0021917) regulation of transcription from RNA polymerase II promoter involved in somatic motor neuron fate commitment(GO:0021918) sensory neuron migration(GO:1904937) |
| 4.1 | 20.3 | GO:0098989 | NMDA selective glutamate receptor signaling pathway(GO:0098989) |
| 3.7 | 29.7 | GO:0002091 | negative regulation of receptor internalization(GO:0002091) |
| 3.6 | 28.8 | GO:0016056 | rhodopsin mediated signaling pathway(GO:0016056) |
| 3.5 | 13.9 | GO:0021797 | forebrain anterior/posterior pattern specification(GO:0021797) |
| 2.9 | 32.1 | GO:0007196 | adenylate cyclase-inhibiting G-protein coupled glutamate receptor signaling pathway(GO:0007196) |
| 2.4 | 9.8 | GO:0002282 | microglial cell activation involved in immune response(GO:0002282) |
| 2.3 | 18.8 | GO:0035726 | common myeloid progenitor cell proliferation(GO:0035726) |
| 2.1 | 30.8 | GO:0048245 | eosinophil chemotaxis(GO:0048245) |
| 2.0 | 20.4 | GO:0016198 | axon choice point recognition(GO:0016198) |
| 2.0 | 7.8 | GO:0009822 | lipid hydroxylation(GO:0002933) alkaloid catabolic process(GO:0009822) |
| 1.7 | 23.7 | GO:0021684 | cerebellar granular layer formation(GO:0021684) cerebellar granule cell differentiation(GO:0021707) |
| 1.5 | 11.9 | GO:0019800 | peptide cross-linking via chondroitin 4-sulfate glycosaminoglycan(GO:0019800) |
| 1.4 | 46.8 | GO:0097352 | autophagosome maturation(GO:0097352) |
| 1.3 | 25.3 | GO:0090036 | regulation of protein kinase C signaling(GO:0090036) |
| 1.3 | 3.8 | GO:0098939 | dendritic transport of mitochondrion(GO:0098939) anterograde dendritic transport of mitochondrion(GO:0098972) |
| 1.3 | 21.4 | GO:0089711 | L-glutamate transmembrane transport(GO:0089711) |
| 1.2 | 23.4 | GO:0031643 | positive regulation of myelination(GO:0031643) |
| 1.2 | 21.1 | GO:0021860 | pyramidal neuron development(GO:0021860) |
| 1.2 | 15.0 | GO:0060159 | regulation of dopamine receptor signaling pathway(GO:0060159) |
| 1.1 | 14.7 | GO:0061669 | spontaneous neurotransmitter secretion(GO:0061669) spontaneous synaptic transmission(GO:0098814) |
| 0.9 | 10.4 | GO:0048934 | peripheral nervous system neuron differentiation(GO:0048934) peripheral nervous system neuron development(GO:0048935) |
| 0.9 | 12.0 | GO:0009312 | oligosaccharide biosynthetic process(GO:0009312) |
| 0.8 | 2.4 | GO:0043132 | NAD transport(GO:0043132) |
| 0.8 | 32.0 | GO:0007214 | gamma-aminobutyric acid signaling pathway(GO:0007214) |
| 0.7 | 17.5 | GO:0060992 | response to fungicide(GO:0060992) |
| 0.7 | 30.5 | GO:1901381 | positive regulation of establishment of protein localization to plasma membrane(GO:0090004) positive regulation of potassium ion transmembrane transport(GO:1901381) |
| 0.6 | 9.9 | GO:0090129 | positive regulation of synapse maturation(GO:0090129) |
| 0.6 | 8.6 | GO:0045793 | positive regulation of cell size(GO:0045793) |
| 0.6 | 10.4 | GO:0019532 | oxalate transport(GO:0019532) sulfate transmembrane transport(GO:1902358) |
| 0.6 | 4.1 | GO:0060372 | regulation of atrial cardiac muscle cell membrane repolarization(GO:0060372) |
| 0.6 | 13.9 | GO:2000114 | regulation of establishment of cell polarity(GO:2000114) |
| 0.6 | 47.0 | GO:0071300 | cellular response to retinoic acid(GO:0071300) |
| 0.5 | 33.0 | GO:0031103 | axon regeneration(GO:0031103) |
| 0.5 | 6.4 | GO:0099562 | maintenance of postsynaptic specialization structure(GO:0098880) maintenance of postsynaptic density structure(GO:0099562) |
| 0.5 | 15.6 | GO:2000249 | regulation of actin cytoskeleton reorganization(GO:2000249) |
| 0.4 | 4.4 | GO:1902031 | regulation of NADP metabolic process(GO:1902031) |
| 0.4 | 9.3 | GO:0045109 | intermediate filament organization(GO:0045109) |
| 0.3 | 4.3 | GO:0061179 | negative regulation of insulin secretion involved in cellular response to glucose stimulus(GO:0061179) |
| 0.3 | 18.9 | GO:0042220 | response to cocaine(GO:0042220) |
| 0.3 | 1.0 | GO:0046338 | phosphatidylethanolamine catabolic process(GO:0046338) |
| 0.2 | 3.1 | GO:0007097 | nuclear migration(GO:0007097) |
| 0.2 | 3.8 | GO:0030502 | negative regulation of bone mineralization(GO:0030502) |
| 0.2 | 22.4 | GO:0042552 | myelination(GO:0042552) |
| 0.2 | 2.3 | GO:0045647 | negative regulation of erythrocyte differentiation(GO:0045647) |
| 0.2 | 1.3 | GO:0048714 | positive regulation of oligodendrocyte differentiation(GO:0048714) regulation of type B pancreatic cell development(GO:2000074) |
| 0.1 | 6.0 | GO:0045010 | actin nucleation(GO:0045010) |
| 0.1 | 3.8 | GO:0000188 | inactivation of MAPK activity(GO:0000188) |
| 0.1 | 1.6 | GO:0006968 | cellular defense response(GO:0006968) |
| 0.1 | 3.4 | GO:0070536 | protein K63-linked deubiquitination(GO:0070536) |
| 0.1 | 0.3 | GO:0030397 | membrane disassembly(GO:0030397) nuclear envelope disassembly(GO:0051081) |
| 0.1 | 2.1 | GO:0002089 | lens morphogenesis in camera-type eye(GO:0002089) |
| 0.1 | 10.6 | GO:0003073 | regulation of systemic arterial blood pressure(GO:0003073) |
| 0.1 | 2.0 | GO:0045736 | negative regulation of cyclin-dependent protein serine/threonine kinase activity(GO:0045736) |
| 0.1 | 6.8 | GO:0042273 | ribosomal large subunit biogenesis(GO:0042273) |
| 0.1 | 12.7 | GO:0042787 | protein ubiquitination involved in ubiquitin-dependent protein catabolic process(GO:0042787) |
| 0.1 | 0.7 | GO:0031848 | protection from non-homologous end joining at telomere(GO:0031848) |
| 0.1 | 1.9 | GO:1902042 | negative regulation of extrinsic apoptotic signaling pathway via death domain receptors(GO:1902042) |
| 0.1 | 8.8 | GO:0007156 | homophilic cell adhesion via plasma membrane adhesion molecules(GO:0007156) |
| 0.1 | 19.1 | GO:0043161 | proteasome-mediated ubiquitin-dependent protein catabolic process(GO:0043161) |
| 0.0 | 0.9 | GO:0060218 | hematopoietic stem cell differentiation(GO:0060218) |
| 0.0 | 9.2 | GO:0006486 | protein glycosylation(GO:0006486) macromolecule glycosylation(GO:0043413) |
| 0.0 | 1.5 | GO:0002053 | positive regulation of mesenchymal cell proliferation(GO:0002053) |
| 0.0 | 0.4 | GO:0002087 | regulation of respiratory gaseous exchange by neurological system process(GO:0002087) |
| 0.0 | 3.2 | GO:0007601 | visual perception(GO:0007601) |
| 0.0 | 2.9 | GO:0006633 | fatty acid biosynthetic process(GO:0006633) |
| 0.0 | 2.8 | GO:0050731 | positive regulation of peptidyl-tyrosine phosphorylation(GO:0050731) |
| 0.0 | 0.8 | GO:0000184 | nuclear-transcribed mRNA catabolic process, nonsense-mediated decay(GO:0000184) |
| 0.0 | 7.2 | GO:0016337 | single organismal cell-cell adhesion(GO:0016337) |
| 0.0 | 5.1 | GO:0016567 | protein ubiquitination(GO:0016567) |
| 0.0 | 0.5 | GO:0046928 | regulation of neurotransmitter secretion(GO:0046928) |
| 0.0 | 5.1 | GO:0043547 | positive regulation of GTPase activity(GO:0043547) |
Gene overrepresentation in cellular component category:
| Log-likelihood per target | Total log-likelihood | Term | Description |
|---|---|---|---|
| 7.9 | 47.4 | GO:0032280 | symmetric synapse(GO:0032280) |
| 3.5 | 21.1 | GO:0097441 | basilar dendrite(GO:0097441) |
| 2.6 | 20.4 | GO:0032584 | growth cone membrane(GO:0032584) |
| 1.9 | 30.8 | GO:0031045 | dense core granule(GO:0031045) |
| 1.9 | 18.9 | GO:0042788 | polysomal ribosome(GO:0042788) |
| 1.5 | 17.5 | GO:0098839 | postsynaptic density membrane(GO:0098839) |
| 1.1 | 3.2 | GO:0033165 | interphotoreceptor matrix(GO:0033165) |
| 0.8 | 16.2 | GO:0005922 | connexon complex(GO:0005922) |
| 0.7 | 13.9 | GO:0071437 | invadopodium(GO:0071437) |
| 0.7 | 24.8 | GO:0032809 | neuronal cell body membrane(GO:0032809) |
| 0.6 | 37.0 | GO:0034707 | chloride channel complex(GO:0034707) |
| 0.6 | 30.1 | GO:0008328 | ionotropic glutamate receptor complex(GO:0008328) neurotransmitter receptor complex(GO:0098878) |
| 0.6 | 56.7 | GO:0042734 | presynaptic membrane(GO:0042734) |
| 0.4 | 4.1 | GO:1990454 | L-type voltage-gated calcium channel complex(GO:1990454) |
| 0.4 | 3.4 | GO:0008541 | proteasome regulatory particle, lid subcomplex(GO:0008541) |
| 0.3 | 15.2 | GO:0046658 | anchored component of plasma membrane(GO:0046658) |
| 0.3 | 30.5 | GO:0008076 | voltage-gated potassium channel complex(GO:0008076) |
| 0.3 | 4.3 | GO:0000124 | SAGA complex(GO:0000124) |
| 0.3 | 15.1 | GO:0016235 | aggresome(GO:0016235) |
| 0.3 | 22.4 | GO:0019005 | SCF ubiquitin ligase complex(GO:0019005) |
| 0.3 | 3.6 | GO:0032593 | insulin-responsive compartment(GO:0032593) |
| 0.2 | 6.8 | GO:0030687 | preribosome, large subunit precursor(GO:0030687) |
| 0.2 | 29.7 | GO:0045211 | postsynaptic membrane(GO:0045211) |
| 0.2 | 21.4 | GO:0005791 | rough endoplasmic reticulum(GO:0005791) |
| 0.2 | 120.6 | GO:0043025 | neuronal cell body(GO:0043025) |
| 0.2 | 23.7 | GO:0090575 | RNA polymerase II transcription factor complex(GO:0090575) |
| 0.2 | 28.5 | GO:0030027 | lamellipodium(GO:0030027) |
| 0.1 | 2.4 | GO:0031231 | integral component of peroxisomal membrane(GO:0005779) intrinsic component of peroxisomal membrane(GO:0031231) |
| 0.1 | 0.7 | GO:0070419 | nonhomologous end joining complex(GO:0070419) |
| 0.1 | 10.5 | GO:0001650 | fibrillar center(GO:0001650) |
| 0.1 | 3.6 | GO:0005881 | cytoplasmic microtubule(GO:0005881) |
| 0.1 | 10.0 | GO:0016323 | basolateral plasma membrane(GO:0016323) |
| 0.0 | 19.7 | GO:0005635 | nuclear envelope(GO:0005635) |
| 0.0 | 16.2 | GO:0005578 | proteinaceous extracellular matrix(GO:0005578) |
| 0.0 | 0.8 | GO:0035145 | exon-exon junction complex(GO:0035145) |
| 0.0 | 8.8 | GO:0048471 | perinuclear region of cytoplasm(GO:0048471) |
| 0.0 | 1.6 | GO:0045335 | phagocytic vesicle(GO:0045335) |
| 0.0 | 2.0 | GO:0042641 | actomyosin(GO:0042641) |
| 0.0 | 3.0 | GO:0005882 | intermediate filament(GO:0005882) |
| 0.0 | 1.0 | GO:0005778 | peroxisomal membrane(GO:0005778) microbody membrane(GO:0031903) |
| 0.0 | 0.6 | GO:0045171 | intercellular bridge(GO:0045171) |
| 0.0 | 59.0 | GO:0005829 | cytosol(GO:0005829) |
Gene overrepresentation in molecular function category:
| Log-likelihood per target | Total log-likelihood | Term | Description |
|---|---|---|---|
| 8.0 | 32.1 | GO:0001642 | group III metabotropic glutamate receptor activity(GO:0001642) |
| 7.9 | 47.4 | GO:0001515 | opioid peptide activity(GO:0001515) |
| 7.1 | 21.4 | GO:0005294 | neutral L-amino acid secondary active transmembrane transporter activity(GO:0005294) |
| 5.1 | 20.4 | GO:0035727 | lysophosphatidic acid binding(GO:0035727) |
| 4.1 | 33.2 | GO:0044323 | retinoic acid-responsive element binding(GO:0044323) |
| 3.5 | 17.5 | GO:0004971 | AMPA glutamate receptor activity(GO:0004971) |
| 3.0 | 30.5 | GO:0008239 | dipeptidyl-peptidase activity(GO:0008239) |
| 2.4 | 12.0 | GO:0008499 | UDP-galactose:beta-N-acetylglucosamine beta-1,3-galactosyltransferase activity(GO:0008499) |
| 2.4 | 40.8 | GO:0050811 | GABA receptor binding(GO:0050811) |
| 2.0 | 9.8 | GO:0019960 | C-X3-C chemokine binding(GO:0019960) |
| 1.3 | 13.3 | GO:0003680 | AT DNA binding(GO:0003680) |
| 1.3 | 23.7 | GO:0005234 | extracellular-glutamate-gated ion channel activity(GO:0005234) |
| 1.2 | 15.6 | GO:0030215 | semaphorin receptor binding(GO:0030215) |
| 1.1 | 30.8 | GO:0042056 | chemoattractant activity(GO:0042056) |
| 1.0 | 2.9 | GO:0042284 | sphingolipid delta-4 desaturase activity(GO:0042284) |
| 0.9 | 20.3 | GO:0030676 | Rac guanyl-nucleotide exchange factor activity(GO:0030676) |
| 0.8 | 9.2 | GO:0004653 | polypeptide N-acetylgalactosaminyltransferase activity(GO:0004653) |
| 0.8 | 21.1 | GO:0005452 | inorganic anion exchanger activity(GO:0005452) |
| 0.7 | 18.9 | GO:0017091 | AU-rich element binding(GO:0017091) |
| 0.7 | 10.4 | GO:0019531 | oxalate transmembrane transporter activity(GO:0019531) |
| 0.7 | 4.1 | GO:0086059 | voltage-gated calcium channel activity involved SA node cell action potential(GO:0086059) |
| 0.6 | 18.8 | GO:0043014 | alpha-tubulin binding(GO:0043014) |
| 0.6 | 24.9 | GO:0001102 | RNA polymerase II activating transcription factor binding(GO:0001102) |
| 0.5 | 3.8 | GO:1990430 | extracellular matrix protein binding(GO:1990430) |
| 0.5 | 3.1 | GO:0004471 | malic enzyme activity(GO:0004470) malate dehydrogenase (decarboxylating) (NAD+) activity(GO:0004471) malate dehydrogenase (decarboxylating) (NADP+) activity(GO:0004473) |
| 0.5 | 6.4 | GO:0098919 | structural constituent of postsynaptic specialization(GO:0098879) structural constituent of postsynaptic density(GO:0098919) |
| 0.5 | 2.4 | GO:0051185 | coenzyme transporter activity(GO:0051185) |
| 0.5 | 3.2 | GO:0061133 | endopeptidase activator activity(GO:0061133) |
| 0.4 | 3.6 | GO:0016308 | 1-phosphatidylinositol-4-phosphate 5-kinase activity(GO:0016308) |
| 0.3 | 1.3 | GO:0046538 | bisphosphoglycerate mutase activity(GO:0004082) phosphoglycerate mutase activity(GO:0004619) 2,3-bisphosphoglycerate-dependent phosphoglycerate mutase activity(GO:0046538) |
| 0.3 | 6.0 | GO:0005522 | profilin binding(GO:0005522) |
| 0.3 | 44.2 | GO:0003774 | motor activity(GO:0003774) |
| 0.3 | 31.7 | GO:0004860 | protein kinase inhibitor activity(GO:0004860) |
| 0.3 | 7.8 | GO:0008395 | steroid hydroxylase activity(GO:0008395) |
| 0.2 | 8.7 | GO:0001965 | G-protein alpha-subunit binding(GO:0001965) |
| 0.2 | 3.8 | GO:0017017 | MAP kinase tyrosine/serine/threonine phosphatase activity(GO:0017017) |
| 0.2 | 11.9 | GO:0050840 | extracellular matrix binding(GO:0050840) |
| 0.2 | 5.2 | GO:0016814 | hydrolase activity, acting on carbon-nitrogen (but not peptide) bonds, in cyclic amidines(GO:0016814) |
| 0.1 | 8.6 | GO:0005080 | protein kinase C binding(GO:0005080) |
| 0.1 | 31.0 | GO:0005085 | guanyl-nucleotide exchange factor activity(GO:0005085) |
| 0.1 | 1.0 | GO:0047499 | calcium-independent phospholipase A2 activity(GO:0047499) |
| 0.1 | 3.2 | GO:0005540 | hyaluronic acid binding(GO:0005540) |
| 0.1 | 1.2 | GO:0017151 | DEAD/H-box RNA helicase binding(GO:0017151) |
| 0.1 | 0.7 | GO:0035312 | 5'-3' exodeoxyribonuclease activity(GO:0035312) |
| 0.1 | 9.4 | GO:0008080 | N-acetyltransferase activity(GO:0008080) |
| 0.1 | 14.7 | GO:0017137 | Rab GTPase binding(GO:0017137) |
| 0.1 | 4.3 | GO:0030374 | ligand-dependent nuclear receptor transcription coactivator activity(GO:0030374) |
| 0.1 | 6.8 | GO:0051082 | unfolded protein binding(GO:0051082) |
| 0.1 | 60.3 | GO:0019904 | protein domain specific binding(GO:0019904) |
| 0.1 | 36.8 | GO:0004842 | ubiquitin-protein transferase activity(GO:0004842) |
| 0.1 | 1.1 | GO:0004745 | retinol dehydrogenase activity(GO:0004745) |
| 0.0 | 8.3 | GO:0035091 | phosphatidylinositol binding(GO:0035091) |
| 0.0 | 0.6 | GO:0003785 | actin monomer binding(GO:0003785) |
| 0.0 | 9.9 | GO:0030246 | carbohydrate binding(GO:0030246) |
| 0.0 | 2.8 | GO:0005178 | integrin binding(GO:0005178) |
| 0.0 | 1.3 | GO:0019003 | GDP binding(GO:0019003) |
| 0.0 | 7.0 | GO:0005261 | cation channel activity(GO:0005261) |
| 0.0 | 10.2 | GO:0004674 | protein serine/threonine kinase activity(GO:0004674) |
| 0.0 | 0.8 | GO:0043022 | ribosome binding(GO:0043022) |
| 0.0 | 1.6 | GO:0016503 | pheromone receptor activity(GO:0016503) |
| 0.0 | 8.8 | GO:0005509 | calcium ion binding(GO:0005509) |
Gene overrepresentation in curated gene sets: canonical pathways category:
| Log-likelihood per target | Total log-likelihood | Term | Description |
|---|---|---|---|
| 3.2 | 67.3 | SA PTEN PATHWAY | PTEN is a tumor suppressor that dephosphorylates the lipid messenger phosphatidylinositol triphosphate. |
| 1.1 | 20.3 | PID ARF6 DOWNSTREAM PATHWAY | Arf6 downstream pathway |
| 0.9 | 38.0 | PID NCADHERIN PATHWAY | N-cadherin signaling events |
| 0.6 | 47.4 | PID AP1 PATHWAY | AP-1 transcription factor network |
| 0.5 | 10.4 | PID P38 MK2 PATHWAY | p38 signaling mediated by MAPKAP kinases |
| 0.4 | 14.3 | PID P38 ALPHA BETA PATHWAY | Regulation of p38-alpha and p38-beta |
| 0.3 | 13.7 | NABA PROTEOGLYCANS | Genes encoding proteoglycans |
| 0.3 | 12.4 | PID TRKR PATHWAY | Neurotrophic factor-mediated Trk receptor signaling |
| 0.3 | 16.4 | PID CDC42 PATHWAY | CDC42 signaling events |
| 0.1 | 9.0 | PID P75 NTR PATHWAY | p75(NTR)-mediated signaling |
| 0.1 | 2.8 | PID RET PATHWAY | Signaling events regulated by Ret tyrosine kinase |
| 0.1 | 32.5 | NABA SECRETED FACTORS | Genes encoding secreted soluble factors |
| 0.1 | 15.6 | NABA ECM AFFILIATED | Genes encoding proteins affiliated structurally or functionally to extracellular matrix proteins |
| 0.1 | 2.1 | PID CDC42 REG PATHWAY | Regulation of CDC42 activity |
| 0.1 | 1.5 | PID RAC1 PATHWAY | RAC1 signaling pathway |
| 0.0 | 0.7 | PID DNA PK PATHWAY | DNA-PK pathway in nonhomologous end joining |
| 0.0 | 1.6 | PID HEDGEHOG GLI PATHWAY | Hedgehog signaling events mediated by Gli proteins |
| 0.0 | 1.3 | PID MTOR 4PATHWAY | mTOR signaling pathway |
Gene overrepresentation in curated gene sets: REACTOME pathways category:
| Log-likelihood per target | Total log-likelihood | Term | Description |
|---|---|---|---|
| 1.7 | 46.7 | REACTOME REGULATION OF GENE EXPRESSION IN BETA CELLS | Genes involved in Regulation of gene expression in beta cells |
| 1.5 | 32.1 | REACTOME CLASS C 3 METABOTROPIC GLUTAMATE PHEROMONE RECEPTORS | Genes involved in Class C/3 (Metabotropic glutamate/pheromone receptors) |
| 1.2 | 18.8 | REACTOME IONOTROPIC ACTIVITY OF KAINATE RECEPTORS | Genes involved in Ionotropic activity of Kainate Receptors |
| 1.0 | 27.4 | REACTOME ADHERENS JUNCTIONS INTERACTIONS | Genes involved in Adherens junctions interactions |
| 1.0 | 17.5 | REACTOME UNBLOCKING OF NMDA RECEPTOR GLUTAMATE BINDING AND ACTIVATION | Genes involved in Unblocking of NMDA receptor, glutamate binding and activation |
| 0.9 | 15.6 | REACTOME OTHER SEMAPHORIN INTERACTIONS | Genes involved in Other semaphorin interactions |
| 0.8 | 21.4 | REACTOME BASIGIN INTERACTIONS | Genes involved in Basigin interactions |
| 0.3 | 34.3 | REACTOME P75 NTR RECEPTOR MEDIATED SIGNALLING | Genes involved in p75 NTR receptor-mediated signalling |
| 0.3 | 57.1 | REACTOME PEPTIDE LIGAND BINDING RECEPTORS | Genes involved in Peptide ligand-binding receptors |
| 0.2 | 6.0 | REACTOME GENERATION OF SECOND MESSENGER MOLECULES | Genes involved in Generation of second messenger molecules |
| 0.2 | 9.2 | REACTOME O LINKED GLYCOSYLATION OF MUCINS | Genes involved in O-linked glycosylation of mucins |
| 0.1 | 1.3 | REACTOME REGULATION OF RHEB GTPASE ACTIVITY BY AMPK | Genes involved in Regulation of Rheb GTPase activity by AMPK |
| 0.1 | 1.4 | REACTOME SYNTHESIS OF PIPS AT THE LATE ENDOSOME MEMBRANE | Genes involved in Synthesis of PIPs at the late endosome membrane |
| 0.1 | 2.4 | REACTOME PEROXISOMAL LIPID METABOLISM | Genes involved in Peroxisomal lipid metabolism |
| 0.1 | 8.7 | REACTOME G ALPHA I SIGNALLING EVENTS | Genes involved in G alpha (i) signalling events |
| 0.1 | 3.4 | REACTOME VIF MEDIATED DEGRADATION OF APOBEC3G | Genes involved in Vif-mediated degradation of APOBEC3G |
| 0.1 | 2.8 | REACTOME NCAM1 INTERACTIONS | Genes involved in NCAM1 interactions |
| 0.1 | 7.0 | REACTOME TRANSPORT OF INORGANIC CATIONS ANIONS AND AMINO ACIDS OLIGOPEPTIDES | Genes involved in Transport of inorganic cations/anions and amino acids/oligopeptides |
| 0.0 | 1.0 | REACTOME ACYL CHAIN REMODELLING OF PE | Genes involved in Acyl chain remodelling of PE |