Project
GSE53960: rat RNA-Seq transcriptomic Bodymap
Navigation
Downloads
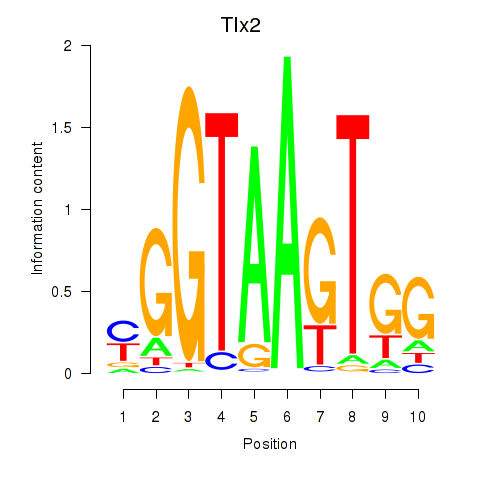
Results for Tlx2
Z-value: 1.36
Motif logo
Transcription factors associated with Tlx2
| Gene Symbol | Gene ID | Gene Info |
|---|---|---|
|
Tlx2
|
ENSRNOG00000055188 | T-cell leukemia homeobox 2 |
|
Tlx2
|
ENSRNOG00000061571 | T-cell leukemia homeobox 2 |
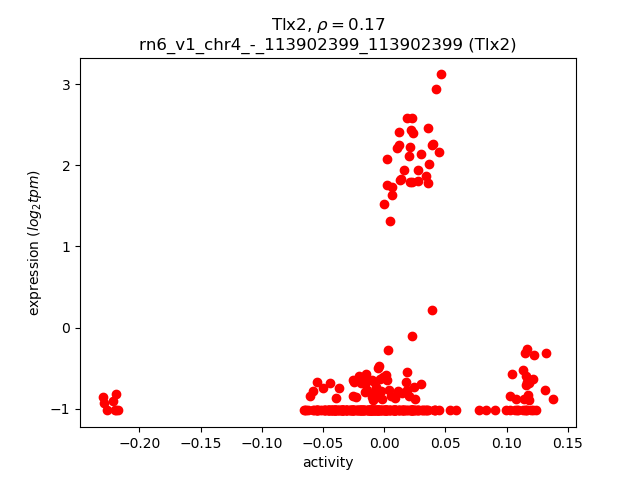
Activity-expression correlation:
| Gene | Promoter | Pearson corr. coef. | P-value | Plot |
|---|---|---|---|---|
| Tlx2 | rn6_v1_chr4_-_113902399_113902399 | 0.17 | 2.0e-03 | Click! |
Activity profile of Tlx2 motif
Sorted Z-values of Tlx2 motif
| Promoter | Log-likelihood | Transcript | Gene | Gene Info |
|---|---|---|---|---|
| chr11_+_84972132 | 45.73 |
ENSRNOT00000034498
|
Lamp3
|
lysosomal-associated membrane protein 3 |
| chr20_+_4363508 | 39.57 |
ENSRNOT00000077205
|
Ager
|
advanced glycosylation end product-specific receptor |
| chr20_+_4363152 | 35.47 |
ENSRNOT00000000508
ENSRNOT00000084841 ENSRNOT00000072848 ENSRNOT00000077561 |
Ager
|
advanced glycosylation end product-specific receptor |
| chr2_+_190073815 | 33.87 |
ENSRNOT00000015473
|
S100a8
|
S100 calcium binding protein A8 |
| chr17_-_69862110 | 27.46 |
ENSRNOT00000058312
|
Akr1cl
|
aldo-keto reductase family 1, member C-like |
| chr1_-_225283326 | 27.41 |
ENSRNOT00000027342
|
Scgb1a1
|
secretoglobin family 1A member 1 |
| chr10_+_47765432 | 26.08 |
ENSRNOT00000078231
|
LOC102553715
|
microfibril-associated glycoprotein 4-like |
| chr2_+_248219428 | 25.05 |
ENSRNOT00000037181
|
LOC685067
|
similar to guanylate binding protein family, member 6 |
| chr14_-_86146744 | 24.69 |
ENSRNOT00000019335
|
Myl7
|
myosin light chain 7 |
| chr2_-_191294374 | 24.58 |
ENSRNOT00000067469
|
RGD1562234
|
similar to S100 calcium-binding protein, ventral prostate |
| chr4_+_98371184 | 24.20 |
ENSRNOT00000086911
|
AABR07060872.1
|
|
| chrX_-_139916883 | 23.71 |
ENSRNOT00000090442
|
Gpc3
|
glypican 3 |
| chr10_+_47765783 | 23.04 |
ENSRNOT00000003268
|
LOC102553715
|
microfibril-associated glycoprotein 4-like |
| chr1_-_241875864 | 22.43 |
ENSRNOT00000091282
|
Fam189a2
|
family with sequence similarity 189, member A2 |
| chr1_+_89220083 | 21.95 |
ENSRNOT00000093144
|
Dmkn
|
dermokine |
| chr5_+_157222636 | 21.92 |
ENSRNOT00000022579
|
Pla2g2d
|
phospholipase A2, group IID |
| chr2_-_190100276 | 21.54 |
ENSRNOT00000015351
|
S100a9
|
S100 calcium binding protein A9 |
| chr10_+_5433248 | 21.00 |
ENSRNOT00000003615
|
Emp2
|
epithelial membrane protein 2 |
| chr19_-_1074333 | 20.94 |
ENSRNOT00000017983
ENSRNOT00000086995 |
Cdh5
|
cadherin 5 |
| chr15_+_57241968 | 20.38 |
ENSRNOT00000082191
|
Lcp1
|
lymphocyte cytosolic protein 1 |
| chr13_-_90814119 | 20.06 |
ENSRNOT00000011208
|
Tagln2
|
transgelin 2 |
| chr7_+_116632506 | 19.68 |
ENSRNOT00000009811
|
Gpihbp1
|
glycosylphosphatidylinositol anchored high density lipoprotein binding protein 1 |
| chr3_-_111941841 | 19.68 |
ENSRNOT00000010701
|
Ehd4
|
EH-domain containing 4 |
| chr19_-_15570611 | 19.23 |
ENSRNOT00000022679
|
Mmp2
|
matrix metallopeptidase 2 |
| chr18_+_12008759 | 19.17 |
ENSRNOT00000022665
ENSRNOT00000061344 ENSRNOT00000038635 |
Dsg1
|
desmoglein 1 |
| chr4_+_168832910 | 18.66 |
ENSRNOT00000011134
|
Gprc5a
|
G protein-coupled receptor, class C, group 5, member A |
| chr1_-_98521551 | 18.42 |
ENSRNOT00000081922
|
Siglec10
|
sialic acid binding Ig-like lectin 10 |
| chr13_+_89524329 | 18.05 |
ENSRNOT00000004279
|
Mpz
|
myelin protein zero |
| chr8_-_63092009 | 17.51 |
ENSRNOT00000034300
|
Loxl1
|
lysyl oxidase-like 1 |
| chr4_-_58875753 | 17.39 |
ENSRNOT00000016991
|
Podxl
|
podocalyxin-like |
| chr1_-_98521706 | 17.34 |
ENSRNOT00000015941
|
Siglec10
|
sialic acid binding Ig-like lectin 10 |
| chr8_+_57936650 | 17.13 |
ENSRNOT00000089686
|
Exph5
|
exophilin 5 |
| chr9_-_52238564 | 16.74 |
ENSRNOT00000005073
|
Col5a2
|
collagen type V alpha 2 chain |
| chr8_+_70915953 | 16.43 |
ENSRNOT00000046914
|
Rasl12
|
RAS-like, family 12 |
| chr4_-_48928372 | 16.42 |
ENSRNOT00000083938
|
Tspan12
|
tetraspanin 12 |
| chr2_-_54823917 | 16.30 |
ENSRNOT00000039057
ENSRNOT00000079333 |
Card6
|
caspase recruitment domain family, member 6 |
| chr10_+_53818818 | 16.17 |
ENSRNOT00000057260
|
Myh8
|
myosin heavy chain 8 |
| chr7_+_133400485 | 15.75 |
ENSRNOT00000006219
|
Cntn1
|
contactin 1 |
| chr12_+_2201891 | 15.59 |
ENSRNOT00000091197
ENSRNOT00000001325 |
Retn
|
resistin |
| chr6_+_60566196 | 14.94 |
ENSRNOT00000006709
ENSRNOT00000075193 |
Dock4
|
dedicator of cytokinesis 4 |
| chr1_-_69287538 | 14.82 |
ENSRNOT00000071232
|
LOC102546678
|
transmembrane gamma-carboxyglutamic acid protein 3-like |
| chr12_-_23682381 | 14.81 |
ENSRNOT00000037639
|
Upk3b
|
uroplakin 3B |
| chr3_+_72460889 | 14.68 |
ENSRNOT00000012209
|
Tnks1bp1
|
tankyrase 1 binding protein 1 |
| chr1_-_141470380 | 14.09 |
ENSRNOT00000065759
|
Plin1
|
perilipin 1 |
| chr7_+_118685181 | 14.05 |
ENSRNOT00000068221
|
Apol3
|
apolipoprotein L, 3 |
| chr10_+_90930010 | 14.02 |
ENSRNOT00000003765
|
Higd1b
|
HIG1 hypoxia inducible domain family, member 1B |
| chr6_-_25211494 | 13.88 |
ENSRNOT00000009634
|
Xdh
|
xanthine dehydrogenase |
| chr10_+_47490153 | 13.85 |
ENSRNOT00000003182
|
Aldh3a1
|
aldehyde dehydrogenase 3 family, member A1 |
| chr18_-_47577819 | 13.82 |
ENSRNOT00000019844
|
Lox
|
lysyl oxidase |
| chr7_-_54778848 | 13.81 |
ENSRNOT00000005399
|
Glipr1
|
GLI pathogenesis-related 1 |
| chr6_+_96479430 | 13.71 |
ENSRNOT00000006729
|
Prkch
|
protein kinase C, eta |
| chr7_+_94375020 | 13.56 |
ENSRNOT00000011904
|
Nov
|
nephroblastoma overexpressed |
| chr2_+_187347602 | 13.39 |
ENSRNOT00000025384
|
Nes
|
nestin |
| chr1_-_216274930 | 13.28 |
ENSRNOT00000040850
|
Trpm5
|
transient receptor potential cation channel, subfamily M, member 5 |
| chr7_+_118685022 | 13.27 |
ENSRNOT00000089135
|
Apol3
|
apolipoprotein L, 3 |
| chr11_+_45751812 | 13.20 |
ENSRNOT00000079336
|
RGD1310935
|
similar to Dermal papilla derived protein 7 |
| chr7_-_121232741 | 12.98 |
ENSRNOT00000023196
|
Pdgfb
|
platelet derived growth factor subunit B |
| chr14_-_34561696 | 12.81 |
ENSRNOT00000059763
|
Srd5a3
|
steroid 5 alpha-reductase 3 |
| chr1_-_100537377 | 12.62 |
ENSRNOT00000026599
|
Spib
|
Spi-B transcription factor |
| chr15_-_43542939 | 12.51 |
ENSRNOT00000012996
|
Dpysl2
|
dihydropyrimidinase-like 2 |
| chr13_-_93307199 | 12.48 |
ENSRNOT00000065041
|
Rgs7
|
regulator of G-protein signaling 7 |
| chr12_+_21678580 | 12.48 |
ENSRNOT00000039797
|
LOC100910669
|
paired immunoglobulin-like type 2 receptor alpha-like |
| chr2_-_123193130 | 12.33 |
ENSRNOT00000019554
|
Anxa5
|
annexin A5 |
| chr6_+_43829945 | 12.27 |
ENSRNOT00000086548
|
Klf11
|
Kruppel-like factor 11 |
| chr12_+_19714324 | 12.27 |
ENSRNOT00000072303
|
RGD1559588
|
similar to cell surface receptor FDFACT |
| chr7_+_94130852 | 12.24 |
ENSRNOT00000011485
|
Mal2
|
mal, T-cell differentiation protein 2 |
| chr10_+_29067102 | 12.23 |
ENSRNOT00000005161
|
C1qtnf2
|
C1q and tumor necrosis factor related protein 2 |
| chr14_+_5928737 | 12.17 |
ENSRNOT00000071877
ENSRNOT00000040985 ENSRNOT00000074889 |
Mpa2l
|
macrophage activation 2 like |
| chr7_+_59326518 | 11.88 |
ENSRNOT00000085231
|
Ptprb
|
protein tyrosine phosphatase, receptor type, B |
| chr11_+_46009322 | 11.87 |
ENSRNOT00000002233
|
Tmem45a
|
transmembrane protein 45A |
| chr5_-_128009735 | 11.67 |
ENSRNOT00000013913
|
Gpx7
|
glutathione peroxidase 7 |
| chr12_+_20882344 | 11.58 |
ENSRNOT00000068118
|
LOC681341
|
similar to paired immunoglobin-like type 2 receptor beta |
| chr2_-_250981623 | 11.37 |
ENSRNOT00000018435
|
Clca2
|
chloride channel accessory 2 |
| chr4_-_163402561 | 11.27 |
ENSRNOT00000091890
|
Klrk1
|
killer cell lectin like receptor K1 |
| chr2_-_181026024 | 11.20 |
ENSRNOT00000064930
|
Gucy1b3
|
guanylate cyclase 1 soluble subunit beta 3 |
| chr3_-_134696654 | 11.18 |
ENSRNOT00000006454
|
Flrt3
|
fibronectin leucine rich transmembrane protein 3 |
| chr13_-_67819835 | 11.16 |
ENSRNOT00000093666
|
Hmcn1
|
hemicentin 1 |
| chr12_-_21891105 | 11.15 |
ENSRNOT00000046100
|
LOC685048
|
similar to paired immunoglobin-like type 2 receptor beta |
| chr1_+_14224393 | 11.12 |
ENSRNOT00000016037
|
Perp
|
PERP, TP53 apoptosis effector |
| chr7_+_144865608 | 11.11 |
ENSRNOT00000091596
ENSRNOT00000055285 |
Hnrnpa1
|
heterogeneous nuclear ribonucleoprotein A1 |
| chr3_+_122544788 | 11.04 |
ENSRNOT00000063828
|
Tgm3
|
transglutaminase 3 |
| chr10_-_56506446 | 11.02 |
ENSRNOT00000021357
|
Acap1
|
ArfGAP with coiled-coil, ankyrin repeat and PH domains 1 |
| chr14_-_28536260 | 10.97 |
ENSRNOT00000059942
|
Adgrl3
|
adhesion G protein-coupled receptor L3 |
| chr11_+_46714355 | 10.90 |
ENSRNOT00000073404
|
Tmem45al
|
transmembrane protein 45A-like |
| chr6_-_99870024 | 10.84 |
ENSRNOT00000010043
|
Rab15
|
RAB15, member RAS oncogene family |
| chr1_-_219438779 | 10.81 |
ENSRNOT00000029237
|
Tbc1d10c
|
TBC1 domain family, member 10C |
| chr20_-_4698718 | 10.72 |
ENSRNOT00000047527
|
RT1-CE7
|
RT1 class I, locus CE7 |
| chr8_-_50228369 | 10.53 |
ENSRNOT00000024030
|
Tagln
|
transgelin |
| chrX_+_20216587 | 10.46 |
ENSRNOT00000073114
|
AABR07037412.2
|
FYVE, RhoGEF and PH domain-containing protein 1 |
| chr2_+_29410579 | 10.38 |
ENSRNOT00000023180
|
Zfp366
|
zinc finger protein 366 |
| chr5_+_155812105 | 10.37 |
ENSRNOT00000039341
|
AABR07073181.1
|
|
| chr16_+_1749191 | 10.34 |
ENSRNOT00000014004
|
Zmiz1
|
zinc finger, MIZ-type containing 1 |
| chr15_-_32780603 | 10.32 |
ENSRNOT00000046980
|
Trdv5
|
T cell receptor delta variable 5 |
| chr11_+_60371729 | 10.29 |
ENSRNOT00000058453
|
Cd200
|
Cd200 molecule |
| chr19_-_10976396 | 10.29 |
ENSRNOT00000073239
|
Nlrc5
|
NLR family, CARD domain containing 5 |
| chr9_-_42839837 | 10.23 |
ENSRNOT00000038610
|
Neurl3
|
neuralized E3 ubiquitin protein ligase 3 |
| chr4_+_42202838 | 10.17 |
ENSRNOT00000082453
|
Mdfic
|
MyoD family inhibitor domain containing |
| chr5_-_117440254 | 10.11 |
ENSRNOT00000066139
|
Kank4
|
KN motif and ankyrin repeat domains 4 |
| chr13_-_80738634 | 9.99 |
ENSRNOT00000081551
|
Fmo1
|
flavin containing monooxygenase 1 |
| chr4_-_115239723 | 9.92 |
ENSRNOT00000042699
|
Actg2
|
actin, gamma 2, smooth muscle, enteric |
| chr5_+_149047681 | 9.86 |
ENSRNOT00000015198
|
Laptm5
|
lysosomal protein transmembrane 5 |
| chr4_-_58893170 | 9.84 |
ENSRNOT00000077406
|
Podxl
|
podocalyxin-like |
| chr7_-_29233392 | 9.78 |
ENSRNOT00000064241
|
Spic
|
Spi-C transcription factor |
| chr12_+_19890749 | 9.78 |
ENSRNOT00000074970
|
RGD1559588
|
similar to cell surface receptor FDFACT |
| chr17_-_18828929 | 9.71 |
ENSRNOT00000051732
|
LOC102554838
|
stathmin domain-containing protein 1-like |
| chr14_-_5859581 | 9.68 |
ENSRNOT00000052308
|
AABR07014241.1
|
|
| chr20_-_4921348 | 9.63 |
ENSRNOT00000082497
ENSRNOT00000041151 |
RT1-CE4
|
RT1 class I, locus CE4 |
| chr8_+_44847157 | 9.50 |
ENSRNOT00000080288
|
Clmp
|
CXADR-like membrane protein |
| chr7_+_70946228 | 9.42 |
ENSRNOT00000039306
|
Stat6
|
signal transducer and activator of transcription 6 |
| chr10_-_71383378 | 9.39 |
ENSRNOT00000077025
|
Dusp14
|
dual specificity phosphatase 14 |
| chr1_-_252550394 | 9.23 |
ENSRNOT00000083468
|
Acta2
|
actin, alpha 2, smooth muscle, aorta |
| chr4_+_162493908 | 9.22 |
ENSRNOT00000072064
|
Clec2d
|
C-type lectin domain family 2, member D |
| chr4_+_66670618 | 9.18 |
ENSRNOT00000010796
|
Tbxas1
|
thromboxane A synthase 1 |
| chr10_-_103590607 | 9.04 |
ENSRNOT00000034741
|
Cd300le
|
Cd300 molecule-like family member E |
| chr1_+_233382708 | 9.02 |
ENSRNOT00000019174
|
Gnaq
|
G protein subunit alpha q |
| chr2_-_231521052 | 9.00 |
ENSRNOT00000089534
ENSRNOT00000080470 ENSRNOT00000084756 |
Ank2
|
ankyrin 2 |
| chr1_-_153740905 | 9.00 |
ENSRNOT00000023239
|
Prss23
|
protease, serine, 23 |
| chr1_+_264827739 | 8.94 |
ENSRNOT00000021553
|
Kazald1
|
Kazal-type serine peptidase inhibitor domain 1 |
| chr9_+_43331155 | 8.94 |
ENSRNOT00000023036
|
Zap70
|
zeta chain of T cell receptor associated protein kinase 70 |
| chr5_+_139038134 | 8.93 |
ENSRNOT00000078155
|
Hivep3
|
human immunodeficiency virus type I enhancer binding protein 3 |
| chr11_-_81660395 | 8.86 |
ENSRNOT00000048739
|
Fetub
|
fetuin B |
| chr5_-_147584038 | 8.83 |
ENSRNOT00000010983
|
Zbtb8a
|
zinc finger and BTB domain containing 8a |
| chr20_+_3167079 | 8.82 |
ENSRNOT00000001035
|
RT1-N3
|
RT1 class Ib, locus N3 |
| chr5_-_106207126 | 8.79 |
ENSRNOT00000015094
|
Mllt3
|
MLLT3, super elongation complex subunit |
| chr7_-_115963046 | 8.75 |
ENSRNOT00000007923
|
Slurp1
|
secreted Ly6/Plaur domain containing 1 |
| chr9_-_113598477 | 8.71 |
ENSRNOT00000035606
ENSRNOT00000084884 |
Ralbp1
|
ralA binding protein 1 |
| chr1_+_98398660 | 8.68 |
ENSRNOT00000047473
|
Cd33
|
CD33 molecule |
| chr13_-_52514875 | 8.64 |
ENSRNOT00000064758
|
Nav1
|
neuron navigator 1 |
| chr11_-_53575060 | 8.63 |
ENSRNOT00000050142
ENSRNOT00000078221 ENSRNOT00000078434 |
Cd47
|
Cd47 molecule |
| chr10_-_103816287 | 8.61 |
ENSRNOT00000004477
|
Grin2c
|
glutamate ionotropic receptor NMDA type subunit 2C |
| chr20_+_4039413 | 8.54 |
ENSRNOT00000082136
|
RT1-Bb
|
RT1 class II, locus Bb |
| chr10_-_64202380 | 8.53 |
ENSRNOT00000008982
|
Rflnb
|
refilin B |
| chr11_-_38088753 | 8.52 |
ENSRNOT00000002713
|
Tmprss2
|
transmembrane protease, serine 2 |
| chr1_-_80271001 | 8.38 |
ENSRNOT00000034266
|
Cd3eap
|
CD3e molecule associated protein |
| chr8_+_71914867 | 8.35 |
ENSRNOT00000023372
|
Dapk2
|
death-associated protein kinase 2 |
| chr3_-_122947075 | 8.29 |
ENSRNOT00000082369
|
Pced1a
|
PC-esterase domain containing 1A |
| chr5_+_58661049 | 8.28 |
ENSRNOT00000078274
|
Unc13b
|
unc-13 homolog B |
| chr9_+_10963723 | 8.24 |
ENSRNOT00000075424
|
Plin4
|
perilipin 4 |
| chr4_-_115015965 | 8.21 |
ENSRNOT00000014603
|
Mthfd2
|
methylenetetrahydrofolate dehydrogenase (NADP+ dependent) 2, methenyltetrahydrofolate cyclohydrolase |
| chr6_+_43234526 | 8.16 |
ENSRNOT00000086808
|
Asap2
|
ArfGAP with SH3 domain, ankyrin repeat and PH domain 2 |
| chr16_-_10726648 | 8.12 |
ENSRNOT00000080635
ENSRNOT00000087150 |
Sncg
|
synuclein, gamma |
| chr12_-_21362205 | 8.04 |
ENSRNOT00000064787
|
LOC108348155
|
paired immunoglobulin-like type 2 receptor beta-2 |
| chrX_-_156440461 | 8.03 |
ENSRNOT00000083951
|
Rpl10
|
ribosomal protein L10 |
| chr10_+_45559578 | 8.00 |
ENSRNOT00000004011
|
RGD1304587
|
similar to RIKEN cDNA 2310033P09 |
| chrX_-_20232635 | 7.99 |
ENSRNOT00000003540
ENSRNOT00000072753 |
Tsr2
|
TSR2, ribosome maturation factor |
| chr2_-_177950517 | 7.97 |
ENSRNOT00000012792
|
Rapgef2
|
Rap guanine nucleotide exchange factor 2 |
| chr7_-_144127873 | 7.96 |
ENSRNOT00000074497
|
Npff
|
neuropeptide FF-amide peptide precursor |
| chr1_-_54748763 | 7.94 |
ENSRNOT00000074549
|
LOC100911027
|
protein MAL2-like |
| chr1_+_81779380 | 7.88 |
ENSRNOT00000065865
ENSRNOT00000080143 ENSRNOT00000089592 ENSRNOT00000080840 |
Arhgef1
|
Rho guanine nucleotide exchange factor 1 |
| chr8_+_133210473 | 7.87 |
ENSRNOT00000082774
|
Ccr5
|
chemokine (C-C motif) receptor 5 |
| chr3_+_72540538 | 7.83 |
ENSRNOT00000012379
|
Aplnr
|
apelin receptor |
| chrX_+_113948654 | 7.78 |
ENSRNOT00000068431
|
Tmem164
|
transmembrane protein 164 |
| chr2_-_227207584 | 7.77 |
ENSRNOT00000065361
ENSRNOT00000080215 |
Myoz2
|
myozenin 2 |
| chr7_-_73216251 | 7.67 |
ENSRNOT00000057587
|
LOC100362027
|
ribosomal protein L30-like |
| chr20_-_4934871 | 7.62 |
ENSRNOT00000071840
|
RT1-CE3
|
RT1 class I, locus CE3 |
| chr1_-_265798167 | 7.57 |
ENSRNOT00000079483
|
Ldb1
|
LIM domain binding 1 |
| chr1_+_56288832 | 7.56 |
ENSRNOT00000079718
|
Smoc2
|
SPARC related modular calcium binding 2 |
| chr2_+_247248407 | 7.43 |
ENSRNOT00000082287
|
Unc5c
|
unc-5 netrin receptor C |
| chr19_-_10653800 | 7.41 |
ENSRNOT00000022128
|
Cx3cl1
|
C-X3-C motif chemokine ligand 1 |
| chr7_+_31784438 | 7.40 |
ENSRNOT00000010914
ENSRNOT00000010929 |
Ikbip
|
IKBKB interacting protein |
| chr7_+_34001506 | 7.40 |
ENSRNOT00000005762
|
Cdk17
|
cyclin-dependent kinase 17 |
| chr5_-_150987081 | 7.37 |
ENSRNOT00000017340
|
Themis2
|
thymocyte selection associated family member 2 |
| chr16_+_23553647 | 7.32 |
ENSRNOT00000041994
|
Psd3
|
pleckstrin and Sec7 domain containing 3 |
| chr20_-_4935372 | 7.28 |
ENSRNOT00000050099
ENSRNOT00000047779 |
RT1-CE3
RT1-CE4
|
RT1 class I, locus CE3 RT1 class I, locus CE4 |
| chr20_+_5351605 | 7.28 |
ENSRNOT00000089306
ENSRNOT00000041590 ENSRNOT00000081240 ENSRNOT00000082538 |
RT1-A1
|
RT1 class Ia, locus A1 |
| chr12_-_20276121 | 7.25 |
ENSRNOT00000065873
|
LOC685157
|
similar to paired immunoglobin-like type 2 receptor beta |
| chr3_+_175708519 | 7.23 |
ENSRNOT00000085983
|
AC115322.1
|
|
| chr1_-_64090017 | 7.23 |
ENSRNOT00000086622
ENSRNOT00000091654 |
Rps9
|
ribosomal protein S9 |
| chr15_+_4077091 | 7.23 |
ENSRNOT00000011554
|
Myoz1
|
myozenin 1 |
| chrX_-_152932953 | 7.20 |
ENSRNOT00000078929
|
Cetn2
|
centrin 2 |
| chr1_-_64021321 | 7.17 |
ENSRNOT00000090819
|
Rps9
|
ribosomal protein S9 |
| chr3_-_176465162 | 7.13 |
ENSRNOT00000048807
|
Nkain4
|
Sodium/potassium transporting ATPase interacting 4 |
| chr4_-_78074906 | 7.12 |
ENSRNOT00000080654
|
Zfp467
|
zinc finger protein 467 |
| chr18_-_15688117 | 7.11 |
ENSRNOT00000022584
|
Dsg3
|
desmoglein 3 |
| chr9_+_42880217 | 7.03 |
ENSRNOT00000067688
|
Arid5a
|
AT-rich interaction domain 5A |
| chr3_+_161519743 | 6.93 |
ENSRNOT00000055148
|
Cd40
|
CD40 molecule |
| chr1_+_22758212 | 6.88 |
ENSRNOT00000022184
|
Rps12
|
ribosomal protein S12 |
| chr7_-_107963073 | 6.86 |
ENSRNOT00000093353
ENSRNOT00000010980 |
St3gal1
|
ST3 beta-galactoside alpha-2,3-sialyltransferase 1 |
| chr2_+_266315036 | 6.81 |
ENSRNOT00000055245
|
Wls
|
wntless Wnt ligand secretion mediator |
| chr2_-_57935334 | 6.81 |
ENSRNOT00000022319
ENSRNOT00000085599 ENSRNOT00000077790 ENSRNOT00000035821 |
Slc1a3
|
solute carrier family 1 member 3 |
| chr7_+_34952011 | 6.72 |
ENSRNOT00000077666
|
Fgd6
|
FYVE, RhoGEF and PH domain containing 6 |
| chr7_+_118895405 | 6.72 |
ENSRNOT00000092095
|
RGD1309808
|
similar to apolipoprotein L2; apolipoprotein L-II |
| chr10_-_39604070 | 6.68 |
ENSRNOT00000032333
|
Csf2
|
colony stimulating factor 2 |
| chr19_+_561727 | 6.67 |
ENSRNOT00000016259
ENSRNOT00000081547 |
Rrad
|
RRAD, Ras related glycolysis inhibitor and calcium channel regulator |
| chr1_+_235166718 | 6.64 |
ENSRNOT00000020201
|
Gna14
|
G protein subunit alpha 14 |
| chr5_+_148257642 | 6.60 |
ENSRNOT00000067663
|
Col16a1
|
collagen type XVI alpha 1 chain |
| chr18_-_55771730 | 6.57 |
ENSRNOT00000026426
|
Smim3
|
small integral membrane protein 3 |
| chr8_+_132120452 | 6.49 |
ENSRNOT00000055822
|
Tgm4
|
transglutaminase 4 |
| chr1_+_81643816 | 6.40 |
ENSRNOT00000027214
|
LOC103689942
|
carcinoembryonic antigen-related cell adhesion molecule 1-like |
| chr14_-_45002719 | 6.38 |
ENSRNOT00000002883
|
Fam114a1
|
family with sequence similarity 114, member A1 |
| chr1_+_199449973 | 6.37 |
ENSRNOT00000029994
|
Trim72
|
tripartite motif containing 72 |
| chr5_+_74727494 | 6.36 |
ENSRNOT00000076683
|
Rn50_5_0791.1
|
|
| chr4_+_7889869 | 6.34 |
ENSRNOT00000014063
|
Pus7
|
pseudouridylate synthase 7 |
| chr8_-_66863476 | 6.33 |
ENSRNOT00000018820
|
Rplp1
|
ribosomal protein lateral stalk subunit P1 |
| chr5_-_137014375 | 6.32 |
ENSRNOT00000066165
ENSRNOT00000091866 |
Kdm4a
|
lysine demethylase 4A |
| chrX_+_70461718 | 6.31 |
ENSRNOT00000078233
ENSRNOT00000003789 |
Kif4a
|
kinesin family member 4A |
| chr1_+_198655742 | 6.31 |
ENSRNOT00000023944
|
Mylpf
|
myosin light chain, phosphorylatable, fast skeletal muscle |
| chr8_+_85417838 | 6.26 |
ENSRNOT00000012257
|
Ick
|
intestinal cell kinase |
| chr8_+_70884491 | 6.22 |
ENSRNOT00000072939
|
Ubap1l
|
ubiquitin associated protein 1-like |
| chr6_+_94636222 | 6.21 |
ENSRNOT00000005846
|
Daam1
|
dishevelled associated activator of morphogenesis 1 |
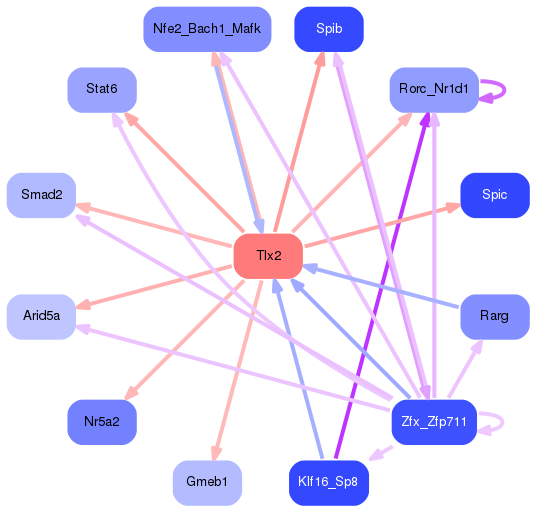
Network of associatons between targets according to the STRING database.

First level regulatory network of Tlx2
Gene Ontology Analysis
Gene overrepresentation in biological process category:
| Log-likelihood per target | Total log-likelihood | Term | Description |
|---|---|---|---|
| 25.0 | 75.0 | GO:0072714 | response to selenite ion(GO:0072714) negative regulation of connective tissue replacement(GO:1905204) |
| 7.2 | 21.5 | GO:0035606 | peptidyl-cysteine S-trans-nitrosylation(GO:0035606) |
| 6.9 | 27.4 | GO:0032696 | negative regulation of interleukin-13 production(GO:0032696) |
| 5.9 | 23.7 | GO:0072138 | mesenchymal cell proliferation involved in ureteric bud development(GO:0072138) |
| 5.5 | 16.6 | GO:0010986 | positive regulation of lipoprotein particle clearance(GO:0010986) |
| 5.5 | 22.0 | GO:1903575 | cornified envelope assembly(GO:1903575) |
| 5.2 | 15.6 | GO:2000872 | positive regulation of progesterone secretion(GO:2000872) |
| 5.0 | 14.9 | GO:1904694 | negative regulation of vascular smooth muscle contraction(GO:1904694) |
| 4.8 | 14.5 | GO:0060392 | negative regulation of SMAD protein import into nucleus(GO:0060392) |
| 4.3 | 13.0 | GO:0072209 | metanephric mesangial cell differentiation(GO:0072209) metanephric glomerular mesangial cell differentiation(GO:0072254) |
| 4.2 | 16.7 | GO:1903225 | negative regulation of endodermal cell differentiation(GO:1903225) |
| 4.2 | 8.4 | GO:2000422 | regulation of eosinophil chemotaxis(GO:2000422) positive regulation of eosinophil chemotaxis(GO:2000424) |
| 4.0 | 40.2 | GO:0001955 | blood vessel maturation(GO:0001955) |
| 3.9 | 27.2 | GO:0033634 | positive regulation of cell-cell adhesion mediated by integrin(GO:0033634) |
| 3.8 | 19.1 | GO:0090131 | mesenchyme migration(GO:0090131) |
| 3.8 | 11.3 | GO:0002223 | stimulatory C-type lectin receptor signaling pathway(GO:0002223) negative regulation of natural killer cell chemotaxis(GO:2000502) |
| 3.6 | 14.4 | GO:0045903 | positive regulation of translational fidelity(GO:0045903) |
| 3.3 | 13.4 | GO:0045105 | intermediate filament polymerization or depolymerization(GO:0045105) |
| 3.0 | 15.2 | GO:0061113 | pancreas morphogenesis(GO:0061113) |
| 3.0 | 21.0 | GO:0070836 | caveola assembly(GO:0070836) |
| 3.0 | 8.9 | GO:0043366 | beta selection(GO:0043366) |
| 2.9 | 8.6 | GO:0033058 | directional locomotion(GO:0033058) |
| 2.8 | 8.5 | GO:0061181 | regulation of chondrocyte development(GO:0061181) |
| 2.8 | 11.1 | GO:1903936 | cellular response to sodium arsenite(GO:1903936) |
| 2.8 | 13.9 | GO:0009115 | xanthine catabolic process(GO:0009115) |
| 2.8 | 41.3 | GO:0002523 | leukocyte migration involved in inflammatory response(GO:0002523) |
| 2.6 | 7.9 | GO:2000464 | positive regulation of astrocyte chemotaxis(GO:2000464) |
| 2.6 | 10.3 | GO:0007296 | vitellogenesis(GO:0007296) |
| 2.6 | 7.8 | GO:0016598 | protein arginylation(GO:0016598) |
| 2.6 | 10.3 | GO:0060335 | positive regulation of response to interferon-gamma(GO:0060332) positive regulation of interferon-gamma-mediated signaling pathway(GO:0060335) |
| 2.6 | 12.8 | GO:0016095 | polyprenol catabolic process(GO:0016095) |
| 2.4 | 7.3 | GO:0002462 | tolerance induction to nonself antigen(GO:0002462) |
| 2.3 | 4.6 | GO:0010908 | regulation of heparan sulfate proteoglycan biosynthetic process(GO:0010908) positive regulation of heparan sulfate proteoglycan biosynthetic process(GO:0010909) |
| 2.3 | 6.8 | GO:0061357 | positive regulation of Wnt protein secretion(GO:0061357) |
| 2.3 | 9.0 | GO:0036371 | protein localization to M-band(GO:0036309) protein localization to T-tubule(GO:0036371) |
| 2.2 | 20.2 | GO:0031580 | membrane raft polarization(GO:0001766) membrane raft distribution(GO:0031580) |
| 2.1 | 8.5 | GO:0002343 | peripheral B cell selection(GO:0002343) B cell affinity maturation(GO:0002344) |
| 2.1 | 6.2 | GO:0021874 | Wnt signaling pathway involved in forebrain neuroblast division(GO:0021874) external genitalia morphogenesis(GO:0035261) canonical Wnt signaling pathway involved in positive regulation of cardiac outflow tract cell proliferation(GO:0061324) planar cell polarity pathway involved in outflow tract morphogenesis(GO:0061347) planar cell polarity pathway involved in ventricular septum morphogenesis(GO:0061348) planar cell polarity pathway involved in cardiac right atrium morphogenesis(GO:0061349) planar cell polarity pathway involved in cardiac muscle tissue morphogenesis(GO:0061350) planar cell polarity pathway involved in pericardium morphogenesis(GO:0061354) regulation of cardiac chamber morphogenesis(GO:1901219) negative regulation of cardiac chamber morphogenesis(GO:1901220) regulation of cell proliferation involved in outflow tract morphogenesis(GO:1901963) regulation of cardiac ventricle development(GO:1904412) |
| 2.0 | 6.1 | GO:0070175 | positive regulation of enamel mineralization(GO:0070175) |
| 2.0 | 6.1 | GO:0060086 | circadian temperature homeostasis(GO:0060086) |
| 2.0 | 6.1 | GO:0002644 | negative regulation of tolerance induction(GO:0002644) |
| 2.0 | 13.7 | GO:0034351 | negative regulation of glial cell apoptotic process(GO:0034351) |
| 1.9 | 7.6 | GO:0046985 | positive regulation of hemoglobin biosynthetic process(GO:0046985) |
| 1.9 | 5.7 | GO:0061146 | Peyer's patch morphogenesis(GO:0061146) |
| 1.9 | 7.4 | GO:1900377 | negative regulation of melanin biosynthetic process(GO:0048022) negative regulation of secondary metabolite biosynthetic process(GO:1900377) |
| 1.8 | 17.9 | GO:0071985 | multivesicular body sorting pathway(GO:0071985) |
| 1.8 | 8.9 | GO:1904401 | cellular response to Thyroid stimulating hormone(GO:1904401) |
| 1.8 | 12.3 | GO:0097211 | response to gonadotropin-releasing hormone(GO:0097210) cellular response to gonadotropin-releasing hormone(GO:0097211) |
| 1.7 | 6.8 | GO:0043490 | malate-aspartate shuttle(GO:0043490) |
| 1.7 | 21.9 | GO:0002361 | CD4-positive, CD25-positive, alpha-beta regulatory T cell differentiation(GO:0002361) |
| 1.7 | 5.0 | GO:2000538 | regulation of cGMP-mediated signaling(GO:0010752) regulation of B cell chemotaxis(GO:2000537) positive regulation of B cell chemotaxis(GO:2000538) |
| 1.7 | 6.7 | GO:0032747 | positive regulation of interleukin-23 production(GO:0032747) |
| 1.6 | 4.9 | GO:0046340 | diacylglycerol catabolic process(GO:0046340) |
| 1.6 | 4.8 | GO:0034146 | toll-like receptor 5 signaling pathway(GO:0034146) chemokine (C-X-C motif) ligand 1 production(GO:0072566) regulation of chemokine (C-X-C motif) ligand 1 production(GO:2000338) |
| 1.6 | 20.4 | GO:0051764 | actin crosslink formation(GO:0051764) |
| 1.6 | 6.3 | GO:0035720 | intraciliary anterograde transport(GO:0035720) |
| 1.6 | 18.7 | GO:0007175 | negative regulation of epidermal growth factor-activated receptor activity(GO:0007175) |
| 1.6 | 4.7 | GO:0002296 | T-helper 1 cell lineage commitment(GO:0002296) |
| 1.5 | 45.7 | GO:0035455 | response to interferon-alpha(GO:0035455) |
| 1.5 | 9.1 | GO:0010961 | cellular magnesium ion homeostasis(GO:0010961) |
| 1.5 | 16.2 | GO:0033275 | muscle filament sliding(GO:0030049) actin-myosin filament sliding(GO:0033275) |
| 1.4 | 5.6 | GO:0007352 | zygotic specification of dorsal/ventral axis(GO:0007352) positive regulation of nodal signaling pathway involved in determination of lateral mesoderm left/right asymmetry(GO:1900224) |
| 1.4 | 6.9 | GO:0002036 | regulation of L-glutamate transport(GO:0002036) |
| 1.4 | 13.8 | GO:0048251 | elastic fiber assembly(GO:0048251) |
| 1.3 | 4.0 | GO:0036066 | protein O-linked fucosylation(GO:0036066) |
| 1.3 | 5.2 | GO:0060744 | thelarche(GO:0042695) mammary gland branching involved in thelarche(GO:0060744) |
| 1.3 | 18.0 | GO:0045217 | cell-cell junction maintenance(GO:0045217) |
| 1.3 | 11.4 | GO:1900113 | negative regulation of histone H3-K9 trimethylation(GO:1900113) |
| 1.3 | 3.8 | GO:0021997 | neural plate axis specification(GO:0021997) |
| 1.2 | 10.0 | GO:0070995 | NADPH oxidation(GO:0070995) |
| 1.2 | 7.4 | GO:0033564 | anterior/posterior axon guidance(GO:0033564) |
| 1.2 | 18.1 | GO:0000083 | regulation of transcription involved in G1/S transition of mitotic cell cycle(GO:0000083) |
| 1.2 | 10.8 | GO:0051534 | negative regulation of NFAT protein import into nucleus(GO:0051534) |
| 1.2 | 8.3 | GO:0099525 | positive regulation of synaptic vesicle priming(GO:0010808) presynaptic dense core granule exocytosis(GO:0099525) |
| 1.2 | 9.4 | GO:0051231 | spindle elongation(GO:0051231) |
| 1.2 | 8.1 | GO:0071464 | cellular response to hydrostatic pressure(GO:0071464) |
| 1.1 | 3.4 | GO:0006436 | tryptophanyl-tRNA aminoacylation(GO:0006436) |
| 1.1 | 21.1 | GO:0006907 | pinocytosis(GO:0006907) |
| 1.1 | 5.5 | GO:0010991 | negative regulation of SMAD protein complex assembly(GO:0010991) |
| 1.1 | 3.3 | GO:0006543 | glutamine catabolic process(GO:0006543) |
| 1.1 | 8.8 | GO:2000096 | positive regulation of Wnt signaling pathway, planar cell polarity pathway(GO:2000096) |
| 1.1 | 7.7 | GO:0016259 | selenocysteine metabolic process(GO:0016259) |
| 1.1 | 10.5 | GO:0002934 | desmosome organization(GO:0002934) |
| 1.0 | 5.2 | GO:0010820 | positive regulation of T cell chemotaxis(GO:0010820) |
| 1.0 | 4.1 | GO:0002378 | immunoglobulin biosynthetic process(GO:0002378) |
| 1.0 | 3.1 | GO:1904211 | membrane protein proteolysis involved in retrograde protein transport, ER to cytosol(GO:1904211) |
| 1.0 | 7.2 | GO:0043031 | negative regulation of macrophage activation(GO:0043031) |
| 1.0 | 6.2 | GO:0060315 | negative regulation of ryanodine-sensitive calcium-release channel activity(GO:0060315) |
| 1.0 | 6.1 | GO:1902951 | negative regulation of dendritic spine maintenance(GO:1902951) |
| 1.0 | 9.2 | GO:0030644 | cellular chloride ion homeostasis(GO:0030644) |
| 1.0 | 6.1 | GO:0032252 | secretory granule localization(GO:0032252) |
| 1.0 | 5.0 | GO:0035627 | ceramide transport(GO:0035627) |
| 1.0 | 6.9 | GO:0090037 | positive regulation of protein kinase C signaling(GO:0090037) |
| 1.0 | 3.9 | GO:0010510 | regulation of acetyl-CoA biosynthetic process from pyruvate(GO:0010510) |
| 1.0 | 21.2 | GO:0070208 | protein heterotrimerization(GO:0070208) |
| 1.0 | 8.6 | GO:0008228 | opsonization(GO:0008228) |
| 0.9 | 11.0 | GO:0001778 | plasma membrane repair(GO:0001778) |
| 0.9 | 8.0 | GO:0010459 | negative regulation of heart rate(GO:0010459) |
| 0.9 | 4.4 | GO:0010641 | positive regulation of platelet-derived growth factor receptor signaling pathway(GO:0010641) |
| 0.9 | 2.6 | GO:0035105 | sterol regulatory element binding protein import into nucleus(GO:0035105) negative regulation of adipose tissue development(GO:1904178) |
| 0.8 | 14.8 | GO:0046325 | negative regulation of glucose import(GO:0046325) |
| 0.8 | 4.1 | GO:0045588 | positive regulation of gamma-delta T cell differentiation(GO:0045588) positive regulation of gamma-delta T cell activation(GO:0046645) |
| 0.8 | 4.7 | GO:1903361 | protein localization to basolateral plasma membrane(GO:1903361) |
| 0.8 | 8.5 | GO:0046598 | positive regulation of viral entry into host cell(GO:0046598) |
| 0.8 | 4.6 | GO:0071233 | cellular response to leucine(GO:0071233) |
| 0.8 | 3.0 | GO:0045347 | negative regulation of MHC class II biosynthetic process(GO:0045347) |
| 0.7 | 6.0 | GO:0022417 | protein maturation by protein folding(GO:0022417) |
| 0.7 | 12.5 | GO:0014049 | positive regulation of glutamate secretion(GO:0014049) |
| 0.7 | 11.0 | GO:0031987 | locomotion involved in locomotory behavior(GO:0031987) |
| 0.7 | 5.1 | GO:0002248 | connective tissue replacement involved in inflammatory response wound healing(GO:0002248) |
| 0.7 | 8.8 | GO:0010839 | negative regulation of keratinocyte proliferation(GO:0010839) |
| 0.7 | 2.9 | GO:1904431 | positive regulation of t-circle formation(GO:1904431) |
| 0.7 | 2.8 | GO:0070318 | positive regulation of G0 to G1 transition(GO:0070318) |
| 0.7 | 11.2 | GO:0019934 | cGMP-mediated signaling(GO:0019934) |
| 0.7 | 2.1 | GO:2001045 | negative regulation of integrin-mediated signaling pathway(GO:2001045) |
| 0.7 | 2.8 | GO:1904636 | response to ionomycin(GO:1904636) cellular response to ionomycin(GO:1904637) |
| 0.7 | 2.1 | GO:0052151 | induction of programmed cell death(GO:0012502) positive regulation of apoptotic process in other organism(GO:0044533) positive regulation by symbiont of host programmed cell death(GO:0052042) positive regulation by symbiont of host apoptotic process(GO:0052151) positive regulation by organism of programmed cell death in other organism involved in symbiotic interaction(GO:0052330) positive regulation by organism of apoptotic process in other organism involved in symbiotic interaction(GO:0052501) positive regulation of apoptotic process by virus(GO:0060139) |
| 0.7 | 11.6 | GO:0031424 | keratinization(GO:0031424) |
| 0.7 | 2.0 | GO:0032304 | negative regulation of icosanoid secretion(GO:0032304) response to interleukin-15(GO:0070672) |
| 0.7 | 2.0 | GO:0001928 | regulation of exocyst assembly(GO:0001928) |
| 0.7 | 1.3 | GO:0032849 | positive regulation of cellular pH reduction(GO:0032849) |
| 0.7 | 3.9 | GO:0015860 | purine nucleoside transmembrane transport(GO:0015860) |
| 0.7 | 3.9 | GO:0030950 | establishment or maintenance of actin cytoskeleton polarity(GO:0030950) |
| 0.6 | 14.7 | GO:0031954 | positive regulation of protein autophosphorylation(GO:0031954) |
| 0.6 | 8.2 | GO:0009396 | folic acid-containing compound biosynthetic process(GO:0009396) |
| 0.6 | 3.7 | GO:0032264 | IMP salvage(GO:0032264) |
| 0.6 | 16.4 | GO:0010842 | retina layer formation(GO:0010842) |
| 0.6 | 2.9 | GO:0003344 | pericardium morphogenesis(GO:0003344) |
| 0.6 | 25.7 | GO:0002474 | antigen processing and presentation of peptide antigen via MHC class I(GO:0002474) |
| 0.6 | 5.7 | GO:0060340 | positive regulation of type I interferon-mediated signaling pathway(GO:0060340) |
| 0.6 | 2.8 | GO:1990823 | response to leukemia inhibitory factor(GO:1990823) cellular response to leukemia inhibitory factor(GO:1990830) |
| 0.5 | 5.9 | GO:0032367 | intracellular lipid transport(GO:0032365) intracellular sterol transport(GO:0032366) intracellular cholesterol transport(GO:0032367) |
| 0.5 | 2.2 | GO:0009597 | detection of virus(GO:0009597) |
| 0.5 | 10.2 | GO:0050434 | positive regulation of viral transcription(GO:0050434) |
| 0.5 | 2.1 | GO:0090370 | negative regulation of cholesterol efflux(GO:0090370) |
| 0.5 | 8.8 | GO:0033622 | integrin activation(GO:0033622) |
| 0.5 | 2.0 | GO:0043137 | DNA replication, removal of RNA primer(GO:0043137) |
| 0.5 | 12.6 | GO:0030225 | macrophage differentiation(GO:0030225) |
| 0.5 | 3.9 | GO:0060763 | mammary duct terminal end bud growth(GO:0060763) |
| 0.5 | 2.9 | GO:0090367 | negative regulation of mRNA modification(GO:0090367) |
| 0.5 | 5.9 | GO:1990118 | sodium ion import across plasma membrane(GO:0098719) sodium ion import into cell(GO:1990118) |
| 0.4 | 6.2 | GO:0043162 | ubiquitin-dependent protein catabolic process via the multivesicular body sorting pathway(GO:0043162) |
| 0.4 | 3.5 | GO:0098903 | regulation of membrane repolarization during action potential(GO:0098903) |
| 0.4 | 2.6 | GO:1904044 | response to aldosterone(GO:1904044) |
| 0.4 | 4.3 | GO:0060158 | phospholipase C-activating dopamine receptor signaling pathway(GO:0060158) |
| 0.4 | 5.6 | GO:0031507 | heterochromatin assembly(GO:0031507) |
| 0.4 | 14.1 | GO:0019433 | triglyceride catabolic process(GO:0019433) |
| 0.4 | 1.2 | GO:0090172 | microtubule cytoskeleton organization involved in homologous chromosome segregation(GO:0090172) |
| 0.4 | 3.3 | GO:0046116 | queuosine biosynthetic process(GO:0008616) queuosine metabolic process(GO:0046116) |
| 0.4 | 10.2 | GO:0035066 | positive regulation of histone acetylation(GO:0035066) |
| 0.4 | 3.2 | GO:0000395 | mRNA 5'-splice site recognition(GO:0000395) |
| 0.4 | 2.3 | GO:0030853 | negative regulation of granulocyte differentiation(GO:0030853) |
| 0.4 | 6.2 | GO:0032482 | Rab protein signal transduction(GO:0032482) |
| 0.4 | 5.3 | GO:0042118 | endothelial cell activation(GO:0042118) |
| 0.4 | 4.5 | GO:0035589 | G-protein coupled purinergic nucleotide receptor signaling pathway(GO:0035589) |
| 0.4 | 0.4 | GO:0034137 | positive regulation of toll-like receptor 2 signaling pathway(GO:0034137) |
| 0.4 | 45.1 | GO:0042157 | lipoprotein metabolic process(GO:0042157) |
| 0.4 | 3.5 | GO:1902231 | positive regulation of intrinsic apoptotic signaling pathway in response to DNA damage(GO:1902231) |
| 0.3 | 5.2 | GO:0046519 | sphingoid metabolic process(GO:0046519) |
| 0.3 | 3.5 | GO:0071688 | striated muscle myosin thick filament assembly(GO:0071688) |
| 0.3 | 5.5 | GO:0032988 | ribonucleoprotein complex disassembly(GO:0032988) |
| 0.3 | 15.0 | GO:0030239 | myofibril assembly(GO:0030239) |
| 0.3 | 1.4 | GO:0090110 | cargo loading into COPII-coated vesicle(GO:0090110) |
| 0.3 | 2.0 | GO:0061343 | cell adhesion involved in heart morphogenesis(GO:0061343) |
| 0.3 | 17.4 | GO:0035904 | aorta development(GO:0035904) |
| 0.3 | 1.0 | GO:0043474 | eye pigment metabolic process(GO:0042441) pigment metabolic process involved in developmental pigmentation(GO:0043324) pigment metabolic process involved in pigmentation(GO:0043474) rhodopsin metabolic process(GO:0046154) |
| 0.3 | 1.3 | GO:1900041 | negative regulation of interleukin-2 secretion(GO:1900041) |
| 0.3 | 4.3 | GO:0021707 | cerebellar granular layer formation(GO:0021684) cerebellar granule cell differentiation(GO:0021707) prepulse inhibition(GO:0060134) |
| 0.3 | 10.9 | GO:0009303 | rRNA transcription(GO:0009303) |
| 0.3 | 5.1 | GO:0010591 | regulation of lamellipodium assembly(GO:0010591) |
| 0.3 | 1.9 | GO:0003383 | apical constriction(GO:0003383) negative regulation of myosin-light-chain-phosphatase activity(GO:0035509) negative regulation of bicellular tight junction assembly(GO:1903347) |
| 0.3 | 6.9 | GO:0097503 | sialylation(GO:0097503) |
| 0.3 | 7.2 | GO:0001522 | pseudouridine synthesis(GO:0001522) |
| 0.3 | 1.2 | GO:2000327 | positive regulation of ligand-dependent nuclear receptor transcription coactivator activity(GO:2000327) |
| 0.3 | 1.2 | GO:0015793 | glycerol transport(GO:0015793) |
| 0.3 | 4.9 | GO:0009263 | deoxyribonucleotide biosynthetic process(GO:0009263) |
| 0.3 | 3.3 | GO:0031274 | regulation of pseudopodium assembly(GO:0031272) positive regulation of pseudopodium assembly(GO:0031274) |
| 0.3 | 4.7 | GO:0022027 | interkinetic nuclear migration(GO:0022027) |
| 0.3 | 4.9 | GO:0033004 | negative regulation of mast cell activation(GO:0033004) |
| 0.3 | 5.4 | GO:0050650 | chondroitin sulfate proteoglycan biosynthetic process(GO:0050650) |
| 0.3 | 2.2 | GO:0033127 | regulation of histone phosphorylation(GO:0033127) |
| 0.3 | 2.8 | GO:0032808 | lacrimal gland development(GO:0032808) |
| 0.3 | 16.8 | GO:0032570 | response to progesterone(GO:0032570) |
| 0.3 | 10.8 | GO:0006904 | vesicle docking involved in exocytosis(GO:0006904) |
| 0.3 | 2.9 | GO:0030259 | lipid glycosylation(GO:0030259) |
| 0.3 | 1.3 | GO:0045297 | mating plug formation(GO:0042628) post-mating behavior(GO:0045297) |
| 0.3 | 0.5 | GO:0021530 | spinal cord oligodendrocyte cell differentiation(GO:0021529) spinal cord oligodendrocyte cell fate specification(GO:0021530) |
| 0.2 | 0.7 | GO:0016476 | regulation of embryonic cell shape(GO:0016476) |
| 0.2 | 8.9 | GO:0007339 | binding of sperm to zona pellucida(GO:0007339) |
| 0.2 | 4.8 | GO:0060445 | branching involved in salivary gland morphogenesis(GO:0060445) |
| 0.2 | 0.2 | GO:0034436 | glycoprotein transport(GO:0034436) |
| 0.2 | 3.7 | GO:0048485 | sympathetic nervous system development(GO:0048485) |
| 0.2 | 2.7 | GO:0042448 | progesterone metabolic process(GO:0042448) |
| 0.2 | 38.2 | GO:0002244 | hematopoietic progenitor cell differentiation(GO:0002244) |
| 0.2 | 2.4 | GO:0061088 | sequestering of zinc ion(GO:0032119) regulation of sequestering of zinc ion(GO:0061088) |
| 0.2 | 0.4 | GO:0061643 | chemorepulsion of axon(GO:0061643) |
| 0.2 | 3.4 | GO:0035493 | SNARE complex assembly(GO:0035493) |
| 0.2 | 2.6 | GO:0045943 | positive regulation of transcription from RNA polymerase I promoter(GO:0045943) |
| 0.2 | 2.6 | GO:0034453 | microtubule anchoring(GO:0034453) |
| 0.2 | 3.2 | GO:0033147 | negative regulation of intracellular estrogen receptor signaling pathway(GO:0033147) |
| 0.2 | 4.7 | GO:0051560 | mitochondrial calcium ion homeostasis(GO:0051560) |
| 0.2 | 0.6 | GO:0002148 | hypochlorous acid metabolic process(GO:0002148) hypochlorous acid biosynthetic process(GO:0002149) |
| 0.2 | 8.0 | GO:0000462 | maturation of SSU-rRNA from tricistronic rRNA transcript (SSU-rRNA, 5.8S rRNA, LSU-rRNA)(GO:0000462) |
| 0.2 | 13.8 | GO:0006081 | cellular aldehyde metabolic process(GO:0006081) |
| 0.2 | 8.7 | GO:0048662 | negative regulation of smooth muscle cell proliferation(GO:0048662) |
| 0.2 | 2.6 | GO:0071257 | cellular response to electrical stimulus(GO:0071257) |
| 0.2 | 9.8 | GO:0010765 | positive regulation of sodium ion transport(GO:0010765) |
| 0.2 | 0.7 | GO:0034184 | positive regulation of maintenance of mitotic sister chromatid cohesion(GO:0034184) |
| 0.2 | 3.3 | GO:0006607 | NLS-bearing protein import into nucleus(GO:0006607) |
| 0.2 | 3.4 | GO:0010800 | positive regulation of peptidyl-threonine phosphorylation(GO:0010800) |
| 0.2 | 4.8 | GO:0000027 | ribosomal large subunit assembly(GO:0000027) |
| 0.2 | 11.2 | GO:0098869 | cellular oxidant detoxification(GO:0098869) |
| 0.2 | 7.1 | GO:0002028 | regulation of sodium ion transport(GO:0002028) |
| 0.2 | 1.8 | GO:0048642 | negative regulation of skeletal muscle tissue development(GO:0048642) |
| 0.2 | 1.9 | GO:0034498 | early endosome to Golgi transport(GO:0034498) |
| 0.2 | 4.4 | GO:1900026 | positive regulation of substrate adhesion-dependent cell spreading(GO:1900026) |
| 0.2 | 2.0 | GO:0016973 | poly(A)+ mRNA export from nucleus(GO:0016973) |
| 0.2 | 2.8 | GO:0006336 | DNA replication-independent nucleosome assembly(GO:0006336) |
| 0.2 | 1.1 | GO:0070493 | thrombin receptor signaling pathway(GO:0070493) |
| 0.2 | 11.4 | GO:0001824 | blastocyst development(GO:0001824) |
| 0.1 | 3.4 | GO:0032012 | regulation of ARF protein signal transduction(GO:0032012) |
| 0.1 | 4.3 | GO:0035458 | cellular response to interferon-beta(GO:0035458) |
| 0.1 | 3.3 | GO:0048247 | lymphocyte chemotaxis(GO:0048247) |
| 0.1 | 1.2 | GO:0097531 | mast cell migration(GO:0097531) |
| 0.1 | 0.6 | GO:0043418 | S-adenosylmethionine cycle(GO:0033353) homocysteine catabolic process(GO:0043418) folic acid metabolic process(GO:0046655) |
| 0.1 | 0.5 | GO:0033034 | positive regulation of neutrophil apoptotic process(GO:0033031) positive regulation of myeloid cell apoptotic process(GO:0033034) |
| 0.1 | 2.8 | GO:0097502 | mannosylation(GO:0097502) |
| 0.1 | 1.2 | GO:0010046 | response to mycotoxin(GO:0010046) |
| 0.1 | 4.3 | GO:0070206 | protein trimerization(GO:0070206) |
| 0.1 | 2.4 | GO:0006691 | leukotriene metabolic process(GO:0006691) |
| 0.1 | 1.9 | GO:0060294 | cilium movement involved in cell motility(GO:0060294) |
| 0.1 | 13.2 | GO:0035023 | regulation of Rho protein signal transduction(GO:0035023) |
| 0.1 | 7.6 | GO:0010811 | positive regulation of cell-substrate adhesion(GO:0010811) |
| 0.1 | 4.6 | GO:0032465 | regulation of cytokinesis(GO:0032465) |
| 0.1 | 3.0 | GO:0070527 | platelet aggregation(GO:0070527) |
| 0.1 | 6.3 | GO:0035914 | skeletal muscle cell differentiation(GO:0035914) |
| 0.1 | 3.4 | GO:0043550 | regulation of lipid kinase activity(GO:0043550) |
| 0.1 | 7.3 | GO:0050909 | sensory perception of taste(GO:0050909) |
| 0.1 | 1.1 | GO:0072678 | T cell migration(GO:0072678) |
| 0.1 | 4.0 | GO:0007062 | sister chromatid cohesion(GO:0007062) |
| 0.1 | 1.2 | GO:0006071 | glycerol metabolic process(GO:0006071) |
| 0.1 | 1.7 | GO:0032292 | myelination in peripheral nervous system(GO:0022011) peripheral nervous system axon ensheathment(GO:0032292) |
| 0.1 | 2.5 | GO:0090503 | RNA phosphodiester bond hydrolysis, exonucleolytic(GO:0090503) |
| 0.1 | 5.4 | GO:0050852 | T cell receptor signaling pathway(GO:0050852) |
| 0.1 | 0.5 | GO:0071494 | cellular response to UV-C(GO:0071494) |
| 0.1 | 1.9 | GO:0043303 | mast cell activation involved in immune response(GO:0002279) mast cell degranulation(GO:0043303) |
| 0.1 | 1.0 | GO:0001867 | complement activation, lectin pathway(GO:0001867) |
| 0.1 | 28.6 | GO:0043547 | positive regulation of GTPase activity(GO:0043547) |
| 0.1 | 3.9 | GO:0007157 | heterophilic cell-cell adhesion via plasma membrane cell adhesion molecules(GO:0007157) |
| 0.1 | 3.7 | GO:0031110 | regulation of microtubule polymerization or depolymerization(GO:0031110) |
| 0.1 | 0.2 | GO:0052203 | modulation of catalytic activity in other organism involved in symbiotic interaction(GO:0052203) modulation by host of symbiont catalytic activity(GO:0052422) |
| 0.1 | 1.7 | GO:0097352 | autophagosome maturation(GO:0097352) |
| 0.1 | 4.8 | GO:0090090 | negative regulation of canonical Wnt signaling pathway(GO:0090090) |
| 0.1 | 0.4 | GO:0002517 | T cell tolerance induction(GO:0002517) |
| 0.1 | 6.3 | GO:0001578 | microtubule bundle formation(GO:0001578) |
| 0.1 | 28.0 | GO:0007169 | transmembrane receptor protein tyrosine kinase signaling pathway(GO:0007169) |
| 0.1 | 0.4 | GO:0034214 | protein hexamerization(GO:0034214) |
| 0.1 | 2.1 | GO:0015991 | ATP hydrolysis coupled proton transport(GO:0015991) |
| 0.1 | 0.9 | GO:0009083 | branched-chain amino acid catabolic process(GO:0009083) |
| 0.1 | 2.6 | GO:0046834 | lipid phosphorylation(GO:0046834) |
| 0.1 | 2.9 | GO:0043473 | pigmentation(GO:0043473) |
| 0.1 | 1.7 | GO:0000387 | spliceosomal snRNP assembly(GO:0000387) |
| 0.0 | 2.0 | GO:0010501 | RNA secondary structure unwinding(GO:0010501) |
| 0.0 | 0.1 | GO:0060501 | positive regulation of epithelial cell proliferation involved in lung morphogenesis(GO:0060501) |
| 0.0 | 0.1 | GO:0097680 | double-strand break repair via classical nonhomologous end joining(GO:0097680) |
| 0.0 | 0.1 | GO:0014028 | notochord formation(GO:0014028) |
| 0.0 | 3.9 | GO:0007156 | homophilic cell adhesion via plasma membrane adhesion molecules(GO:0007156) |
| 0.0 | 4.7 | GO:0043062 | extracellular matrix organization(GO:0030198) extracellular structure organization(GO:0043062) |
| 0.0 | 1.9 | GO:0043491 | protein kinase B signaling(GO:0043491) |
| 0.0 | 0.9 | GO:0070098 | chemokine-mediated signaling pathway(GO:0070098) |
| 0.0 | 0.6 | GO:0021952 | central nervous system projection neuron axonogenesis(GO:0021952) |
| 0.0 | 0.9 | GO:0060612 | adipose tissue development(GO:0060612) |
| 0.0 | 1.1 | GO:0000413 | protein peptidyl-prolyl isomerization(GO:0000413) |
| 0.0 | 0.6 | GO:0032456 | endocytic recycling(GO:0032456) |
| 0.0 | 2.5 | GO:0043123 | positive regulation of I-kappaB kinase/NF-kappaB signaling(GO:0043123) |
| 0.0 | 0.1 | GO:0018243 | protein O-linked glycosylation via serine(GO:0018242) protein O-linked glycosylation via threonine(GO:0018243) |
| 0.0 | 0.0 | GO:0071603 | endothelial cell-cell adhesion(GO:0071603) |
| 0.0 | 1.4 | GO:0019722 | calcium-mediated signaling(GO:0019722) |
| 0.0 | 1.7 | GO:0006364 | rRNA processing(GO:0006364) |
| 0.0 | 0.4 | GO:0032094 | response to food(GO:0032094) |
| 0.0 | 0.4 | GO:0071549 | cellular response to dexamethasone stimulus(GO:0071549) |
| 0.0 | 0.1 | GO:1901407 | regulation of phosphorylation of RNA polymerase II C-terminal domain(GO:1901407) positive regulation of phosphorylation of RNA polymerase II C-terminal domain(GO:1901409) |
| 0.0 | 0.2 | GO:0008206 | bile acid metabolic process(GO:0008206) |
Gene overrepresentation in cellular component category:
| Log-likelihood per target | Total log-likelihood | Term | Description |
|---|---|---|---|
| 15.2 | 45.7 | GO:0097232 | lamellar body membrane(GO:0097232) alveolar lamellar body membrane(GO:0097233) |
| 4.7 | 14.0 | GO:1990826 | nucleoplasmic periphery of the nuclear pore complex(GO:1990826) |
| 4.2 | 16.7 | GO:0005588 | collagen type V trimer(GO:0005588) |
| 2.7 | 27.2 | GO:0036056 | filtration diaphragm(GO:0036056) slit diaphragm(GO:0036057) |
| 2.4 | 7.2 | GO:0071942 | XPC complex(GO:0071942) |
| 1.9 | 26.1 | GO:0032982 | myosin filament(GO:0032982) |
| 1.8 | 9.2 | GO:0030485 | smooth muscle contractile fiber(GO:0030485) |
| 1.7 | 6.9 | GO:0071008 | U2-type post-mRNA release spliceosomal complex(GO:0071008) |
| 1.5 | 6.2 | GO:1990851 | Wnt-Frizzled-LRP5/6 complex(GO:1990851) |
| 1.5 | 4.6 | GO:1990907 | beta-catenin-TCF complex(GO:1990907) |
| 1.5 | 24.2 | GO:0042612 | MHC class I protein complex(GO:0042612) |
| 1.4 | 5.6 | GO:0071144 | SMAD2-SMAD3 protein complex(GO:0071144) |
| 1.2 | 4.9 | GO:0005971 | ribonucleoside-diphosphate reductase complex(GO:0005971) |
| 1.2 | 6.0 | GO:0034751 | aryl hydrocarbon receptor complex(GO:0034751) |
| 1.2 | 66.5 | GO:0009925 | basal plasma membrane(GO:0009925) |
| 1.2 | 3.5 | GO:0032937 | SREBP-SCAP-Insig complex(GO:0032937) |
| 1.1 | 3.4 | GO:0035577 | azurophil granule membrane(GO:0035577) tertiary granule membrane(GO:0070821) |
| 1.1 | 19.7 | GO:0031362 | anchored component of external side of plasma membrane(GO:0031362) |
| 1.1 | 22.3 | GO:0044292 | dendrite terminus(GO:0044292) |
| 1.0 | 8.3 | GO:0044305 | calyx of Held(GO:0044305) |
| 1.0 | 2.9 | GO:0033557 | Slx1-Slx4 complex(GO:0033557) |
| 0.9 | 3.5 | GO:0005859 | muscle myosin complex(GO:0005859) |
| 0.8 | 5.0 | GO:0097209 | epidermal lamellar body(GO:0097209) |
| 0.8 | 16.5 | GO:0005614 | interstitial matrix(GO:0005614) |
| 0.8 | 23.7 | GO:0046658 | anchored component of plasma membrane(GO:0046658) |
| 0.8 | 2.4 | GO:0071006 | U2-type catalytic step 1 spliceosome(GO:0071006) |
| 0.8 | 22.7 | GO:0001891 | phagocytic cup(GO:0001891) |
| 0.7 | 16.2 | GO:0030057 | desmosome(GO:0030057) |
| 0.7 | 8.4 | GO:0005736 | DNA-directed RNA polymerase I complex(GO:0005736) |
| 0.7 | 6.2 | GO:0000813 | ESCRT I complex(GO:0000813) |
| 0.7 | 2.0 | GO:0005760 | gamma DNA polymerase complex(GO:0005760) |
| 0.6 | 1.9 | GO:0031230 | intrinsic component of cell outer membrane(GO:0031230) integral component of cell outer membrane(GO:0045203) |
| 0.6 | 5.6 | GO:0005677 | chromatin silencing complex(GO:0005677) |
| 0.6 | 6.2 | GO:0000974 | Prp19 complex(GO:0000974) |
| 0.6 | 3.5 | GO:0030896 | checkpoint clamp complex(GO:0030896) |
| 0.6 | 6.9 | GO:0035631 | CD40 receptor complex(GO:0035631) |
| 0.5 | 8.5 | GO:0042613 | MHC class II protein complex(GO:0042613) |
| 0.5 | 8.9 | GO:0042101 | T cell receptor complex(GO:0042101) |
| 0.5 | 6.3 | GO:0097542 | ciliary tip(GO:0097542) |
| 0.5 | 3.1 | GO:0098553 | integral component of cytoplasmic side of endoplasmic reticulum membrane(GO:0071458) integral component of lumenal side of endoplasmic reticulum membrane(GO:0071556) lumenal side of endoplasmic reticulum membrane(GO:0098553) |
| 0.5 | 3.4 | GO:0035032 | phosphatidylinositol 3-kinase complex, class III(GO:0035032) |
| 0.5 | 1.5 | GO:0033596 | TSC1-TSC2 complex(GO:0033596) |
| 0.5 | 12.9 | GO:0042629 | mast cell granule(GO:0042629) |
| 0.5 | 22.6 | GO:0031672 | A band(GO:0031672) |
| 0.5 | 33.8 | GO:0005581 | collagen trimer(GO:0005581) |
| 0.4 | 1.3 | GO:0020005 | symbiont-containing vacuole membrane(GO:0020005) |
| 0.4 | 14.0 | GO:0005921 | gap junction(GO:0005921) |
| 0.4 | 8.6 | GO:0031527 | filopodium membrane(GO:0031527) |
| 0.4 | 44.0 | GO:0005913 | cell-cell adherens junction(GO:0005913) |
| 0.4 | 21.7 | GO:0055038 | recycling endosome membrane(GO:0055038) |
| 0.4 | 28.9 | GO:0005811 | lipid particle(GO:0005811) |
| 0.4 | 2.8 | GO:0000808 | origin recognition complex(GO:0000808) nuclear origin of replication recognition complex(GO:0005664) |
| 0.4 | 5.2 | GO:0043196 | varicosity(GO:0043196) |
| 0.4 | 34.8 | GO:0005604 | basement membrane(GO:0005604) |
| 0.4 | 11.2 | GO:0044295 | axonal growth cone(GO:0044295) |
| 0.4 | 12.7 | GO:0005721 | pericentric heterochromatin(GO:0005721) |
| 0.4 | 15.8 | GO:0005834 | heterotrimeric G-protein complex(GO:0005834) |
| 0.4 | 3.5 | GO:1990454 | L-type voltage-gated calcium channel complex(GO:1990454) |
| 0.4 | 41.2 | GO:0005791 | rough endoplasmic reticulum(GO:0005791) |
| 0.4 | 27.1 | GO:0022627 | cytosolic small ribosomal subunit(GO:0022627) |
| 0.4 | 8.6 | GO:0043194 | axon initial segment(GO:0043194) |
| 0.4 | 9.4 | GO:0008074 | guanylate cyclase complex, soluble(GO:0008074) |
| 0.4 | 20.1 | GO:0016529 | sarcoplasmic reticulum(GO:0016529) |
| 0.4 | 12.3 | GO:0014704 | intercalated disc(GO:0014704) |
| 0.4 | 4.0 | GO:0042555 | MCM complex(GO:0042555) |
| 0.3 | 1.0 | GO:0042581 | specific granule(GO:0042581) |
| 0.3 | 2.6 | GO:0005638 | lamin filament(GO:0005638) |
| 0.3 | 18.5 | GO:0031225 | anchored component of membrane(GO:0031225) |
| 0.3 | 2.1 | GO:0097136 | Bcl-2 family protein complex(GO:0097136) |
| 0.3 | 26.3 | GO:0031234 | extrinsic component of cytoplasmic side of plasma membrane(GO:0031234) |
| 0.3 | 6.8 | GO:0005790 | smooth endoplasmic reticulum(GO:0005790) |
| 0.3 | 3.9 | GO:0031932 | TORC2 complex(GO:0031932) |
| 0.2 | 1.9 | GO:0032059 | bleb(GO:0032059) |
| 0.2 | 16.5 | GO:0005901 | caveola(GO:0005901) |
| 0.2 | 17.0 | GO:0032432 | actin filament bundle(GO:0032432) |
| 0.2 | 10.8 | GO:0030173 | integral component of Golgi membrane(GO:0030173) |
| 0.2 | 13.6 | GO:0031901 | early endosome membrane(GO:0031901) |
| 0.2 | 13.7 | GO:0005881 | cytoplasmic microtubule(GO:0005881) |
| 0.2 | 1.1 | GO:1990130 | Iml1 complex(GO:1990130) |
| 0.2 | 3.3 | GO:0042589 | zymogen granule membrane(GO:0042589) |
| 0.2 | 20.2 | GO:0030017 | sarcomere(GO:0030017) |
| 0.2 | 3.9 | GO:0019013 | viral nucleocapsid(GO:0019013) |
| 0.2 | 0.9 | GO:0005947 | mitochondrial alpha-ketoglutarate dehydrogenase complex(GO:0005947) |
| 0.2 | 7.0 | GO:0032587 | ruffle membrane(GO:0032587) |
| 0.2 | 0.6 | GO:1990745 | GARP complex(GO:0000938) EARP complex(GO:1990745) |
| 0.2 | 2.1 | GO:0033179 | proton-transporting V-type ATPase, V0 domain(GO:0033179) |
| 0.2 | 8.8 | GO:0008023 | transcription elongation factor complex(GO:0008023) |
| 0.2 | 2.3 | GO:1990124 | messenger ribonucleoprotein complex(GO:1990124) |
| 0.1 | 25.1 | GO:0045111 | intermediate filament cytoskeleton(GO:0045111) |
| 0.1 | 1.6 | GO:0042405 | nuclear inclusion body(GO:0042405) |
| 0.1 | 5.8 | GO:0032420 | stereocilium(GO:0032420) |
| 0.1 | 6.8 | GO:0015030 | Cajal body(GO:0015030) |
| 0.1 | 8.0 | GO:0005770 | late endosome(GO:0005770) |
| 0.1 | 40.5 | GO:0005925 | focal adhesion(GO:0005925) |
| 0.1 | 5.8 | GO:0016235 | aggresome(GO:0016235) |
| 0.1 | 2.1 | GO:0005868 | cytoplasmic dynein complex(GO:0005868) |
| 0.1 | 2.6 | GO:0097440 | apical dendrite(GO:0097440) |
| 0.1 | 6.6 | GO:0030118 | clathrin coat(GO:0030118) |
| 0.1 | 6.4 | GO:0042383 | sarcolemma(GO:0042383) |
| 0.1 | 10.2 | GO:0043195 | terminal bouton(GO:0043195) |
| 0.1 | 24.0 | GO:0009897 | external side of plasma membrane(GO:0009897) |
| 0.1 | 11.3 | GO:0030496 | midbody(GO:0030496) |
| 0.1 | 1.2 | GO:0045335 | phagocytic vesicle(GO:0045335) |
| 0.1 | 0.6 | GO:0005766 | primary lysosome(GO:0005766) azurophil granule(GO:0042582) |
| 0.1 | 2.9 | GO:0000307 | cyclin-dependent protein kinase holoenzyme complex(GO:0000307) |
| 0.1 | 27.6 | GO:0000790 | nuclear chromatin(GO:0000790) |
| 0.1 | 0.3 | GO:0035061 | interchromatin granule(GO:0035061) |
| 0.1 | 1.4 | GO:0005682 | U5 snRNP(GO:0005682) |
| 0.1 | 18.9 | GO:0005774 | vacuolar membrane(GO:0005774) |
| 0.1 | 2.9 | GO:0010494 | cytoplasmic stress granule(GO:0010494) |
| 0.1 | 4.2 | GO:0055037 | recycling endosome(GO:0055037) |
| 0.1 | 12.7 | GO:0005819 | spindle(GO:0005819) |
| 0.1 | 12.7 | GO:0005768 | endosome(GO:0005768) |
| 0.1 | 8.1 | GO:0005773 | vacuole(GO:0005773) |
| 0.1 | 31.6 | GO:0005789 | endoplasmic reticulum membrane(GO:0005789) |
| 0.1 | 18.7 | GO:0009986 | cell surface(GO:0009986) |
| 0.0 | 1.3 | GO:0005902 | microvillus(GO:0005902) |
| 0.0 | 0.2 | GO:0045179 | apical cortex(GO:0045179) |
| 0.0 | 2.1 | GO:0030027 | lamellipodium(GO:0030027) |
| 0.0 | 1.2 | GO:0031305 | intrinsic component of mitochondrial inner membrane(GO:0031304) integral component of mitochondrial inner membrane(GO:0031305) |
| 0.0 | 0.4 | GO:0031082 | BLOC complex(GO:0031082) |
| 0.0 | 2.3 | GO:0071013 | catalytic step 2 spliceosome(GO:0071013) |
| 0.0 | 0.1 | GO:0097524 | sperm plasma membrane(GO:0097524) |
| 0.0 | 0.6 | GO:0000178 | exosome (RNase complex)(GO:0000178) |
| 0.0 | 2.6 | GO:0036064 | ciliary basal body(GO:0036064) |
| 0.0 | 0.1 | GO:0043564 | Ku70:Ku80 complex(GO:0043564) |
| 0.0 | 1.3 | GO:0000775 | chromosome, centromeric region(GO:0000775) |
| 0.0 | 1.4 | GO:0045121 | membrane raft(GO:0045121) membrane microdomain(GO:0098857) |
Gene overrepresentation in molecular function category:
| Log-likelihood per target | Total log-likelihood | Term | Description |
|---|---|---|---|
| 15.0 | 75.0 | GO:0050785 | advanced glycation end-product receptor activity(GO:0050785) |
| 10.0 | 60.2 | GO:0035662 | Toll-like receptor 4 binding(GO:0035662) |
| 5.5 | 27.4 | GO:0019834 | phospholipase A2 inhibitor activity(GO:0019834) |
| 4.6 | 13.8 | GO:0018479 | benzaldehyde dehydrogenase (NAD+) activity(GO:0018479) |
| 3.9 | 11.7 | GO:0004096 | catalase activity(GO:0004096) |
| 3.4 | 13.7 | GO:0004699 | calcium-independent protein kinase C activity(GO:0004699) |
| 3.3 | 19.7 | GO:0035473 | lipase binding(GO:0035473) |
| 3.2 | 12.8 | GO:0003865 | 3-oxo-5-alpha-steroid 4-dehydrogenase activity(GO:0003865) cholestenone 5-alpha-reductase activity(GO:0047751) |
| 3.0 | 9.0 | GO:0031826 | type 2A serotonin receptor binding(GO:0031826) |
| 3.0 | 15.0 | GO:0051373 | FATZ binding(GO:0051373) |
| 2.9 | 72.2 | GO:0042288 | MHC class I protein binding(GO:0042288) |
| 2.9 | 14.4 | GO:1990932 | 5.8S rRNA binding(GO:1990932) |
| 2.8 | 13.9 | GO:0004854 | xanthine dehydrogenase activity(GO:0004854) oxidoreductase activity, acting on CH or CH2 groups, NAD or NADP as acceptor(GO:0016726) |
| 2.8 | 13.8 | GO:0004720 | protein-lysine 6-oxidase activity(GO:0004720) |
| 2.6 | 7.9 | GO:0071791 | chemokine (C-C motif) ligand 5 binding(GO:0071791) |
| 2.6 | 10.2 | GO:0042610 | CD8 receptor binding(GO:0042610) |
| 2.1 | 14.7 | GO:0071532 | ankyrin repeat binding(GO:0071532) |
| 2.1 | 8.2 | GO:0004487 | methylenetetrahydrofolate dehydrogenase (NAD+) activity(GO:0004487) |
| 1.9 | 45.6 | GO:0043395 | heparan sulfate proteoglycan binding(GO:0043395) |
| 1.8 | 17.5 | GO:0003810 | protein-glutamine gamma-glutamyltransferase activity(GO:0003810) |
| 1.7 | 6.9 | GO:0003836 | beta-galactoside (CMP) alpha-2,3-sialyltransferase activity(GO:0003836) |
| 1.7 | 20.2 | GO:0019911 | structural constituent of myelin sheath(GO:0019911) |
| 1.6 | 14.4 | GO:0019992 | diacylglycerol binding(GO:0019992) |
| 1.6 | 11.1 | GO:0033592 | RNA strand annealing activity(GO:0033592) |
| 1.6 | 23.8 | GO:0045295 | gamma-catenin binding(GO:0045295) |
| 1.5 | 6.2 | GO:0071936 | coreceptor activity involved in Wnt signaling pathway(GO:0071936) |
| 1.5 | 6.0 | GO:0036004 | GAF domain binding(GO:0036004) |
| 1.5 | 7.4 | GO:0005042 | netrin receptor activity(GO:0005042) |
| 1.5 | 3.0 | GO:0070051 | fibrinogen binding(GO:0070051) |
| 1.5 | 7.3 | GO:0030881 | beta-2-microglobulin binding(GO:0030881) |
| 1.4 | 5.8 | GO:0004045 | aminoacyl-tRNA hydrolase activity(GO:0004045) |
| 1.4 | 7.2 | GO:0032795 | heterotrimeric G-protein binding(GO:0032795) |
| 1.4 | 5.6 | GO:0030618 | transforming growth factor beta receptor, pathway-specific cytoplasmic mediator activity(GO:0030618) |
| 1.4 | 13.6 | GO:0004972 | NMDA glutamate receptor activity(GO:0004972) |
| 1.4 | 6.8 | GO:0005314 | high-affinity glutamate transmembrane transporter activity(GO:0005314) |
| 1.3 | 8.0 | GO:0031697 | beta-1 adrenergic receptor binding(GO:0031697) |
| 1.3 | 13.0 | GO:0016176 | superoxide-generating NADPH oxidase activator activity(GO:0016176) |
| 1.3 | 7.7 | GO:0003847 | 1-alkyl-2-acetylglycerophosphocholine esterase activity(GO:0003847) |
| 1.3 | 5.1 | GO:0004711 | ribosomal protein S6 kinase activity(GO:0004711) |
| 1.3 | 3.8 | GO:0005119 | smoothened binding(GO:0005119) |
| 1.3 | 6.3 | GO:0051864 | histone demethylase activity (H3-K36 specific)(GO:0051864) |
| 1.2 | 12.5 | GO:0031681 | G-protein beta-subunit binding(GO:0031681) |
| 1.2 | 4.9 | GO:0042134 | rRNA primary transcript binding(GO:0042134) |
| 1.2 | 16.8 | GO:0042813 | Wnt-activated receptor activity(GO:0042813) |
| 1.1 | 3.4 | GO:0004830 | tryptophan-tRNA ligase activity(GO:0004830) |
| 1.1 | 10.2 | GO:0030957 | Tat protein binding(GO:0030957) |
| 1.1 | 13.4 | GO:0031730 | CCR5 chemokine receptor binding(GO:0031730) |
| 1.1 | 3.3 | GO:0004359 | glutaminase activity(GO:0004359) |
| 1.1 | 13.2 | GO:0045499 | chemorepellent activity(GO:0045499) |
| 1.1 | 7.6 | GO:0030274 | LIM domain binding(GO:0030274) |
| 1.1 | 8.6 | GO:0070053 | thrombospondin receptor activity(GO:0070053) |
| 1.0 | 5.0 | GO:0034191 | apolipoprotein A-I receptor binding(GO:0034191) |
| 1.0 | 3.9 | GO:0004740 | pyruvate dehydrogenase (acetyl-transferring) kinase activity(GO:0004740) |
| 1.0 | 6.8 | GO:0031852 | mu-type opioid receptor binding(GO:0031852) |
| 0.9 | 3.7 | GO:0047623 | AMP deaminase activity(GO:0003876) adenosine-phosphate deaminase activity(GO:0047623) |
| 0.9 | 10.3 | GO:0004499 | N,N-dimethylaniline monooxygenase activity(GO:0004499) |
| 0.8 | 3.3 | GO:0004859 | phospholipase inhibitor activity(GO:0004859) |
| 0.8 | 5.0 | GO:0005113 | patched binding(GO:0005113) |
| 0.8 | 4.9 | GO:0016728 | ribonucleoside-diphosphate reductase activity, thioredoxin disulfide as acceptor(GO:0004748) oxidoreductase activity, acting on CH or CH2 groups, disulfide as acceptor(GO:0016728) ribonucleoside-diphosphate reductase activity(GO:0061731) |
| 0.8 | 19.3 | GO:0001968 | fibronectin binding(GO:0001968) |
| 0.8 | 8.5 | GO:1990405 | protein antigen binding(GO:1990405) |
| 0.8 | 22.5 | GO:0005520 | insulin-like growth factor binding(GO:0005520) |
| 0.7 | 4.5 | GO:0070728 | leucine binding(GO:0070728) |
| 0.7 | 8.9 | GO:0008191 | metalloendopeptidase inhibitor activity(GO:0008191) |
| 0.7 | 16.2 | GO:0000146 | microfilament motor activity(GO:0000146) |
| 0.7 | 4.9 | GO:0017108 | 5'-flap endonuclease activity(GO:0017108) |
| 0.7 | 6.2 | GO:0034713 | type I transforming growth factor beta receptor binding(GO:0034713) |
| 0.7 | 5.3 | GO:0005025 | transforming growth factor beta receptor activity, type I(GO:0005025) |
| 0.7 | 3.9 | GO:0032405 | MutLalpha complex binding(GO:0032405) MutSalpha complex binding(GO:0032407) adenyl deoxyribonucleotide binding(GO:0032558) |
| 0.7 | 3.9 | GO:1990226 | histone methyltransferase binding(GO:1990226) |
| 0.6 | 5.9 | GO:0015386 | potassium:proton antiporter activity(GO:0015386) |
| 0.6 | 9.4 | GO:0017017 | MAP kinase tyrosine/serine/threonine phosphatase activity(GO:0017017) |
| 0.6 | 8.7 | GO:0017160 | Ral GTPase binding(GO:0017160) |
| 0.6 | 10.7 | GO:0031005 | filamin binding(GO:0031005) |
| 0.5 | 1.1 | GO:0015057 | thrombin receptor activity(GO:0015057) |
| 0.5 | 5.2 | GO:0001135 | transcription factor activity, RNA polymerase II transcription factor recruiting(GO:0001135) |
| 0.5 | 2.6 | GO:0001729 | ceramide kinase activity(GO:0001729) |
| 0.5 | 3.1 | GO:0042500 | aspartic endopeptidase activity, intramembrane cleaving(GO:0042500) |
| 0.5 | 3.3 | GO:0035375 | zymogen binding(GO:0035375) |
| 0.5 | 7.2 | GO:0009982 | pseudouridine synthase activity(GO:0009982) |
| 0.5 | 31.3 | GO:0030971 | receptor tyrosine kinase binding(GO:0030971) |
| 0.5 | 2.3 | GO:0051033 | nucleic acid transmembrane transporter activity(GO:0051032) RNA transmembrane transporter activity(GO:0051033) |
| 0.4 | 6.6 | GO:0031683 | G-protein beta/gamma-subunit complex binding(GO:0031683) |
| 0.4 | 5.8 | GO:0001206 | transcriptional repressor activity, RNA polymerase II distal enhancer sequence-specific binding(GO:0001206) |
| 0.4 | 1.2 | GO:0019237 | centromeric DNA binding(GO:0019237) |
| 0.4 | 3.3 | GO:0008479 | queuine tRNA-ribosyltransferase activity(GO:0008479) |
| 0.4 | 1.2 | GO:0015254 | glycerol channel activity(GO:0015254) |
| 0.4 | 8.1 | GO:0005229 | intracellular calcium activated chloride channel activity(GO:0005229) |
| 0.4 | 2.0 | GO:0005315 | inorganic phosphate transmembrane transporter activity(GO:0005315) |
| 0.4 | 2.3 | GO:0035014 | phosphatidylinositol 3-kinase regulator activity(GO:0035014) |
| 0.4 | 4.2 | GO:0004653 | polypeptide N-acetylgalactosaminyltransferase activity(GO:0004653) |
| 0.4 | 4.5 | GO:0045028 | G-protein coupled nucleotide receptor activity(GO:0001608) G-protein coupled purinergic nucleotide receptor activity(GO:0045028) |
| 0.4 | 9.4 | GO:0004383 | guanylate cyclase activity(GO:0004383) |
| 0.4 | 16.9 | GO:0005044 | scavenger receptor activity(GO:0005044) |
| 0.4 | 2.9 | GO:1990247 | N6-methyladenosine-containing RNA binding(GO:1990247) |
| 0.4 | 4.3 | GO:0005234 | extracellular-glutamate-gated ion channel activity(GO:0005234) |
| 0.4 | 3.9 | GO:0005346 | adenine nucleotide transmembrane transporter activity(GO:0000295) purine ribonucleotide transmembrane transporter activity(GO:0005346) |
| 0.3 | 2.1 | GO:0072542 | protein phosphatase activator activity(GO:0072542) |
| 0.3 | 11.8 | GO:0008009 | chemokine activity(GO:0008009) |
| 0.3 | 9.9 | GO:0004693 | cyclin-dependent protein serine/threonine kinase activity(GO:0004693) |
| 0.3 | 4.7 | GO:0005092 | GDP-dissociation inhibitor activity(GO:0005092) |
| 0.3 | 1.3 | GO:0019002 | GMP binding(GO:0019002) |
| 0.3 | 6.9 | GO:0005031 | tumor necrosis factor-activated receptor activity(GO:0005031) death receptor activity(GO:0005035) |
| 0.3 | 22.3 | GO:0046332 | SMAD binding(GO:0046332) |
| 0.3 | 3.9 | GO:0070492 | oligosaccharide binding(GO:0070492) |
| 0.3 | 13.3 | GO:0005227 | calcium activated cation channel activity(GO:0005227) |
| 0.3 | 5.2 | GO:0023026 | MHC class II protein complex binding(GO:0023026) |
| 0.3 | 2.4 | GO:0017070 | U6 snRNA binding(GO:0017070) |
| 0.3 | 11.4 | GO:0001205 | transcriptional activator activity, RNA polymerase II distal enhancer sequence-specific binding(GO:0001205) |
| 0.3 | 8.8 | GO:0042605 | peptide antigen binding(GO:0042605) |
| 0.3 | 5.1 | GO:0032454 | histone demethylase activity (H3-K9 specific)(GO:0032454) |
| 0.3 | 2.8 | GO:0030346 | protein phosphatase 2B binding(GO:0030346) |
| 0.3 | 3.5 | GO:0097493 | muscle alpha-actinin binding(GO:0051371) structural molecule activity conferring elasticity(GO:0097493) |
| 0.3 | 5.2 | GO:0017049 | GTP-Rho binding(GO:0017049) |
| 0.3 | 3.5 | GO:0008331 | high voltage-gated calcium channel activity(GO:0008331) |
| 0.2 | 11.2 | GO:0017112 | Rab guanyl-nucleotide exchange factor activity(GO:0017112) |
| 0.2 | 10.4 | GO:0048487 | beta-tubulin binding(GO:0048487) |
| 0.2 | 3.4 | GO:0008409 | 5'-3' exonuclease activity(GO:0008409) |
| 0.2 | 4.3 | GO:0070742 | C2H2 zinc finger domain binding(GO:0070742) |
| 0.2 | 2.2 | GO:0017151 | DEAD/H-box RNA helicase binding(GO:0017151) |
| 0.2 | 8.9 | GO:0004715 | non-membrane spanning protein tyrosine kinase activity(GO:0004715) |
| 0.2 | 3.8 | GO:0016641 | oxidoreductase activity, acting on the CH-NH2 group of donors, oxygen as acceptor(GO:0016641) |
| 0.2 | 56.7 | GO:0003924 | GTPase activity(GO:0003924) |
| 0.2 | 18.5 | GO:0005178 | integrin binding(GO:0005178) |
| 0.2 | 9.0 | GO:0005200 | structural constituent of cytoskeleton(GO:0005200) |
| 0.2 | 2.0 | GO:0031957 | very long-chain fatty acid-CoA ligase activity(GO:0031957) |
| 0.2 | 2.4 | GO:0004032 | alditol:NADP+ 1-oxidoreductase activity(GO:0004032) |
| 0.2 | 29.2 | GO:0019903 | protein phosphatase binding(GO:0019903) |
| 0.2 | 28.5 | GO:0051015 | actin filament binding(GO:0051015) |
| 0.2 | 6.3 | GO:0019707 | protein-cysteine S-palmitoyltransferase activity(GO:0019706) protein-cysteine S-acyltransferase activity(GO:0019707) |
| 0.2 | 1.3 | GO:0004064 | arylesterase activity(GO:0004064) |
| 0.2 | 15.7 | GO:0005089 | Rho guanyl-nucleotide exchange factor activity(GO:0005089) |
| 0.2 | 4.0 | GO:0070577 | lysine-acetylated histone binding(GO:0070577) |
| 0.2 | 1.0 | GO:0047696 | beta-adrenergic receptor kinase activity(GO:0047696) |
| 0.2 | 0.6 | GO:0003958 | NADPH-hemoprotein reductase activity(GO:0003958) |
| 0.1 | 0.4 | GO:0055077 | gap junction hemi-channel activity(GO:0055077) |
| 0.1 | 3.4 | GO:0005086 | ARF guanyl-nucleotide exchange factor activity(GO:0005086) |
| 0.1 | 31.3 | GO:0005096 | GTPase activator activity(GO:0005096) |
| 0.1 | 4.7 | GO:0001786 | phosphatidylserine binding(GO:0001786) |
| 0.1 | 21.8 | GO:0020037 | heme binding(GO:0020037) |
| 0.1 | 37.3 | GO:0030246 | carbohydrate binding(GO:0030246) |
| 0.1 | 44.0 | GO:0050839 | cell adhesion molecule binding(GO:0050839) |
| 0.1 | 5.2 | GO:0017022 | myosin binding(GO:0017022) |
| 0.1 | 0.5 | GO:0061676 | importin-alpha family protein binding(GO:0061676) |
| 0.1 | 3.2 | GO:0008307 | structural constituent of muscle(GO:0008307) |
| 0.1 | 0.5 | GO:0052813 | insulin receptor substrate binding(GO:0043560) phosphatidylinositol-4,5-bisphosphate 3-kinase activity(GO:0046934) phosphatidylinositol bisphosphate kinase activity(GO:0052813) |
| 0.1 | 2.8 | GO:0000030 | mannosyltransferase activity(GO:0000030) |
| 0.1 | 7.1 | GO:0003725 | double-stranded RNA binding(GO:0003725) |
| 0.1 | 1.9 | GO:0005070 | SH3/SH2 adaptor activity(GO:0005070) |
| 0.1 | 5.2 | GO:0030295 | protein kinase activator activity(GO:0030295) |
| 0.1 | 2.1 | GO:0046961 | proton-transporting ATPase activity, rotational mechanism(GO:0046961) |
| 0.1 | 12.0 | GO:0016810 | hydrolase activity, acting on carbon-nitrogen (but not peptide) bonds(GO:0016810) |
| 0.1 | 3.4 | GO:0005484 | SNAP receptor activity(GO:0005484) |
| 0.1 | 1.6 | GO:0005487 | nucleocytoplasmic transporter activity(GO:0005487) |
| 0.1 | 3.8 | GO:0017048 | Rho GTPase binding(GO:0017048) |
| 0.1 | 1.4 | GO:0008574 | ATP-dependent microtubule motor activity, plus-end-directed(GO:0008574) |
| 0.1 | 1.3 | GO:0046875 | ephrin receptor binding(GO:0046875) |
| 0.1 | 1.9 | GO:0043027 | cysteine-type endopeptidase inhibitor activity involved in apoptotic process(GO:0043027) |
| 0.1 | 1.2 | GO:0001618 | virus receptor activity(GO:0001618) |
| 0.1 | 3.3 | GO:0015485 | cholesterol binding(GO:0015485) |
| 0.1 | 0.7 | GO:0004865 | protein serine/threonine phosphatase inhibitor activity(GO:0004865) |
| 0.1 | 1.1 | GO:0016755 | transferase activity, transferring amino-acyl groups(GO:0016755) |
| 0.1 | 3.4 | GO:0000980 | RNA polymerase II distal enhancer sequence-specific DNA binding(GO:0000980) |
| 0.1 | 2.9 | GO:0070888 | E-box binding(GO:0070888) |
| 0.1 | 2.0 | GO:0005104 | fibroblast growth factor receptor binding(GO:0005104) |
| 0.1 | 2.6 | GO:0048306 | calcium-dependent protein binding(GO:0048306) |
| 0.1 | 1.8 | GO:0051879 | Hsp90 protein binding(GO:0051879) |
| 0.1 | 2.4 | GO:0008139 | nuclear localization sequence binding(GO:0008139) |
| 0.1 | 1.2 | GO:0004659 | prenyltransferase activity(GO:0004659) |
| 0.1 | 1.2 | GO:0032183 | SUMO binding(GO:0032183) |
| 0.1 | 1.1 | GO:0003823 | antigen binding(GO:0003823) |
| 0.1 | 2.9 | GO:0005496 | steroid binding(GO:0005496) |
| 0.1 | 2.9 | GO:0043022 | ribosome binding(GO:0043022) |
| 0.0 | 12.5 | GO:0003735 | structural constituent of ribosome(GO:0003735) |
| 0.0 | 0.8 | GO:0005149 | interleukin-1 receptor binding(GO:0005149) |
| 0.0 | 3.1 | GO:0017137 | Rab GTPase binding(GO:0017137) |
| 0.0 | 0.7 | GO:0008195 | phosphatidate phosphatase activity(GO:0008195) |
| 0.0 | 2.0 | GO:0003724 | RNA helicase activity(GO:0003724) ATP-dependent RNA helicase activity(GO:0004004) |
| 0.0 | 0.5 | GO:0071837 | HMG box domain binding(GO:0071837) |
| 0.0 | 0.5 | GO:0070840 | dynein complex binding(GO:0070840) |
| 0.0 | 2.0 | GO:0042826 | histone deacetylase binding(GO:0042826) |
| 0.0 | 1.1 | GO:0003755 | peptidyl-prolyl cis-trans isomerase activity(GO:0003755) |
| 0.0 | 0.1 | GO:0051575 | 5'-deoxyribose-5-phosphate lyase activity(GO:0051575) |
| 0.0 | 2.0 | GO:0043130 | ubiquitin binding(GO:0043130) |
| 0.0 | 0.1 | GO:0047372 | acylglycerol lipase activity(GO:0047372) |
| 0.0 | 2.5 | GO:0000287 | magnesium ion binding(GO:0000287) |
| 0.0 | 0.0 | GO:0015252 | hydrogen ion channel activity(GO:0015252) |
Gene overrepresentation in curated gene sets: canonical pathways category:
| Log-likelihood per target | Total log-likelihood | Term | Description |
|---|---|---|---|
| 2.5 | 60.6 | PID TOLL ENDOGENOUS PATHWAY | Endogenous TLR signaling |
| 2.3 | 112.6 | PID AMB2 NEUTROPHILS PATHWAY | amb2 Integrin signaling |
| 1.3 | 9.0 | ST PAC1 RECEPTOR PATHWAY | PAC1 Receptor Pathway |
| 1.0 | 13.0 | PID S1P S1P3 PATHWAY | S1P3 pathway |
| 0.9 | 25.5 | PID S1P S1P2 PATHWAY | S1P2 pathway |
| 0.7 | 25.5 | PID TXA2PATHWAY | Thromboxane A2 receptor signaling |
| 0.6 | 6.7 | PID GMCSF PATHWAY | GMCSF-mediated signaling events |
| 0.5 | 39.7 | PID AR PATHWAY | Coregulation of Androgen receptor activity |
| 0.5 | 9.7 | PID CIRCADIAN PATHWAY | Circadian rhythm pathway |
| 0.5 | 9.4 | SIG IL4RECEPTOR IN B LYPHOCYTES | Genes related to IL4 rceptor signaling in B lymphocytes |
| 0.5 | 4.7 | SA FAS SIGNALING | The TNF-type receptor Fas induces apoptosis on ligand binding. |
| 0.5 | 23.3 | PID SYNDECAN 1 PATHWAY | Syndecan-1-mediated signaling events |
| 0.5 | 23.2 | PID HNF3A PATHWAY | FOXA1 transcription factor network |
| 0.5 | 10.4 | PID HEDGEHOG 2PATHWAY | Signaling events mediated by the Hedgehog family |
| 0.5 | 23.0 | PID CD8 TCR PATHWAY | TCR signaling in naïve CD8+ T cells |
| 0.5 | 13.8 | PID MAPK TRK PATHWAY | Trk receptor signaling mediated by the MAPK pathway |
| 0.5 | 6.0 | ST GRANULE CELL SURVIVAL PATHWAY | Granule Cell Survival Pathway is a specific case of more general PAC1 Receptor Pathway. |
| 0.4 | 65.3 | NABA ECM AFFILIATED | Genes encoding proteins affiliated structurally or functionally to extracellular matrix proteins |
| 0.4 | 14.0 | PID ARF6 PATHWAY | Arf6 signaling events |
| 0.4 | 7.4 | PID NETRIN PATHWAY | Netrin-mediated signaling events |
| 0.4 | 14.6 | SIG REGULATION OF THE ACTIN CYTOSKELETON BY RHO GTPASES | Genes related to regulation of the actin cytoskeleton |
| 0.4 | 5.6 | PID SMAD2 3PATHWAY | Regulation of cytoplasmic and nuclear SMAD2/3 signaling |
| 0.4 | 38.3 | PID PDGFRB PATHWAY | PDGFR-beta signaling pathway |
| 0.4 | 9.8 | PID CDC42 REG PATHWAY | Regulation of CDC42 activity |
| 0.3 | 8.6 | PID INTEGRIN3 PATHWAY | Beta3 integrin cell surface interactions |
| 0.3 | 11.2 | NABA BASEMENT MEMBRANES | Genes encoding structural components of basement membranes |
| 0.3 | 6.9 | SIG CD40PATHWAYMAP | Genes related to CD40 signaling |
| 0.3 | 6.2 | PID WNT NONCANONICAL PATHWAY | Noncanonical Wnt signaling pathway |
| 0.3 | 6.2 | PID WNT CANONICAL PATHWAY | Canonical Wnt signaling pathway |
| 0.3 | 3.9 | PID CXCR3 PATHWAY | CXCR3-mediated signaling events |
| 0.3 | 8.9 | PID NFAT 3PATHWAY | Role of Calcineurin-dependent NFAT signaling in lymphocytes |
| 0.3 | 2.5 | PID WNT SIGNALING PATHWAY | Wnt signaling network |
| 0.3 | 1.1 | PID THROMBIN PAR4 PATHWAY | PAR4-mediated thrombin signaling events |
| 0.3 | 2.1 | SA PROGRAMMED CELL DEATH | Programmed cell death, or apoptosis, eliminates damaged or unneeded cells. |
| 0.2 | 2.8 | SA REG CASCADE OF CYCLIN EXPR | Expression of cyclins regulates progression through the cell cycle by activating cyclin-dependent kinases. |
| 0.2 | 4.0 | ST INTEGRIN SIGNALING PATHWAY | Integrin Signaling Pathway |
| 0.2 | 8.5 | PID DELTA NP63 PATHWAY | Validated transcriptional targets of deltaNp63 isoforms |
| 0.2 | 7.0 | PID ARF6 TRAFFICKING PATHWAY | Arf6 trafficking events |
| 0.2 | 11.0 | PID P73PATHWAY | p73 transcription factor network |
| 0.2 | 3.0 | PID FAK PATHWAY | Signaling events mediated by focal adhesion kinase |
| 0.2 | 2.1 | SA CASPASE CASCADE | Apoptosis is mediated by caspases, cysteine proteases arranged in a proteolytic cascade. |
| 0.2 | 4.5 | PID ERBB1 DOWNSTREAM PATHWAY | ErbB1 downstream signaling |
| 0.2 | 7.7 | PID E2F PATHWAY | E2F transcription factor network |
| 0.1 | 7.0 | PID NOTCH PATHWAY | Notch signaling pathway |
| 0.1 | 24.6 | NABA ECM GLYCOPROTEINS | Genes encoding structural ECM glycoproteins |
| 0.1 | 1.5 | PID P38 MK2 PATHWAY | p38 signaling mediated by MAPKAP kinases |
| 0.1 | 3.5 | PID ATR PATHWAY | ATR signaling pathway |
| 0.1 | 1.9 | PID ERBB2 ERBB3 PATHWAY | ErbB2/ErbB3 signaling events |
| 0.1 | 2.3 | PID RETINOIC ACID PATHWAY | Retinoic acid receptors-mediated signaling |
| 0.1 | 4.8 | PID BETA CATENIN NUC PATHWAY | Regulation of nuclear beta catenin signaling and target gene transcription |
| 0.1 | 19.9 | NABA ECM REGULATORS | Genes encoding enzymes and their regulators involved in the remodeling of the extracellular matrix |
| 0.1 | 3.1 | PID IL12 2PATHWAY | IL12-mediated signaling events |
| 0.1 | 2.9 | PID TELOMERASE PATHWAY | Regulation of Telomerase |
| 0.1 | 2.1 | PID FGF PATHWAY | FGF signaling pathway |
| 0.1 | 2.6 | PID CASPASE PATHWAY | Caspase cascade in apoptosis |
| 0.1 | 1.2 | PID ECADHERIN STABILIZATION PATHWAY | Stabilization and expansion of the E-cadherin adherens junction |
| 0.0 | 1.6 | PID PLK1 PATHWAY | PLK1 signaling events |
| 0.0 | 1.2 | PID NFAT TFPATHWAY | Calcineurin-regulated NFAT-dependent transcription in lymphocytes |
| 0.0 | 0.7 | PID ERA GENOMIC PATHWAY | Validated nuclear estrogen receptor alpha network |
| 0.0 | 0.2 | PID LIS1 PATHWAY | Lissencephaly gene (LIS1) in neuronal migration and development |
Gene overrepresentation in curated gene sets: REACTOME pathways category:
| Log-likelihood per target | Total log-likelihood | Term | Description |
|---|---|---|---|
| 5.3 | 74.9 | REACTOME ADVANCED GLYCOSYLATION ENDPRODUCT RECEPTOR SIGNALING | Genes involved in Advanced glycosylation endproduct receptor signaling |
| 2.0 | 28.0 | REACTOME APOPTOTIC CLEAVAGE OF CELL ADHESION PROTEINS | Genes involved in Apoptotic cleavage of cell adhesion proteins |
| 2.0 | 7.9 | REACTOME BINDING AND ENTRY OF HIV VIRION | Genes involved in Binding and entry of HIV virion |
| 1.6 | 13.0 | REACTOME TRANSLOCATION OF ZAP 70 TO IMMUNOLOGICAL SYNAPSE | Genes involved in Translocation of ZAP-70 to Immunological synapse |
| 1.6 | 15.7 | REACTOME REGULATION OF INSULIN SECRETION BY ACETYLCHOLINE | Genes involved in Regulation of Insulin Secretion by Acetylcholine |
| 1.4 | 13.9 | REACTOME PURINE CATABOLISM | Genes involved in Purine catabolism |
| 1.4 | 21.9 | REACTOME ACYL CHAIN REMODELLING OF PS | Genes involved in Acyl chain remodelling of PS |
| 1.3 | 19.0 | REACTOME HORMONE SENSITIVE LIPASE HSL MEDIATED TRIACYLGLYCEROL HYDROLYSIS | Genes involved in Hormone-sensitive lipase (HSL)-mediated triacylglycerol hydrolysis |
| 1.2 | 23.7 | REACTOME HS GAG DEGRADATION | Genes involved in HS-GAG degradation |
| 1.0 | 18.6 | REACTOME CRMPS IN SEMA3A SIGNALING | Genes involved in CRMPs in Sema3A signaling |
| 0.9 | 19.2 | REACTOME REGULATION OF INSULIN LIKE GROWTH FACTOR IGF ACTIVITY BY INSULIN LIKE GROWTH FACTOR BINDING PROTEINS IGFBPS | Genes involved in Regulation of Insulin-like Growth Factor (IGF) Activity by Insulin-like Growth Factor Binding Proteins (IGFBPs) |
| 0.9 | 22.8 | REACTOME ADHERENS JUNCTIONS INTERACTIONS | Genes involved in Adherens junctions interactions |
| 0.9 | 13.7 | REACTOME SIGNAL REGULATORY PROTEIN SIRP FAMILY INTERACTIONS | Genes involved in Signal regulatory protein (SIRP) family interactions |
| 0.7 | 19.1 | REACTOME SMOOTH MUSCLE CONTRACTION | Genes involved in Smooth Muscle Contraction |
| 0.7 | 19.8 | REACTOME EFFECTS OF PIP2 HYDROLYSIS | Genes involved in Effects of PIP2 hydrolysis |
| 0.7 | 27.9 | REACTOME NCAM1 INTERACTIONS | Genes involved in NCAM1 interactions |
| 0.6 | 7.7 | REACTOME ANDROGEN BIOSYNTHESIS | Genes involved in Androgen biosynthesis |
| 0.6 | 8.4 | REACTOME ROLE OF DCC IN REGULATING APOPTOSIS | Genes involved in Role of DCC in regulating apoptosis |
| 0.6 | 14.7 | REACTOME DEADENYLATION OF MRNA | Genes involved in Deadenylation of mRNA |
| 0.6 | 8.6 | REACTOME CREB PHOSPHORYLATION THROUGH THE ACTIVATION OF CAMKII | Genes involved in CREB phosphorylation through the activation of CaMKII |
| 0.5 | 15.7 | REACTOME STRIATED MUSCLE CONTRACTION | Genes involved in Striated Muscle Contraction |
| 0.5 | 15.1 | REACTOME ACTIVATED NOTCH1 TRANSMITS SIGNAL TO THE NUCLEUS | Genes involved in Activated NOTCH1 Transmits Signal to the Nucleus |
| 0.5 | 11.6 | REACTOME GLUTAMATE NEUROTRANSMITTER RELEASE CYCLE | Genes involved in Glutamate Neurotransmitter Release Cycle |
| 0.5 | 25.0 | REACTOME FORMATION OF THE TERNARY COMPLEX AND SUBSEQUENTLY THE 43S COMPLEX | Genes involved in Formation of the ternary complex, and subsequently, the 43S complex |
| 0.5 | 6.9 | REACTOME TERMINATION OF O GLYCAN BIOSYNTHESIS | Genes involved in Termination of O-glycan biosynthesis |
| 0.5 | 11.8 | REACTOME TGF BETA RECEPTOR SIGNALING ACTIVATES SMADS | Genes involved in TGF-beta receptor signaling activates SMADs |
| 0.4 | 3.1 | REACTOME SPRY REGULATION OF FGF SIGNALING | Genes involved in Spry regulation of FGF signaling |
| 0.4 | 18.2 | REACTOME IMMUNOREGULATORY INTERACTIONS BETWEEN A LYMPHOID AND A NON LYMPHOID CELL | Genes involved in Immunoregulatory interactions between a Lymphoid and a non-Lymphoid cell |
| 0.4 | 10.0 | REACTOME CD28 DEPENDENT PI3K AKT SIGNALING | Genes involved in CD28 dependent PI3K/Akt signaling |
| 0.4 | 11.3 | REACTOME CIRCADIAN REPRESSION OF EXPRESSION BY REV ERBA | Genes involved in Circadian Repression of Expression by REV-ERBA |
| 0.4 | 4.5 | REACTOME P2Y RECEPTORS | Genes involved in P2Y receptors |
| 0.4 | 7.7 | REACTOME G1 S SPECIFIC TRANSCRIPTION | Genes involved in G1/S-Specific Transcription |
| 0.4 | 29.5 | REACTOME DOWNSTREAM SIGNAL TRANSDUCTION | Genes involved in Downstream signal transduction |
| 0.4 | 1.1 | REACTOME THROMBIN SIGNALLING THROUGH PROTEINASE ACTIVATED RECEPTORS PARS | Genes involved in Thrombin signalling through proteinase activated receptors (PARs) |
| 0.3 | 3.4 | REACTOME SYNTHESIS OF PIPS AT THE LATE ENDOSOME MEMBRANE | Genes involved in Synthesis of PIPs at the late endosome membrane |
| 0.3 | 9.2 | REACTOME CYTOCHROME P450 ARRANGED BY SUBSTRATE TYPE | Genes involved in Cytochrome P450 - arranged by substrate type |
| 0.3 | 17.7 | REACTOME PEPTIDE CHAIN ELONGATION | Genes involved in Peptide chain elongation |
| 0.3 | 9.3 | REACTOME NEGATIVE REGULATORS OF RIG I MDA5 SIGNALING | Genes involved in Negative regulators of RIG-I/MDA5 signaling |
| 0.3 | 6.7 | REACTOME IL RECEPTOR SHC SIGNALING | Genes involved in Interleukin receptor SHC signaling |
| 0.3 | 5.0 | REACTOME ABCA TRANSPORTERS IN LIPID HOMEOSTASIS | Genes involved in ABCA transporters in lipid homeostasis |
| 0.3 | 3.9 | REACTOME REGULATION OF PYRUVATE DEHYDROGENASE PDH COMPLEX | Genes involved in Regulation of pyruvate dehydrogenase (PDH) complex |
| 0.3 | 3.5 | REACTOME BMAL1 CLOCK NPAS2 ACTIVATES CIRCADIAN EXPRESSION | Genes involved in BMAL1:CLOCK/NPAS2 Activates Circadian Expression |
| 0.2 | 3.7 | REACTOME PURINE SALVAGE | Genes involved in Purine salvage |
| 0.2 | 3.0 | REACTOME GRB2 SOS PROVIDES LINKAGE TO MAPK SIGNALING FOR INTERGRINS | Genes involved in GRB2:SOS provides linkage to MAPK signaling for Intergrins |
| 0.2 | 6.3 | REACTOME RECYCLING PATHWAY OF L1 | Genes involved in Recycling pathway of L1 |
| 0.2 | 4.2 | REACTOME POST CHAPERONIN TUBULIN FOLDING PATHWAY | Genes involved in Post-chaperonin tubulin folding pathway |
| 0.2 | 3.4 | REACTOME PROTEOLYTIC CLEAVAGE OF SNARE COMPLEX PROTEINS | Genes involved in Proteolytic cleavage of SNARE complex proteins |
| 0.2 | 6.4 | REACTOME BIOSYNTHESIS OF THE N GLYCAN PRECURSOR DOLICHOL LIPID LINKED OLIGOSACCHARIDE LLO AND TRANSFER TO A NASCENT PROTEIN | Genes involved in Biosynthesis of the N-glycan precursor (dolichol lipid-linked oligosaccharide, LLO) and transfer to a nascent protein |
| 0.2 | 2.7 | REACTOME ENOS ACTIVATION AND REGULATION | Genes involved in eNOS activation and regulation |
| 0.2 | 7.4 | REACTOME NETRIN1 SIGNALING | Genes involved in Netrin-1 signaling |
| 0.2 | 7.9 | REACTOME CHEMOKINE RECEPTORS BIND CHEMOKINES | Genes involved in Chemokine receptors bind chemokines |
| 0.2 | 6.6 | REACTOME COLLAGEN FORMATION | Genes involved in Collagen formation |
| 0.2 | 2.0 | REACTOME VITAMIN B5 PANTOTHENATE METABOLISM | Genes involved in Vitamin B5 (pantothenate) metabolism |
| 0.1 | 1.9 | REACTOME GENERATION OF SECOND MESSENGER MOLECULES | Genes involved in Generation of second messenger molecules |
| 0.1 | 5.2 | REACTOME SPHINGOLIPID DE NOVO BIOSYNTHESIS | Genes involved in Sphingolipid de novo biosynthesis |
| 0.1 | 17.7 | REACTOME MRNA SPLICING | Genes involved in mRNA Splicing |
| 0.1 | 13.4 | REACTOME SIGNALING BY RHO GTPASES | Genes involved in Signaling by Rho GTPases |
| 0.1 | 7.8 | REACTOME LOSS OF NLP FROM MITOTIC CENTROSOMES | Genes involved in Loss of Nlp from mitotic centrosomes |
| 0.1 | 2.2 | REACTOME CELL EXTRACELLULAR MATRIX INTERACTIONS | Genes involved in Cell-extracellular matrix interactions |
| 0.1 | 2.0 | REACTOME SYNTHESIS OF VERY LONG CHAIN FATTY ACYL COAS | Genes involved in Synthesis of very long-chain fatty acyl-CoAs |
| 0.1 | 11.0 | REACTOME G ALPHA1213 SIGNALLING EVENTS | Genes involved in G alpha (12/13) signalling events |
| 0.1 | 6.8 | REACTOME AMINO ACID AND OLIGOPEPTIDE SLC TRANSPORTERS | Genes involved in Amino acid and oligopeptide SLC transporters |
| 0.1 | 3.5 | REACTOME CYTOSOLIC TRNA AMINOACYLATION | Genes involved in Cytosolic tRNA aminoacylation |
| 0.1 | 6.5 | REACTOME VOLTAGE GATED POTASSIUM CHANNELS | Genes involved in Voltage gated Potassium channels |
| 0.1 | 4.2 | REACTOME O LINKED GLYCOSYLATION OF MUCINS | Genes involved in O-linked glycosylation of mucins |
| 0.1 | 3.5 | REACTOME ACTIVATION OF ATR IN RESPONSE TO REPLICATION STRESS | Genes involved in Activation of ATR in response to replication stress |
| 0.1 | 10.6 | REACTOME FACTORS INVOLVED IN MEGAKARYOCYTE DEVELOPMENT AND PLATELET PRODUCTION | Genes involved in Factors involved in megakaryocyte development and platelet production |
| 0.1 | 1.2 | REACTOME PASSIVE TRANSPORT BY AQUAPORINS | Genes involved in Passive Transport by Aquaporins |
| 0.1 | 1.0 | REACTOME CREATION OF C4 AND C2 ACTIVATORS | Genes involved in Creation of C4 and C2 activators |
| 0.1 | 2.9 | REACTOME TRANSPORT OF VITAMINS NUCLEOSIDES AND RELATED MOLECULES | Genes involved in Transport of vitamins, nucleosides, and related molecules |
| 0.1 | 1.6 | REACTOME SYNTHESIS OF PA | Genes involved in Synthesis of PA |
| 0.1 | 2.1 | REACTOME INSULIN RECEPTOR RECYCLING | Genes involved in Insulin receptor recycling |
| 0.1 | 0.5 | REACTOME NRAGE SIGNALS DEATH THROUGH JNK | Genes involved in NRAGE signals death through JNK |
| 0.1 | 1.6 | REACTOME TRANSPORT OF MATURE MRNA DERIVED FROM AN INTRONLESS TRANSCRIPT | Genes involved in Transport of Mature mRNA Derived from an Intronless Transcript |
| 0.1 | 5.0 | REACTOME PPARA ACTIVATES GENE EXPRESSION | Genes involved in PPARA Activates Gene Expression |
| 0.1 | 0.7 | REACTOME TRIGLYCERIDE BIOSYNTHESIS | Genes involved in Triglyceride Biosynthesis |
| 0.0 | 0.6 | REACTOME MRNA DECAY BY 3 TO 5 EXORIBONUCLEASE | Genes involved in mRNA Decay by 3' to 5' Exoribonuclease |
| 0.0 | 2.6 | REACTOME MEIOTIC SYNAPSIS | Genes involved in Meiotic Synapsis |
| 0.0 | 2.8 | REACTOME MYD88 MAL CASCADE INITIATED ON PLASMA MEMBRANE | Genes involved in MyD88:Mal cascade initiated on plasma membrane |
| 0.0 | 1.3 | REACTOME INTERFERON GAMMA SIGNALING | Genes involved in Interferon gamma signaling |
| 0.0 | 4.4 | REACTOME G ALPHA Q SIGNALLING EVENTS | Genes involved in G alpha (q) signalling events |
| 0.0 | 0.7 | REACTOME COSTIMULATION BY THE CD28 FAMILY | Genes involved in Costimulation by the CD28 family |
| 0.0 | 0.2 | REACTOME PROLONGED ERK ACTIVATION EVENTS | Genes involved in Prolonged ERK activation events |
| 0.0 | 0.8 | REACTOME SPHINGOLIPID METABOLISM | Genes involved in Sphingolipid metabolism |
| 0.0 | 0.4 | REACTOME EXTRACELLULAR MATRIX ORGANIZATION | Genes involved in Extracellular matrix organization |
| 0.0 | 0.1 | REACTOME INTEGRATION OF PROVIRUS | Genes involved in Integration of provirus |