Project
GSE53960: rat RNA-Seq transcriptomic Bodymap
Navigation
Downloads
Results for Tgif1_Meis3
Z-value: 1.74
Motif logo
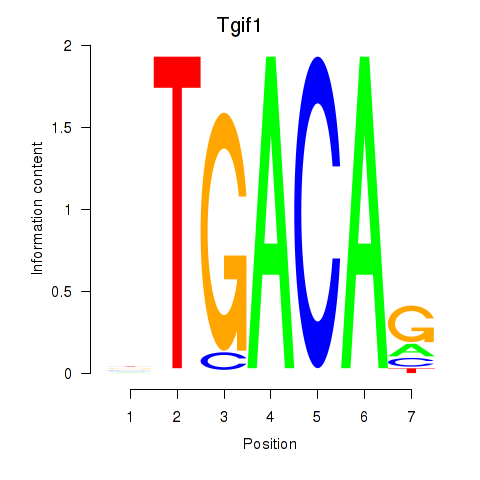
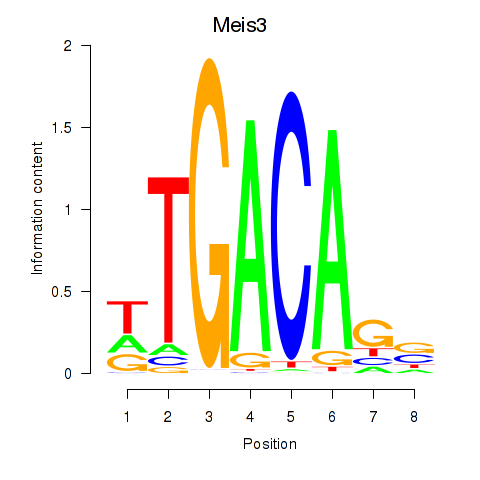
Transcription factors associated with Tgif1_Meis3
| Gene Symbol | Gene ID | Gene Info |
|---|---|---|
|
Tgif1
|
ENSRNOG00000015906 | TGFB-induced factor homeobox 1 |
|
Meis3
|
ENSRNOG00000021390 | Meis homeobox 3 |
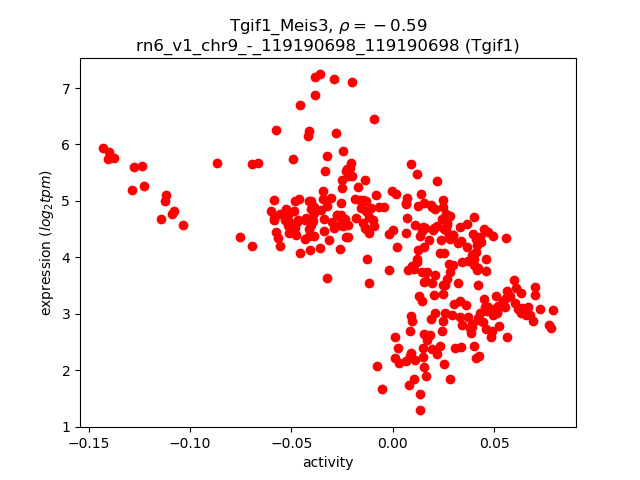
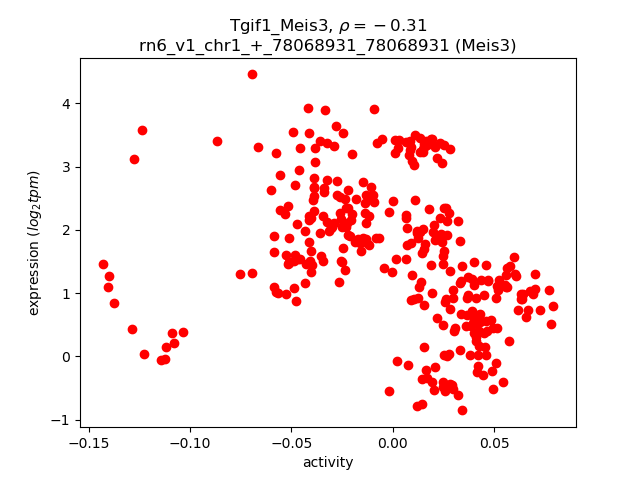
Activity-expression correlation:
| Gene | Promoter | Pearson corr. coef. | P-value | Plot |
|---|---|---|---|---|
| Tgif1 | rn6_v1_chr9_-_119190698_119190698 | -0.59 | 5.7e-32 | Click! |
| Meis3 | rn6_v1_chr1_+_78068931_78068931 | -0.31 | 9.7e-09 | Click! |
Activity profile of Tgif1_Meis3 motif
Sorted Z-values of Tgif1_Meis3 motif
| Promoter | Log-likelihood | Transcript | Gene | Gene Info |
|---|---|---|---|---|
| chr15_-_33656089 | 66.02 |
ENSRNOT00000024186
|
Myh7
|
myosin heavy chain 7 |
| chr5_+_164808323 | 58.63 |
ENSRNOT00000011005
|
Nppa
|
natriuretic peptide A |
| chr7_-_118108864 | 50.88 |
ENSRNOT00000006184
|
Mb
|
myoglobin |
| chr2_-_22744407 | 36.52 |
ENSRNOT00000073710
|
Cmya5
|
cardiomyopathy associated 5 |
| chr2_-_21437193 | 34.61 |
ENSRNOT00000084002
|
Ckmt2
|
creatine kinase, mitochondrial 2 |
| chr1_+_80321585 | 33.69 |
ENSRNOT00000022895
|
Ckm
|
creatine kinase, M-type |
| chr3_+_151032952 | 33.44 |
ENSRNOT00000064013
|
Acss2
|
acyl-CoA synthetase short-chain family member 2 |
| chr14_-_86147553 | 31.96 |
ENSRNOT00000085847
|
Myl7
|
myosin light chain 7 |
| chr14_+_63095720 | 31.42 |
ENSRNOT00000006071
|
Ppargc1a
|
PPARG coactivator 1 alpha |
| chr7_-_80796670 | 31.27 |
ENSRNOT00000010539
|
Abra
|
actin-binding Rho activating protein |
| chr13_+_106463368 | 30.17 |
ENSRNOT00000003489
|
Esrrg
|
estrogen-related receptor gamma |
| chr1_-_80331626 | 30.09 |
ENSRNOT00000022577
|
AABR07002677.1
|
|
| chr4_-_99125111 | 27.39 |
ENSRNOT00000009184
|
Smyd1
|
SET and MYND domain containing 1 |
| chr10_+_53818818 | 27.19 |
ENSRNOT00000057260
|
Myh8
|
myosin heavy chain 8 |
| chr1_-_213650247 | 26.76 |
ENSRNOT00000019679
|
Cox8b
|
cytochrome c oxidase, subunit VIIIb |
| chr5_-_64818813 | 24.93 |
ENSRNOT00000009111
ENSRNOT00000086505 |
Aldob
|
aldolase, fructose-bisphosphate B |
| chr9_-_73958480 | 24.57 |
ENSRNOT00000017838
|
Myl1
|
myosin, light chain 1 |
| chr16_-_8885797 | 22.55 |
ENSRNOT00000073370
|
RGD1564899
|
similar to chromosome 10 open reading frame 71 |
| chr2_+_104416972 | 22.14 |
ENSRNOT00000017125
|
Trim55
|
tripartite motif-containing 55 |
| chr7_-_119441487 | 21.65 |
ENSRNOT00000067635
|
Pvalb
|
parvalbumin |
| chr4_-_30556814 | 21.59 |
ENSRNOT00000012760
|
Pdk4
|
pyruvate dehydrogenase kinase 4 |
| chrX_+_63520991 | 21.46 |
ENSRNOT00000071590
|
Apoo
|
apolipoprotein O |
| chrX_+_25016401 | 21.21 |
ENSRNOT00000059270
|
Clcn4
|
chloride voltage-gated channel 4 |
| chr9_-_4876023 | 20.84 |
ENSRNOT00000065839
|
RGD1559960
|
similar to Sulfotransferase K1 (rSULT1C2) |
| chr1_-_265573117 | 20.34 |
ENSRNOT00000044195
ENSRNOT00000055915 |
LOC100911951
|
Kv channel-interacting protein 2-like |
| chr9_+_65478496 | 20.05 |
ENSRNOT00000016060
|
Ndufb3
|
NADH:ubiquinone oxidoreductase subunit B3 |
| chr1_+_141218095 | 19.80 |
ENSRNOT00000051411
|
LOC691427
|
similar to 6.8 kDa mitochondrial proteolipid |
| chrX_+_1787266 | 19.56 |
ENSRNOT00000011183
|
Ndufb11
|
NADH:ubiquinone oxidoreductase subunit B11 |
| chr11_+_66713888 | 19.38 |
ENSRNOT00000003340
|
Fbxo40
|
F-box protein 40 |
| chr7_+_60099120 | 19.34 |
ENSRNOT00000007338
|
LOC100911101
|
leucine-rich repeat-containing protein 10-like |
| chr3_+_80075991 | 19.22 |
ENSRNOT00000080266
|
Pacsin3
|
protein kinase C and casein kinase substrate in neurons 3 |
| chr13_-_82005741 | 19.19 |
ENSRNOT00000076404
|
Mettl11b
|
methyltransferase like 11B |
| chr20_+_34633157 | 19.12 |
ENSRNOT00000000469
|
Pln
|
phospholamban |
| chr9_+_14529218 | 18.98 |
ENSRNOT00000016893
|
Apobec2
|
apolipoprotein B mRNA editing enzyme catalytic subunit 2 |
| chr8_-_84632817 | 18.72 |
ENSRNOT00000076942
|
Mlip
|
muscular LMNA-interacting protein |
| chr8_-_87282156 | 18.66 |
ENSRNOT00000087874
|
Filip1
|
filamin A interacting protein 1 |
| chr6_-_26624092 | 18.65 |
ENSRNOT00000008113
|
Trim54
|
tripartite motif-containing 54 |
| chr1_-_211265161 | 18.46 |
ENSRNOT00000080041
ENSRNOT00000023477 |
Bnip3
|
BCL2 interacting protein 3 |
| chr19_-_64303 | 18.21 |
ENSRNOT00000015451
|
Ces2a
|
carboxylesterase 2A |
| chr7_+_123578878 | 18.10 |
ENSRNOT00000011316
|
Smdt1
|
single-pass membrane protein with aspartate-rich tail 1 |
| chr10_+_92337879 | 18.04 |
ENSRNOT00000042984
|
Mapt
|
microtubule-associated protein tau |
| chr16_+_26906716 | 17.96 |
ENSRNOT00000064297
|
Cpe
|
carboxypeptidase E |
| chr9_+_119353840 | 17.26 |
ENSRNOT00000085362
|
Myom1
|
myomesin 1 |
| chr13_-_57080491 | 17.23 |
ENSRNOT00000017749
ENSRNOT00000086572 ENSRNOT00000060111 |
Cfh
|
complement factor H |
| chr14_-_87701884 | 17.17 |
ENSRNOT00000079338
|
Mospd1
|
motile sperm domain containing 1 |
| chrX_-_40086870 | 17.16 |
ENSRNOT00000010027
|
Smpx
|
small muscle protein, X-linked |
| chr1_+_229039889 | 17.16 |
ENSRNOT00000054800
|
Glyatl1
|
glycine-N-acyltransferase-like 1 |
| chr7_+_29435444 | 17.12 |
ENSRNOT00000008613
|
Slc5a8
|
solute carrier family 5 member 8 |
| chr10_+_53781239 | 17.08 |
ENSRNOT00000082871
|
Myh2
|
myosin heavy chain 2 |
| chr13_+_113373578 | 16.74 |
ENSRNOT00000009900
|
Plxna2
|
plexin A2 |
| chr7_+_60087429 | 16.61 |
ENSRNOT00000073117
|
Lrrc10
|
leucine-rich repeat-containing 10 |
| chr2_-_220535751 | 16.59 |
ENSRNOT00000089082
|
Palmd
|
palmdelphin |
| chr15_-_27819376 | 16.46 |
ENSRNOT00000067400
|
A930018M24Rik
|
RIKEN cDNA A930018M24 gene |
| chr5_+_159967839 | 16.43 |
ENSRNOT00000051317
|
Hspb7
|
heat shock protein family B (small) member 7 |
| chr13_-_80862963 | 16.42 |
ENSRNOT00000004864
|
Fmo3
|
flavin containing monooxygenase 3 |
| chr2_+_78247448 | 16.36 |
ENSRNOT00000089805
|
LOC103689968
|
protein FAM134B |
| chr19_+_25095089 | 16.32 |
ENSRNOT00000041717
|
Prkaca
|
protein kinase cAMP-activated catalytic subunit alpha |
| chr7_+_139685573 | 15.95 |
ENSRNOT00000088376
|
Pfkm
|
phosphofructokinase, muscle |
| chr19_-_10596851 | 15.90 |
ENSRNOT00000021716
|
Coq9
|
coenzyme Q9 |
| chr10_+_16635989 | 15.78 |
ENSRNOT00000028155
|
Nkx2-5
|
NK2 homeobox 5 |
| chr15_+_4077091 | 15.71 |
ENSRNOT00000011554
|
Myoz1
|
myozenin 1 |
| chr8_-_127900463 | 15.66 |
ENSRNOT00000078303
|
Slc22a13
|
solute carrier family 22 member 13 |
| chr10_+_14094754 | 15.65 |
ENSRNOT00000019660
|
Rpl3l
|
ribosomal protein L3-like |
| chr4_-_129619142 | 15.60 |
ENSRNOT00000047453
|
Lmod3
|
leiomodin 3 |
| chr13_-_82006005 | 15.41 |
ENSRNOT00000039581
|
Mettl11b
|
methyltransferase like 11B |
| chr4_+_130172727 | 15.36 |
ENSRNOT00000051121
|
Mitf
|
melanogenesis associated transcription factor |
| chr3_-_71845232 | 15.31 |
ENSRNOT00000078645
|
Calcrl
|
calcitonin receptor like receptor |
| chr13_+_41883137 | 15.28 |
ENSRNOT00000004581
|
Slc35f5
|
solute carrier family 35, member F5 |
| chr1_+_229030233 | 15.20 |
ENSRNOT00000084503
|
Glyatl1
|
glycine-N-acyltransferase-like 1 |
| chr14_-_91989307 | 15.09 |
ENSRNOT00000057051
|
Ddc
|
dopa decarboxylase |
| chr1_+_153861569 | 14.99 |
ENSRNOT00000023329
|
Me3
|
malic enzyme 3 |
| chr16_-_74330911 | 14.95 |
ENSRNOT00000084330
|
Slc20a2
|
solute carrier family 20 member 2 |
| chr20_+_26988774 | 14.94 |
ENSRNOT00000090083
|
Mypn
|
myopalladin |
| chr8_-_49109981 | 14.89 |
ENSRNOT00000019933
|
Ttc36
|
tetratricopeptide repeat domain 36 |
| chr14_+_22517774 | 14.85 |
ENSRNOT00000047655
|
Ugt2b37
|
UDP-glucuronosyltransferase 2 family, member 37 |
| chr1_-_89539210 | 14.81 |
ENSRNOT00000077462
ENSRNOT00000028644 |
Hpn
|
hepsin |
| chr16_+_20962227 | 14.79 |
ENSRNOT00000027615
|
Slc25a42
|
solute carrier family 25, member 42 |
| chr5_-_119564846 | 14.72 |
ENSRNOT00000012977
|
Cyp2j4
|
cytochrome P450, family 2, subfamily j, polypeptide 4 |
| chr9_-_23352668 | 14.69 |
ENSRNOT00000075279
|
Mut
|
methylmalonyl CoA mutase |
| chr17_+_10537365 | 14.63 |
ENSRNOT00000023651
|
Cltb
|
clathrin, light chain B |
| chr16_-_79671719 | 14.63 |
ENSRNOT00000015908
|
Myom2
|
myomesin 2 |
| chr2_+_114423533 | 14.52 |
ENSRNOT00000091221
|
Slc2a2
|
solute carrier family 2 member 2 |
| chr12_+_52452273 | 14.49 |
ENSRNOT00000056680
ENSRNOT00000088381 |
Pxmp2
|
peroxisomal membrane protein 2 |
| chr12_-_48218955 | 14.41 |
ENSRNOT00000067975
ENSRNOT00000080557 ENSRNOT00000000821 |
Acacb
|
acetyl-CoA carboxylase beta |
| chrX_+_159165169 | 14.36 |
ENSRNOT00000087274
|
Fhl1
|
four and a half LIM domains 1 |
| chr14_-_64476796 | 14.32 |
ENSRNOT00000029104
|
Gba3
|
glucosidase, beta, acid 3 |
| chr10_-_95934345 | 14.17 |
ENSRNOT00000004349
|
Cacng1
|
calcium voltage-gated channel auxiliary subunit gamma 1 |
| chr2_+_68820615 | 13.93 |
ENSRNOT00000087007
ENSRNOT00000089504 |
Egf
|
epidermal growth factor |
| chr1_+_238222521 | 13.91 |
ENSRNOT00000024000
|
Aldh1a1
|
aldehyde dehydrogenase 1 family, member A1 |
| chr2_-_184993341 | 13.78 |
ENSRNOT00000071580
|
Fam160a1
|
family with sequence similarity 160, member A1 |
| chr1_+_40086470 | 13.51 |
ENSRNOT00000021895
|
Iyd
|
iodotyrosine deiodinase |
| chr1_+_201981357 | 13.46 |
ENSRNOT00000027999
|
Acadsb
|
acyl-CoA dehydrogenase, short/branched chain |
| chr1_-_224698514 | 13.39 |
ENSRNOT00000024234
|
Slc22a25
|
solute carrier family 22, member 25 |
| chr2_-_104461863 | 13.27 |
ENSRNOT00000016953
|
Crh
|
corticotropin releasing hormone |
| chr18_+_24717336 | 13.23 |
ENSRNOT00000090923
|
Lims2
|
LIM zinc finger domain containing 2 |
| chr1_-_25839198 | 13.23 |
ENSRNOT00000090388
ENSRNOT00000092757 ENSRNOT00000042072 |
Trdn
|
triadin |
| chr1_+_20856187 | 13.21 |
ENSRNOT00000071726
|
Smlr1
|
small leucine-rich protein 1 |
| chrX_-_13601069 | 13.16 |
ENSRNOT00000004686
|
Otc
|
ornithine carbamoyltransferase |
| chr9_-_4327679 | 13.12 |
ENSRNOT00000073468
|
LOC100910235
|
sulfotransferase 1C1-like |
| chr9_-_49950093 | 13.07 |
ENSRNOT00000023014
|
Fhl2
|
four and a half LIM domains 2 |
| chr1_+_21525421 | 13.05 |
ENSRNOT00000017911
|
Arg1
|
arginase 1 |
| chr3_-_2453415 | 13.02 |
ENSRNOT00000079773
|
Slc34a3
|
solute carrier family 34 member 3 |
| chr13_+_83681322 | 12.99 |
ENSRNOT00000004206
|
Mpc2
|
mitochondrial pyruvate carrier 2 |
| chr10_+_110445797 | 12.97 |
ENSRNOT00000054920
|
Narf
|
nuclear prelamin A recognition factor |
| chr19_+_50246402 | 12.89 |
ENSRNOT00000018795
|
Hsd17b2
|
hydroxysteroid (17-beta) dehydrogenase 2 |
| chr1_-_224533219 | 12.87 |
ENSRNOT00000051289
|
Ust5r
|
integral membrane transport protein UST5r |
| chr9_-_19613360 | 12.84 |
ENSRNOT00000029593
|
Rcan2
|
regulator of calcineurin 2 |
| chr1_+_189328246 | 12.82 |
ENSRNOT00000084260
|
Acsm1
|
acyl-CoA synthetase medium-chain family member 1 |
| chr7_-_97067864 | 12.70 |
ENSRNOT00000078009
|
Slc22a22
|
solute carrier family 22 (organic cation transporter), member 22 |
| chr2_-_257038105 | 12.49 |
ENSRNOT00000071195
|
Ptgfr
|
prostaglandin F receptor |
| chr2_+_233615739 | 12.48 |
ENSRNOT00000051009
|
Pitx2
|
paired-like homeodomain 2 |
| chr2_-_259382765 | 12.44 |
ENSRNOT00000091407
|
St6galnac3
|
ST6 N-acetylgalactosaminide alpha-2,6-sialyltransferase 3 |
| chr1_+_177048655 | 12.40 |
ENSRNOT00000081595
|
Mical2
|
microtubule associated monooxygenase, calponin and LIM domain containing 2 |
| chr1_-_204582070 | 12.35 |
ENSRNOT00000022628
|
Oat
|
ornithine aminotransferase |
| chr2_-_158156150 | 12.34 |
ENSRNOT00000016621
|
Veph1
|
ventricular zone expressed PH domain-containing 1 |
| chr5_+_33580944 | 12.30 |
ENSRNOT00000092054
ENSRNOT00000036050 |
Rmdn1
|
regulator of microtubule dynamics 1 |
| chr4_+_148782479 | 12.24 |
ENSRNOT00000018133
|
LOC500300
|
similar to hypothetical protein MGC6835 |
| chr1_-_195096694 | 12.21 |
ENSRNOT00000088874
|
Snurf
|
SNRPN upstream reading frame |
| chr14_-_80958478 | 11.97 |
ENSRNOT00000035385
|
Dok7
|
docking protein 7 |
| chr2_-_158156444 | 11.94 |
ENSRNOT00000088559
|
Veph1
|
ventricular zone expressed PH domain-containing 1 |
| chr1_+_153861948 | 11.91 |
ENSRNOT00000087067
|
Me3
|
malic enzyme 3 |
| chr9_-_75528644 | 11.89 |
ENSRNOT00000019283
|
Erbb4
|
erb-b2 receptor tyrosine kinase 4 |
| chr8_-_130429132 | 11.87 |
ENSRNOT00000026261
|
Hhatl
|
hedgehog acyltransferase-like |
| chr2_+_41442241 | 11.73 |
ENSRNOT00000067546
|
Pde4d
|
phosphodiesterase 4D |
| chr10_+_37215937 | 11.66 |
ENSRNOT00000006567
|
Sar1b
|
secretion associated, Ras related GTPase 1B |
| chr7_-_76294663 | 11.62 |
ENSRNOT00000064513
|
Ncald
|
neurocalcin delta |
| chr7_-_73450262 | 11.60 |
ENSRNOT00000006943
|
Nipal2
|
NIPA-like domain containing 2 |
| chr3_-_37803112 | 11.54 |
ENSRNOT00000059461
|
Neb
|
nebulin |
| chr12_+_19196611 | 11.41 |
ENSRNOT00000001801
|
Azgp1
|
alpha-2-glycoprotein 1, zinc-binding |
| chr2_+_211337271 | 11.37 |
ENSRNOT00000045155
|
Cox6b1
|
cytochrome c oxidase subunit 6B1 |
| chr19_-_9777465 | 11.37 |
ENSRNOT00000017413
|
Ndrg4
|
NDRG family member 4 |
| chr3_+_159936856 | 11.30 |
ENSRNOT00000078703
|
Hnf4a
|
hepatocyte nuclear factor 4, alpha |
| chr8_-_84320714 | 11.12 |
ENSRNOT00000079356
ENSRNOT00000088487 |
Tinag
|
tubulointerstitial nephritis antigen |
| chr2_+_219563783 | 11.09 |
ENSRNOT00000020267
|
Dbt
|
dihydrolipoamide branched chain transacylase E2 |
| chr10_+_53778662 | 11.04 |
ENSRNOT00000045718
|
Myh2
|
myosin heavy chain 2 |
| chr3_-_163935617 | 10.99 |
ENSRNOT00000074023
|
Kcnb1
|
potassium voltage-gated channel subfamily B member 1 |
| chr18_-_56728185 | 10.98 |
ENSRNOT00000066048
|
Ppargc1b
|
PPARG coactivator 1 beta |
| chr2_+_68821004 | 10.97 |
ENSRNOT00000083713
|
Egf
|
epidermal growth factor |
| chr12_+_45905371 | 10.93 |
ENSRNOT00000039275
|
Hspb8
|
heat shock protein family B (small) member 8 |
| chr6_+_60566196 | 10.90 |
ENSRNOT00000006709
ENSRNOT00000075193 |
Dock4
|
dedicator of cytokinesis 4 |
| chr5_-_136965191 | 10.89 |
ENSRNOT00000056842
|
St3gal3
|
ST3 beta-galactoside alpha-2,3-sialyltransferase 3 |
| chr10_-_46206135 | 10.86 |
ENSRNOT00000091471
|
Cops3
|
COP9 signalosome subunit 3 |
| chr4_-_145948996 | 10.84 |
ENSRNOT00000043476
|
Atp2b2
|
ATPase plasma membrane Ca2+ transporting 2 |
| chr3_+_151126591 | 10.74 |
ENSRNOT00000025859
|
Myh7b
|
myosin heavy chain 7B |
| chr10_-_8654892 | 10.71 |
ENSRNOT00000066534
|
Rbfox1
|
RNA binding protein, fox-1 homolog 1 |
| chr3_-_129357348 | 10.71 |
ENSRNOT00000084829
ENSRNOT00000007410 |
Pak7
|
p21 (RAC1) activated kinase 7 |
| chr4_+_119225040 | 10.63 |
ENSRNOT00000012365
|
Bmp10
|
bone morphogenetic protein 10 |
| chr11_+_68198709 | 10.57 |
ENSRNOT00000003048
|
Dirc2
|
disrupted in renal carcinoma 2 |
| chr14_+_22375955 | 10.56 |
ENSRNOT00000063915
ENSRNOT00000034784 |
Ugt2b37
|
UDP-glucuronosyltransferase 2 family, member 37 |
| chr1_-_259484569 | 10.41 |
ENSRNOT00000021289
ENSRNOT00000021114 ENSRNOT00000021229 ENSRNOT00000021347 ENSRNOT00000021226 |
Sorbs1
|
sorbin and SH3 domain containing 1 |
| chr1_-_89369960 | 10.40 |
ENSRNOT00000028545
|
Hamp
|
hepcidin antimicrobial peptide |
| chr7_+_38858062 | 10.33 |
ENSRNOT00000006234
|
Kera
|
keratocan |
| chr1_+_282568287 | 10.31 |
ENSRNOT00000015997
|
Ces2i
|
carboxylesterase 2I |
| chr2_-_166682325 | 10.31 |
ENSRNOT00000091198
ENSRNOT00000012422 |
Sptssb
|
serine palmitoyltransferase, small subunit B |
| chr19_+_561727 | 10.30 |
ENSRNOT00000016259
ENSRNOT00000081547 |
Rrad
|
RRAD, Ras related glycolysis inhibitor and calcium channel regulator |
| chr2_+_42726809 | 10.27 |
ENSRNOT00000036860
|
AABR07008097.1
|
|
| chr9_-_89193821 | 10.26 |
ENSRNOT00000090881
|
Sphkap
|
SPHK1 interactor, AKAP domain containing |
| chr17_+_32082937 | 10.24 |
ENSRNOT00000074775
|
Mylk4
|
myosin light chain kinase family, member 4 |
| chr2_-_28799266 | 10.21 |
ENSRNOT00000089293
|
Tmem171
|
transmembrane protein 171 |
| chr1_+_189940291 | 10.20 |
ENSRNOT00000075035
|
Anks4b
|
ankyrin repeat and sterile alpha motif domain containing 4B |
| chr19_+_27404712 | 10.19 |
ENSRNOT00000023657
|
Mylk3
|
myosin light chain kinase 3 |
| chr1_+_80141630 | 10.13 |
ENSRNOT00000029552
|
Opa3
|
optic atrophy 3 |
| chr16_+_54332660 | 10.11 |
ENSRNOT00000037685
|
Mtus1
|
microtubule associated tumor suppressor 1 |
| chr18_-_57201740 | 10.10 |
ENSRNOT00000026227
|
Ablim3
|
actin binding LIM protein family, member 3 |
| chrX_-_54303729 | 10.09 |
ENSRNOT00000087919
ENSRNOT00000064340 ENSRNOT00000051249 ENSRNOT00000087547 |
Gk
|
glycerol kinase |
| chr3_-_60813869 | 10.07 |
ENSRNOT00000058234
|
Atp5g3
|
ATP synthase, H+ transporting, mitochondrial Fo complex, subunit C3 (subunit 9) |
| chr10_-_29450644 | 10.07 |
ENSRNOT00000087937
|
Adra1b
|
adrenoceptor alpha 1B |
| chr12_-_22478752 | 10.07 |
ENSRNOT00000089392
ENSRNOT00000086915 |
Ache
|
acetylcholinesterase |
| chr16_+_18690246 | 10.06 |
ENSRNOT00000081484
|
Mat1a
|
methionine adenosyltransferase 1A |
| chr18_+_38292701 | 9.97 |
ENSRNOT00000037796
|
Scgb3a2
|
secretoglobin, family 3A, member 2 |
| chr17_-_43504604 | 9.94 |
ENSRNOT00000083829
ENSRNOT00000066313 |
Slc17a1
|
solute carrier family 17 member 1 |
| chr1_-_222177421 | 9.91 |
ENSRNOT00000078393
|
Esrra
|
estrogen related receptor, alpha |
| chr10_+_86657285 | 9.87 |
ENSRNOT00000087346
|
Thra
|
thyroid hormone receptor alpha |
| chr3_-_159775643 | 9.85 |
ENSRNOT00000010939
|
Jph2
|
junctophilin 2 |
| chr4_-_31730386 | 9.75 |
ENSRNOT00000013817
|
Slc25a13
|
solute carrier family 25 member 13 |
| chr10_+_99437436 | 9.72 |
ENSRNOT00000006254
|
Kcnj2
|
potassium voltage-gated channel subfamily J member 2 |
| chrM_+_5323 | 9.70 |
ENSRNOT00000050156
|
Mt-co1
|
mitochondrially encoded cytochrome c oxidase 1 |
| chr1_+_170383682 | 9.64 |
ENSRNOT00000024224
|
Smpd1
|
sphingomyelin phosphodiesterase 1 |
| chr1_-_195096460 | 9.62 |
ENSRNOT00000077253
|
Snrpn
|
small nuclear ribonucleoprotein polypeptide N |
| chr2_+_242882306 | 9.62 |
ENSRNOT00000013661
|
Ddit4l
|
DNA-damage-inducible transcript 4-like |
| chr1_+_215609645 | 9.61 |
ENSRNOT00000076140
ENSRNOT00000027487 |
Tnni2
|
troponin I2, fast skeletal type |
| chr10_+_70262361 | 9.54 |
ENSRNOT00000064625
ENSRNOT00000076973 |
Unc45b
|
unc-45 myosin chaperone B |
| chr2_-_219842986 | 9.44 |
ENSRNOT00000055735
|
Agl
|
amylo-alpha-1, 6-glucosidase, 4-alpha-glucanotransferase |
| chr17_-_55709740 | 9.43 |
ENSRNOT00000033359
|
RGD1562037
|
similar to OTTHUMP00000046255 |
| chr1_-_78739107 | 9.42 |
ENSRNOT00000021586
|
Fkrp
|
fukutin related protein |
| chr1_+_100473643 | 9.41 |
ENSRNOT00000026379
|
Josd2
|
Josephin domain containing 2 |
| chr8_+_75516904 | 9.39 |
ENSRNOT00000013142
|
Rora
|
RAR-related orphan receptor A |
| chr8_+_131845696 | 9.34 |
ENSRNOT00000005440
|
Tcaim
|
T cell activation inhibitor, mitochondrial |
| chr3_-_21027947 | 9.33 |
ENSRNOT00000051973
|
Olr421
|
olfactory receptor 421 |
| chr13_+_52889737 | 9.32 |
ENSRNOT00000074366
|
Cacna1s
|
calcium voltage-gated channel subunit alpha1 S |
| chr11_+_82945104 | 9.28 |
ENSRNOT00000002410
|
Ehhadh
|
enoyl-CoA hydratase and 3-hydroxyacyl CoA dehydrogenase |
| chr3_-_151474135 | 9.27 |
ENSRNOT00000072679
|
Uqcc1
|
ubiquinol-cytochrome c reductase complex assembly factor 1 |
| chr14_+_22142364 | 9.26 |
ENSRNOT00000002699
|
Sult1b1
|
sulfotransferase family 1B member 1 |
| chr19_+_39357791 | 9.24 |
ENSRNOT00000086435
ENSRNOT00000015006 |
Cyb5b
|
cytochrome b5 type B |
| chr1_+_185863043 | 9.22 |
ENSRNOT00000079072
|
Sox6
|
SRY box 6 |
| chr3_-_129884810 | 9.18 |
ENSRNOT00000009540
|
Mkks
|
McKusick-Kaufman syndrome |
| chr15_+_10120206 | 9.15 |
ENSRNOT00000033048
|
Rarb
|
retinoic acid receptor, beta |
| chr2_-_211017778 | 9.14 |
ENSRNOT00000026883
|
Sypl2
|
synaptophysin-like 2 |
| chr1_+_229066045 | 9.13 |
ENSRNOT00000016454
|
Glyat
|
glycine-N-acyltransferase |
| chr10_-_86690815 | 9.12 |
ENSRNOT00000012537
|
Nr1d1
|
nuclear receptor subfamily 1, group D, member 1 |
Network of associatons between targets according to the STRING database.

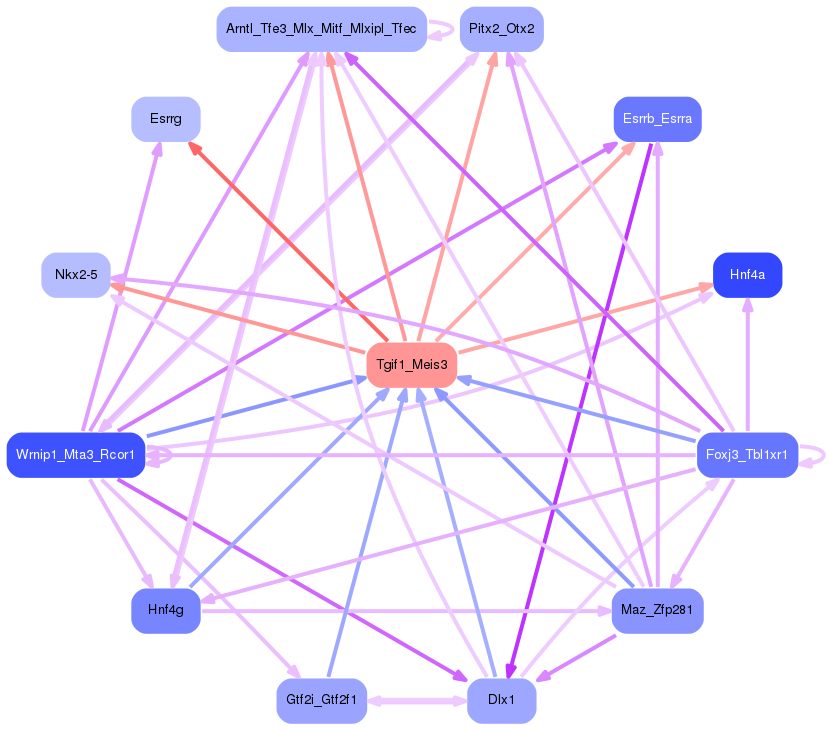
First level regulatory network of Tgif1_Meis3
Gene Ontology Analysis
Gene overrepresentation in biological process category:
| Log-likelihood per target | Total log-likelihood | Term | Description |
|---|---|---|---|
| 39.0 | 116.9 | GO:0031444 | slow-twitch skeletal muscle fiber contraction(GO:0031444) |
| 19.2 | 57.5 | GO:1902304 | positive regulation of potassium ion export(GO:1902304) |
| 11.5 | 34.6 | GO:0006480 | N-terminal protein amino acid methylation(GO:0006480) |
| 11.1 | 33.4 | GO:0006083 | acetate metabolic process(GO:0006083) propionate metabolic process(GO:0019541) |
| 10.5 | 31.4 | GO:0071250 | cellular response to nitrite(GO:0071250) response to nitrite(GO:0080033) regulation of progesterone biosynthetic process(GO:2000182) |
| 8.3 | 24.9 | GO:0006116 | NADH oxidation(GO:0006116) |
| 7.9 | 15.8 | GO:0003350 | pulmonary myocardium development(GO:0003350) |
| 7.7 | 30.8 | GO:1903015 | regulation of exo-alpha-sialidase activity(GO:1903015) |
| 7.7 | 53.7 | GO:0002074 | extraocular skeletal muscle development(GO:0002074) |
| 7.2 | 28.8 | GO:0010510 | regulation of acetyl-CoA biosynthetic process from pyruvate(GO:0010510) |
| 7.2 | 7.2 | GO:0071395 | response to jasmonic acid(GO:0009753) cellular response to jasmonic acid stimulus(GO:0071395) |
| 5.6 | 33.4 | GO:0070885 | negative regulation of calcineurin-NFAT signaling cascade(GO:0070885) |
| 5.4 | 27.1 | GO:0071799 | response to prostaglandin D(GO:0071798) cellular response to prostaglandin D stimulus(GO:0071799) |
| 4.9 | 14.8 | GO:0034769 | basement membrane disassembly(GO:0034769) |
| 4.9 | 9.9 | GO:0017055 | negative regulation of RNA polymerase II transcriptional preinitiation complex assembly(GO:0017055) |
| 4.7 | 19.0 | GO:0016554 | cytidine to uridine editing(GO:0016554) |
| 4.7 | 14.2 | GO:0052047 | interaction with other organism via secreted substance involved in symbiotic interaction(GO:0052047) |
| 4.7 | 18.7 | GO:0061622 | glycolytic process through glucose-1-phosphate(GO:0061622) |
| 4.4 | 13.3 | GO:0070093 | negative regulation of glucagon secretion(GO:0070093) |
| 4.4 | 13.2 | GO:0090158 | endoplasmic reticulum membrane organization(GO:0090158) |
| 4.3 | 13.0 | GO:0061732 | mitochondrial acetyl-CoA biosynthetic process from pyruvate(GO:0061732) |
| 4.2 | 16.7 | GO:0010730 | negative regulation of hydrogen peroxide biosynthetic process(GO:0010730) |
| 4.2 | 8.4 | GO:0051692 | cellular oligosaccharide catabolic process(GO:0051692) |
| 4.2 | 20.8 | GO:0060298 | positive regulation of sarcomere organization(GO:0060298) |
| 4.2 | 16.6 | GO:1904220 | regulation of serine C-palmitoyltransferase activity(GO:1904220) |
| 4.1 | 12.4 | GO:0019417 | sulfur oxidation(GO:0019417) |
| 4.1 | 33.0 | GO:0007262 | STAT protein import into nucleus(GO:0007262) |
| 4.1 | 12.4 | GO:0055129 | L-proline biosynthetic process(GO:0055129) |
| 4.1 | 16.4 | GO:0035694 | mitochondrial protein catabolic process(GO:0035694) |
| 3.9 | 11.7 | GO:0086024 | adrenergic receptor signaling pathway involved in positive regulation of heart rate(GO:0086024) |
| 3.8 | 19.1 | GO:0086023 | adrenergic receptor signaling pathway involved in heart process(GO:0086023) |
| 3.8 | 11.3 | GO:0045163 | clustering of voltage-gated potassium channels(GO:0045163) |
| 3.8 | 11.3 | GO:0010133 | proline catabolic process to glutamate(GO:0010133) |
| 3.6 | 10.9 | GO:1904694 | negative regulation of vascular smooth muscle contraction(GO:1904694) |
| 3.6 | 10.9 | GO:0048014 | Tie signaling pathway(GO:0048014) |
| 3.6 | 14.4 | GO:2001295 | malonyl-CoA biosynthetic process(GO:2001295) |
| 3.6 | 18.0 | GO:2000173 | negative regulation of branching morphogenesis of a nerve(GO:2000173) |
| 3.5 | 31.1 | GO:1900454 | positive regulation of long term synaptic depression(GO:1900454) |
| 3.4 | 16.9 | GO:0006526 | arginine biosynthetic process(GO:0006526) |
| 3.4 | 10.1 | GO:0045819 | baroreceptor response to decreased systemic arterial blood pressure(GO:0001982) positive regulation of glycogen catabolic process(GO:0045819) |
| 3.3 | 36.5 | GO:0006123 | mitochondrial electron transport, cytochrome c to oxygen(GO:0006123) |
| 3.3 | 9.9 | GO:0061228 | mesonephros morphogenesis(GO:0061206) mesonephric nephron development(GO:0061215) mesonephric nephron morphogenesis(GO:0061228) mesenchymal stem cell maintenance involved in mesonephric nephron morphogenesis(GO:0061235) regulation of mesenchymal cell apoptotic process involved in mesonephric nephron morphogenesis(GO:0061295) negative regulation of mesenchymal cell apoptotic process involved in mesonephric nephron morphogenesis(GO:0061296) mesenchymal cell apoptotic process involved in mesonephric nephron morphogenesis(GO:1901146) |
| 3.3 | 16.4 | GO:0061709 | reticulophagy(GO:0061709) |
| 3.2 | 6.5 | GO:0097187 | dentinogenesis(GO:0097187) |
| 3.2 | 44.9 | GO:0043252 | sodium-independent organic anion transport(GO:0043252) |
| 3.1 | 9.2 | GO:0038108 | negative regulation of appetite by leptin-mediated signaling pathway(GO:0038108) |
| 3.0 | 9.1 | GO:0060086 | circadian temperature homeostasis(GO:0060086) |
| 3.0 | 39.0 | GO:0001778 | plasma membrane repair(GO:0001778) |
| 2.9 | 14.5 | GO:0015755 | carbohydrate utilization(GO:0009758) fructose transport(GO:0015755) |
| 2.9 | 8.6 | GO:0016203 | muscle attachment(GO:0016203) olfactory nerve morphogenesis(GO:0021627) olfactory nerve structural organization(GO:0021629) |
| 2.9 | 2.9 | GO:0045763 | negative regulation of cellular amino acid metabolic process(GO:0045763) |
| 2.8 | 19.9 | GO:0044341 | sodium-dependent phosphate transport(GO:0044341) |
| 2.8 | 5.6 | GO:0042631 | cellular response to water deprivation(GO:0042631) |
| 2.8 | 22.4 | GO:0034035 | purine ribonucleoside bisphosphate metabolic process(GO:0034035) 3'-phosphoadenosine 5'-phosphosulfate metabolic process(GO:0050427) |
| 2.8 | 13.9 | GO:0097052 | L-kynurenine metabolic process(GO:0097052) |
| 2.7 | 5.5 | GO:1904685 | positive regulation of metalloendopeptidase activity(GO:1904685) |
| 2.7 | 16.3 | GO:1901621 | negative regulation of smoothened signaling pathway involved in dorsal/ventral neural tube patterning(GO:1901621) |
| 2.7 | 27.2 | GO:0030049 | muscle filament sliding(GO:0030049) |
| 2.7 | 10.8 | GO:1903413 | cellular response to bile acid(GO:1903413) |
| 2.7 | 10.7 | GO:0043490 | malate-aspartate shuttle(GO:0043490) |
| 2.7 | 13.4 | GO:0000050 | urea cycle(GO:0000050) |
| 2.6 | 7.9 | GO:1903923 | protein processing in phagocytic vesicle(GO:1900756) regulation of establishment of T cell polarity(GO:1903903) regulation of protein processing in phagocytic vesicle(GO:1903921) positive regulation of protein processing in phagocytic vesicle(GO:1903923) |
| 2.6 | 25.6 | GO:0036444 | calcium ion transmembrane import into mitochondrion(GO:0036444) |
| 2.6 | 17.9 | GO:0016185 | synaptic vesicle budding from presynaptic endocytic zone membrane(GO:0016185) |
| 2.6 | 10.2 | GO:1902202 | regulation of hepatocyte growth factor receptor signaling pathway(GO:1902202) |
| 2.5 | 7.6 | GO:0003010 | voluntary skeletal muscle contraction(GO:0003010) twitch skeletal muscle contraction(GO:0014721) fast-twitch skeletal muscle fiber contraction(GO:0031443) |
| 2.5 | 15.1 | GO:0042427 | serotonin biosynthetic process(GO:0042427) primary amino compound biosynthetic process(GO:1901162) |
| 2.5 | 5.0 | GO:0002086 | diaphragm contraction(GO:0002086) |
| 2.5 | 7.5 | GO:0014016 | neuroblast differentiation(GO:0014016) |
| 2.5 | 7.4 | GO:0015015 | heparan sulfate proteoglycan biosynthetic process, enzymatic modification(GO:0015015) |
| 2.5 | 14.8 | GO:0015860 | purine nucleoside transmembrane transport(GO:0015860) |
| 2.5 | 7.4 | GO:0090247 | cell motility involved in somitogenic axis elongation(GO:0090247) regulation of cell motility involved in somitogenic axis elongation(GO:0090249) |
| 2.4 | 16.8 | GO:0010694 | positive regulation of alkaline phosphatase activity(GO:0010694) |
| 2.4 | 9.6 | GO:0010901 | regulation of very-low-density lipoprotein particle remodeling(GO:0010901) |
| 2.4 | 16.8 | GO:0021780 | oligodendrocyte cell fate specification(GO:0021778) oligodendrocyte cell fate commitment(GO:0021779) glial cell fate specification(GO:0021780) |
| 2.4 | 35.9 | GO:0042407 | cristae formation(GO:0042407) |
| 2.3 | 18.8 | GO:0042905 | 9-cis-retinoic acid biosynthetic process(GO:0042904) 9-cis-retinoic acid metabolic process(GO:0042905) |
| 2.3 | 11.7 | GO:0051594 | detection of carbohydrate stimulus(GO:0009730) detection of hexose stimulus(GO:0009732) detection of monosaccharide stimulus(GO:0034287) detection of glucose(GO:0051594) |
| 2.3 | 9.2 | GO:0002188 | translation reinitiation(GO:0002188) |
| 2.3 | 13.6 | GO:0003199 | endocardial cushion to mesenchymal transition involved in heart valve formation(GO:0003199) |
| 2.3 | 9.0 | GO:0042977 | regulation of activation of JAK2 kinase activity(GO:0010534) activation of JAK2 kinase activity(GO:0042977) negative regulation of activation of JAK2 kinase activity(GO:1902569) |
| 2.2 | 26.9 | GO:0006108 | malate metabolic process(GO:0006108) |
| 2.2 | 6.7 | GO:0019265 | glycine biosynthetic process, by transamination of glyoxylate(GO:0019265) |
| 2.2 | 6.6 | GO:0071529 | cementum mineralization(GO:0071529) |
| 2.2 | 13.2 | GO:0032439 | endosome localization(GO:0032439) |
| 2.2 | 6.6 | GO:0042196 | chlorinated hydrocarbon metabolic process(GO:0042196) halogenated hydrocarbon metabolic process(GO:0042197) |
| 2.2 | 17.5 | GO:2000346 | negative regulation of hepatocyte proliferation(GO:2000346) |
| 2.2 | 8.8 | GO:0038044 | transforming growth factor-beta secretion(GO:0038044) |
| 2.2 | 6.5 | GO:0002414 | immunoglobulin transcytosis in epithelial cells(GO:0002414) |
| 2.2 | 6.5 | GO:0033693 | neurofilament bundle assembly(GO:0033693) |
| 2.1 | 2.1 | GO:0035633 | maintenance of blood-brain barrier(GO:0035633) |
| 2.1 | 10.4 | GO:1904008 | response to monosodium glutamate(GO:1904008) |
| 2.1 | 12.3 | GO:0061303 | cornea development in camera-type eye(GO:0061303) |
| 2.0 | 22.5 | GO:0048739 | cardiac muscle fiber development(GO:0048739) |
| 2.0 | 10.2 | GO:1904970 | brush border assembly(GO:1904970) |
| 2.0 | 8.1 | GO:0006004 | fucose metabolic process(GO:0006004) |
| 2.0 | 10.1 | GO:0006556 | S-adenosylmethionine biosynthetic process(GO:0006556) |
| 2.0 | 7.9 | GO:0008050 | female courtship behavior(GO:0008050) |
| 2.0 | 11.9 | GO:0050748 | negative regulation of lipoprotein metabolic process(GO:0050748) |
| 2.0 | 5.9 | GO:1903588 | negative regulation of blood vessel endothelial cell proliferation involved in sprouting angiogenesis(GO:1903588) |
| 1.9 | 9.7 | GO:0014819 | regulation of skeletal muscle contraction(GO:0014819) |
| 1.9 | 15.5 | GO:0051694 | pointed-end actin filament capping(GO:0051694) |
| 1.9 | 13.6 | GO:0060174 | limb bud formation(GO:0060174) |
| 1.9 | 15.4 | GO:0044336 | canonical Wnt signaling pathway involved in negative regulation of apoptotic process(GO:0044336) |
| 1.9 | 5.7 | GO:0032788 | saturated monocarboxylic acid metabolic process(GO:0032788) unsaturated monocarboxylic acid metabolic process(GO:0032789) |
| 1.9 | 5.6 | GO:0061443 | endocardial cushion cell differentiation(GO:0061443) |
| 1.9 | 3.7 | GO:0032417 | positive regulation of sodium:proton antiporter activity(GO:0032417) |
| 1.8 | 7.3 | GO:0010999 | regulation of eIF2 alpha phosphorylation by heme(GO:0010999) |
| 1.8 | 10.7 | GO:0035426 | extracellular matrix-cell signaling(GO:0035426) |
| 1.8 | 16.0 | GO:0006703 | estrogen biosynthetic process(GO:0006703) |
| 1.8 | 3.5 | GO:0035723 | interleukin-15-mediated signaling pathway(GO:0035723) cellular response to interleukin-15(GO:0071350) |
| 1.7 | 7.0 | GO:0006616 | SRP-dependent cotranslational protein targeting to membrane, translocation(GO:0006616) negative regulation of translational elongation(GO:0045900) |
| 1.7 | 47.0 | GO:0001580 | detection of chemical stimulus involved in sensory perception of bitter taste(GO:0001580) |
| 1.7 | 6.9 | GO:0000965 | mitochondrial RNA 3'-end processing(GO:0000965) |
| 1.7 | 3.4 | GO:0007621 | negative regulation of female receptivity(GO:0007621) |
| 1.7 | 5.1 | GO:1900135 | positive regulation of renin secretion into blood stream(GO:1900135) |
| 1.7 | 5.1 | GO:0030210 | heparin biosynthetic process(GO:0030210) |
| 1.7 | 5.1 | GO:0035483 | gastric emptying(GO:0035483) |
| 1.7 | 5.1 | GO:0019626 | short-chain fatty acid catabolic process(GO:0019626) |
| 1.6 | 3.3 | GO:0048861 | leukemia inhibitory factor signaling pathway(GO:0048861) |
| 1.6 | 8.2 | GO:0048625 | myoblast fate commitment(GO:0048625) |
| 1.6 | 6.5 | GO:0070346 | positive regulation of fat cell proliferation(GO:0070346) negative regulation of glucose import in response to insulin stimulus(GO:2001274) |
| 1.6 | 8.1 | GO:0002159 | desmosome assembly(GO:0002159) |
| 1.6 | 11.4 | GO:2001135 | regulation of endocytic recycling(GO:2001135) |
| 1.6 | 4.9 | GO:0051611 | negative regulation of neurotransmitter uptake(GO:0051581) regulation of serotonin uptake(GO:0051611) negative regulation of serotonin uptake(GO:0051612) |
| 1.6 | 8.0 | GO:0086073 | cardiac muscle cell-cardiac muscle cell adhesion(GO:0086042) bundle of His cell-Purkinje myocyte adhesion involved in cell communication(GO:0086073) |
| 1.6 | 6.3 | GO:0019072 | viral genome packaging(GO:0019072) viral RNA genome packaging(GO:0019074) |
| 1.6 | 7.9 | GO:0000066 | mitochondrial ornithine transport(GO:0000066) |
| 1.6 | 6.3 | GO:0036309 | protein localization to M-band(GO:0036309) protein localization to T-tubule(GO:0036371) |
| 1.6 | 4.7 | GO:0071691 | cardiac muscle thin filament assembly(GO:0071691) |
| 1.6 | 14.0 | GO:0019695 | choline metabolic process(GO:0019695) |
| 1.6 | 9.3 | GO:0060316 | positive regulation of ryanodine-sensitive calcium-release channel activity(GO:0060316) |
| 1.5 | 4.6 | GO:0018199 | peptidyl-glutamine modification(GO:0018199) |
| 1.5 | 4.6 | GO:0006574 | valine catabolic process(GO:0006574) |
| 1.5 | 4.6 | GO:2000437 | regulation of monocyte extravasation(GO:2000437) |
| 1.5 | 6.1 | GO:1903575 | cornified envelope assembly(GO:1903575) |
| 1.5 | 4.6 | GO:0002378 | immunoglobulin biosynthetic process(GO:0002378) |
| 1.5 | 4.5 | GO:0008592 | release of cytoplasmic sequestered NF-kappaB(GO:0008588) regulation of Toll signaling pathway(GO:0008592) negative regulation of Toll signaling pathway(GO:0045751) |
| 1.5 | 10.4 | GO:0045906 | negative regulation of vasoconstriction(GO:0045906) |
| 1.5 | 5.9 | GO:0060474 | positive regulation of sperm motility involved in capacitation(GO:0060474) |
| 1.5 | 5.9 | GO:1905230 | carbohydrate export(GO:0033231) daunorubicin transport(GO:0043215) response to borneol(GO:1905230) cellular response to borneol(GO:1905231) response to codeine(GO:1905233) response to quercetin(GO:1905235) drug transport across blood-brain barrier(GO:1990962) establishment of blood-retinal barrier(GO:1990963) |
| 1.5 | 7.3 | GO:0072513 | positive regulation of secondary heart field cardioblast proliferation(GO:0072513) |
| 1.4 | 7.2 | GO:0032364 | oxygen homeostasis(GO:0032364) |
| 1.4 | 8.5 | GO:0051387 | negative regulation of neurotrophin TRK receptor signaling pathway(GO:0051387) |
| 1.4 | 22.5 | GO:0006744 | ubiquinone biosynthetic process(GO:0006744) quinone biosynthetic process(GO:1901663) |
| 1.4 | 4.2 | GO:2001045 | negative regulation of integrin-mediated signaling pathway(GO:2001045) |
| 1.4 | 19.6 | GO:0034285 | response to sucrose(GO:0009744) response to disaccharide(GO:0034285) |
| 1.4 | 5.6 | GO:0034436 | glycoprotein transport(GO:0034436) |
| 1.4 | 4.1 | GO:1903699 | tarsal gland development(GO:1903699) |
| 1.4 | 4.1 | GO:0006117 | acetaldehyde metabolic process(GO:0006117) |
| 1.4 | 4.1 | GO:0071874 | cellular response to norepinephrine stimulus(GO:0071874) |
| 1.4 | 4.1 | GO:0046167 | glycerol-3-phosphate biosynthetic process(GO:0046167) |
| 1.3 | 2.7 | GO:0098758 | response to interleukin-8(GO:0098758) cellular response to interleukin-8(GO:0098759) |
| 1.3 | 9.3 | GO:0034551 | respiratory chain complex III assembly(GO:0017062) mitochondrial respiratory chain complex III assembly(GO:0034551) mitochondrial respiratory chain complex III biogenesis(GO:0097033) |
| 1.3 | 4.0 | GO:0018916 | nitrobenzene metabolic process(GO:0018916) |
| 1.3 | 5.2 | GO:0042998 | positive regulation of Golgi to plasma membrane protein transport(GO:0042998) |
| 1.3 | 10.4 | GO:0048840 | otolith development(GO:0048840) |
| 1.3 | 22.0 | GO:0051044 | positive regulation of membrane protein ectodomain proteolysis(GO:0051044) |
| 1.3 | 5.1 | GO:0061643 | vagus nerve development(GO:0021564) chemorepulsion of axon(GO:0061643) |
| 1.3 | 3.8 | GO:0036112 | medium-chain fatty-acyl-CoA metabolic process(GO:0036112) |
| 1.3 | 3.8 | GO:0015882 | L-ascorbic acid transport(GO:0015882) transepithelial L-ascorbic acid transport(GO:0070904) |
| 1.3 | 6.3 | GO:0070541 | response to nickel cation(GO:0010045) response to platinum ion(GO:0070541) |
| 1.2 | 3.7 | GO:0019287 | isopentenyl diphosphate biosynthetic process, mevalonate pathway(GO:0019287) |
| 1.2 | 4.9 | GO:0051005 | negative regulation of lipoprotein lipase activity(GO:0051005) |
| 1.2 | 27.0 | GO:0097503 | sialylation(GO:0097503) |
| 1.2 | 8.5 | GO:0071073 | positive regulation of phospholipid biosynthetic process(GO:0071073) |
| 1.2 | 3.6 | GO:0010841 | positive regulation of circadian sleep/wake cycle, wakefulness(GO:0010841) |
| 1.2 | 3.5 | GO:0070563 | negative regulation of vitamin D receptor signaling pathway(GO:0070563) |
| 1.2 | 4.7 | GO:0010615 | positive regulation of cardiac muscle adaptation(GO:0010615) positive regulation of cardiac muscle hypertrophy in response to stress(GO:1903244) |
| 1.2 | 3.5 | GO:0000105 | histidine biosynthetic process(GO:0000105) |
| 1.2 | 3.5 | GO:0002930 | trabecular meshwork development(GO:0002930) |
| 1.2 | 3.5 | GO:0042125 | protein glycosylation at cell surface(GO:0033575) protein galactosylation at cell surface(GO:0033580) protein galactosylation(GO:0042125) |
| 1.2 | 4.6 | GO:0009071 | serine family amino acid catabolic process(GO:0009071) |
| 1.2 | 9.3 | GO:0030321 | transepithelial chloride transport(GO:0030321) |
| 1.2 | 2.3 | GO:0035973 | aggrephagy(GO:0035973) |
| 1.1 | 3.4 | GO:0006045 | N-acetylglucosamine biosynthetic process(GO:0006045) N-acetylneuraminate biosynthetic process(GO:0046380) glucosamine-containing compound biosynthetic process(GO:1901073) |
| 1.1 | 9.2 | GO:0003406 | retinal pigment epithelium development(GO:0003406) |
| 1.1 | 10.2 | GO:0060347 | heart trabecula formation(GO:0060347) |
| 1.1 | 4.5 | GO:1900864 | mitochondrial tRNA modification(GO:0070900) mitochondrial RNA modification(GO:1900864) |
| 1.1 | 14.5 | GO:0015693 | magnesium ion transport(GO:0015693) |
| 1.1 | 4.4 | GO:1902514 | regulation of calcium ion transmembrane transport via high voltage-gated calcium channel(GO:1902514) |
| 1.1 | 4.4 | GO:0032348 | negative regulation of aldosterone metabolic process(GO:0032345) negative regulation of aldosterone biosynthetic process(GO:0032348) negative regulation of cortisol biosynthetic process(GO:2000065) |
| 1.1 | 4.4 | GO:0071638 | negative regulation of monocyte chemotactic protein-1 production(GO:0071638) |
| 1.1 | 28.4 | GO:0019373 | epoxygenase P450 pathway(GO:0019373) |
| 1.1 | 6.5 | GO:0071918 | urea transmembrane transport(GO:0071918) |
| 1.1 | 12.8 | GO:0007614 | short-term memory(GO:0007614) |
| 1.1 | 5.3 | GO:0015889 | cobalamin transport(GO:0015889) |
| 1.1 | 8.5 | GO:0034196 | acylglycerol transport(GO:0034196) triglyceride transport(GO:0034197) |
| 1.1 | 1.1 | GO:1904684 | negative regulation of metalloendopeptidase activity(GO:1904684) negative regulation of metallopeptidase activity(GO:1905049) |
| 1.1 | 31.8 | GO:0006817 | phosphate ion transport(GO:0006817) |
| 1.1 | 20.0 | GO:0030449 | regulation of complement activation(GO:0030449) |
| 1.1 | 5.3 | GO:0001582 | detection of chemical stimulus involved in sensory perception of sweet taste(GO:0001582) |
| 1.0 | 3.1 | GO:0002036 | regulation of L-glutamate transport(GO:0002036) |
| 1.0 | 2.1 | GO:0034241 | positive regulation of macrophage fusion(GO:0034241) |
| 1.0 | 3.1 | GO:0043323 | positive regulation of natural killer cell degranulation(GO:0043323) |
| 1.0 | 16.4 | GO:0050667 | homocysteine metabolic process(GO:0050667) |
| 1.0 | 6.1 | GO:0032264 | IMP salvage(GO:0032264) |
| 1.0 | 10.2 | GO:0010040 | response to iron(II) ion(GO:0010040) |
| 1.0 | 12.2 | GO:2000188 | regulation of cholesterol homeostasis(GO:2000188) |
| 1.0 | 4.1 | GO:0043587 | tongue morphogenesis(GO:0043587) |
| 1.0 | 11.1 | GO:0000338 | protein deneddylation(GO:0000338) |
| 1.0 | 7.1 | GO:0047484 | regulation of response to osmotic stress(GO:0047484) |
| 1.0 | 25.1 | GO:0017144 | drug metabolic process(GO:0017144) |
| 1.0 | 3.0 | GO:0090074 | negative regulation of protein homodimerization activity(GO:0090074) |
| 1.0 | 5.0 | GO:2000323 | negative regulation of glucocorticoid receptor signaling pathway(GO:2000323) |
| 1.0 | 19.0 | GO:0010614 | negative regulation of cardiac muscle hypertrophy(GO:0010614) |
| 1.0 | 7.0 | GO:0097428 | protein maturation by iron-sulfur cluster transfer(GO:0097428) |
| 1.0 | 6.9 | GO:0006685 | sphingomyelin catabolic process(GO:0006685) |
| 1.0 | 2.0 | GO:0042668 | auditory receptor cell fate determination(GO:0042668) |
| 1.0 | 3.9 | GO:2000124 | regulation of endocannabinoid signaling pathway(GO:2000124) |
| 1.0 | 11.7 | GO:0016338 | calcium-independent cell-cell adhesion via plasma membrane cell-adhesion molecules(GO:0016338) |
| 1.0 | 1.9 | GO:1902746 | regulation of lens fiber cell differentiation(GO:1902746) |
| 1.0 | 12.5 | GO:0006570 | tyrosine metabolic process(GO:0006570) |
| 1.0 | 3.9 | GO:0038165 | oncostatin-M-mediated signaling pathway(GO:0038165) |
| 1.0 | 7.7 | GO:0035878 | nail development(GO:0035878) |
| 1.0 | 6.7 | GO:0043416 | regulation of skeletal muscle tissue regeneration(GO:0043416) |
| 1.0 | 8.6 | GO:0035372 | protein localization to microtubule(GO:0035372) |
| 0.9 | 6.6 | GO:0010808 | positive regulation of synaptic vesicle priming(GO:0010808) |
| 0.9 | 7.5 | GO:0051043 | regulation of membrane protein ectodomain proteolysis(GO:0051043) |
| 0.9 | 6.5 | GO:0035360 | positive regulation of peroxisome proliferator activated receptor signaling pathway(GO:0035360) |
| 0.9 | 5.6 | GO:0072396 | response to cell cycle checkpoint signaling(GO:0072396) response to DNA integrity checkpoint signaling(GO:0072402) response to DNA damage checkpoint signaling(GO:0072423) |
| 0.9 | 2.8 | GO:0044208 | 'de novo' AMP biosynthetic process(GO:0044208) |
| 0.9 | 2.8 | GO:0042663 | regulation of endodermal cell fate specification(GO:0042663) |
| 0.9 | 3.7 | GO:0008582 | regulation of synaptic growth at neuromuscular junction(GO:0008582) |
| 0.9 | 6.5 | GO:0045196 | establishment or maintenance of neuroblast polarity(GO:0045196) establishment of neuroblast polarity(GO:0045200) |
| 0.9 | 10.2 | GO:0048934 | peripheral nervous system neuron differentiation(GO:0048934) peripheral nervous system neuron development(GO:0048935) |
| 0.9 | 1.9 | GO:0042222 | interleukin-1 biosynthetic process(GO:0042222) |
| 0.9 | 25.9 | GO:0035025 | positive regulation of Rho protein signal transduction(GO:0035025) |
| 0.9 | 7.3 | GO:0034454 | microtubule anchoring at centrosome(GO:0034454) |
| 0.9 | 4.6 | GO:1902162 | regulation of DNA damage response, signal transduction by p53 class mediator resulting in transcription of p21 class mediator(GO:1902162) |
| 0.9 | 2.7 | GO:0030643 | cellular phosphate ion homeostasis(GO:0030643) cellular trivalent inorganic anion homeostasis(GO:0072502) |
| 0.9 | 2.7 | GO:1990737 | regulation of endoplasmic reticulum stress-induced eIF2 alpha phosphorylation(GO:0060734) response to manganese-induced endoplasmic reticulum stress(GO:1990737) |
| 0.9 | 7.3 | GO:0006657 | CDP-choline pathway(GO:0006657) |
| 0.9 | 10.0 | GO:0086069 | bundle of His cell to Purkinje myocyte communication(GO:0086069) |
| 0.9 | 4.5 | GO:0044861 | protein localization to plasma membrane raft(GO:0044860) protein transport into plasma membrane raft(GO:0044861) |
| 0.9 | 24.3 | GO:0010831 | positive regulation of myotube differentiation(GO:0010831) |
| 0.9 | 2.7 | GO:0042357 | thiamine diphosphate metabolic process(GO:0042357) |
| 0.9 | 5.3 | GO:0018344 | protein geranylgeranylation(GO:0018344) |
| 0.9 | 2.6 | GO:2000481 | positive regulation of cAMP-dependent protein kinase activity(GO:2000481) |
| 0.9 | 1.7 | GO:1901165 | positive regulation of trophoblast cell migration(GO:1901165) |
| 0.9 | 4.4 | GO:0045990 | carbon catabolite regulation of transcription(GO:0045990) |
| 0.9 | 4.4 | GO:1903071 | positive regulation of ER-associated ubiquitin-dependent protein catabolic process(GO:1903071) |
| 0.9 | 4.3 | GO:0015801 | aromatic amino acid transport(GO:0015801) |
| 0.9 | 5.2 | GO:2000291 | regulation of myoblast proliferation(GO:2000291) |
| 0.9 | 2.6 | GO:0071847 | TNFSF11-mediated signaling pathway(GO:0071847) negative regulation of osteoclast development(GO:2001205) |
| 0.9 | 15.4 | GO:2001014 | regulation of skeletal muscle cell differentiation(GO:2001014) |
| 0.9 | 3.4 | GO:0097117 | guanylate kinase-associated protein clustering(GO:0097117) |
| 0.8 | 2.5 | GO:0061734 | parkin-mediated mitophagy in response to mitochondrial depolarization(GO:0061734) |
| 0.8 | 6.8 | GO:0007182 | common-partner SMAD protein phosphorylation(GO:0007182) |
| 0.8 | 4.2 | GO:0043152 | induction of bacterial agglutination(GO:0043152) |
| 0.8 | 2.5 | GO:1903378 | positive regulation of oxidative stress-induced neuron intrinsic apoptotic signaling pathway(GO:1903378) |
| 0.8 | 7.5 | GO:0048280 | vesicle fusion with Golgi apparatus(GO:0048280) |
| 0.8 | 1.7 | GO:0021912 | regulation of transcription from RNA polymerase II promoter involved in spinal cord motor neuron fate specification(GO:0021912) regulation of transcription from RNA polymerase II promoter involved in ventral spinal cord interneuron specification(GO:0021913) |
| 0.8 | 3.3 | GO:0060124 | regulation of growth hormone secretion(GO:0060123) positive regulation of growth hormone secretion(GO:0060124) |
| 0.8 | 6.6 | GO:1904177 | regulation of adipose tissue development(GO:1904177) |
| 0.8 | 8.3 | GO:0033539 | fatty acid beta-oxidation using acyl-CoA dehydrogenase(GO:0033539) |
| 0.8 | 4.9 | GO:0010991 | negative regulation of SMAD protein complex assembly(GO:0010991) |
| 0.8 | 4.1 | GO:0007512 | adult heart development(GO:0007512) |
| 0.8 | 8.1 | GO:0006390 | transcription from mitochondrial promoter(GO:0006390) |
| 0.8 | 3.3 | GO:0035992 | tendon cell differentiation(GO:0035990) tendon formation(GO:0035992) |
| 0.8 | 3.2 | GO:0006642 | triglyceride mobilization(GO:0006642) |
| 0.8 | 1.6 | GO:0090289 | regulation of osteoclast proliferation(GO:0090289) |
| 0.8 | 4.0 | GO:0032224 | positive regulation of synaptic transmission, cholinergic(GO:0032224) |
| 0.8 | 2.4 | GO:0097156 | fasciculation of motor neuron axon(GO:0097156) |
| 0.8 | 2.4 | GO:0006421 | asparaginyl-tRNA aminoacylation(GO:0006421) |
| 0.8 | 7.1 | GO:0097105 | presynaptic membrane assembly(GO:0097105) |
| 0.8 | 25.8 | GO:0048384 | retinoic acid receptor signaling pathway(GO:0048384) |
| 0.8 | 6.9 | GO:0031034 | myosin filament assembly(GO:0031034) |
| 0.8 | 3.8 | GO:0032914 | positive regulation of transforming growth factor beta1 production(GO:0032914) |
| 0.8 | 3.8 | GO:0019243 | methylglyoxal catabolic process to D-lactate via S-lactoyl-glutathione(GO:0019243) methylglyoxal catabolic process(GO:0051596) methylglyoxal catabolic process to lactate(GO:0061727) |
| 0.8 | 5.3 | GO:0071340 | skeletal muscle acetylcholine-gated channel clustering(GO:0071340) |
| 0.8 | 3.8 | GO:1903054 | negative regulation of extracellular matrix organization(GO:1903054) |
| 0.7 | 12.6 | GO:0070296 | sarcoplasmic reticulum calcium ion transport(GO:0070296) |
| 0.7 | 2.2 | GO:0033615 | mitochondrial proton-transporting ATP synthase complex assembly(GO:0033615) |
| 0.7 | 1.5 | GO:0090310 | negative regulation of methylation-dependent chromatin silencing(GO:0090310) |
| 0.7 | 5.9 | GO:0042866 | pyruvate biosynthetic process(GO:0042866) |
| 0.7 | 3.7 | GO:0061179 | negative regulation of insulin secretion involved in cellular response to glucose stimulus(GO:0061179) |
| 0.7 | 25.2 | GO:0071526 | semaphorin-plexin signaling pathway(GO:0071526) |
| 0.7 | 5.7 | GO:0090110 | cargo loading into COPII-coated vesicle(GO:0090110) |
| 0.7 | 2.9 | GO:0061526 | acetylcholine secretion(GO:0061526) |
| 0.7 | 5.7 | GO:1990035 | calcium ion import across plasma membrane(GO:0098703) calcium ion import into cell(GO:1990035) |
| 0.7 | 19.9 | GO:0035428 | hexose transmembrane transport(GO:0035428) glucose transmembrane transport(GO:1904659) |
| 0.7 | 3.5 | GO:0007217 | tachykinin receptor signaling pathway(GO:0007217) |
| 0.7 | 2.8 | GO:0048752 | semicircular canal morphogenesis(GO:0048752) |
| 0.7 | 2.1 | GO:0090283 | regulation of protein glycosylation in Golgi(GO:0090283) |
| 0.7 | 5.5 | GO:0035021 | negative regulation of Rac protein signal transduction(GO:0035021) |
| 0.7 | 6.2 | GO:0044331 | cell-cell adhesion mediated by cadherin(GO:0044331) |
| 0.7 | 5.5 | GO:0010700 | negative regulation of norepinephrine secretion(GO:0010700) |
| 0.7 | 4.1 | GO:0006987 | activation of signaling protein activity involved in unfolded protein response(GO:0006987) |
| 0.7 | 2.7 | GO:0046338 | phosphatidylethanolamine catabolic process(GO:0046338) |
| 0.7 | 6.1 | GO:0070886 | positive regulation of calcineurin-NFAT signaling cascade(GO:0070886) |
| 0.7 | 6.8 | GO:0046929 | negative regulation of neurotransmitter secretion(GO:0046929) |
| 0.7 | 1.4 | GO:1901739 | regulation of myoblast fusion(GO:1901739) |
| 0.7 | 3.4 | GO:0006528 | asparagine metabolic process(GO:0006528) |
| 0.7 | 2.7 | GO:0006428 | isoleucyl-tRNA aminoacylation(GO:0006428) |
| 0.7 | 3.4 | GO:0086100 | endothelin receptor signaling pathway(GO:0086100) |
| 0.7 | 11.4 | GO:0035641 | locomotory exploration behavior(GO:0035641) |
| 0.7 | 4.0 | GO:0006449 | regulation of translational termination(GO:0006449) |
| 0.7 | 2.6 | GO:0006069 | ethanol oxidation(GO:0006069) |
| 0.7 | 1.3 | GO:0018171 | peptidyl-cysteine oxidation(GO:0018171) |
| 0.7 | 2.0 | GO:0038172 | interleukin-33-mediated signaling pathway(GO:0038172) |
| 0.7 | 21.7 | GO:0007026 | negative regulation of microtubule depolymerization(GO:0007026) |
| 0.6 | 5.2 | GO:0003096 | renal sodium ion transport(GO:0003096) renal sodium ion absorption(GO:0070294) |
| 0.6 | 7.8 | GO:0033617 | mitochondrial respiratory chain complex IV assembly(GO:0033617) mitochondrial respiratory chain complex IV biogenesis(GO:0097034) |
| 0.6 | 2.6 | GO:0097113 | AMPA glutamate receptor clustering(GO:0097113) |
| 0.6 | 10.3 | GO:0003334 | keratinocyte development(GO:0003334) |
| 0.6 | 30.2 | GO:1901379 | regulation of potassium ion transmembrane transport(GO:1901379) |
| 0.6 | 6.4 | GO:0006228 | UTP biosynthetic process(GO:0006228) |
| 0.6 | 5.8 | GO:0090114 | COPII-coated vesicle budding(GO:0090114) |
| 0.6 | 4.5 | GO:0009750 | response to fructose(GO:0009750) |
| 0.6 | 6.8 | GO:0019720 | Mo-molybdopterin cofactor biosynthetic process(GO:0006777) Mo-molybdopterin cofactor metabolic process(GO:0019720) |
| 0.6 | 1.8 | GO:0048619 | embryonic hindgut morphogenesis(GO:0048619) |
| 0.6 | 34.9 | GO:0022900 | electron transport chain(GO:0022900) |
| 0.6 | 9.2 | GO:0035269 | protein O-linked mannosylation(GO:0035269) |
| 0.6 | 30.5 | GO:0006635 | fatty acid beta-oxidation(GO:0006635) |
| 0.6 | 1.8 | GO:0090481 | pyrimidine nucleotide-sugar transmembrane transport(GO:0090481) |
| 0.6 | 6.6 | GO:0051923 | sulfation(GO:0051923) |
| 0.6 | 6.6 | GO:0006107 | oxaloacetate metabolic process(GO:0006107) |
| 0.6 | 5.4 | GO:0045634 | regulation of melanocyte differentiation(GO:0045634) |
| 0.6 | 1.2 | GO:0008627 | intrinsic apoptotic signaling pathway in response to osmotic stress(GO:0008627) |
| 0.6 | 1.2 | GO:0001828 | inner cell mass cellular morphogenesis(GO:0001828) |
| 0.6 | 7.2 | GO:0031340 | positive regulation of vesicle fusion(GO:0031340) |
| 0.6 | 3.0 | GO:1990592 | protein polyufmylation(GO:1990564) protein K69-linked ufmylation(GO:1990592) |
| 0.6 | 5.4 | GO:0007000 | nucleolus organization(GO:0007000) |
| 0.6 | 19.5 | GO:1903959 | regulation of anion transmembrane transport(GO:1903959) |
| 0.6 | 5.8 | GO:1990440 | positive regulation of transcription from RNA polymerase II promoter in response to endoplasmic reticulum stress(GO:1990440) |
| 0.6 | 0.6 | GO:0070662 | mast cell proliferation(GO:0070662) regulation of mast cell proliferation(GO:0070666) positive regulation of mast cell proliferation(GO:0070668) |
| 0.6 | 1.8 | GO:0021570 | rhombomere 4 development(GO:0021570) |
| 0.6 | 2.9 | GO:0045297 | mating plug formation(GO:0042628) post-mating behavior(GO:0045297) |
| 0.6 | 4.6 | GO:0009128 | purine nucleoside monophosphate catabolic process(GO:0009128) |
| 0.6 | 18.5 | GO:0055013 | cardiac muscle cell development(GO:0055013) |
| 0.6 | 4.6 | GO:1901386 | negative regulation of voltage-gated calcium channel activity(GO:1901386) |
| 0.6 | 2.9 | GO:0050651 | dermatan sulfate proteoglycan biosynthetic process(GO:0050651) |
| 0.6 | 2.3 | GO:0060708 | spongiotrophoblast differentiation(GO:0060708) |
| 0.6 | 1.1 | GO:0048294 | negative regulation of isotype switching to IgE isotypes(GO:0048294) |
| 0.6 | 3.4 | GO:0030035 | microspike assembly(GO:0030035) |
| 0.6 | 1.1 | GO:1903830 | magnesium ion transmembrane transport(GO:1903830) |
| 0.6 | 2.8 | GO:0006432 | phenylalanyl-tRNA aminoacylation(GO:0006432) |
| 0.6 | 2.2 | GO:0006741 | NADP biosynthetic process(GO:0006741) |
| 0.6 | 16.7 | GO:0018345 | protein palmitoylation(GO:0018345) |
| 0.6 | 5.0 | GO:0046007 | negative regulation of activated T cell proliferation(GO:0046007) |
| 0.6 | 6.1 | GO:0070863 | positive regulation of protein exit from endoplasmic reticulum(GO:0070863) |
| 0.6 | 1.7 | GO:0030473 | nucleokinesis involved in cell motility in cerebral cortex radial glia guided migration(GO:0021817) nuclear migration along microtubule(GO:0030473) nuclear matrix anchoring at nuclear membrane(GO:0090292) |
| 0.5 | 698.9 | GO:0050911 | detection of chemical stimulus involved in sensory perception of smell(GO:0050911) |
| 0.5 | 13.5 | GO:0030239 | myofibril assembly(GO:0030239) |
| 0.5 | 1.1 | GO:0060373 | regulation of ventricular cardiac muscle cell membrane depolarization(GO:0060373) |
| 0.5 | 7.5 | GO:0030497 | fatty acid elongation(GO:0030497) |
| 0.5 | 4.8 | GO:0071494 | cellular response to UV-C(GO:0071494) |
| 0.5 | 2.1 | GO:0072092 | ureteric bud invasion(GO:0072092) |
| 0.5 | 1.6 | GO:0045040 | protein import into mitochondrial outer membrane(GO:0045040) |
| 0.5 | 1.0 | GO:2000097 | regulation of smooth muscle cell-matrix adhesion(GO:2000097) |
| 0.5 | 6.3 | GO:0052695 | cellular glucuronidation(GO:0052695) |
| 0.5 | 2.6 | GO:0006782 | protoporphyrinogen IX biosynthetic process(GO:0006782) |
| 0.5 | 7.8 | GO:0006544 | glycine metabolic process(GO:0006544) |
| 0.5 | 1.0 | GO:0034137 | positive regulation of toll-like receptor 2 signaling pathway(GO:0034137) |
| 0.5 | 8.3 | GO:0033147 | negative regulation of intracellular estrogen receptor signaling pathway(GO:0033147) |
| 0.5 | 1.0 | GO:1905244 | regulation of modification of synaptic structure(GO:1905244) |
| 0.5 | 3.1 | GO:0060591 | chondroblast differentiation(GO:0060591) |
| 0.5 | 0.5 | GO:1905217 | response to astaxanthin(GO:1905217) |
| 0.5 | 8.1 | GO:0008053 | mitochondrial fusion(GO:0008053) |
| 0.5 | 4.5 | GO:0006145 | purine nucleobase catabolic process(GO:0006145) |
| 0.5 | 3.0 | GO:2001185 | regulation of CD8-positive, alpha-beta T cell activation(GO:2001185) |
| 0.5 | 7.0 | GO:0032981 | NADH dehydrogenase complex assembly(GO:0010257) mitochondrial respiratory chain complex I assembly(GO:0032981) mitochondrial respiratory chain complex I biogenesis(GO:0097031) |
| 0.5 | 5.9 | GO:0042492 | gamma-delta T cell differentiation(GO:0042492) |
| 0.5 | 2.0 | GO:0070086 | ubiquitin-dependent endocytosis(GO:0070086) |
| 0.5 | 1.4 | GO:1902714 | negative regulation of interferon-gamma secretion(GO:1902714) |
| 0.5 | 2.4 | GO:0071409 | cellular response to cycloheximide(GO:0071409) |
| 0.5 | 1.9 | GO:0042780 | tRNA 3'-end processing(GO:0042780) |
| 0.5 | 1.9 | GO:0009992 | cellular water homeostasis(GO:0009992) |
| 0.5 | 1.4 | GO:0030050 | vesicle transport along actin filament(GO:0030050) actin filament-based transport(GO:0099515) |
| 0.5 | 2.4 | GO:0048070 | regulation of developmental pigmentation(GO:0048070) |
| 0.5 | 20.7 | GO:0021762 | substantia nigra development(GO:0021762) |
| 0.5 | 7.5 | GO:0009251 | glycogen catabolic process(GO:0005980) glucan catabolic process(GO:0009251) cellular polysaccharide catabolic process(GO:0044247) |
| 0.5 | 4.2 | GO:0001886 | endothelial cell morphogenesis(GO:0001886) |
| 0.5 | 1.4 | GO:0045423 | granulocyte macrophage colony-stimulating factor biosynthetic process(GO:0042253) regulation of granulocyte macrophage colony-stimulating factor biosynthetic process(GO:0045423) |
| 0.5 | 5.9 | GO:0010866 | regulation of triglyceride biosynthetic process(GO:0010866) |
| 0.5 | 5.0 | GO:0043508 | negative regulation of JUN kinase activity(GO:0043508) |
| 0.4 | 2.2 | GO:0015866 | ADP transport(GO:0015866) |
| 0.4 | 10.1 | GO:0070584 | mitochondrion morphogenesis(GO:0070584) |
| 0.4 | 3.5 | GO:0070327 | thyroid hormone transport(GO:0070327) |
| 0.4 | 2.6 | GO:0034144 | negative regulation of toll-like receptor 4 signaling pathway(GO:0034144) |
| 0.4 | 4.3 | GO:0060088 | auditory receptor cell stereocilium organization(GO:0060088) |
| 0.4 | 3.0 | GO:0043653 | mitochondrial fragmentation involved in apoptotic process(GO:0043653) |
| 0.4 | 2.2 | GO:0002725 | negative regulation of T cell cytokine production(GO:0002725) |
| 0.4 | 44.4 | GO:0009408 | response to heat(GO:0009408) |
| 0.4 | 6.0 | GO:0000042 | protein targeting to Golgi(GO:0000042) |
| 0.4 | 4.2 | GO:0042659 | regulation of cell fate specification(GO:0042659) |
| 0.4 | 1.3 | GO:0032510 | endosome to lysosome transport via multivesicular body sorting pathway(GO:0032510) |
| 0.4 | 10.1 | GO:0015985 | energy coupled proton transport, down electrochemical gradient(GO:0015985) ATP synthesis coupled proton transport(GO:0015986) |
| 0.4 | 2.1 | GO:0070164 | negative regulation of adiponectin secretion(GO:0070164) |
| 0.4 | 6.2 | GO:0010248 | establishment or maintenance of transmembrane electrochemical gradient(GO:0010248) |
| 0.4 | 3.7 | GO:2000310 | regulation of N-methyl-D-aspartate selective glutamate receptor activity(GO:2000310) |
| 0.4 | 2.1 | GO:0031914 | negative regulation of synaptic plasticity(GO:0031914) |
| 0.4 | 3.7 | GO:0031274 | regulation of pseudopodium assembly(GO:0031272) positive regulation of pseudopodium assembly(GO:0031274) |
| 0.4 | 5.7 | GO:0032482 | Rab protein signal transduction(GO:0032482) |
| 0.4 | 9.7 | GO:0010738 | regulation of protein kinase A signaling(GO:0010738) |
| 0.4 | 2.0 | GO:0051182 | coenzyme transport(GO:0051182) |
| 0.4 | 4.0 | GO:0060040 | retinal bipolar neuron differentiation(GO:0060040) |
| 0.4 | 5.5 | GO:0009062 | fatty acid catabolic process(GO:0009062) |
| 0.4 | 3.5 | GO:0007176 | regulation of epidermal growth factor-activated receptor activity(GO:0007176) |
| 0.4 | 12.5 | GO:0061098 | positive regulation of protein tyrosine kinase activity(GO:0061098) |
| 0.4 | 2.3 | GO:0060721 | regulation of spongiotrophoblast cell proliferation(GO:0060721) regulation of cell proliferation involved in embryonic placenta development(GO:0060723) |
| 0.4 | 1.6 | GO:0070940 | dephosphorylation of RNA polymerase II C-terminal domain(GO:0070940) |
| 0.4 | 4.6 | GO:0010801 | negative regulation of peptidyl-threonine phosphorylation(GO:0010801) |
| 0.4 | 0.4 | GO:0072076 | nephrogenic mesenchyme development(GO:0072076) |
| 0.4 | 1.9 | GO:0045218 | zonula adherens maintenance(GO:0045218) |
| 0.4 | 0.8 | GO:0006851 | mitochondrial calcium ion transport(GO:0006851) |
| 0.4 | 2.6 | GO:1902004 | positive regulation of beta-amyloid formation(GO:1902004) positive regulation of amyloid precursor protein catabolic process(GO:1902993) |
| 0.4 | 0.8 | GO:0010519 | negative regulation of phospholipase activity(GO:0010519) |
| 0.4 | 1.5 | GO:0090666 | scaRNA localization to Cajal body(GO:0090666) |
| 0.4 | 1.5 | GO:0090394 | negative regulation of excitatory postsynaptic potential(GO:0090394) |
| 0.4 | 5.6 | GO:0097120 | receptor localization to synapse(GO:0097120) |
| 0.4 | 2.2 | GO:1904263 | positive regulation of TORC1 signaling(GO:1904263) |
| 0.4 | 2.2 | GO:0044854 | plasma membrane raft assembly(GO:0044854) plasma membrane raft organization(GO:0044857) caveola assembly(GO:0070836) |
| 0.4 | 1.1 | GO:0006227 | dUDP biosynthetic process(GO:0006227) pyrimidine nucleoside diphosphate biosynthetic process(GO:0009139) deoxyribonucleoside diphosphate biosynthetic process(GO:0009189) pyrimidine deoxyribonucleoside diphosphate metabolic process(GO:0009196) pyrimidine deoxyribonucleoside diphosphate biosynthetic process(GO:0009197) dUDP metabolic process(GO:0046077) |
| 0.4 | 4.4 | GO:0042438 | melanin biosynthetic process(GO:0042438) |
| 0.4 | 2.2 | GO:0070072 | vacuolar proton-transporting V-type ATPase complex assembly(GO:0070072) |
| 0.4 | 3.7 | GO:0048563 | post-embryonic organ morphogenesis(GO:0048563) |
| 0.4 | 1.8 | GO:0060973 | pericardium morphogenesis(GO:0003344) cell migration involved in heart development(GO:0060973) |
| 0.4 | 1.8 | GO:0061368 | olfactory nerve development(GO:0021553) axonogenesis involved in innervation(GO:0060385) behavioral response to chemical pain(GO:0061366) behavioral response to formalin induced pain(GO:0061368) |
| 0.4 | 2.6 | GO:0021796 | cerebral cortex regionalization(GO:0021796) |
| 0.4 | 4.7 | GO:0030150 | protein import into mitochondrial matrix(GO:0030150) |
| 0.4 | 1.5 | GO:0032532 | intestinal D-glucose absorption(GO:0001951) regulation of microvillus length(GO:0032532) terminal web assembly(GO:1902896) |
| 0.4 | 2.2 | GO:0016255 | attachment of GPI anchor to protein(GO:0016255) |
| 0.4 | 6.6 | GO:0010758 | regulation of macrophage chemotaxis(GO:0010758) |
| 0.4 | 3.3 | GO:0045725 | positive regulation of glycogen biosynthetic process(GO:0045725) positive regulation of glycogen metabolic process(GO:0070875) |
| 0.4 | 3.9 | GO:0035457 | cellular response to interferon-alpha(GO:0035457) |
| 0.4 | 4.6 | GO:0016558 | protein import into peroxisome matrix(GO:0016558) |
| 0.4 | 31.2 | GO:0006941 | striated muscle contraction(GO:0006941) |
| 0.3 | 2.8 | GO:0044387 | negative regulation of protein kinase activity by regulation of protein phosphorylation(GO:0044387) |
| 0.3 | 1.4 | GO:0042976 | activation of Janus kinase activity(GO:0042976) |
| 0.3 | 15.0 | GO:0006637 | acyl-CoA metabolic process(GO:0006637) thioester metabolic process(GO:0035383) |
| 0.3 | 1.4 | GO:1900425 | negative regulation of defense response to bacterium(GO:1900425) |
| 0.3 | 6.5 | GO:1900078 | positive regulation of cellular response to insulin stimulus(GO:1900078) |
| 0.3 | 2.4 | GO:0032098 | regulation of appetite(GO:0032098) |
| 0.3 | 1.4 | GO:0034316 | negative regulation of Arp2/3 complex-mediated actin nucleation(GO:0034316) |
| 0.3 | 6.4 | GO:0009250 | glycogen biosynthetic process(GO:0005978) glucan biosynthetic process(GO:0009250) |
| 0.3 | 2.0 | GO:1901385 | regulation of voltage-gated calcium channel activity(GO:1901385) |
| 0.3 | 3.0 | GO:0006309 | apoptotic DNA fragmentation(GO:0006309) |
| 0.3 | 2.6 | GO:2000811 | negative regulation of anoikis(GO:2000811) |
| 0.3 | 5.9 | GO:0042347 | negative regulation of NF-kappaB import into nucleus(GO:0042347) |
| 0.3 | 1.6 | GO:0048312 | intracellular distribution of mitochondria(GO:0048312) |
| 0.3 | 2.3 | GO:0090261 | positive regulation of inclusion body assembly(GO:0090261) |
| 0.3 | 5.5 | GO:0039694 | viral RNA genome replication(GO:0039694) RNA replication(GO:0039703) |
| 0.3 | 2.3 | GO:0009134 | nucleoside diphosphate catabolic process(GO:0009134) |
| 0.3 | 1.6 | GO:0006776 | vitamin A metabolic process(GO:0006776) |
| 0.3 | 3.2 | GO:0032331 | negative regulation of chondrocyte differentiation(GO:0032331) |
| 0.3 | 1.3 | GO:0030813 | positive regulation of nucleotide catabolic process(GO:0030813) positive regulation of glycolytic process(GO:0045821) positive regulation of cofactor metabolic process(GO:0051194) positive regulation of coenzyme metabolic process(GO:0051197) |
| 0.3 | 9.8 | GO:1901998 | toxin transport(GO:1901998) |
| 0.3 | 3.1 | GO:0035864 | response to potassium ion(GO:0035864) |
| 0.3 | 1.6 | GO:0090050 | positive regulation of cell migration involved in sprouting angiogenesis(GO:0090050) |
| 0.3 | 1.2 | GO:0000098 | sulfur amino acid catabolic process(GO:0000098) |
| 0.3 | 4.7 | GO:0005977 | glycogen metabolic process(GO:0005977) cellular glucan metabolic process(GO:0006073) glucan metabolic process(GO:0044042) |
| 0.3 | 0.6 | GO:0035600 | tRNA methylthiolation(GO:0035600) |
| 0.3 | 4.6 | GO:0006110 | regulation of glycolytic process(GO:0006110) |
| 0.3 | 1.5 | GO:0051533 | positive regulation of NFAT protein import into nucleus(GO:0051533) |
| 0.3 | 1.5 | GO:0046498 | S-adenosylhomocysteine metabolic process(GO:0046498) |
| 0.3 | 1.8 | GO:0035609 | C-terminal protein deglutamylation(GO:0035609) |
| 0.3 | 1.5 | GO:0031110 | regulation of microtubule polymerization or depolymerization(GO:0031110) |
| 0.3 | 1.2 | GO:0045776 | negative regulation of blood pressure(GO:0045776) |
| 0.3 | 2.4 | GO:0032287 | peripheral nervous system myelin maintenance(GO:0032287) |
| 0.3 | 3.3 | GO:0070255 | regulation of mucus secretion(GO:0070255) |
| 0.3 | 1.8 | GO:0048733 | sebaceous gland development(GO:0048733) |
| 0.3 | 2.7 | GO:0051967 | negative regulation of synaptic transmission, glutamatergic(GO:0051967) |
| 0.3 | 13.7 | GO:0032543 | mitochondrial translation(GO:0032543) |
| 0.3 | 2.1 | GO:0090129 | positive regulation of synapse maturation(GO:0090129) |
| 0.3 | 0.9 | GO:0000393 | spliceosomal conformational changes to generate catalytic conformation(GO:0000393) |
| 0.3 | 3.8 | GO:0007520 | myoblast fusion(GO:0007520) |
| 0.3 | 0.9 | GO:0051127 | positive regulation of actin nucleation(GO:0051127) |
| 0.3 | 0.6 | GO:1900825 | regulation of membrane depolarization during action potential(GO:0098902) regulation of membrane depolarization during cardiac muscle cell action potential(GO:1900825) |
| 0.3 | 1.1 | GO:2000825 | positive regulation of androgen receptor activity(GO:2000825) |
| 0.3 | 3.7 | GO:0001502 | cartilage condensation(GO:0001502) |
| 0.3 | 2.9 | GO:0098719 | sodium ion import(GO:0097369) sodium ion import across plasma membrane(GO:0098719) sodium ion import into cell(GO:1990118) |
| 0.3 | 1.7 | GO:0006048 | UDP-N-acetylglucosamine biosynthetic process(GO:0006048) amino sugar biosynthetic process(GO:0046349) |
| 0.3 | 3.1 | GO:0034389 | lipid particle organization(GO:0034389) |
| 0.3 | 2.0 | GO:0035994 | response to muscle stretch(GO:0035994) |
| 0.3 | 0.3 | GO:0090526 | regulation of gluconeogenesis involved in cellular glucose homeostasis(GO:0090526) |
| 0.3 | 47.9 | GO:0007606 | sensory perception of chemical stimulus(GO:0007606) |
| 0.3 | 0.5 | GO:0043309 | regulation of eosinophil degranulation(GO:0043309) positive regulation of eosinophil degranulation(GO:0043311) regulation of eosinophil activation(GO:1902566) positive regulation of eosinophil activation(GO:1902568) |
| 0.3 | 2.7 | GO:0042670 | retinal cone cell differentiation(GO:0042670) retinal cone cell development(GO:0046549) |
| 0.3 | 0.3 | GO:2000551 | regulation of T-helper 2 cell cytokine production(GO:2000551) |
| 0.3 | 12.3 | GO:0003407 | neural retina development(GO:0003407) |
| 0.3 | 3.7 | GO:0051180 | vitamin transport(GO:0051180) |
| 0.3 | 1.1 | GO:2000675 | response to ozone(GO:0010193) negative regulation of type B pancreatic cell apoptotic process(GO:2000675) |
| 0.3 | 5.0 | GO:0006607 | NLS-bearing protein import into nucleus(GO:0006607) |
| 0.3 | 0.3 | GO:0008626 | granzyme-mediated apoptotic signaling pathway(GO:0008626) |
| 0.3 | 3.3 | GO:0048268 | clathrin coat assembly(GO:0048268) |
| 0.3 | 1.8 | GO:0071712 | ER-associated misfolded protein catabolic process(GO:0071712) |
| 0.3 | 0.5 | GO:0034379 | very-low-density lipoprotein particle assembly(GO:0034379) |
| 0.3 | 1.0 | GO:0070173 | regulation of enamel mineralization(GO:0070173) |
| 0.2 | 9.2 | GO:0046854 | phosphatidylinositol phosphorylation(GO:0046854) |
| 0.2 | 1.2 | GO:0009133 | nucleoside diphosphate biosynthetic process(GO:0009133) |
| 0.2 | 6.4 | GO:0048644 | muscle organ morphogenesis(GO:0048644) |
| 0.2 | 0.5 | GO:0090649 | response to oxygen-glucose deprivation(GO:0090649) cellular response to oxygen-glucose deprivation(GO:0090650) |
| 0.2 | 5.1 | GO:0006730 | one-carbon metabolic process(GO:0006730) |
| 0.2 | 1.5 | GO:0032534 | regulation of microvillus assembly(GO:0032534) |
| 0.2 | 5.6 | GO:0006471 | protein ADP-ribosylation(GO:0006471) |
| 0.2 | 0.5 | GO:0021823 | cerebral cortex tangential migration using cell-cell interactions(GO:0021823) postnatal olfactory bulb interneuron migration(GO:0021827) chemorepulsion involved in postnatal olfactory bulb interneuron migration(GO:0021836) |
| 0.2 | 3.9 | GO:0000271 | polysaccharide biosynthetic process(GO:0000271) |
| 0.2 | 1.2 | GO:0048852 | diencephalon morphogenesis(GO:0048852) |
| 0.2 | 1.2 | GO:0042989 | sequestering of actin monomers(GO:0042989) |
| 0.2 | 1.4 | GO:0072189 | ureter development(GO:0072189) |
| 0.2 | 21.8 | GO:0007519 | skeletal muscle tissue development(GO:0007519) |
| 0.2 | 1.4 | GO:0033211 | adiponectin-activated signaling pathway(GO:0033211) |
| 0.2 | 3.0 | GO:0031424 | keratinization(GO:0031424) |
| 0.2 | 2.3 | GO:0071578 | zinc II ion transmembrane import(GO:0071578) |
| 0.2 | 3.2 | GO:0051601 | exocyst localization(GO:0051601) |
| 0.2 | 5.0 | GO:0001523 | retinoid metabolic process(GO:0001523) |
| 0.2 | 2.9 | GO:0050774 | negative regulation of dendrite morphogenesis(GO:0050774) |
| 0.2 | 1.8 | GO:0043267 | negative regulation of potassium ion transport(GO:0043267) |
| 0.2 | 2.5 | GO:0006465 | signal peptide processing(GO:0006465) |
| 0.2 | 1.6 | GO:2000778 | positive regulation of interleukin-6 secretion(GO:2000778) |
| 0.2 | 3.8 | GO:0007202 | activation of phospholipase C activity(GO:0007202) |
| 0.2 | 1.8 | GO:0016127 | cholesterol catabolic process(GO:0006707) sterol catabolic process(GO:0016127) |
| 0.2 | 0.7 | GO:0044829 | positive regulation by host of viral genome replication(GO:0044829) |
| 0.2 | 7.6 | GO:0046580 | negative regulation of Ras protein signal transduction(GO:0046580) negative regulation of small GTPase mediated signal transduction(GO:0051058) |
| 0.2 | 1.3 | GO:0035414 | negative regulation of catenin import into nucleus(GO:0035414) |
| 0.2 | 7.8 | GO:0032835 | glomerulus development(GO:0032835) |
| 0.2 | 2.6 | GO:0045899 | positive regulation of RNA polymerase II transcriptional preinitiation complex assembly(GO:0045899) |
| 0.2 | 3.8 | GO:2000649 | regulation of sodium ion transmembrane transporter activity(GO:2000649) |
| 0.2 | 1.5 | GO:1901727 | positive regulation of histone deacetylase activity(GO:1901727) |
| 0.2 | 1.0 | GO:0021562 | vestibulocochlear nerve development(GO:0021562) |
| 0.2 | 3.1 | GO:0090200 | positive regulation of release of cytochrome c from mitochondria(GO:0090200) |
| 0.2 | 0.8 | GO:0014022 | neural plate elongation(GO:0014022) convergent extension involved in neural plate elongation(GO:0022007) |
| 0.2 | 0.6 | GO:0032472 | Golgi calcium ion transport(GO:0032472) |
| 0.2 | 0.4 | GO:0042435 | indole-containing compound biosynthetic process(GO:0042435) |
| 0.2 | 2.3 | GO:0061099 | negative regulation of protein tyrosine kinase activity(GO:0061099) |
| 0.2 | 1.0 | GO:0014052 | regulation of gamma-aminobutyric acid secretion(GO:0014052) |
| 0.2 | 1.5 | GO:0031116 | positive regulation of microtubule polymerization(GO:0031116) |
| 0.2 | 0.6 | GO:0043137 | DNA replication, removal of RNA primer(GO:0043137) |
| 0.2 | 1.3 | GO:0010663 | positive regulation of striated muscle cell apoptotic process(GO:0010663) positive regulation of cardiac muscle cell apoptotic process(GO:0010666) |
| 0.2 | 1.9 | GO:0050650 | chondroitin sulfate proteoglycan biosynthetic process(GO:0050650) |
| 0.2 | 0.9 | GO:0051919 | positive regulation of fibrinolysis(GO:0051919) |
| 0.2 | 2.0 | GO:0071625 | vocalization behavior(GO:0071625) |
| 0.2 | 0.4 | GO:0033058 | directional locomotion(GO:0033058) |
| 0.2 | 1.2 | GO:0007635 | chemosensory behavior(GO:0007635) |
| 0.2 | 1.2 | GO:0070234 | positive regulation of T cell apoptotic process(GO:0070234) |
| 0.2 | 0.7 | GO:0051560 | mitochondrial calcium ion homeostasis(GO:0051560) |
| 0.2 | 1.7 | GO:0042417 | dopamine metabolic process(GO:0042417) |
| 0.2 | 6.6 | GO:0000186 | activation of MAPKK activity(GO:0000186) |
| 0.2 | 5.4 | GO:0007214 | gamma-aminobutyric acid signaling pathway(GO:0007214) |
| 0.2 | 0.7 | GO:1902774 | late endosome to lysosome transport(GO:1902774) |
| 0.2 | 0.5 | GO:0044027 | hypermethylation of CpG island(GO:0044027) |
| 0.2 | 10.0 | GO:0007613 | memory(GO:0007613) |
| 0.2 | 0.7 | GO:0002184 | cytoplasmic translational termination(GO:0002184) |
| 0.2 | 0.5 | GO:0002082 | regulation of oxidative phosphorylation(GO:0002082) |
| 0.2 | 0.8 | GO:1904424 | regulation of GTP binding(GO:1904424) |
| 0.2 | 2.5 | GO:0000132 | establishment of mitotic spindle orientation(GO:0000132) |
| 0.2 | 0.6 | GO:0010996 | response to auditory stimulus(GO:0010996) |
| 0.2 | 1.4 | GO:0030502 | negative regulation of bone mineralization(GO:0030502) |
| 0.2 | 0.9 | GO:0070586 | cell-cell adhesion involved in gastrulation(GO:0070586) |
| 0.2 | 1.4 | GO:0018026 | peptidyl-lysine monomethylation(GO:0018026) |
| 0.2 | 7.5 | GO:0030433 | ER-associated ubiquitin-dependent protein catabolic process(GO:0030433) |
| 0.2 | 1.4 | GO:0042136 | neurotransmitter biosynthetic process(GO:0042136) |
| 0.2 | 2.0 | GO:0071542 | dopaminergic neuron differentiation(GO:0071542) |
| 0.2 | 1.4 | GO:0097068 | response to thyroxine(GO:0097068) |
| 0.2 | 1.8 | GO:0021535 | cell migration in hindbrain(GO:0021535) |
| 0.2 | 0.6 | GO:0060023 | soft palate development(GO:0060023) |
| 0.1 | 1.9 | GO:0050435 | beta-amyloid metabolic process(GO:0050435) |
| 0.1 | 3.2 | GO:0031146 | SCF-dependent proteasomal ubiquitin-dependent protein catabolic process(GO:0031146) |
| 0.1 | 3.0 | GO:0006891 | intra-Golgi vesicle-mediated transport(GO:0006891) |
| 0.1 | 5.1 | GO:0003073 | regulation of systemic arterial blood pressure(GO:0003073) |
| 0.1 | 4.7 | GO:0045103 | intermediate filament-based process(GO:0045103) |
| 0.1 | 0.7 | GO:0035822 | meiotic gene conversion(GO:0006311) gene conversion(GO:0035822) |
| 0.1 | 1.4 | GO:0060317 | cardiac epithelial to mesenchymal transition(GO:0060317) |
| 0.1 | 2.6 | GO:0045599 | negative regulation of fat cell differentiation(GO:0045599) |
| 0.1 | 0.5 | GO:0045717 | negative regulation of fatty acid biosynthetic process(GO:0045717) |
| 0.1 | 0.8 | GO:0060056 | mammary gland involution(GO:0060056) |
| 0.1 | 0.7 | GO:0033133 | positive regulation of glucokinase activity(GO:0033133) positive regulation of hexokinase activity(GO:1903301) |
| 0.1 | 1.2 | GO:0042753 | positive regulation of circadian rhythm(GO:0042753) |
| 0.1 | 0.8 | GO:0017196 | N-terminal peptidyl-methionine acetylation(GO:0017196) |
| 0.1 | 0.1 | GO:0097401 | synaptic vesicle lumen acidification(GO:0097401) |
| 0.1 | 0.6 | GO:0000459 | exonucleolytic trimming involved in rRNA processing(GO:0000459) exonucleolytic trimming to generate mature 3'-end of 5.8S rRNA from tricistronic rRNA transcript (SSU-rRNA, 5.8S rRNA, LSU-rRNA)(GO:0000467) |
| 0.1 | 0.8 | GO:0008616 | queuosine biosynthetic process(GO:0008616) queuosine metabolic process(GO:0046116) |
| 0.1 | 2.4 | GO:0000188 | inactivation of MAPK activity(GO:0000188) |
| 0.1 | 2.1 | GO:0071425 | hematopoietic stem cell proliferation(GO:0071425) |
| 0.1 | 1.1 | GO:0006614 | SRP-dependent cotranslational protein targeting to membrane(GO:0006614) |
| 0.1 | 1.1 | GO:0071402 | cellular response to lipoprotein particle stimulus(GO:0071402) |
| 0.1 | 14.1 | GO:0007156 | homophilic cell adhesion via plasma membrane adhesion molecules(GO:0007156) |
| 0.1 | 5.7 | GO:0030216 | keratinocyte differentiation(GO:0030216) |
| 0.1 | 1.2 | GO:0009312 | oligosaccharide biosynthetic process(GO:0009312) |
| 0.1 | 6.1 | GO:0007043 | cell-cell junction assembly(GO:0007043) |
| 0.1 | 1.1 | GO:0034315 | regulation of Arp2/3 complex-mediated actin nucleation(GO:0034315) |
| 0.1 | 2.8 | GO:0006506 | GPI anchor biosynthetic process(GO:0006506) |
| 0.1 | 0.4 | GO:0006787 | porphyrin-containing compound catabolic process(GO:0006787) tetrapyrrole catabolic process(GO:0033015) heme catabolic process(GO:0042167) pigment catabolic process(GO:0046149) |
| 0.1 | 0.9 | GO:0034312 | diol biosynthetic process(GO:0034312) |
| 0.1 | 2.7 | GO:0043039 | tRNA aminoacylation for protein translation(GO:0006418) tRNA aminoacylation(GO:0043039) |
| 0.1 | 0.2 | GO:0045542 | positive regulation of cholesterol biosynthetic process(GO:0045542) positive regulation of cholesterol metabolic process(GO:0090205) |
| 0.1 | 0.4 | GO:0021526 | medial motor column neuron differentiation(GO:0021526) |
| 0.1 | 0.3 | GO:0097198 | histone H3-K36 trimethylation(GO:0097198) |
| 0.1 | 2.3 | GO:1901264 | carbohydrate derivative transport(GO:1901264) |
| 0.1 | 0.5 | GO:0045217 | cell-cell junction maintenance(GO:0045217) |
| 0.1 | 3.2 | GO:0006182 | cGMP biosynthetic process(GO:0006182) |
| 0.1 | 0.2 | GO:0030252 | growth hormone secretion(GO:0030252) |
| 0.1 | 2.6 | GO:0043462 | regulation of ATPase activity(GO:0043462) |
| 0.1 | 0.3 | GO:0019236 | response to pheromone(GO:0019236) |
| 0.1 | 2.1 | GO:0046785 | microtubule polymerization(GO:0046785) |
| 0.1 | 0.3 | GO:0044691 | tooth eruption(GO:0044691) |
| 0.1 | 1.2 | GO:1903861 | regulation of dendrite extension(GO:1903859) positive regulation of dendrite extension(GO:1903861) |
| 0.1 | 0.8 | GO:0006654 | phosphatidic acid biosynthetic process(GO:0006654) |
| 0.1 | 0.2 | GO:0048319 | axial mesoderm morphogenesis(GO:0048319) |
| 0.1 | 0.3 | GO:0048664 | neuron fate determination(GO:0048664) |
| 0.1 | 0.2 | GO:0032930 | positive regulation of superoxide anion generation(GO:0032930) |
| 0.1 | 0.4 | GO:0045794 | negative regulation of cell volume(GO:0045794) |
| 0.1 | 0.6 | GO:0055007 | cardiac muscle cell differentiation(GO:0055007) |
| 0.1 | 0.8 | GO:1900449 | regulation of glutamate receptor signaling pathway(GO:1900449) |
| 0.1 | 1.0 | GO:0097066 | response to thyroid hormone(GO:0097066) |
| 0.1 | 1.7 | GO:0009166 | nucleotide catabolic process(GO:0009166) |
| 0.1 | 0.2 | GO:0046500 | S-adenosylmethionine metabolic process(GO:0046500) |
| 0.1 | 4.0 | GO:0048706 | embryonic skeletal system development(GO:0048706) |
| 0.1 | 3.7 | GO:1902600 | hydrogen ion transmembrane transport(GO:1902600) |
| 0.1 | 0.5 | GO:0060712 | spongiotrophoblast layer development(GO:0060712) |
| 0.1 | 0.3 | GO:0098885 | modification of postsynaptic actin cytoskeleton(GO:0098885) |
| 0.1 | 1.2 | GO:0033169 | histone H3-K9 demethylation(GO:0033169) |
| 0.1 | 0.3 | GO:1904751 | positive regulation of protein localization to nucleolus(GO:1904751) |
| 0.1 | 0.8 | GO:0043248 | proteasome assembly(GO:0043248) |
| 0.0 | 1.4 | GO:0007029 | endoplasmic reticulum organization(GO:0007029) |
| 0.0 | 0.5 | GO:0006646 | phosphatidylethanolamine biosynthetic process(GO:0006646) |
| 0.0 | 0.0 | GO:1900039 | positive regulation of cellular response to hypoxia(GO:1900039) |
| 0.0 | 0.7 | GO:0015992 | proton transport(GO:0015992) |
| 0.0 | 1.1 | GO:0010906 | regulation of glucose metabolic process(GO:0010906) |
| 0.0 | 0.8 | GO:0060325 | face morphogenesis(GO:0060325) |
| 0.0 | 1.3 | GO:0061077 | chaperone-mediated protein folding(GO:0061077) |
| 0.0 | 0.1 | GO:0043988 | histone H3-S28 phosphorylation(GO:0043988) |
| 0.0 | 0.6 | GO:0006958 | complement activation, classical pathway(GO:0006958) |
| 0.0 | 0.4 | GO:0006779 | porphyrin-containing compound biosynthetic process(GO:0006779) |
| 0.0 | 0.4 | GO:1990126 | retrograde transport, endosome to plasma membrane(GO:1990126) |
| 0.0 | 0.3 | GO:0032506 | cytokinetic process(GO:0032506) |
| 0.0 | 2.5 | GO:0045927 | positive regulation of growth(GO:0045927) |
| 0.0 | 0.2 | GO:0061737 | leukotriene signaling pathway(GO:0061737) |
| 0.0 | 2.3 | GO:0006457 | protein folding(GO:0006457) |
| 0.0 | 0.3 | GO:0001893 | maternal placenta development(GO:0001893) |
| 0.0 | 0.1 | GO:0000480 | endonucleolytic cleavage in 5'-ETS of tricistronic rRNA transcript (SSU-rRNA, 5.8S rRNA, LSU-rRNA)(GO:0000480) |
| 0.0 | 0.2 | GO:0034720 | histone H3-K4 demethylation(GO:0034720) |
| 0.0 | 0.1 | GO:0072321 | chaperone-mediated protein transport(GO:0072321) |
| 0.0 | 0.2 | GO:0006490 | oligosaccharide-lipid intermediate biosynthetic process(GO:0006490) |
| 0.0 | 0.0 | GO:0043328 | protein targeting to vacuole involved in ubiquitin-dependent protein catabolic process via the multivesicular body sorting pathway(GO:0043328) |
| 0.0 | 0.0 | GO:0072523 | purine-containing compound catabolic process(GO:0072523) |
| 0.0 | 0.2 | GO:2000001 | regulation of DNA damage checkpoint(GO:2000001) |
| 0.0 | 0.2 | GO:0046825 | regulation of protein export from nucleus(GO:0046825) |
Gene overrepresentation in cellular component category:
| Log-likelihood per target | Total log-likelihood | Term | Description |
|---|---|---|---|
| 7.1 | 84.9 | GO:0005859 | muscle myosin complex(GO:0005859) |
| 6.4 | 19.1 | GO:0090534 | calcium ion-transporting ATPase complex(GO:0090534) |
| 5.3 | 16.0 | GO:0005945 | 6-phosphofructokinase complex(GO:0005945) |
| 5.0 | 24.9 | GO:0097425 | smooth endoplasmic reticulum membrane(GO:0030868) smooth endoplasmic reticulum part(GO:0097425) |
| 4.5 | 18.0 | GO:0045298 | tubulin complex(GO:0045298) |
| 4.5 | 31.4 | GO:0061617 | MICOS complex(GO:0061617) |
| 4.4 | 13.2 | GO:0014701 | junctional sarcoplasmic reticulum membrane(GO:0014701) |
| 4.3 | 25.6 | GO:1990246 | uniplex complex(GO:1990246) |
| 3.7 | 26.1 | GO:0032982 | myosin filament(GO:0032982) |
| 3.5 | 28.1 | GO:0005826 | actomyosin contractile ring(GO:0005826) |
| 3.5 | 10.4 | GO:0005899 | insulin receptor complex(GO:0005899) |
| 3.4 | 17.2 | GO:0005927 | muscle tendon junction(GO:0005927) |
| 3.0 | 9.0 | GO:0098837 | postsynaptic recycling endosome(GO:0098837) |
| 2.6 | 41.9 | GO:0005751 | mitochondrial respiratory chain complex IV(GO:0005751) |
| 2.4 | 7.2 | GO:0005967 | mitochondrial pyruvate dehydrogenase complex(GO:0005967) |
| 2.2 | 49.8 | GO:0031430 | M band(GO:0031430) |
| 2.1 | 10.7 | GO:0097512 | cardiac myofibril(GO:0097512) |
| 2.1 | 41.5 | GO:0031672 | A band(GO:0031672) |
| 2.1 | 12.4 | GO:0030478 | actin cap(GO:0030478) |
| 2.0 | 7.8 | GO:0044279 | other organism cell membrane(GO:0044218) other organism membrane(GO:0044279) |
| 1.9 | 7.6 | GO:0060053 | neurofilament cytoskeleton(GO:0060053) |
| 1.8 | 12.9 | GO:0030314 | junctional membrane complex(GO:0030314) |
| 1.8 | 10.6 | GO:0033269 | internode region of axon(GO:0033269) |
| 1.7 | 13.9 | GO:0005638 | lamin filament(GO:0005638) |
| 1.6 | 46.2 | GO:0042629 | mast cell granule(GO:0042629) |
| 1.5 | 4.5 | GO:0005749 | mitochondrial respiratory chain complex II, succinate dehydrogenase complex (ubiquinone)(GO:0005749) succinate dehydrogenase complex (ubiquinone)(GO:0045257) fumarate reductase complex(GO:0045283) |
| 1.5 | 7.4 | GO:0048179 | activin receptor complex(GO:0048179) |
| 1.5 | 7.3 | GO:0070695 | FHF complex(GO:0070695) |
| 1.4 | 7.2 | GO:0097361 | CIA complex(GO:0097361) |
| 1.4 | 5.5 | GO:0098888 | extrinsic component of presynaptic membrane(GO:0098888) |
| 1.4 | 69.1 | GO:0030964 | mitochondrial respiratory chain complex I(GO:0005747) NADH dehydrogenase complex(GO:0030964) respiratory chain complex I(GO:0045271) |
| 1.3 | 48.4 | GO:0043034 | costamere(GO:0043034) |
| 1.3 | 10.6 | GO:0005577 | fibrinogen complex(GO:0005577) |
| 1.3 | 5.3 | GO:0005968 | Rab-protein geranylgeranyltransferase complex(GO:0005968) |
| 1.3 | 37.9 | GO:0005753 | mitochondrial proton-transporting ATP synthase complex(GO:0005753) |
| 1.3 | 3.8 | GO:0033596 | TSC1-TSC2 complex(GO:0033596) |
| 1.2 | 15.8 | GO:0099634 | postsynaptic specialization membrane(GO:0099634) |
| 1.2 | 213.7 | GO:0030016 | myofibril(GO:0030016) |
| 1.2 | 4.7 | GO:0001405 | presequence translocase-associated import motor(GO:0001405) |
| 1.2 | 7.0 | GO:0005785 | signal recognition particle receptor complex(GO:0005785) |
| 1.1 | 5.7 | GO:0043293 | apoptosome(GO:0043293) |
| 1.1 | 10.0 | GO:0005952 | cAMP-dependent protein kinase complex(GO:0005952) |
| 1.1 | 10.6 | GO:0045179 | apical cortex(GO:0045179) |
| 1.1 | 5.3 | GO:1903767 | sweet taste receptor complex(GO:1903767) taste receptor complex(GO:1903768) |
| 1.0 | 4.1 | GO:0044308 | axonal spine(GO:0044308) |
| 1.0 | 4.1 | GO:0031838 | haptoglobin-hemoglobin complex(GO:0031838) |
| 1.0 | 28.5 | GO:0031307 | integral component of mitochondrial outer membrane(GO:0031307) |
| 1.0 | 12.9 | GO:0042627 | chylomicron(GO:0042627) |
| 1.0 | 4.0 | GO:0042582 | primary lysosome(GO:0005766) azurophil granule(GO:0042582) |
| 0.9 | 5.6 | GO:0034385 | very-low-density lipoprotein particle(GO:0034361) triglyceride-rich lipoprotein particle(GO:0034385) |
| 0.9 | 11.1 | GO:0030130 | clathrin coat of trans-Golgi network vesicle(GO:0030130) |
| 0.9 | 10.1 | GO:0016010 | dystrophin-associated glycoprotein complex(GO:0016010) glycoprotein complex(GO:0090665) |
| 0.9 | 4.4 | GO:0098799 | outer mitochondrial membrane protein complex(GO:0098799) |
| 0.9 | 3.5 | GO:0034751 | aryl hydrocarbon receptor complex(GO:0034751) |
| 0.9 | 2.6 | GO:0045025 | mitochondrial degradosome(GO:0045025) |
| 0.9 | 12.2 | GO:0060091 | kinocilium(GO:0060091) |
| 0.9 | 2.6 | GO:0000839 | Hrd1p ubiquitin ligase ERAD-L complex(GO:0000839) |
| 0.9 | 21.7 | GO:0001533 | cornified envelope(GO:0001533) |
| 0.9 | 7.8 | GO:0030891 | VCB complex(GO:0030891) |
| 0.9 | 14.7 | GO:0031231 | integral component of peroxisomal membrane(GO:0005779) intrinsic component of peroxisomal membrane(GO:0031231) |
| 0.9 | 3.4 | GO:0030906 | retromer, cargo-selective complex(GO:0030906) |
| 0.9 | 10.2 | GO:0043083 | synaptic cleft(GO:0043083) |
| 0.8 | 38.2 | GO:0014704 | intercalated disc(GO:0014704) |
| 0.8 | 5.9 | GO:0071986 | Ragulator complex(GO:0071986) |
| 0.8 | 40.9 | GO:0009295 | nucleoid(GO:0009295) mitochondrial nucleoid(GO:0042645) |
| 0.8 | 6.6 | GO:0065010 | extracellular membrane-bounded organelle(GO:0065010) |
| 0.8 | 74.2 | GO:0031526 | brush border membrane(GO:0031526) |
| 0.8 | 9.6 | GO:0005687 | U4 snRNP(GO:0005687) |
| 0.8 | 15.2 | GO:0043196 | varicosity(GO:0043196) |
| 0.8 | 22.3 | GO:0000421 | autophagosome membrane(GO:0000421) |
| 0.8 | 2.3 | GO:0005594 | collagen type IX trimer(GO:0005594) |
| 0.8 | 8.6 | GO:0072546 | ER membrane protein complex(GO:0072546) |
| 0.8 | 6.2 | GO:0090533 | cation-transporting ATPase complex(GO:0090533) |
| 0.8 | 3.9 | GO:0072534 | perineuronal net(GO:0072534) |
| 0.8 | 3.1 | GO:0061474 | phagolysosome membrane(GO:0061474) |
| 0.8 | 6.2 | GO:0044305 | calyx of Held(GO:0044305) |
| 0.7 | 7.5 | GO:0005641 | nuclear envelope lumen(GO:0005641) |
| 0.7 | 2.2 | GO:0032592 | integral component of mitochondrial membrane(GO:0032592) |
| 0.7 | 2.2 | GO:1990015 | mesaxon(GO:0097453) ensheathing process(GO:1990015) |
| 0.7 | 7.9 | GO:0033268 | node of Ranvier(GO:0033268) |
| 0.7 | 34.4 | GO:0031903 | peroxisomal membrane(GO:0005778) microbody membrane(GO:0031903) |
| 0.7 | 2.8 | GO:0043541 | UDP-N-acetylglucosamine transferase complex(GO:0043541) |
| 0.7 | 1.4 | GO:0098845 | postsynaptic endosome(GO:0098845) |
| 0.7 | 5.6 | GO:0030893 | meiotic cohesin complex(GO:0030893) |
| 0.7 | 6.9 | GO:0042587 | glycogen granule(GO:0042587) |
| 0.7 | 5.2 | GO:0031595 | nuclear proteasome complex(GO:0031595) |
| 0.6 | 13.0 | GO:0031304 | intrinsic component of mitochondrial inner membrane(GO:0031304) integral component of mitochondrial inner membrane(GO:0031305) |
| 0.6 | 11.0 | GO:0042599 | lamellar body(GO:0042599) |
| 0.6 | 5.1 | GO:0097443 | sorting endosome(GO:0097443) |
| 0.6 | 3.1 | GO:0071782 | endoplasmic reticulum tubular network(GO:0071782) endoplasmic reticulum subcompartment(GO:0098827) |
| 0.6 | 6.8 | GO:0002178 | palmitoyltransferase complex(GO:0002178) |
| 0.6 | 19.7 | GO:0097440 | apical dendrite(GO:0097440) |
| 0.6 | 12.9 | GO:0030285 | integral component of synaptic vesicle membrane(GO:0030285) intrinsic component of synaptic vesicle membrane(GO:0098563) |
| 0.6 | 6.1 | GO:0017071 | intracellular cyclic nucleotide activated cation channel complex(GO:0017071) |
| 0.6 | 6.1 | GO:0044352 | pinosome(GO:0044352) macropinosome(GO:0044354) |
| 0.6 | 8.4 | GO:0031045 | dense core granule(GO:0031045) |
| 0.6 | 172.4 | GO:0005743 | mitochondrial inner membrane(GO:0005743) |
| 0.6 | 7.1 | GO:0098643 | fibrillar collagen trimer(GO:0005583) banded collagen fibril(GO:0098643) |
| 0.6 | 3.5 | GO:0005642 | annulate lamellae(GO:0005642) |
| 0.6 | 3.4 | GO:0016342 | catenin complex(GO:0016342) |
| 0.6 | 1.7 | GO:0045098 | type III intermediate filament(GO:0045098) |
| 0.6 | 9.5 | GO:0031235 | intrinsic component of the cytoplasmic side of the plasma membrane(GO:0031235) |
| 0.6 | 34.7 | GO:0031902 | late endosome membrane(GO:0031902) |
| 0.6 | 4.5 | GO:0008541 | proteasome regulatory particle, lid subcomplex(GO:0008541) |
| 0.5 | 3.3 | GO:0032983 | kainate selective glutamate receptor complex(GO:0032983) |
| 0.5 | 2.7 | GO:0097413 | Lewy body(GO:0097413) |
| 0.5 | 1.1 | GO:0009331 | glycerol-3-phosphate dehydrogenase complex(GO:0009331) |
| 0.5 | 115.5 | GO:0005759 | mitochondrial matrix(GO:0005759) |
| 0.5 | 3.2 | GO:0000815 | ESCRT III complex(GO:0000815) |
| 0.5 | 4.7 | GO:0031143 | pseudopodium(GO:0031143) |
| 0.5 | 4.2 | GO:0005964 | phosphorylase kinase complex(GO:0005964) |
| 0.5 | 1.5 | GO:0034774 | secretory granule lumen(GO:0034774) |
| 0.5 | 2.5 | GO:1990452 | Parkin-FBXW7-Cul1 ubiquitin ligase complex(GO:1990452) |
| 0.5 | 3.5 | GO:0005827 | polar microtubule(GO:0005827) |
| 0.5 | 3.0 | GO:0005726 | perichromatin fibrils(GO:0005726) |
| 0.5 | 2.0 | GO:0070552 | BRISC complex(GO:0070552) |
| 0.5 | 32.1 | GO:0032580 | Golgi cisterna membrane(GO:0032580) |
| 0.5 | 3.6 | GO:0070852 | cell body fiber(GO:0070852) |
| 0.4 | 2.7 | GO:0005883 | neurofilament(GO:0005883) |
| 0.4 | 11.1 | GO:0008074 | guanylate cyclase complex, soluble(GO:0008074) |
| 0.4 | 0.4 | GO:0034715 | pICln-Sm protein complex(GO:0034715) |
| 0.4 | 5.2 | GO:0030057 | desmosome(GO:0030057) |
| 0.4 | 39.5 | GO:0008076 | voltage-gated potassium channel complex(GO:0008076) |
| 0.4 | 2.1 | GO:0002081 | outer acrosomal membrane(GO:0002081) |
| 0.4 | 2.5 | GO:0005787 | signal peptidase complex(GO:0005787) |
| 0.4 | 10.7 | GO:0000159 | protein phosphatase type 2A complex(GO:0000159) |
| 0.4 | 11.9 | GO:0005903 | brush border(GO:0005903) |
| 0.4 | 1.6 | GO:0031315 | extrinsic component of mitochondrial outer membrane(GO:0031315) |
| 0.4 | 13.4 | GO:0030315 | T-tubule(GO:0030315) |
| 0.4 | 4.8 | GO:0042383 | sarcolemma(GO:0042383) |
| 0.4 | 0.8 | GO:0000835 | ER ubiquitin ligase complex(GO:0000835) Hrd1p ubiquitin ligase complex(GO:0000836) |
| 0.4 | 1.2 | GO:0005943 | phosphatidylinositol 3-kinase complex, class IA(GO:0005943) |
| 0.4 | 1.5 | GO:0005955 | calcineurin complex(GO:0005955) |
| 0.4 | 3.8 | GO:0030658 | transport vesicle membrane(GO:0030658) |
| 0.4 | 19.6 | GO:0015030 | Cajal body(GO:0015030) |
| 0.4 | 17.8 | GO:0045171 | intercellular bridge(GO:0045171) |
| 0.4 | 9.6 | GO:0033116 | endoplasmic reticulum-Golgi intermediate compartment membrane(GO:0033116) |
| 0.4 | 9.5 | GO:0044295 | axonal growth cone(GO:0044295) |
| 0.4 | 1.5 | GO:1990357 | terminal web(GO:1990357) |
| 0.4 | 2.2 | GO:0042765 | GPI-anchor transamidase complex(GO:0042765) |
| 0.4 | 28.7 | GO:0005741 | mitochondrial outer membrane(GO:0005741) |
| 0.4 | 1.1 | GO:0098831 | presynaptic active zone cytoplasmic component(GO:0098831) |
| 0.4 | 9.7 | GO:0016529 | sarcoplasmic reticulum(GO:0016529) |
| 0.4 | 26.6 | GO:0042579 | peroxisome(GO:0005777) microbody(GO:0042579) |
| 0.3 | 2.8 | GO:0044215 | other organism(GO:0044215) other organism cell(GO:0044216) other organism part(GO:0044217) |
| 0.3 | 2.8 | GO:0016600 | flotillin complex(GO:0016600) |
| 0.3 | 13.4 | GO:0032420 | stereocilium(GO:0032420) |
| 0.3 | 4.0 | GO:0030008 | TRAPP complex(GO:0030008) |
| 0.3 | 9.9 | GO:0031228 | integral component of Golgi membrane(GO:0030173) intrinsic component of Golgi membrane(GO:0031228) |
| 0.3 | 9.4 | GO:0034704 | calcium channel complex(GO:0034704) |
| 0.3 | 6.1 | GO:0046930 | pore complex(GO:0046930) |
| 0.3 | 1.9 | GO:0005915 | zonula adherens(GO:0005915) |
| 0.3 | 26.7 | GO:0072562 | blood microparticle(GO:0072562) |
| 0.3 | 1.6 | GO:0031467 | Cul7-RING ubiquitin ligase complex(GO:0031467) |
| 0.3 | 3.1 | GO:0000974 | Prp19 complex(GO:0000974) |
| 0.3 | 1.8 | GO:0000788 | nuclear nucleosome(GO:0000788) |
| 0.3 | 2.4 | GO:0055038 | recycling endosome membrane(GO:0055038) |
| 0.3 | 2.1 | GO:0030666 | endocytic vesicle membrane(GO:0030666) phagocytic vesicle membrane(GO:0030670) |
| 0.3 | 17.2 | GO:0005901 | caveola(GO:0005901) |
| 0.3 | 7.4 | GO:0005902 | microvillus(GO:0005902) |
| 0.3 | 3.8 | GO:0045180 | basal cortex(GO:0045180) |
| 0.3 | 8.7 | GO:0097517 | stress fiber(GO:0001725) contractile actin filament bundle(GO:0097517) |
| 0.3 | 29.0 | GO:0030176 | integral component of endoplasmic reticulum membrane(GO:0030176) |
| 0.3 | 2.9 | GO:0097449 | astrocyte projection(GO:0097449) |
| 0.3 | 2.8 | GO:0033177 | proton-transporting two-sector ATPase complex, proton-transporting domain(GO:0033177) |
| 0.3 | 3.3 | GO:0061702 | inflammasome complex(GO:0061702) |
| 0.3 | 5.1 | GO:0005614 | interstitial matrix(GO:0005614) |
| 0.3 | 4.8 | GO:0012507 | ER to Golgi transport vesicle membrane(GO:0012507) |
| 0.3 | 3.2 | GO:0008385 | IkappaB kinase complex(GO:0008385) |
| 0.3 | 10.1 | GO:0031594 | neuromuscular junction(GO:0031594) |
| 0.3 | 0.3 | GO:0044194 | cytolytic granule(GO:0044194) |
| 0.3 | 1.8 | GO:0017119 | Golgi transport complex(GO:0017119) |
| 0.3 | 15.7 | GO:0043195 | terminal bouton(GO:0043195) |
| 0.3 | 1.8 | GO:0061700 | GATOR2 complex(GO:0061700) |
| 0.2 | 4.2 | GO:0030118 | clathrin coat(GO:0030118) |
| 0.2 | 7.0 | GO:0031201 | SNARE complex(GO:0031201) |
| 0.2 | 0.7 | GO:0016461 | unconventional myosin complex(GO:0016461) |
| 0.2 | 5.2 | GO:0009925 | basal plasma membrane(GO:0009925) |
| 0.2 | 0.7 | GO:0070939 | Dsl1p complex(GO:0070939) |
| 0.2 | 1.6 | GO:0005838 | proteasome regulatory particle(GO:0005838) |
| 0.2 | 6.3 | GO:0005905 | clathrin-coated pit(GO:0005905) |
| 0.2 | 0.4 | GO:0032437 | cuticular plate(GO:0032437) |
| 0.2 | 0.9 | GO:0005921 | gap junction(GO:0005921) |
| 0.2 | 2.6 | GO:0009897 | external side of plasma membrane(GO:0009897) |
| 0.2 | 2.2 | GO:0043194 | axon initial segment(GO:0043194) |
| 0.2 | 12.3 | GO:0031225 | anchored component of membrane(GO:0031225) |
| 0.2 | 11.0 | GO:0034707 | chloride channel complex(GO:0034707) |
| 0.2 | 2.6 | GO:0031229 | integral component of nuclear inner membrane(GO:0005639) intrinsic component of nuclear inner membrane(GO:0031229) |
| 0.2 | 3.0 | GO:0071565 | nBAF complex(GO:0071565) |
| 0.2 | 1.1 | GO:0035976 | AP1 complex(GO:0035976) |
| 0.2 | 3.9 | GO:0032588 | trans-Golgi network membrane(GO:0032588) |
| 0.2 | 2.7 | GO:0017101 | aminoacyl-tRNA synthetase multienzyme complex(GO:0017101) |
| 0.2 | 3.9 | GO:0000145 | exocyst(GO:0000145) |
| 0.2 | 0.8 | GO:0000322 | storage vacuole(GO:0000322) |
| 0.2 | 7.8 | GO:0045177 | apical part of cell(GO:0045177) |
| 0.2 | 24.7 | GO:0005802 | trans-Golgi network(GO:0005802) |
| 0.2 | 7.6 | GO:0005834 | heterotrimeric G-protein complex(GO:0005834) |
| 0.2 | 1.6 | GO:0030915 | Smc5-Smc6 complex(GO:0030915) |
| 0.2 | 12.8 | GO:0045095 | keratin filament(GO:0045095) |
| 0.2 | 44.2 | GO:0016324 | apical plasma membrane(GO:0016324) |
| 0.2 | 1.3 | GO:0031091 | platelet alpha granule(GO:0031091) |
| 0.2 | 45.8 | GO:0000139 | Golgi membrane(GO:0000139) |
| 0.2 | 0.6 | GO:1990682 | CSF1-CSF1R complex(GO:1990682) |
| 0.2 | 2.2 | GO:0002080 | acrosomal membrane(GO:0002080) |
| 0.2 | 1.2 | GO:0045334 | clathrin-coated endocytic vesicle(GO:0045334) |
| 0.2 | 0.7 | GO:0018444 | translation release factor complex(GO:0018444) |
| 0.1 | 0.4 | GO:0032398 | MHC class Ib protein complex(GO:0032398) |
| 0.1 | 6.7 | GO:0005581 | collagen trimer(GO:0005581) |
| 0.1 | 761.8 | GO:0016021 | integral component of membrane(GO:0016021) |
| 0.1 | 118.8 | GO:0005739 | mitochondrion(GO:0005739) |
| 0.1 | 2.7 | GO:0005665 | DNA-directed RNA polymerase II, core complex(GO:0005665) |
| 0.1 | 2.0 | GO:0033276 | transcription factor TFTC complex(GO:0033276) |
| 0.1 | 1.5 | GO:0005832 | chaperonin-containing T-complex(GO:0005832) |
| 0.1 | 1.5 | GO:0043235 | receptor complex(GO:0043235) |
| 0.1 | 1.7 | GO:0005790 | smooth endoplasmic reticulum(GO:0005790) |
| 0.1 | 1.1 | GO:0001527 | microfibril(GO:0001527) fibril(GO:0043205) |
| 0.1 | 6.7 | GO:0043197 | dendritic spine(GO:0043197) |
| 0.1 | 0.3 | GO:0009328 | phenylalanine-tRNA ligase complex(GO:0009328) |
| 0.1 | 1.4 | GO:0033202 | Ino80 complex(GO:0031011) DNA helicase complex(GO:0033202) |
| 0.1 | 1.2 | GO:0097610 | cleavage furrow(GO:0032154) cell surface furrow(GO:0097610) |
| 0.1 | 0.2 | GO:0030867 | rough endoplasmic reticulum membrane(GO:0030867) |
| 0.1 | 3.1 | GO:0022627 | cytosolic small ribosomal subunit(GO:0022627) |
| 0.1 | 0.5 | GO:0016281 | eukaryotic translation initiation factor 4F complex(GO:0016281) |
| 0.1 | 0.5 | GO:0000813 | ESCRT I complex(GO:0000813) |
| 0.1 | 0.6 | GO:0005885 | Arp2/3 protein complex(GO:0005885) |
| 0.1 | 1.6 | GO:0005604 | basement membrane(GO:0005604) |
| 0.1 | 0.4 | GO:0048500 | signal recognition particle, endoplasmic reticulum targeting(GO:0005786) signal recognition particle(GO:0048500) |
| 0.1 | 0.3 | GO:0005850 | eukaryotic translation initiation factor 2 complex(GO:0005850) |
| 0.1 | 1.4 | GO:0008180 | COP9 signalosome(GO:0008180) |
| 0.1 | 9.5 | GO:0015629 | actin cytoskeleton(GO:0015629) |
| 0.0 | 8.1 | GO:0005925 | cell-substrate adherens junction(GO:0005924) focal adhesion(GO:0005925) |
| 0.0 | 2.2 | GO:0005788 | endoplasmic reticulum lumen(GO:0005788) |
| 0.0 | 0.3 | GO:0030914 | STAGA complex(GO:0030914) |
| 0.0 | 0.2 | GO:0033588 | Elongator holoenzyme complex(GO:0033588) |
| 0.0 | 0.3 | GO:0033256 | I-kappaB/NF-kappaB complex(GO:0033256) |
| 0.0 | 0.5 | GO:0031618 | nuclear pericentric heterochromatin(GO:0031618) |
| 0.0 | 30.8 | GO:0005615 | extracellular space(GO:0005615) |
| 0.0 | 0.5 | GO:0005868 | cytoplasmic dynein complex(GO:0005868) |
| 0.0 | 0.2 | GO:0042788 | polysomal ribosome(GO:0042788) |
| 0.0 | 0.1 | GO:0071203 | WASH complex(GO:0071203) |
| 0.0 | 0.4 | GO:0000502 | proteasome complex(GO:0000502) |
| 0.0 | 0.1 | GO:0005833 | hemoglobin complex(GO:0005833) |
| 0.0 | 15.2 | GO:0070062 | extracellular exosome(GO:0070062) |
Gene overrepresentation in molecular function category:
| Log-likelihood per target | Total log-likelihood | Term | Description |
|---|---|---|---|
| 11.5 | 34.6 | GO:0071885 | N-terminal protein N-methyltransferase activity(GO:0071885) |
| 11.4 | 45.4 | GO:0050682 | AF-2 domain binding(GO:0050682) |
| 9.8 | 68.3 | GO:0004111 | creatine kinase activity(GO:0004111) |
| 8.4 | 33.4 | GO:0003987 | acetate-CoA ligase activity(GO:0003987) |
| 7.5 | 22.4 | GO:0017042 | glycosylceramidase activity(GO:0017042) |
| 7.2 | 28.8 | GO:0004740 | pyruvate dehydrogenase (acetyl-transferring) kinase activity(GO:0004740) |
| 7.0 | 20.9 | GO:0018479 | benzaldehyde dehydrogenase (NAD+) activity(GO:0018479) |
| 6.9 | 41.5 | GO:0047961 | glycine N-acyltransferase activity(GO:0047961) |
| 5.9 | 17.6 | GO:0003990 | acetylcholinesterase activity(GO:0003990) |
| 5.1 | 15.3 | GO:0001605 | adrenomedullin receptor activity(GO:0001605) |
| 5.0 | 15.1 | GO:0036468 | aromatic-L-amino-acid decarboxylase activity(GO:0004058) L-dopa decarboxylase activity(GO:0036468) |
| 4.9 | 14.7 | GO:0008405 | arachidonic acid 11,12-epoxygenase activity(GO:0008405) |
| 4.7 | 66.0 | GO:0030898 | actin-dependent ATPase activity(GO:0030898) |
| 4.6 | 18.4 | GO:0051431 | corticotropin-releasing hormone receptor 2 binding(GO:0051431) |
| 4.5 | 40.9 | GO:0070061 | fructose binding(GO:0070061) |
| 4.5 | 18.0 | GO:0099609 | microtubule lateral binding(GO:0099609) |
| 4.5 | 26.9 | GO:0004471 | malic enzyme activity(GO:0004470) malate dehydrogenase (decarboxylating) (NAD+) activity(GO:0004471) malate dehydrogenase (decarboxylating) (NADP+) activity(GO:0004473) |
| 4.1 | 16.3 | GO:0004691 | cAMP-dependent protein kinase activity(GO:0004691) |
| 4.0 | 15.9 | GO:0047023 | androsterone dehydrogenase activity(GO:0047023) |
| 4.0 | 19.9 | GO:0015321 | sodium-dependent phosphate transmembrane transporter activity(GO:0015321) |
| 3.9 | 27.5 | GO:0004062 | aryl sulfotransferase activity(GO:0004062) |
| 3.8 | 11.3 | GO:0004657 | proline dehydrogenase activity(GO:0004657) |
| 3.7 | 15.0 | GO:0005315 | inorganic phosphate transmembrane transporter activity(GO:0005315) |
| 3.6 | 10.8 | GO:0030899 | calcium-dependent ATPase activity(GO:0030899) |
| 3.6 | 14.4 | GO:0003989 | acetyl-CoA carboxylase activity(GO:0003989) |
| 3.5 | 13.9 | GO:0036137 | kynurenine-oxoglutarate transaminase activity(GO:0016212) kynurenine aminotransferase activity(GO:0036137) |
| 3.4 | 17.1 | GO:0015183 | L-aspartate transmembrane transporter activity(GO:0015183) |
| 3.4 | 10.1 | GO:0004937 | alpha1-adrenergic receptor activity(GO:0004937) |
| 3.4 | 10.1 | GO:0004478 | methionine adenosyltransferase activity(GO:0004478) |
| 3.3 | 22.9 | GO:0031433 | telethonin binding(GO:0031433) |
| 3.2 | 44.9 | GO:0015347 | sodium-independent organic anion transmembrane transporter activity(GO:0015347) |
| 3.2 | 25.5 | GO:0000146 | microfilament motor activity(GO:0000146) |
| 3.1 | 46.1 | GO:0005344 | oxygen transporter activity(GO:0005344) |
| 3.0 | 20.8 | GO:0042030 | ATPase inhibitor activity(GO:0042030) |
| 3.0 | 14.8 | GO:0051185 | adenosine-diphosphatase activity(GO:0043262) coenzyme transporter activity(GO:0051185) |
| 2.8 | 8.5 | GO:0060230 | lipoprotein lipase activator activity(GO:0060230) |
| 2.7 | 30.2 | GO:0004887 | thyroid hormone receptor activity(GO:0004887) |
| 2.7 | 10.9 | GO:0003836 | beta-galactoside (CMP) alpha-2,3-sialyltransferase activity(GO:0003836) |
| 2.7 | 16.3 | GO:0004126 | cytidine deaminase activity(GO:0004126) |
| 2.7 | 8.1 | GO:0000179 | rRNA (adenine-N6,N6-)-dimethyltransferase activity(GO:0000179) |
| 2.7 | 5.4 | GO:0080130 | L-phenylalanine aminotransferase activity(GO:0070546) L-phenylalanine:2-oxoglutarate aminotransferase activity(GO:0080130) |
| 2.6 | 13.0 | GO:0050833 | pyruvate transmembrane transporter activity(GO:0050833) |
| 2.6 | 5.2 | GO:0061629 | RNA polymerase II sequence-specific DNA binding transcription factor binding(GO:0061629) |
| 2.5 | 10.2 | GO:0004687 | myosin light chain kinase activity(GO:0004687) |
| 2.5 | 12.4 | GO:0001665 | alpha-N-acetylgalactosaminide alpha-2,6-sialyltransferase activity(GO:0001665) |
| 2.5 | 12.4 | GO:0004075 | biotin carboxylase activity(GO:0004075) |
| 2.5 | 9.8 | GO:0008597 | calcium-dependent protein serine/threonine phosphatase regulator activity(GO:0008597) |
| 2.4 | 50.8 | GO:0051428 | peptide hormone receptor binding(GO:0051428) |
| 2.4 | 14.5 | GO:0090599 | alpha-glucosidase activity(GO:0090599) |
| 2.4 | 40.3 | GO:0042813 | Wnt-activated receptor activity(GO:0042813) |
| 2.3 | 25.8 | GO:0001846 | opsonin binding(GO:0001846) |
| 2.3 | 9.3 | GO:0004165 | dodecenoyl-CoA delta-isomerase activity(GO:0004165) |
| 2.3 | 6.9 | GO:0016508 | long-chain-enoyl-CoA hydratase activity(GO:0016508) |
| 2.2 | 8.7 | GO:0031731 | CCR6 chemokine receptor binding(GO:0031731) |
| 2.1 | 29.8 | GO:0033038 | bitter taste receptor activity(GO:0033038) |
| 2.1 | 6.4 | GO:0003844 | 1,4-alpha-glucan branching enzyme activity(GO:0003844) |
| 2.1 | 8.5 | GO:0031013 | troponin I binding(GO:0031013) |
| 2.1 | 6.3 | GO:0016748 | succinyltransferase activity(GO:0016748) |
| 2.1 | 8.4 | GO:0052796 | exo-alpha-(2->3)-sialidase activity(GO:0052794) exo-alpha-(2->6)-sialidase activity(GO:0052795) exo-alpha-(2->8)-sialidase activity(GO:0052796) |
| 2.1 | 28.9 | GO:0017154 | semaphorin receptor activity(GO:0017154) |
| 2.1 | 33.0 | GO:0051371 | muscle alpha-actinin binding(GO:0051371) |
| 2.0 | 6.1 | GO:0031752 | D5 dopamine receptor binding(GO:0031752) |
| 2.0 | 6.1 | GO:0044736 | acid-sensing ion channel activity(GO:0044736) |
| 2.0 | 59.8 | GO:0015002 | cytochrome-c oxidase activity(GO:0004129) heme-copper terminal oxidase activity(GO:0015002) oxidoreductase activity, acting on a heme group of donors, oxygen as acceptor(GO:0016676) |
| 2.0 | 15.9 | GO:0003996 | acyl-CoA ligase activity(GO:0003996) |
| 2.0 | 5.9 | GO:0008142 | oxysterol binding(GO:0008142) |
| 1.9 | 19.2 | GO:0019855 | calcium channel inhibitor activity(GO:0019855) |
| 1.9 | 9.6 | GO:0031014 | troponin T binding(GO:0031014) |
| 1.9 | 26.7 | GO:0005523 | tropomyosin binding(GO:0005523) |
| 1.9 | 9.4 | GO:0015168 | polyol transmembrane transporter activity(GO:0015166) glycerol transmembrane transporter activity(GO:0015168) |
| 1.9 | 5.6 | GO:0034437 | glycoprotein transporter activity(GO:0034437) |
| 1.8 | 7.4 | GO:0019166 | trans-2-enoyl-CoA reductase (NADPH) activity(GO:0019166) |
| 1.8 | 12.9 | GO:0047035 | testosterone dehydrogenase (NAD+) activity(GO:0047035) |
| 1.8 | 14.7 | GO:0031419 | cobalamin binding(GO:0031419) |
| 1.8 | 9.2 | GO:0004758 | serine C-palmitoyltransferase activity(GO:0004758) C-palmitoyltransferase activity(GO:0016454) |
| 1.8 | 18.3 | GO:0033300 | dehydroascorbic acid transporter activity(GO:0033300) |
| 1.8 | 12.6 | GO:0004767 | sphingomyelin phosphodiesterase activity(GO:0004767) |
| 1.8 | 10.8 | GO:0005332 | gamma-aminobutyric acid:sodium symporter activity(GO:0005332) |
| 1.8 | 16.1 | GO:0032050 | clathrin heavy chain binding(GO:0032050) |
| 1.8 | 7.0 | GO:0008241 | peptidyl-dipeptidase activity(GO:0008241) |
| 1.8 | 5.3 | GO:0005171 | hepatocyte growth factor receptor binding(GO:0005171) |
| 1.7 | 5.2 | GO:0031766 | galanin receptor binding(GO:0031763) type 2 galanin receptor binding(GO:0031765) type 3 galanin receptor binding(GO:0031766) |
| 1.7 | 9.9 | GO:0005436 | sodium:phosphate symporter activity(GO:0005436) |
| 1.6 | 50.5 | GO:0015020 | glucuronosyltransferase activity(GO:0015020) |
| 1.6 | 4.8 | GO:0035403 | calcium-dependent protein kinase C activity(GO:0004698) histone kinase activity (H3-T6 specific)(GO:0035403) |
| 1.6 | 19.1 | GO:0004499 | N,N-dimethylaniline monooxygenase activity(GO:0004499) |
| 1.6 | 7.9 | GO:0004427 | inorganic diphosphatase activity(GO:0004427) |
| 1.6 | 41.0 | GO:0043014 | alpha-tubulin binding(GO:0043014) |
| 1.5 | 29.3 | GO:0005247 | voltage-gated chloride channel activity(GO:0005247) |
| 1.5 | 6.1 | GO:0003876 | AMP deaminase activity(GO:0003876) adenosine-phosphate deaminase activity(GO:0047623) |
| 1.5 | 13.8 | GO:0004716 | receptor signaling protein tyrosine kinase activity(GO:0004716) |
| 1.5 | 4.5 | GO:0051538 | succinate dehydrogenase (ubiquinone) activity(GO:0008177) 3 iron, 4 sulfur cluster binding(GO:0051538) |
| 1.5 | 4.5 | GO:0005483 | soluble NSF attachment protein activity(GO:0005483) |
| 1.5 | 5.9 | GO:0004743 | pyruvate kinase activity(GO:0004743) |
| 1.5 | 17.7 | GO:0008191 | metalloendopeptidase inhibitor activity(GO:0008191) |
| 1.5 | 8.8 | GO:0001515 | opioid peptide activity(GO:0001515) |
| 1.5 | 4.4 | GO:0070653 | high-density lipoprotein particle receptor binding(GO:0070653) |
| 1.5 | 7.3 | GO:0004105 | choline-phosphate cytidylyltransferase activity(GO:0004105) |
| 1.4 | 11.4 | GO:0031698 | beta-2 adrenergic receptor binding(GO:0031698) |
| 1.4 | 4.2 | GO:0035939 | microsatellite binding(GO:0035939) |
| 1.4 | 4.1 | GO:0045159 | myosin II binding(GO:0045159) |
| 1.4 | 4.1 | GO:0004370 | glycerol kinase activity(GO:0004370) |
| 1.3 | 6.7 | GO:0008453 | alanine-glyoxylate transaminase activity(GO:0008453) |
| 1.3 | 6.6 | GO:0046912 | transferase activity, transferring acyl groups, acyl groups converted into alkyl on transfer(GO:0046912) |
| 1.3 | 5.3 | GO:0003842 | 1-pyrroline-5-carboxylate dehydrogenase activity(GO:0003842) |
| 1.3 | 3.9 | GO:0031826 | type 2A serotonin receptor binding(GO:0031826) |
| 1.3 | 3.9 | GO:0004924 | oncostatin-M receptor activity(GO:0004924) |
| 1.3 | 18.0 | GO:0042043 | neurexin family protein binding(GO:0042043) |
| 1.3 | 3.8 | GO:0008396 | oxysterol 7-alpha-hydroxylase activity(GO:0008396) |
| 1.3 | 3.8 | GO:0004167 | dopachrome isomerase activity(GO:0004167) |
| 1.3 | 5.0 | GO:0004045 | aminoacyl-tRNA hydrolase activity(GO:0004045) |
| 1.2 | 5.0 | GO:0031686 | A1 adenosine receptor binding(GO:0031686) |
| 1.2 | 7.4 | GO:0016361 | activin receptor activity, type I(GO:0016361) |
| 1.2 | 3.6 | GO:0035539 | 8-oxo-7,8-dihydroguanosine triphosphate pyrophosphatase activity(GO:0008413) 8-oxo-7,8-dihydrodeoxyguanosine triphosphate pyrophosphatase activity(GO:0035539) |
| 1.2 | 6.0 | GO:0046790 | virion binding(GO:0046790) |
| 1.2 | 5.9 | GO:0030280 | structural constituent of epidermis(GO:0030280) |
| 1.2 | 5.9 | GO:0090555 | phosphatidylethanolamine-translocating ATPase activity(GO:0090555) |
| 1.2 | 14.1 | GO:0070008 | serine-type exopeptidase activity(GO:0070008) |
| 1.2 | 3.5 | GO:0004874 | aryl hydrocarbon receptor activity(GO:0004874) |
| 1.2 | 4.6 | GO:0003835 | beta-galactoside alpha-2,6-sialyltransferase activity(GO:0003835) |
| 1.2 | 18.6 | GO:0003995 | acyl-CoA dehydrogenase activity(GO:0003995) |
| 1.1 | 3.4 | GO:0009384 | N-acylmannosamine kinase activity(GO:0009384) |
| 1.1 | 6.8 | GO:0004024 | alcohol dehydrogenase activity, zinc-dependent(GO:0004024) |
| 1.1 | 5.6 | GO:0036033 | mediator complex binding(GO:0036033) |
| 1.1 | 8.9 | GO:0003956 | NAD(P)+-protein-arginine ADP-ribosyltransferase activity(GO:0003956) |
| 1.1 | 3.3 | GO:0005146 | leukemia inhibitory factor receptor binding(GO:0005146) |
| 1.1 | 3.3 | GO:0030350 | iron-responsive element binding(GO:0030350) |
| 1.1 | 6.5 | GO:0005047 | signal recognition particle binding(GO:0005047) |
| 1.1 | 23.5 | GO:0071949 | FAD binding(GO:0071949) |
| 1.1 | 10.6 | GO:0005412 | glucose:sodium symporter activity(GO:0005412) |
| 1.1 | 15.8 | GO:0015095 | magnesium ion transmembrane transporter activity(GO:0015095) |
| 1.0 | 5.2 | GO:0036402 | proteasome-activating ATPase activity(GO:0036402) |
| 1.0 | 2.1 | GO:0000253 | 3-keto sterol reductase activity(GO:0000253) |
| 1.0 | 4.1 | GO:0070579 | methylcytosine dioxygenase activity(GO:0070579) |
| 1.0 | 19.6 | GO:0017166 | vinculin binding(GO:0017166) |
| 1.0 | 4.1 | GO:0031694 | alpha-2A adrenergic receptor binding(GO:0031694) |
| 1.0 | 6.1 | GO:0008467 | [heparan sulfate]-glucosamine 3-sulfotransferase 1 activity(GO:0008467) |
| 1.0 | 11.0 | GO:0015271 | outward rectifier potassium channel activity(GO:0015271) |
| 1.0 | 7.9 | GO:0000064 | L-ornithine transmembrane transporter activity(GO:0000064) |
| 1.0 | 6.9 | GO:0061513 | hexose phosphate transmembrane transporter activity(GO:0015119) organophosphate:inorganic phosphate antiporter activity(GO:0015315) hexose-phosphate:inorganic phosphate antiporter activity(GO:0015526) glucose 6-phosphate:inorganic phosphate antiporter activity(GO:0061513) |
| 1.0 | 9.7 | GO:0086008 | voltage-gated potassium channel activity involved in cardiac muscle cell action potential repolarization(GO:0086008) |
| 1.0 | 1.9 | GO:0015143 | urate transmembrane transporter activity(GO:0015143) salt transmembrane transporter activity(GO:1901702) |
| 1.0 | 12.5 | GO:0016813 | hydrolase activity, acting on carbon-nitrogen (but not peptide) bonds, in linear amidines(GO:0016813) |
| 1.0 | 19.2 | GO:0070300 | phosphatidic acid binding(GO:0070300) |
| 1.0 | 4.8 | GO:0061676 | importin-alpha family protein binding(GO:0061676) |
| 1.0 | 3.8 | GO:0016842 | amidine-lyase activity(GO:0016842) |
| 0.9 | 2.8 | GO:0004556 | alpha-amylase activity(GO:0004556) amylase activity(GO:0016160) |
| 0.9 | 9.2 | GO:0004955 | prostaglandin receptor activity(GO:0004955) |
| 0.9 | 2.7 | GO:2001070 | starch binding(GO:2001070) |
| 0.9 | 2.7 | GO:0005017 | platelet-derived growth factor-activated receptor activity(GO:0005017) |
| 0.9 | 4.4 | GO:0005250 | A-type (transient outward) potassium channel activity(GO:0005250) |
| 0.9 | 1.8 | GO:0047787 | delta4-3-oxosteroid 5beta-reductase activity(GO:0047787) |
| 0.9 | 3.5 | GO:0004487 | methylenetetrahydrofolate dehydrogenase (NAD+) activity(GO:0004487) |
| 0.9 | 10.4 | GO:0042301 | phosphate ion binding(GO:0042301) |
| 0.9 | 19.8 | GO:0070006 | metalloaminopeptidase activity(GO:0070006) |
| 0.9 | 2.6 | GO:0032810 | sterol response element binding(GO:0032810) |
| 0.9 | 5.1 | GO:0015016 | [heparan sulfate]-glucosamine N-sulfotransferase activity(GO:0015016) |
| 0.8 | 5.1 | GO:0001758 | retinal dehydrogenase activity(GO:0001758) |
| 0.8 | 15.1 | GO:0010181 | FMN binding(GO:0010181) |
| 0.8 | 9.2 | GO:0003708 | retinoic acid receptor activity(GO:0003708) |
| 0.8 | 10.0 | GO:0030215 | semaphorin receptor binding(GO:0030215) |
| 0.8 | 12.4 | GO:0008483 | transaminase activity(GO:0008483) |
| 0.8 | 4.9 | GO:0070567 | cytidylyltransferase activity(GO:0070567) |
| 0.8 | 5.7 | GO:0043237 | laminin-1 binding(GO:0043237) |
| 0.8 | 8.1 | GO:0008429 | phosphatidylethanolamine binding(GO:0008429) |
| 0.8 | 5.6 | GO:0005173 | stem cell factor receptor binding(GO:0005173) |
| 0.8 | 2.4 | GO:0008330 | protein tyrosine/threonine phosphatase activity(GO:0008330) |
| 0.8 | 20.3 | GO:0008392 | arachidonic acid epoxygenase activity(GO:0008392) |
| 0.8 | 24.9 | GO:0009055 | electron carrier activity(GO:0009055) |
| 0.8 | 4.6 | GO:0004616 | phosphogluconate dehydrogenase (decarboxylating) activity(GO:0004616) |
| 0.8 | 2.3 | GO:0003831 | beta-N-acetylglucosaminylglycopeptide beta-1,4-galactosyltransferase activity(GO:0003831) |
| 0.8 | 3.1 | GO:0005219 | ryanodine-sensitive calcium-release channel activity(GO:0005219) calcium-induced calcium release activity(GO:0048763) |
| 0.8 | 3.8 | GO:0004416 | hydroxyacylglutathione hydrolase activity(GO:0004416) |
| 0.8 | 5.3 | GO:0043495 | protein anchor(GO:0043495) |
| 0.7 | 3.0 | GO:0033149 | FFAT motif binding(GO:0033149) |
| 0.7 | 4.5 | GO:0004366 | glycerol-3-phosphate O-acyltransferase activity(GO:0004366) |
| 0.7 | 5.2 | GO:0071253 | connexin binding(GO:0071253) |
| 0.7 | 7.4 | GO:0005355 | glucose transmembrane transporter activity(GO:0005355) |
| 0.7 | 3.7 | GO:0070052 | collagen V binding(GO:0070052) |
| 0.7 | 10.4 | GO:0031005 | filamin binding(GO:0031005) |
| 0.7 | 2.2 | GO:0050253 | retinyl-palmitate esterase activity(GO:0050253) |
| 0.7 | 2.2 | GO:0015189 | L-lysine transmembrane transporter activity(GO:0015189) |
| 0.7 | 38.2 | GO:0015459 | potassium channel regulator activity(GO:0015459) |
| 0.7 | 4.3 | GO:0015173 | aromatic amino acid transmembrane transporter activity(GO:0015173) |
| 0.7 | 2.2 | GO:0016316 | phosphatidylinositol-3,4-bisphosphate 4-phosphatase activity(GO:0016316) |
| 0.7 | 6.4 | GO:0001591 | dopamine neurotransmitter receptor activity, coupled via Gi/Go(GO:0001591) |
| 0.7 | 3.5 | GO:0070892 | lipoteichoic acid receptor activity(GO:0070892) |
| 0.7 | 9.2 | GO:0004089 | carbonate dehydratase activity(GO:0004089) |
| 0.7 | 33.7 | GO:0008146 | sulfotransferase activity(GO:0008146) |
| 0.7 | 4.2 | GO:0004689 | phosphorylase kinase activity(GO:0004689) |
| 0.7 | 2.8 | GO:0051377 | mannose-ethanolamine phosphotransferase activity(GO:0051377) |
| 0.7 | 3.5 | GO:0097493 | structural molecule activity conferring elasticity(GO:0097493) |
| 0.7 | 2.1 | GO:0035596 | methylthiotransferase activity(GO:0035596) transferase activity, transferring alkylthio groups(GO:0050497) |
| 0.7 | 6.2 | GO:0019992 | diacylglycerol binding(GO:0019992) |
| 0.7 | 6.8 | GO:0019869 | chloride channel inhibitor activity(GO:0019869) |
| 0.7 | 2.7 | GO:0004822 | isoleucine-tRNA ligase activity(GO:0004822) |
| 0.7 | 3.4 | GO:0004962 | endothelin receptor activity(GO:0004962) |
| 0.7 | 2.7 | GO:0030144 | alpha-1,6-mannosylglycoprotein 6-beta-N-acetylglucosaminyltransferase activity(GO:0030144) |
| 0.7 | 4.0 | GO:0048019 | receptor antagonist activity(GO:0048019) |
| 0.7 | 12.6 | GO:0005521 | lamin binding(GO:0005521) |
| 0.7 | 2.0 | GO:0002114 | interleukin-33 receptor activity(GO:0002114) |
| 0.7 | 7.8 | GO:0000828 | inositol hexakisphosphate kinase activity(GO:0000828) |
| 0.6 | 3.2 | GO:0015204 | urea transmembrane transporter activity(GO:0015204) |
| 0.6 | 64.4 | GO:0016503 | pheromone receptor activity(GO:0016503) |
| 0.6 | 3.8 | GO:0004340 | glucokinase activity(GO:0004340) hexokinase activity(GO:0004396) fructokinase activity(GO:0008865) mannokinase activity(GO:0019158) |
| 0.6 | 2.5 | GO:0050816 | phosphothreonine binding(GO:0050816) |
| 0.6 | 3.1 | GO:0005550 | pheromone binding(GO:0005550) |
| 0.6 | 3.8 | GO:0016004 | phospholipase activator activity(GO:0016004) lipase activator activity(GO:0060229) |
| 0.6 | 6.3 | GO:0003680 | AT DNA binding(GO:0003680) |
| 0.6 | 11.8 | GO:0030247 | pattern binding(GO:0001871) polysaccharide binding(GO:0030247) |
| 0.6 | 3.7 | GO:0004694 | eukaryotic translation initiation factor 2alpha kinase activity(GO:0004694) |
| 0.6 | 4.9 | GO:0004859 | phospholipase inhibitor activity(GO:0004859) |
| 0.6 | 2.4 | GO:0004594 | pantothenate kinase activity(GO:0004594) |
| 0.6 | 3.6 | GO:0016661 | oxidoreductase activity, acting on other nitrogenous compounds as donors(GO:0016661) |
| 0.6 | 240.3 | GO:0005549 | odorant binding(GO:0005549) |
| 0.6 | 3.5 | GO:0047696 | beta-adrenergic receptor kinase activity(GO:0047696) |
| 0.6 | 3.5 | GO:0015349 | thyroid hormone transmembrane transporter activity(GO:0015349) |
| 0.6 | 27.2 | GO:0070888 | E-box binding(GO:0070888) |
| 0.6 | 10.9 | GO:0000062 | fatty-acyl-CoA binding(GO:0000062) |
| 0.6 | 2.3 | GO:0016416 | carnitine O-palmitoyltransferase activity(GO:0004095) O-palmitoyltransferase activity(GO:0016416) |
| 0.6 | 6.3 | GO:0022889 | L-serine transmembrane transporter activity(GO:0015194) serine transmembrane transporter activity(GO:0022889) |
| 0.6 | 10.9 | GO:0004435 | phosphatidylinositol phospholipase C activity(GO:0004435) |
| 0.6 | 4.0 | GO:0035375 | zymogen binding(GO:0035375) |
| 0.6 | 7.8 | GO:0034185 | apolipoprotein binding(GO:0034185) |
| 0.6 | 6.1 | GO:0005223 | intracellular cGMP activated cation channel activity(GO:0005223) |
| 0.6 | 2.8 | GO:0005534 | galactose binding(GO:0005534) |
| 0.5 | 9.1 | GO:0030276 | clathrin binding(GO:0030276) |
| 0.5 | 1.6 | GO:0030297 | transmembrane receptor protein tyrosine kinase activator activity(GO:0030297) |
| 0.5 | 4.8 | GO:0017110 | nucleoside-diphosphatase activity(GO:0017110) |
| 0.5 | 4.7 | GO:0000774 | adenyl-nucleotide exchange factor activity(GO:0000774) |
| 0.5 | 2.1 | GO:0004301 | epoxide hydrolase activity(GO:0004301) |
| 0.5 | 464.8 | GO:0004984 | olfactory receptor activity(GO:0004984) |
| 0.5 | 4.2 | GO:0004035 | alkaline phosphatase activity(GO:0004035) |
| 0.5 | 6.2 | GO:0019911 | structural constituent of myelin sheath(GO:0019911) |
| 0.5 | 2.9 | GO:0070290 | N-acylphosphatidylethanolamine-specific phospholipase D activity(GO:0070290) |
| 0.5 | 3.4 | GO:0030160 | GKAP/Homer scaffold activity(GO:0030160) |
| 0.5 | 5.3 | GO:0016783 | sulfurtransferase activity(GO:0016783) |
| 0.5 | 6.2 | GO:0005391 | sodium:potassium-exchanging ATPase activity(GO:0005391) |
| 0.5 | 1.9 | GO:0008569 | ATP-dependent microtubule motor activity, minus-end-directed(GO:0008569) |
| 0.5 | 2.4 | GO:0004784 | superoxide dismutase activity(GO:0004784) oxidoreductase activity, acting on superoxide radicals as acceptor(GO:0016721) |
| 0.5 | 3.8 | GO:0005351 | sugar:proton symporter activity(GO:0005351) |
| 0.5 | 2.4 | GO:0070728 | leucine binding(GO:0070728) |
| 0.5 | 4.7 | GO:0070679 | inositol 1,4,5 trisphosphate binding(GO:0070679) |
| 0.5 | 3.3 | GO:0015277 | kainate selective glutamate receptor activity(GO:0015277) |
| 0.5 | 2.8 | GO:0004826 | phenylalanine-tRNA ligase activity(GO:0004826) |
| 0.5 | 3.3 | GO:1990430 | extracellular matrix protein binding(GO:1990430) |
| 0.5 | 1.8 | GO:0010465 | nerve growth factor receptor activity(GO:0010465) |
| 0.5 | 4.1 | GO:0046975 | histone methyltransferase activity (H3-K36 specific)(GO:0046975) |
| 0.5 | 1.8 | GO:0015165 | pyrimidine nucleotide-sugar transmembrane transporter activity(GO:0015165) |
| 0.5 | 0.9 | GO:0030942 | endoplasmic reticulum signal peptide binding(GO:0030942) |
| 0.5 | 3.2 | GO:0016286 | small conductance calcium-activated potassium channel activity(GO:0016286) |
| 0.5 | 6.8 | GO:0016854 | racemase and epimerase activity(GO:0016854) |
| 0.5 | 9.0 | GO:0046933 | proton-transporting ATP synthase activity, rotational mechanism(GO:0046933) |
| 0.4 | 11.1 | GO:0004383 | guanylate cyclase activity(GO:0004383) |
| 0.4 | 5.3 | GO:0016884 | carbon-nitrogen ligase activity, with glutamine as amido-N-donor(GO:0016884) |
| 0.4 | 11.4 | GO:0005520 | insulin-like growth factor binding(GO:0005520) |
| 0.4 | 3.9 | GO:0086080 | protein binding involved in heterotypic cell-cell adhesion(GO:0086080) |
| 0.4 | 4.6 | GO:0004653 | polypeptide N-acetylgalactosaminyltransferase activity(GO:0004653) |
| 0.4 | 12.7 | GO:0019706 | protein-cysteine S-palmitoyltransferase activity(GO:0019706) protein-cysteine S-acyltransferase activity(GO:0019707) |
| 0.4 | 11.9 | GO:0008307 | structural constituent of muscle(GO:0008307) |
| 0.4 | 3.2 | GO:0017070 | U6 snRNA binding(GO:0017070) |
| 0.4 | 6.8 | GO:0030506 | ankyrin binding(GO:0030506) |
| 0.4 | 9.6 | GO:0051539 | 4 iron, 4 sulfur cluster binding(GO:0051539) |
| 0.4 | 1.9 | GO:0008502 | melatonin receptor activity(GO:0008502) |
| 0.4 | 2.7 | GO:0008273 | calcium, potassium:sodium antiporter activity(GO:0008273) |
| 0.4 | 1.5 | GO:0004719 | protein-L-isoaspartate (D-aspartate) O-methyltransferase activity(GO:0004719) |
| 0.4 | 4.5 | GO:0019763 | immunoglobulin receptor activity(GO:0019763) |
| 0.4 | 3.7 | GO:1904264 | ubiquitin protein ligase activity involved in ERAD pathway(GO:1904264) |
| 0.4 | 1.1 | GO:0009041 | uridylate kinase activity(GO:0009041) nucleoside phosphate kinase activity(GO:0050145) |
| 0.4 | 6.2 | GO:0051879 | Hsp90 protein binding(GO:0051879) |
| 0.4 | 2.2 | GO:0003923 | GPI-anchor transamidase activity(GO:0003923) |
| 0.4 | 6.2 | GO:0005161 | platelet-derived growth factor receptor binding(GO:0005161) |
| 0.4 | 4.7 | GO:0004791 | thioredoxin-disulfide reductase activity(GO:0004791) |
| 0.4 | 5.0 | GO:0034237 | protein kinase A regulatory subunit binding(GO:0034237) |
| 0.4 | 1.4 | GO:0055100 | adiponectin binding(GO:0055100) |
| 0.4 | 7.8 | GO:0005112 | Notch binding(GO:0005112) |
| 0.3 | 11.1 | GO:0043539 | protein serine/threonine kinase activator activity(GO:0043539) |
| 0.3 | 1.4 | GO:0047276 | N-acetyllactosaminide 3-alpha-galactosyltransferase activity(GO:0047276) |
| 0.3 | 4.5 | GO:0035497 | cAMP response element binding(GO:0035497) |
| 0.3 | 2.4 | GO:0005004 | GPI-linked ephrin receptor activity(GO:0005004) |
| 0.3 | 8.4 | GO:0070273 | phosphatidylinositol-4-phosphate binding(GO:0070273) |
| 0.3 | 2.0 | GO:0090482 | vitamin transmembrane transporter activity(GO:0090482) |
| 0.3 | 1.3 | GO:0016972 | thiol oxidase activity(GO:0016972) |
| 0.3 | 6.3 | GO:0017049 | GTP-Rho binding(GO:0017049) |
| 0.3 | 4.3 | GO:0016805 | dipeptidase activity(GO:0016805) |
| 0.3 | 2.0 | GO:0033691 | sialic acid binding(GO:0033691) |
| 0.3 | 3.9 | GO:0047372 | acylglycerol lipase activity(GO:0047372) |
| 0.3 | 6.4 | GO:0005246 | calcium channel regulator activity(GO:0005246) |
| 0.3 | 2.2 | GO:0015217 | ATP transmembrane transporter activity(GO:0005347) ADP transmembrane transporter activity(GO:0015217) |
| 0.3 | 1.6 | GO:0047429 | nucleoside-triphosphate diphosphatase activity(GO:0047429) |
| 0.3 | 3.5 | GO:0048407 | platelet-derived growth factor binding(GO:0048407) |
| 0.3 | 1.9 | GO:0032051 | clathrin light chain binding(GO:0032051) |
| 0.3 | 2.5 | GO:0001055 | RNA polymerase II activity(GO:0001055) |
| 0.3 | 7.7 | GO:0070330 | aromatase activity(GO:0070330) |
| 0.3 | 3.1 | GO:0004331 | fructose-2,6-bisphosphate 2-phosphatase activity(GO:0004331) |
| 0.3 | 0.9 | GO:0004332 | fructose-bisphosphate aldolase activity(GO:0004332) |
| 0.3 | 4.5 | GO:0008376 | acetylgalactosaminyltransferase activity(GO:0008376) |
| 0.3 | 1.2 | GO:0008499 | UDP-galactose:beta-N-acetylglucosamine beta-1,3-galactosyltransferase activity(GO:0008499) |
| 0.3 | 8.3 | GO:0035035 | histone acetyltransferase binding(GO:0035035) |
| 0.3 | 9.0 | GO:0035255 | ionotropic glutamate receptor binding(GO:0035255) |
| 0.3 | 0.9 | GO:0004346 | glucose-6-phosphatase activity(GO:0004346) sugar-terminal-phosphatase activity(GO:0050309) |
| 0.3 | 1.4 | GO:0005148 | prolactin receptor binding(GO:0005148) |
| 0.3 | 3.3 | GO:0045294 | alpha-catenin binding(GO:0045294) |
| 0.3 | 1.1 | GO:1901612 | cardiolipin binding(GO:1901612) |
| 0.3 | 5.2 | GO:0008378 | galactosyltransferase activity(GO:0008378) |
| 0.3 | 2.7 | GO:1990380 | Lys48-specific deubiquitinase activity(GO:1990380) |
| 0.3 | 2.2 | GO:0016413 | O-acetyltransferase activity(GO:0016413) |
| 0.3 | 11.3 | GO:0030507 | spectrin binding(GO:0030507) |
| 0.3 | 4.3 | GO:0004549 | tRNA-specific ribonuclease activity(GO:0004549) |
| 0.3 | 4.6 | GO:0001222 | transcription corepressor binding(GO:0001222) |
| 0.3 | 1.3 | GO:0004614 | phosphoglucomutase activity(GO:0004614) |
| 0.3 | 4.1 | GO:0005545 | 1-phosphatidylinositol binding(GO:0005545) |
| 0.3 | 6.6 | GO:0004709 | MAP kinase kinase kinase activity(GO:0004709) |
| 0.3 | 0.8 | GO:0000026 | alpha-1,2-mannosyltransferase activity(GO:0000026) |
| 0.2 | 2.5 | GO:0031210 | phosphatidylcholine binding(GO:0031210) |
| 0.2 | 0.7 | GO:0016670 | oxidoreductase activity, acting on a sulfur group of donors, oxygen as acceptor(GO:0016670) |
| 0.2 | 2.4 | GO:0042577 | lipid phosphatase activity(GO:0042577) |
| 0.2 | 4.7 | GO:0070412 | R-SMAD binding(GO:0070412) |
| 0.2 | 1.6 | GO:0015368 | calcium:sodium antiporter activity(GO:0005432) calcium:cation antiporter activity(GO:0015368) |
| 0.2 | 3.5 | GO:0005092 | GDP-dissociation inhibitor activity(GO:0005092) |
| 0.2 | 4.0 | GO:0017128 | phospholipid scramblase activity(GO:0017128) |
| 0.2 | 0.2 | GO:0001083 | transcription factor activity, RNA polymerase II basal transcription factor binding(GO:0001083) |
| 0.2 | 14.5 | GO:0005518 | collagen binding(GO:0005518) |
| 0.2 | 21.3 | GO:0003705 | transcription factor activity, RNA polymerase II distal enhancer sequence-specific binding(GO:0003705) |
| 0.2 | 1.5 | GO:0016018 | cyclosporin A binding(GO:0016018) |
| 0.2 | 5.0 | GO:0017075 | syntaxin-1 binding(GO:0017075) |
| 0.2 | 4.8 | GO:0005212 | structural constituent of eye lens(GO:0005212) |
| 0.2 | 1.3 | GO:0015280 | ligand-gated sodium channel activity(GO:0015280) |
| 0.2 | 4.3 | GO:0010485 | H4 histone acetyltransferase activity(GO:0010485) |
| 0.2 | 2.1 | GO:0034450 | ubiquitin-ubiquitin ligase activity(GO:0034450) |
| 0.2 | 8.9 | GO:0017112 | Rab guanyl-nucleotide exchange factor activity(GO:0017112) |
| 0.2 | 3.9 | GO:0008137 | NADH dehydrogenase (ubiquinone) activity(GO:0008137) NADH dehydrogenase (quinone) activity(GO:0050136) |
| 0.2 | 2.5 | GO:0051540 | iron-sulfur cluster binding(GO:0051536) metal cluster binding(GO:0051540) |
| 0.2 | 1.8 | GO:0008553 | hydrogen-exporting ATPase activity, phosphorylative mechanism(GO:0008553) |
| 0.2 | 10.0 | GO:0005245 | voltage-gated calcium channel activity(GO:0005245) |
| 0.2 | 3.0 | GO:0016864 | protein disulfide isomerase activity(GO:0003756) intramolecular oxidoreductase activity, transposing S-S bonds(GO:0016864) |
| 0.2 | 2.6 | GO:0043395 | heparan sulfate proteoglycan binding(GO:0043395) |
| 0.2 | 3.9 | GO:0003746 | translation elongation factor activity(GO:0003746) |
| 0.2 | 1.0 | GO:0005329 | dopamine transmembrane transporter activity(GO:0005329) |
| 0.2 | 0.6 | GO:0005135 | interleukin-3 receptor binding(GO:0005135) |
| 0.2 | 1.7 | GO:0070016 | armadillo repeat domain binding(GO:0070016) |
| 0.2 | 0.6 | GO:0016406 | carnitine O-acyltransferase activity(GO:0016406) |
| 0.2 | 4.2 | GO:0005158 | insulin receptor binding(GO:0005158) |
| 0.2 | 9.2 | GO:0005262 | calcium channel activity(GO:0005262) |
| 0.2 | 4.7 | GO:0050660 | flavin adenine dinucleotide binding(GO:0050660) |
| 0.2 | 4.9 | GO:0005540 | hyaluronic acid binding(GO:0005540) |
| 0.2 | 0.7 | GO:0031544 | peptidyl-proline 3-dioxygenase activity(GO:0031544) |
| 0.2 | 4.1 | GO:0016776 | phosphotransferase activity, phosphate group as acceptor(GO:0016776) |
| 0.2 | 1.6 | GO:0016918 | retinal binding(GO:0016918) |
| 0.2 | 1.6 | GO:0015266 | protein channel activity(GO:0015266) |
| 0.2 | 7.8 | GO:0019209 | kinase activator activity(GO:0019209) |
| 0.2 | 1.2 | GO:0017162 | aryl hydrocarbon receptor binding(GO:0017162) |
| 0.2 | 5.3 | GO:0046875 | ephrin receptor binding(GO:0046875) |
| 0.2 | 2.4 | GO:0017017 | MAP kinase tyrosine/serine/threonine phosphatase activity(GO:0017017) |
| 0.2 | 2.9 | GO:0048038 | quinone binding(GO:0048038) |
| 0.2 | 1.3 | GO:0017151 | DEAD/H-box RNA helicase binding(GO:0017151) |
| 0.2 | 0.8 | GO:0005111 | type 2 fibroblast growth factor receptor binding(GO:0005111) |
| 0.2 | 2.3 | GO:0030676 | Rac guanyl-nucleotide exchange factor activity(GO:0030676) |
| 0.2 | 2.0 | GO:0016594 | glycine binding(GO:0016594) |
| 0.2 | 0.6 | GO:0004645 | phosphorylase activity(GO:0004645) |
| 0.2 | 1.4 | GO:0051021 | GDP-dissociation inhibitor binding(GO:0051021) |
| 0.2 | 1.6 | GO:1990825 | sequence-specific mRNA binding(GO:1990825) |
| 0.2 | 0.5 | GO:0004852 | uroporphyrinogen-III synthase activity(GO:0004852) |
| 0.2 | 0.9 | GO:0017040 | ceramidase activity(GO:0017040) |
| 0.2 | 4.5 | GO:0005484 | SNAP receptor activity(GO:0005484) |
| 0.1 | 1.3 | GO:0016778 | diphosphotransferase activity(GO:0016778) |
| 0.1 | 1.6 | GO:0052744 | phosphatidylinositol monophosphate phosphatase activity(GO:0052744) |
| 0.1 | 0.7 | GO:0005052 | peroxisome matrix targeting signal-1 binding(GO:0005052) |
| 0.1 | 0.3 | GO:0047631 | ADP-ribose diphosphatase activity(GO:0047631) |
| 0.1 | 7.3 | GO:0005200 | structural constituent of cytoskeleton(GO:0005200) |
| 0.1 | 5.8 | GO:0048365 | Rac GTPase binding(GO:0048365) |
| 0.1 | 1.1 | GO:1990247 | N6-methyladenosine-containing RNA binding(GO:1990247) |
| 0.1 | 2.5 | GO:1901505 | carbohydrate derivative transporter activity(GO:1901505) |
| 0.1 | 0.9 | GO:0043008 | ATP-dependent protein binding(GO:0043008) |
| 0.1 | 5.3 | GO:0016876 | aminoacyl-tRNA ligase activity(GO:0004812) ligase activity, forming carbon-oxygen bonds(GO:0016875) ligase activity, forming aminoacyl-tRNA and related compounds(GO:0016876) |
| 0.1 | 0.4 | GO:0004918 | interleukin-8 receptor activity(GO:0004918) |
| 0.1 | 1.1 | GO:0044213 | intronic transcription regulatory region sequence-specific DNA binding(GO:0001161) intronic transcription regulatory region DNA binding(GO:0044213) |
| 0.1 | 0.6 | GO:0031779 | melanocortin receptor binding(GO:0031779) type 3 melanocortin receptor binding(GO:0031781) type 4 melanocortin receptor binding(GO:0031782) |
| 0.1 | 0.5 | GO:0043404 | corticotrophin-releasing factor receptor activity(GO:0015056) corticotropin-releasing hormone receptor activity(GO:0043404) |
| 0.1 | 3.2 | GO:0004890 | GABA-A receptor activity(GO:0004890) |
| 0.1 | 2.7 | GO:0001102 | RNA polymerase II activating transcription factor binding(GO:0001102) |
| 0.1 | 1.0 | GO:0019864 | IgG binding(GO:0019864) |
| 0.1 | 3.3 | GO:0001103 | RNA polymerase II repressing transcription factor binding(GO:0001103) |
| 0.1 | 8.7 | GO:0044325 | ion channel binding(GO:0044325) |
| 0.1 | 1.7 | GO:0004115 | 3',5'-cyclic-AMP phosphodiesterase activity(GO:0004115) |
| 0.1 | 0.4 | GO:0042608 | T cell receptor binding(GO:0042608) |
| 0.1 | 2.0 | GO:0004993 | G-protein coupled serotonin receptor activity(GO:0004993) serotonin receptor activity(GO:0099589) |
| 0.1 | 1.2 | GO:0005000 | vasopressin receptor activity(GO:0005000) |
| 0.1 | 0.4 | GO:0045545 | syndecan binding(GO:0045545) |
| 0.1 | 4.8 | GO:0032947 | protein complex scaffold(GO:0032947) |
| 0.1 | 3.0 | GO:0016504 | peptidase activator activity(GO:0016504) |
| 0.1 | 0.3 | GO:0035727 | lysophosphatidic acid binding(GO:0035727) |
| 0.1 | 0.5 | GO:0003886 | DNA (cytosine-5-)-methyltransferase activity(GO:0003886) |
| 0.1 | 0.4 | GO:0031705 | bombesin receptor binding(GO:0031705) |
| 0.1 | 1.4 | GO:0005452 | inorganic anion exchanger activity(GO:0005452) |
| 0.1 | 10.8 | GO:0005179 | hormone activity(GO:0005179) |
| 0.1 | 1.6 | GO:0031420 | alkali metal ion binding(GO:0031420) |
| 0.1 | 1.3 | GO:0046527 | glucosyltransferase activity(GO:0046527) |
| 0.1 | 2.5 | GO:0050699 | WW domain binding(GO:0050699) |
| 0.1 | 4.2 | GO:0005544 | calcium-dependent phospholipid binding(GO:0005544) |
| 0.1 | 0.4 | GO:0008308 | voltage-gated anion channel activity(GO:0008308) |
| 0.1 | 0.6 | GO:0017108 | 5'-flap endonuclease activity(GO:0017108) |
| 0.1 | 1.1 | GO:1900750 | glutathione binding(GO:0043295) oligopeptide binding(GO:1900750) |
| 0.1 | 24.0 | GO:0003779 | actin binding(GO:0003779) |
| 0.1 | 1.2 | GO:0042975 | peroxisome proliferator activated receptor binding(GO:0042975) |
| 0.1 | 0.2 | GO:0031802 | type 5 metabotropic glutamate receptor binding(GO:0031802) |
| 0.1 | 0.8 | GO:0008649 | rRNA methyltransferase activity(GO:0008649) |
| 0.1 | 0.3 | GO:0004711 | ribosomal protein S6 kinase activity(GO:0004711) |
| 0.1 | 0.9 | GO:0008157 | protein phosphatase 1 binding(GO:0008157) |
| 0.1 | 0.4 | GO:0004972 | NMDA glutamate receptor activity(GO:0004972) |
| 0.1 | 0.7 | GO:0005527 | macrolide binding(GO:0005527) FK506 binding(GO:0005528) |
| 0.1 | 0.5 | GO:0070569 | uridylyltransferase activity(GO:0070569) |
| 0.1 | 0.3 | GO:0016724 | ferroxidase activity(GO:0004322) oxidoreductase activity, oxidizing metal ions, oxygen as acceptor(GO:0016724) |
| 0.1 | 0.7 | GO:0008079 | translation release factor activity(GO:0003747) translation termination factor activity(GO:0008079) |
| 0.1 | 0.3 | GO:0045295 | gamma-catenin binding(GO:0045295) |
| 0.1 | 0.2 | GO:0035663 | Toll-like receptor 4 binding(GO:0035662) Toll-like receptor 2 binding(GO:0035663) |
| 0.1 | 0.9 | GO:0009982 | pseudouridine synthase activity(GO:0009982) |
| 0.1 | 0.3 | GO:0071933 | Arp2/3 complex binding(GO:0071933) |
| 0.1 | 0.8 | GO:0070628 | proteasome binding(GO:0070628) |
| 0.1 | 0.6 | GO:0005388 | calcium-transporting ATPase activity(GO:0005388) |
| 0.1 | 4.8 | GO:0008565 | protein transporter activity(GO:0008565) |
| 0.1 | 0.5 | GO:0047555 | 3',5'-cyclic-GMP phosphodiesterase activity(GO:0047555) |
| 0.1 | 1.0 | GO:0016627 | oxidoreductase activity, acting on the CH-CH group of donors(GO:0016627) |
| 0.0 | 1.5 | GO:0030971 | receptor tyrosine kinase binding(GO:0030971) |
| 0.0 | 1.2 | GO:0030170 | pyridoxal phosphate binding(GO:0030170) |
| 0.0 | 0.6 | GO:0047617 | acyl-CoA hydrolase activity(GO:0047617) |
| 0.0 | 0.7 | GO:0015377 | cation:chloride symporter activity(GO:0015377) |
| 0.0 | 0.8 | GO:0000993 | RNA polymerase II core binding(GO:0000993) |
| 0.0 | 0.2 | GO:0035005 | 1-phosphatidylinositol-4-phosphate 3-kinase activity(GO:0035005) |
| 0.0 | 0.2 | GO:0004974 | leukotriene receptor activity(GO:0004974) |
| 0.0 | 1.3 | GO:0019842 | vitamin binding(GO:0019842) |
| 0.0 | 0.3 | GO:0015643 | toxic substance binding(GO:0015643) |
| 0.0 | 0.4 | GO:0008171 | O-methyltransferase activity(GO:0008171) |
| 0.0 | 3.4 | GO:0052689 | carboxylic ester hydrolase activity(GO:0052689) |
| 0.0 | 0.8 | GO:0003755 | peptidyl-prolyl cis-trans isomerase activity(GO:0003755) |
| 0.0 | 0.7 | GO:0048306 | calcium-dependent protein binding(GO:0048306) |
| 0.0 | 0.3 | GO:0043023 | ribosomal large subunit binding(GO:0043023) |
| 0.0 | 0.2 | GO:0019808 | polyamine binding(GO:0019808) |
| 0.0 | 0.2 | GO:0035613 | RNA stem-loop binding(GO:0035613) |
| 0.0 | 2.1 | GO:0030165 | PDZ domain binding(GO:0030165) |
| 0.0 | 1.6 | GO:0001948 | glycoprotein binding(GO:0001948) |
| 0.0 | 0.4 | GO:0001786 | phosphatidylserine binding(GO:0001786) |
| 0.0 | 1.3 | GO:0051117 | ATPase binding(GO:0051117) |
| 0.0 | 0.2 | GO:0022821 | potassium ion antiporter activity(GO:0022821) |
| 0.0 | 0.3 | GO:0017160 | Ral GTPase binding(GO:0017160) |
| 0.0 | 8.7 | GO:0005198 | structural molecule activity(GO:0005198) |
| 0.0 | 0.2 | GO:0045236 | CXCR chemokine receptor binding(GO:0045236) |
| 0.0 | 0.3 | GO:0030544 | Hsp70 protein binding(GO:0030544) |
Gene overrepresentation in curated gene sets: canonical pathways category:
| Log-likelihood per target | Total log-likelihood | Term | Description |
|---|---|---|---|
| 3.7 | 3.7 | PID PI3KCI AKT PATHWAY | Class I PI3K signaling events mediated by Akt |
| 2.4 | 76.4 | PID HDAC CLASSIII PATHWAY | Signaling events mediated by HDAC Class III |
| 1.8 | 34.2 | PID ERBB NETWORK PATHWAY | ErbB receptor signaling network |
| 1.5 | 81.1 | PID HNF3B PATHWAY | FOXA2 and FOXA3 transcription factor networks |
| 1.4 | 18.0 | PID P38 GAMMA DELTA PATHWAY | Signaling mediated by p38-gamma and p38-delta |
| 1.0 | 18.7 | PID LPA4 PATHWAY | LPA4-mediated signaling events |
| 0.9 | 2.7 | PID IL8 CXCR1 PATHWAY | IL8- and CXCR1-mediated signaling events |
| 0.8 | 14.1 | PID CIRCADIAN PATHWAY | Circadian rhythm pathway |
| 0.7 | 33.8 | SIG REGULATION OF THE ACTIN CYTOSKELETON BY RHO GTPASES | Genes related to regulation of the actin cytoskeleton |
| 0.7 | 38.7 | PID HIF1 TFPATHWAY | HIF-1-alpha transcription factor network |
| 0.7 | 49.3 | PID AP1 PATHWAY | AP-1 transcription factor network |
| 0.7 | 32.4 | PID UPA UPAR PATHWAY | Urokinase-type plasminogen activator (uPA) and uPAR-mediated signaling |
| 0.7 | 1.3 | SA G1 AND S PHASES | Cdk2, 4, and 6 bind cyclin D in G1, while cdk2/cyclin E promotes the G1/S transition. |
| 0.7 | 18.9 | ST MYOCYTE AD PATHWAY | Myocyte Adrenergic Pathway is a specific case of the generalized Adrenergic Pathway. |
| 0.6 | 5.0 | PID HIF1A PATHWAY | Hypoxic and oxygen homeostasis regulation of HIF-1-alpha |
| 0.6 | 2.9 | PID VEGFR1 2 PATHWAY | Signaling events mediated by VEGFR1 and VEGFR2 |
| 0.6 | 3.4 | ST G ALPHA I PATHWAY | G alpha i Pathway |
| 0.6 | 15.6 | PID CONE PATHWAY | Visual signal transduction: Cones |
| 0.5 | 23.3 | NABA PROTEOGLYCANS | Genes encoding proteoglycans |
| 0.5 | 13.8 | PID RETINOIC ACID PATHWAY | Retinoic acid receptors-mediated signaling |
| 0.5 | 4.4 | ST WNT BETA CATENIN PATHWAY | Wnt/beta-catenin Pathway |
| 0.5 | 19.7 | PID NCADHERIN PATHWAY | N-cadherin signaling events |
| 0.5 | 7.9 | PID NETRIN PATHWAY | Netrin-mediated signaling events |
| 0.4 | 17.6 | PID ATF2 PATHWAY | ATF-2 transcription factor network |
| 0.4 | 5.4 | PID S1P S1P2 PATHWAY | S1P2 pathway |
| 0.4 | 13.6 | PID P38 ALPHA BETA DOWNSTREAM PATHWAY | Signaling mediated by p38-alpha and p38-beta |
| 0.4 | 3.0 | PID NFKAPPAB ATYPICAL PATHWAY | Atypical NF-kappaB pathway |
| 0.4 | 10.0 | PID NFAT 3PATHWAY | Role of Calcineurin-dependent NFAT signaling in lymphocytes |
| 0.4 | 3.6 | PID IL3 PATHWAY | IL3-mediated signaling events |
| 0.3 | 4.9 | PID LYSOPHOSPHOLIPID PATHWAY | LPA receptor mediated events |
| 0.3 | 8.7 | PID ALK1 PATHWAY | ALK1 signaling events |
| 0.3 | 2.4 | PID INSULIN PATHWAY | Insulin Pathway |
| 0.3 | 7.5 | PID TRAIL PATHWAY | TRAIL signaling pathway |
| 0.3 | 9.6 | PID HNF3A PATHWAY | FOXA1 transcription factor network |
| 0.3 | 11.8 | PID LKB1 PATHWAY | LKB1 signaling events |
| 0.3 | 6.5 | ST ERK1 ERK2 MAPK PATHWAY | ERK1/ERK2 MAPK Pathway |
| 0.3 | 45.6 | NABA ECM AFFILIATED | Genes encoding proteins affiliated structurally or functionally to extracellular matrix proteins |
| 0.3 | 4.7 | PID ERBB4 PATHWAY | ErbB4 signaling events |
| 0.3 | 5.2 | PID RAC1 REG PATHWAY | Regulation of RAC1 activity |
| 0.3 | 6.9 | PID RAS PATHWAY | Regulation of Ras family activation |
| 0.3 | 7.3 | PID ANGIOPOIETIN RECEPTOR PATHWAY | Angiopoietin receptor Tie2-mediated signaling |
| 0.3 | 2.5 | PID IL27 PATHWAY | IL27-mediated signaling events |
| 0.3 | 3.5 | PID ENDOTHELIN PATHWAY | Endothelins |
| 0.3 | 6.4 | PID RXR VDR PATHWAY | RXR and RAR heterodimerization with other nuclear receptor |
| 0.3 | 5.3 | PID ALPHA SYNUCLEIN PATHWAY | Alpha-synuclein signaling |
| 0.3 | 8.6 | PID HES HEY PATHWAY | Notch-mediated HES/HEY network |
| 0.2 | 2.0 | PID TCPTP PATHWAY | Signaling events mediated by TCPTP |
| 0.2 | 2.9 | PID ARF6 DOWNSTREAM PATHWAY | Arf6 downstream pathway |
| 0.2 | 9.8 | PID ERBB1 INTERNALIZATION PATHWAY | Internalization of ErbB1 |
| 0.2 | 13.6 | PID NOTCH PATHWAY | Notch signaling pathway |
| 0.2 | 2.5 | PID RHODOPSIN PATHWAY | Visual signal transduction: Rods |
| 0.2 | 3.3 | PID ARF 3PATHWAY | Arf1 pathway |
| 0.2 | 9.3 | PID AVB3 INTEGRIN PATHWAY | Integrins in angiogenesis |
| 0.2 | 14.8 | PID MYC ACTIV PATHWAY | Validated targets of C-MYC transcriptional activation |
| 0.2 | 1.8 | ST DIFFERENTIATION PATHWAY IN PC12 CELLS | Differentiation Pathway in PC12 Cells; this is a specific case of PAC1 Receptor Pathway. |
| 0.2 | 3.0 | PID RHOA PATHWAY | RhoA signaling pathway |
| 0.2 | 8.1 | PID AR PATHWAY | Coregulation of Androgen receptor activity |
| 0.2 | 1.6 | PID EPHRINB REV PATHWAY | Ephrin B reverse signaling |
| 0.2 | 4.7 | PID INTEGRIN3 PATHWAY | Beta3 integrin cell surface interactions |
| 0.2 | 2.3 | PID NECTIN PATHWAY | Nectin adhesion pathway |
| 0.1 | 1.7 | PID P38 MK2 PATHWAY | p38 signaling mediated by MAPKAP kinases |
| 0.1 | 2.4 | PID FCER1 PATHWAY | Fc-epsilon receptor I signaling in mast cells |
| 0.1 | 2.4 | PID EPHA FWDPATHWAY | EPHA forward signaling |
| 0.1 | 2.2 | SIG CD40PATHWAYMAP | Genes related to CD40 signaling |
| 0.1 | 5.8 | PID RHOA REG PATHWAY | Regulation of RhoA activity |
| 0.1 | 22.2 | NABA ECM REGULATORS | Genes encoding enzymes and their regulators involved in the remodeling of the extracellular matrix |
| 0.1 | 1.3 | PID KIT PATHWAY | Signaling events mediated by Stem cell factor receptor (c-Kit) |
| 0.1 | 0.6 | SA PROGRAMMED CELL DEATH | Programmed cell death, or apoptosis, eliminates damaged or unneeded cells. |
| 0.1 | 1.2 | PID RET PATHWAY | Signaling events regulated by Ret tyrosine kinase |
| 0.1 | 2.0 | PID IL1 PATHWAY | IL1-mediated signaling events |
| 0.1 | 0.8 | PID RAC1 PATHWAY | RAC1 signaling pathway |
| 0.1 | 1.1 | PID PS1 PATHWAY | Presenilin action in Notch and Wnt signaling |
| 0.1 | 2.3 | PID TGFBR PATHWAY | TGF-beta receptor signaling |
| 0.1 | 1.6 | ST FAS SIGNALING PATHWAY | Fas Signaling Pathway |
| 0.1 | 1.2 | PID INSULIN GLUCOSE PATHWAY | Insulin-mediated glucose transport |
| 0.1 | 0.8 | PID INTEGRIN4 PATHWAY | Alpha6 beta4 integrin-ligand interactions |
| 0.1 | 0.3 | PID RANBP2 PATHWAY | Sumoylation by RanBP2 regulates transcriptional repression |
| 0.1 | 0.5 | PID HIF2PATHWAY | HIF-2-alpha transcription factor network |
| 0.0 | 0.5 | PID GLYPICAN 1PATHWAY | Glypican 1 network |
| 0.0 | 0.8 | PID WNT SIGNALING PATHWAY | Wnt signaling network |
| 0.0 | 0.2 | PID IL6 7 PATHWAY | IL6-mediated signaling events |
| 0.0 | 0.2 | PID PI3KCI PATHWAY | Class I PI3K signaling events |
| 0.0 | 0.2 | PID TOLL ENDOGENOUS PATHWAY | Endogenous TLR signaling |
| 0.0 | 0.2 | PID ERB GENOMIC PATHWAY | Validated nuclear estrogen receptor beta network |
Gene overrepresentation in curated gene sets: REACTOME pathways category:
| Log-likelihood per target | Total log-likelihood | Term | Description |
|---|---|---|---|
| 6.2 | 50.0 | REACTOME ETHANOL OXIDATION | Genes involved in Ethanol oxidation |
| 4.1 | 53.3 | REACTOME CIRCADIAN REPRESSION OF EXPRESSION BY REV ERBA | Genes involved in Circadian Repression of Expression by REV-ERBA |
| 2.2 | 85.1 | REACTOME STRIATED MUSCLE CONTRACTION | Genes involved in Striated Muscle Contraction |
| 2.0 | 28.4 | REACTOME MITOCHONDRIAL FATTY ACID BETA OXIDATION | Genes involved in Mitochondrial Fatty Acid Beta-Oxidation |
| 1.9 | 54.2 | REACTOME YAP1 AND WWTR1 TAZ STIMULATED GENE EXPRESSION | Genes involved in YAP1- and WWTR1 (TAZ)-stimulated gene expression |
| 1.9 | 28.8 | REACTOME REGULATION OF PYRUVATE DEHYDROGENASE PDH COMPLEX | Genes involved in Regulation of pyruvate dehydrogenase (PDH) complex |
| 1.9 | 33.9 | REACTOME OTHER SEMAPHORIN INTERACTIONS | Genes involved in Other semaphorin interactions |
| 1.7 | 15.7 | REACTOME DEFENSINS | Genes involved in Defensins |
| 1.7 | 29.2 | REACTOME BRANCHED CHAIN AMINO ACID CATABOLISM | Genes involved in Branched-chain amino acid catabolism |
| 1.7 | 23.3 | REACTOME REGULATION OF COMPLEMENT CASCADE | Genes involved in Regulation of Complement cascade |
| 1.6 | 65.6 | REACTOME GLUCONEOGENESIS | Genes involved in Gluconeogenesis |
| 1.6 | 14.6 | REACTOME GAP JUNCTION DEGRADATION | Genes involved in Gap junction degradation |
| 1.6 | 23.5 | REACTOME TERMINATION OF O GLYCAN BIOSYNTHESIS | Genes involved in Termination of O-glycan biosynthesis |
| 1.5 | 11.7 | REACTOME PROSTANOID LIGAND RECEPTORS | Genes involved in Prostanoid ligand receptors |
| 1.4 | 19.0 | REACTOME KERATAN SULFATE DEGRADATION | Genes involved in Keratan sulfate degradation |
| 1.3 | 37.7 | REACTOME GRB2 EVENTS IN ERBB2 SIGNALING | Genes involved in GRB2 events in ERBB2 signaling |
| 1.3 | 21.3 | REACTOME CHYLOMICRON MEDIATED LIPID TRANSPORT | Genes involved in Chylomicron-mediated lipid transport |
| 1.2 | 4.9 | REACTOME SYNTHESIS OF PE | Genes involved in Synthesis of PE |
| 1.2 | 25.7 | REACTOME ACTIVATED AMPK STIMULATES FATTY ACID OXIDATION IN MUSCLE | Genes involved in Activated AMPK stimulates fatty-acid oxidation in muscle |
| 1.1 | 18.2 | REACTOME IONOTROPIC ACTIVITY OF KAINATE RECEPTORS | Genes involved in Ionotropic activity of Kainate Receptors |
| 1.1 | 14.5 | REACTOME CYTOSOLIC SULFONATION OF SMALL MOLECULES | Genes involved in Cytosolic sulfonation of small molecules |
| 1.1 | 69.9 | REACTOME RESPIRATORY ELECTRON TRANSPORT | Genes involved in Respiratory electron transport |
| 1.1 | 21.4 | REACTOME SYNTHESIS SECRETION AND INACTIVATION OF GLP1 | Genes involved in Synthesis, Secretion, and Inactivation of Glucagon-like Peptide-1 (GLP-1) |
| 1.1 | 8.5 | REACTOME SPRY REGULATION OF FGF SIGNALING | Genes involved in Spry regulation of FGF signaling |
| 1.1 | 13.7 | REACTOME PYRIMIDINE CATABOLISM | Genes involved in Pyrimidine catabolism |
| 1.0 | 16.8 | REACTOME FACILITATIVE NA INDEPENDENT GLUCOSE TRANSPORTERS | Genes involved in Facilitative Na+-independent glucose transporters |
| 1.0 | 27.5 | REACTOME CASPASE MEDIATED CLEAVAGE OF CYTOSKELETAL PROTEINS | Genes involved in Caspase-mediated cleavage of cytoskeletal proteins |
| 0.9 | 23.5 | REACTOME SYNTHESIS OF PC | Genes involved in Synthesis of PC |
| 0.9 | 14.6 | REACTOME AMINE DERIVED HORMONES | Genes involved in Amine-derived hormones |
| 0.9 | 151.7 | REACTOME METABOLISM OF AMINO ACIDS AND DERIVATIVES | Genes involved in Metabolism of amino acids and derivatives |
| 0.9 | 59.8 | REACTOME NUCLEAR RECEPTOR TRANSCRIPTION PATHWAY | Genes involved in Nuclear Receptor transcription pathway |
| 0.9 | 14.9 | REACTOME GLYCOGEN BREAKDOWN GLYCOGENOLYSIS | Genes involved in Glycogen breakdown (glycogenolysis) |
| 0.9 | 8.7 | REACTOME REGULATION OF INSULIN SECRETION BY ACETYLCHOLINE | Genes involved in Regulation of Insulin Secretion by Acetylcholine |
| 0.9 | 12.1 | REACTOME TIE2 SIGNALING | Genes involved in Tie2 Signaling |
| 0.9 | 10.3 | REACTOME SIGNALING BY NOTCH2 | Genes involved in Signaling by NOTCH2 |
| 0.8 | 20.7 | REACTOME GLUCOSE METABOLISM | Genes involved in Glucose metabolism |
| 0.8 | 13.9 | REACTOME GLUCURONIDATION | Genes involved in Glucuronidation |
| 0.8 | 10.6 | REACTOME GRB2 SOS PROVIDES LINKAGE TO MAPK SIGNALING FOR INTERGRINS | Genes involved in GRB2:SOS provides linkage to MAPK signaling for Intergrins |
| 0.8 | 9.4 | REACTOME PASSIVE TRANSPORT BY AQUAPORINS | Genes involved in Passive Transport by Aquaporins |
| 0.8 | 7.7 | REACTOME PTM GAMMA CARBOXYLATION HYPUSINE FORMATION AND ARYLSULFATASE ACTIVATION | Genes involved in PTM: gamma carboxylation, hypusine formation and arylsulfatase activation |
| 0.8 | 18.4 | REACTOME DCC MEDIATED ATTRACTIVE SIGNALING | Genes involved in DCC mediated attractive signaling |
| 0.7 | 12.6 | REACTOME METABOLISM OF PORPHYRINS | Genes involved in Metabolism of porphyrins |
| 0.7 | 12.6 | REACTOME OXYGEN DEPENDENT PROLINE HYDROXYLATION OF HYPOXIA INDUCIBLE FACTOR ALPHA | Genes involved in Oxygen-dependent Proline Hydroxylation of Hypoxia-inducible Factor Alpha |
| 0.7 | 10.9 | REACTOME MUSCLE CONTRACTION | Genes involved in Muscle contraction |
| 0.7 | 6.8 | REACTOME GLUTAMATE NEUROTRANSMITTER RELEASE CYCLE | Genes involved in Glutamate Neurotransmitter Release Cycle |
| 0.7 | 24.3 | REACTOME GLYCOSPHINGOLIPID METABOLISM | Genes involved in Glycosphingolipid metabolism |
| 0.7 | 16.8 | REACTOME INSULIN SYNTHESIS AND PROCESSING | Genes involved in Insulin Synthesis and Processing |
| 0.7 | 7.2 | REACTOME COMMON PATHWAY | Genes involved in Common Pathway |
| 0.6 | 13.1 | REACTOME DARPP 32 EVENTS | Genes involved in DARPP-32 events |
| 0.6 | 15.3 | REACTOME PLATELET CALCIUM HOMEOSTASIS | Genes involved in Platelet calcium homeostasis |
| 0.6 | 6.6 | REACTOME CITRIC ACID CYCLE TCA CYCLE | Genes involved in Citric acid cycle (TCA cycle) |
| 0.6 | 12.4 | REACTOME MITOCHONDRIAL TRNA AMINOACYLATION | Genes involved in Mitochondrial tRNA aminoacylation |
| 0.6 | 12.7 | REACTOME GABA SYNTHESIS RELEASE REUPTAKE AND DEGRADATION | Genes involved in GABA synthesis, release, reuptake and degradation |
| 0.6 | 3.4 | REACTOME ALPHA LINOLENIC ACID ALA METABOLISM | Genes involved in alpha-linolenic acid (ALA) metabolism |
| 0.6 | 6.8 | REACTOME NEPHRIN INTERACTIONS | Genes involved in Nephrin interactions |
| 0.6 | 8.3 | REACTOME ACTIVATION OF RAC | Genes involved in Activation of Rac |
| 0.5 | 1.1 | REACTOME RORA ACTIVATES CIRCADIAN EXPRESSION | Genes involved in RORA Activates Circadian Expression |
| 0.5 | 53.7 | REACTOME TRANSPORT OF INORGANIC CATIONS ANIONS AND AMINO ACIDS OLIGOPEPTIDES | Genes involved in Transport of inorganic cations/anions and amino acids/oligopeptides |
| 0.5 | 21.7 | REACTOME TRIGLYCERIDE BIOSYNTHESIS | Genes involved in Triglyceride Biosynthesis |
| 0.5 | 16.6 | REACTOME TIGHT JUNCTION INTERACTIONS | Genes involved in Tight junction interactions |
| 0.5 | 20.8 | REACTOME NCAM1 INTERACTIONS | Genes involved in NCAM1 interactions |
| 0.5 | 2.8 | REACTOME DIGESTION OF DIETARY CARBOHYDRATE | Genes involved in Digestion of dietary carbohydrate |
| 0.5 | 11.6 | REACTOME HS GAG BIOSYNTHESIS | Genes involved in HS-GAG biosynthesis |
| 0.4 | 5.3 | REACTOME HDL MEDIATED LIPID TRANSPORT | Genes involved in HDL-mediated lipid transport |
| 0.4 | 6.6 | REACTOME INHIBITION OF VOLTAGE GATED CA2 CHANNELS VIA GBETA GAMMA SUBUNITS | Genes involved in Inhibition of voltage gated Ca2+ channels via Gbeta/gamma subunits |
| 0.4 | 3.5 | REACTOME TRANSPORT OF ORGANIC ANIONS | Genes involved in Transport of organic anions |
| 0.4 | 5.3 | REACTOME P2Y RECEPTORS | Genes involved in P2Y receptors |
| 0.4 | 2.6 | REACTOME SYNTHESIS SECRETION AND DEACYLATION OF GHRELIN | Genes involved in Synthesis, Secretion, and Deacylation of Ghrelin |
| 0.4 | 5.0 | REACTOME VITAMIN B5 PANTOTHENATE METABOLISM | Genes involved in Vitamin B5 (pantothenate) metabolism |
| 0.4 | 2.9 | REACTOME SIGNALLING TO P38 VIA RIT AND RIN | Genes involved in Signalling to p38 via RIT and RIN |
| 0.4 | 15.8 | REACTOME PHASE1 FUNCTIONALIZATION OF COMPOUNDS | Genes involved in Phase 1 - Functionalization of compounds |
| 0.4 | 9.1 | REACTOME SEMA4D INDUCED CELL MIGRATION AND GROWTH CONE COLLAPSE | Genes involved in Sema4D induced cell migration and growth-cone collapse |
| 0.4 | 3.5 | REACTOME SEMA3A PLEXIN REPULSION SIGNALING BY INHIBITING INTEGRIN ADHESION | Genes involved in SEMA3A-Plexin repulsion signaling by inhibiting Integrin adhesion |
| 0.4 | 7.8 | REACTOME REGULATION OF INSULIN LIKE GROWTH FACTOR IGF ACTIVITY BY INSULIN LIKE GROWTH FACTOR BINDING PROTEINS IGFBPS | Genes involved in Regulation of Insulin-like Growth Factor (IGF) Activity by Insulin-like Growth Factor Binding Proteins (IGFBPs) |
| 0.4 | 12.9 | REACTOME REGULATION OF INSULIN SECRETION BY GLUCAGON LIKE PEPTIDE1 | Genes involved in Regulation of Insulin Secretion by Glucagon-like Peptide-1 |
| 0.4 | 6.1 | REACTOME PURINE SALVAGE | Genes involved in Purine salvage |
| 0.4 | 2.9 | REACTOME A TETRASACCHARIDE LINKER SEQUENCE IS REQUIRED FOR GAG SYNTHESIS | Genes involved in A tetrasaccharide linker sequence is required for GAG synthesis |
| 0.4 | 3.9 | REACTOME HORMONE SENSITIVE LIPASE HSL MEDIATED TRIACYLGLYCEROL HYDROLYSIS | Genes involved in Hormone-sensitive lipase (HSL)-mediated triacylglycerol hydrolysis |
| 0.3 | 3.1 | REACTOME G PROTEIN ACTIVATION | Genes involved in G-protein activation |
| 0.3 | 4.2 | REACTOME CREB PHOSPHORYLATION THROUGH THE ACTIVATION OF CAMKII | Genes involved in CREB phosphorylation through the activation of CaMKII |
| 0.3 | 8.1 | REACTOME TRNA AMINOACYLATION | Genes involved in tRNA Aminoacylation |
| 0.3 | 1.3 | REACTOME OLFACTORY SIGNALING PATHWAY | Genes involved in Olfactory Signaling Pathway |
| 0.3 | 8.7 | REACTOME CIRCADIAN CLOCK | Genes involved in Circadian Clock |
| 0.3 | 11.6 | REACTOME AMINE LIGAND BINDING RECEPTORS | Genes involved in Amine ligand-binding receptors |
| 0.3 | 2.6 | REACTOME PRE NOTCH PROCESSING IN GOLGI | Genes involved in Pre-NOTCH Processing in Golgi |
| 0.3 | 2.0 | REACTOME ERKS ARE INACTIVATED | Genes involved in ERKs are inactivated |
| 0.3 | 4.5 | REACTOME SYNTHESIS OF SUBSTRATES IN N GLYCAN BIOSYTHESIS | Genes involved in Synthesis of substrates in N-glycan biosythesis |
| 0.3 | 4.0 | REACTOME PROTEOLYTIC CLEAVAGE OF SNARE COMPLEX PROTEINS | Genes involved in Proteolytic cleavage of SNARE complex proteins |
| 0.3 | 10.8 | REACTOME MITOCHONDRIAL PROTEIN IMPORT | Genes involved in Mitochondrial Protein Import |
| 0.3 | 1.8 | REACTOME SYNTHESIS OF BILE ACIDS AND BILE SALTS VIA 24 HYDROXYCHOLESTEROL | Genes involved in Synthesis of bile acids and bile salts via 24-hydroxycholesterol |
| 0.2 | 2.2 | REACTOME BASIGIN INTERACTIONS | Genes involved in Basigin interactions |
| 0.2 | 11.0 | REACTOME GLYCEROPHOSPHOLIPID BIOSYNTHESIS | Genes involved in Glycerophospholipid biosynthesis |
| 0.2 | 5.0 | REACTOME CHONDROITIN SULFATE BIOSYNTHESIS | Genes involved in Chondroitin sulfate biosynthesis |
| 0.2 | 5.5 | REACTOME TRAFFICKING OF AMPA RECEPTORS | Genes involved in Trafficking of AMPA receptors |
| 0.2 | 9.2 | REACTOME METABOLISM OF VITAMINS AND COFACTORS | Genes involved in Metabolism of vitamins and cofactors |
| 0.2 | 7.4 | REACTOME NOTCH1 INTRACELLULAR DOMAIN REGULATES TRANSCRIPTION | Genes involved in NOTCH1 Intracellular Domain Regulates Transcription |
| 0.2 | 3.2 | REACTOME GABA A RECEPTOR ACTIVATION | Genes involved in GABA A receptor activation |
| 0.2 | 1.5 | REACTOME NEF MEDIATED DOWNREGULATION OF MHC CLASS I COMPLEX CELL SURFACE EXPRESSION | Genes involved in Nef mediated downregulation of MHC class I complex cell surface expression |
| 0.2 | 2.7 | REACTOME VIRAL MESSENGER RNA SYNTHESIS | Genes involved in Viral Messenger RNA Synthesis |
| 0.2 | 2.9 | REACTOME ACTIVATED NOTCH1 TRANSMITS SIGNAL TO THE NUCLEUS | Genes involved in Activated NOTCH1 Transmits Signal to the Nucleus |
| 0.2 | 6.9 | REACTOME ION TRANSPORT BY P TYPE ATPASES | Genes involved in Ion transport by P-type ATPases |
| 0.2 | 2.4 | REACTOME SYNTHESIS OF PIPS AT THE EARLY ENDOSOME MEMBRANE | Genes involved in Synthesis of PIPs at the early endosome membrane |
| 0.2 | 4.1 | REACTOME REGULATION OF BETA CELL DEVELOPMENT | Genes involved in Regulation of beta-cell development |
| 0.2 | 13.3 | REACTOME G ALPHA S SIGNALLING EVENTS | Genes involved in G alpha (s) signalling events |
| 0.2 | 4.5 | REACTOME CELL CELL JUNCTION ORGANIZATION | Genes involved in Cell-cell junction organization |
| 0.2 | 5.8 | REACTOME AMYLOIDS | Genes involved in Amyloids |
| 0.2 | 1.1 | REACTOME REGULATION OF INSULIN SECRETION | Genes involved in Regulation of Insulin Secretion |
| 0.1 | 1.7 | REACTOME PYRUVATE METABOLISM AND CITRIC ACID TCA CYCLE | Genes involved in Pyruvate metabolism and Citric Acid (TCA) cycle |
| 0.1 | 2.0 | REACTOME CGMP EFFECTS | Genes involved in cGMP effects |
| 0.1 | 4.0 | REACTOME PERK REGULATED GENE EXPRESSION | Genes involved in PERK regulated gene expression |
| 0.1 | 2.9 | REACTOME NETRIN1 SIGNALING | Genes involved in Netrin-1 signaling |
| 0.1 | 3.0 | REACTOME POST TRANSLATIONAL MODIFICATION SYNTHESIS OF GPI ANCHORED PROTEINS | Genes involved in Post-translational modification: synthesis of GPI-anchored proteins |
| 0.1 | 1.1 | REACTOME ACTIVATION OF THE AP1 FAMILY OF TRANSCRIPTION FACTORS | Genes involved in Activation of the AP-1 family of transcription factors |
| 0.1 | 2.1 | REACTOME DEGRADATION OF THE EXTRACELLULAR MATRIX | Genes involved in Degradation of the extracellular matrix |
| 0.1 | 2.4 | REACTOME MYOGENESIS | Genes involved in Myogenesis |
| 0.1 | 1.0 | REACTOME ORGANIC CATION ANION ZWITTERION TRANSPORT | Genes involved in Organic cation/anion/zwitterion transport |
| 0.1 | 0.5 | REACTOME DESTABILIZATION OF MRNA BY AUF1 HNRNP D0 | Genes involved in Destabilization of mRNA by AUF1 (hnRNP D0) |
| 0.1 | 1.8 | REACTOME ENDOSOMAL SORTING COMPLEX REQUIRED FOR TRANSPORT ESCRT | Genes involved in Endosomal Sorting Complex Required For Transport (ESCRT) |
| 0.1 | 3.3 | REACTOME MEIOTIC SYNAPSIS | Genes involved in Meiotic Synapsis |
| 0.1 | 0.9 | REACTOME LYSOSOME VESICLE BIOGENESIS | Genes involved in Lysosome Vesicle Biogenesis |
| 0.1 | 0.8 | REACTOME CREATION OF C4 AND C2 ACTIVATORS | Genes involved in Creation of C4 and C2 activators |
| 0.1 | 0.9 | REACTOME GLUCOSE TRANSPORT | Genes involved in Glucose transport |
| 0.1 | 1.0 | REACTOME ANTIGEN PRESENTATION FOLDING ASSEMBLY AND PEPTIDE LOADING OF CLASS I MHC | Genes involved in Antigen Presentation: Folding, assembly and peptide loading of class I MHC |
| 0.1 | 8.6 | REACTOME SIGNALING BY RHO GTPASES | Genes involved in Signaling by Rho GTPases |
| 0.1 | 0.4 | REACTOME NCAM SIGNALING FOR NEURITE OUT GROWTH | Genes involved in NCAM signaling for neurite out-growth |
| 0.1 | 1.6 | REACTOME ASSOCIATION OF TRIC CCT WITH TARGET PROTEINS DURING BIOSYNTHESIS | Genes involved in Association of TriC/CCT with target proteins during biosynthesis |
| 0.1 | 0.5 | REACTOME AKT PHOSPHORYLATES TARGETS IN THE CYTOSOL | Genes involved in AKT phosphorylates targets in the cytosol |
| 0.1 | 1.1 | REACTOME TRANSPORT OF VITAMINS NUCLEOSIDES AND RELATED MOLECULES | Genes involved in Transport of vitamins, nucleosides, and related molecules |
| 0.1 | 0.6 | REACTOME ENOS ACTIVATION AND REGULATION | Genes involved in eNOS activation and regulation |
| 0.0 | 0.3 | REACTOME PURINE CATABOLISM | Genes involved in Purine catabolism |
| 0.0 | 0.6 | REACTOME PEROXISOMAL LIPID METABOLISM | Genes involved in Peroxisomal lipid metabolism |
| 0.0 | 1.4 | REACTOME PHASE II CONJUGATION | Genes involved in Phase II conjugation |
| 0.0 | 0.2 | REACTOME EICOSANOID LIGAND BINDING RECEPTORS | Genes involved in Eicosanoid ligand-binding receptors |
| 0.0 | 1.2 | REACTOME EXTRACELLULAR MATRIX ORGANIZATION | Genes involved in Extracellular matrix organization |
| 0.0 | 0.3 | REACTOME APOPTOTIC CLEAVAGE OF CELL ADHESION PROTEINS | Genes involved in Apoptotic cleavage of cell adhesion proteins |
| 0.0 | 1.4 | REACTOME PPARA ACTIVATES GENE EXPRESSION | Genes involved in PPARA Activates Gene Expression |
| 0.0 | 0.3 | REACTOME ACTIVATION OF NF KAPPAB IN B CELLS | Genes involved in Activation of NF-kappaB in B Cells |
| 0.0 | 0.4 | REACTOME METABOLISM OF NON CODING RNA | Genes involved in Metabolism of non-coding RNA |
| 0.0 | 0.4 | REACTOME MHC CLASS II ANTIGEN PRESENTATION | Genes involved in MHC class II antigen presentation |
| 0.0 | 0.2 | REACTOME FGFR1 LIGAND BINDING AND ACTIVATION | Genes involved in FGFR1 ligand binding and activation |
| 0.0 | 0.0 | REACTOME GABA RECEPTOR ACTIVATION | Genes involved in GABA receptor activation |
| 0.0 | 0.2 | REACTOME RNA POL III CHAIN ELONGATION | Genes involved in RNA Polymerase III Chain Elongation |