Project
GSE53960: rat RNA-Seq transcriptomic Bodymap
Navigation
Downloads
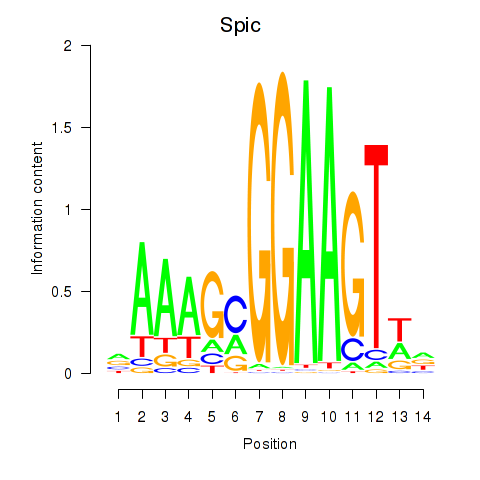
Results for Spic
Z-value: 2.54
Motif logo
Transcription factors associated with Spic
| Gene Symbol | Gene ID | Gene Info |
|---|---|---|
|
Spic
|
ENSRNOG00000005720 | Spi-C transcription factor |
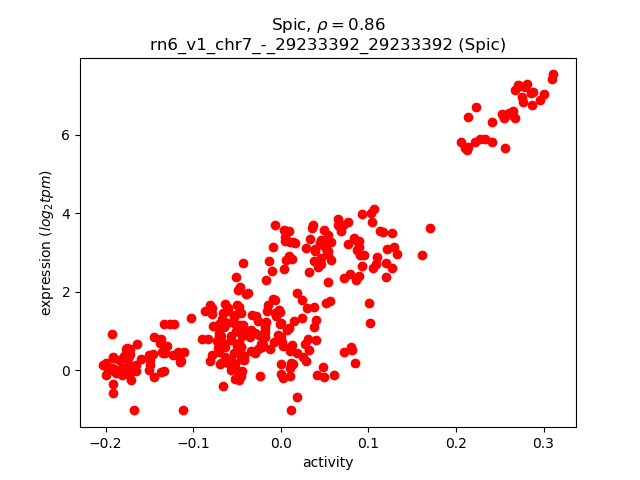
Activity-expression correlation:
| Gene | Promoter | Pearson corr. coef. | P-value | Plot |
|---|---|---|---|---|
| Spic | rn6_v1_chr7_-_29233392_29233392 | 0.86 | 1.2e-94 | Click! |
Activity profile of Spic motif
Sorted Z-values of Spic motif
| Promoter | Log-likelihood | Transcript | Gene | Gene Info |
|---|---|---|---|---|
| chr1_-_98521551 | 103.34 |
ENSRNOT00000081922
|
Siglec10
|
sialic acid binding Ig-like lectin 10 |
| chrX_+_78196300 | 101.44 |
ENSRNOT00000048695
|
P2ry10
|
purinergic receptor P2Y10 |
| chr5_-_155258392 | 100.17 |
ENSRNOT00000017065
|
C1qc
|
complement C1q C chain |
| chr3_+_16610086 | 98.34 |
ENSRNOT00000046231
|
LOC100361009
|
rCG64257-like |
| chr5_+_149047681 | 85.94 |
ENSRNOT00000015198
|
Laptm5
|
lysosomal protein transmembrane 5 |
| chr3_+_19045214 | 82.01 |
ENSRNOT00000070878
|
AABR07051670.1
|
|
| chr2_+_186776644 | 80.21 |
ENSRNOT00000046778
|
Fcrl3
|
Fc receptor-like 3 |
| chr1_-_98521706 | 78.65 |
ENSRNOT00000015941
|
Siglec10
|
sialic acid binding Ig-like lectin 10 |
| chr9_-_9675110 | 77.77 |
ENSRNOT00000073294
|
Vav1
|
vav guanine nucleotide exchange factor 1 |
| chr6_-_143590448 | 77.14 |
ENSRNOT00000056771
|
Ighv8-4
|
immunoglobulin heavy variable V8-4 |
| chr1_+_87938042 | 76.63 |
ENSRNOT00000027837
|
Map4k1
|
mitogen activated protein kinase kinase kinase kinase 1 |
| chr13_+_89385859 | 75.83 |
ENSRNOT00000047434
|
Fcgr3a
|
Fc fragment of IgG receptor IIIa |
| chr4_-_164211819 | 75.61 |
ENSRNOT00000084796
|
LOC497796
|
hypothetical protein LOC497796 |
| chr1_+_242959488 | 74.77 |
ENSRNOT00000015668
|
Dock8
|
dedicator of cytokinesis 8 |
| chr14_-_23604834 | 74.16 |
ENSRNOT00000002760
|
Stap1
|
signal transducing adaptor family member 1 |
| chr1_-_47502952 | 73.89 |
ENSRNOT00000025580
|
Tagap
|
T-cell activation RhoGTPase activating protein |
| chr13_+_89386023 | 69.62 |
ENSRNOT00000086223
|
Fcgr3a
|
Fc fragment of IgG receptor IIIa |
| chr1_-_101236065 | 68.66 |
ENSRNOT00000066834
|
Cd37
|
CD37 molecule |
| chr3_-_121882726 | 67.69 |
ENSRNOT00000006308
|
Il1b
|
interleukin 1 beta |
| chr8_+_133029625 | 67.20 |
ENSRNOT00000008809
|
Ccr3
|
C-C motif chemokine receptor 3 |
| chr1_+_201620642 | 67.03 |
ENSRNOT00000093674
|
Dmbt1
|
deleted in malignant brain tumors 1 |
| chr9_+_8052210 | 66.34 |
ENSRNOT00000073659
|
Adgre4
|
adhesion G protein-coupled receptor E4 |
| chr3_+_28627084 | 66.03 |
ENSRNOT00000049884
|
Arhgap15
|
Rho GTPase activating protein 15 |
| chr4_-_163890801 | 65.59 |
ENSRNOT00000081946
|
Ly49si1
|
immunoreceptor Ly49si1 |
| chr10_+_83655460 | 65.48 |
ENSRNOT00000008011
|
Gngt2
|
G protein subunit gamma transducin 2 |
| chr10_-_57436368 | 64.85 |
ENSRNOT00000056608
|
Scimp
|
SLP adaptor and CSK interacting membrane protein |
| chr13_-_61591139 | 64.27 |
ENSRNOT00000005324
|
Rgs18
|
regulator of G-protein signaling 18 |
| chr13_-_89343868 | 64.02 |
ENSRNOT00000058497
ENSRNOT00000035400 |
Fcgr2b
|
Fc fragment of IgG receptor IIb |
| chr20_+_6973398 | 62.84 |
ENSRNOT00000041665
|
Fgd2
|
FYVE, RhoGEF and PH domain containing 2 |
| chr15_+_27177900 | 62.64 |
ENSRNOT00000039925
|
Tlr11
|
toll-like receptor 11 |
| chr4_-_164406146 | 62.20 |
ENSRNOT00000090110
|
Klra22
|
killer cell lectin-like receptor subfamily A, member 22 |
| chr11_-_66759402 | 58.96 |
ENSRNOT00000003326
|
Hcls1
|
hematopoietic cell specific Lyn substrate 1 |
| chr1_-_227932603 | 58.92 |
ENSRNOT00000033795
|
Ms4a6a
|
membrane spanning 4-domains A6A |
| chr4_+_78320190 | 58.43 |
ENSRNOT00000032742
ENSRNOT00000091359 |
Gimap4
|
GTPase, IMAP family member 4 |
| chr5_-_155252003 | 57.77 |
ENSRNOT00000017060
|
C1qb
|
complement C1q B chain |
| chr2_-_209537087 | 57.71 |
ENSRNOT00000024344
|
Cd53
|
Cd53 molecule |
| chr17_-_31706523 | 56.19 |
ENSRNOT00000071312
|
AABR07027447.1
|
|
| chr4_-_164453171 | 55.45 |
ENSRNOT00000077539
ENSRNOT00000083610 ENSRNOT00000079975 |
Ly49s6
|
Ly49 stimulatory receptor 6 |
| chr7_+_145068286 | 54.71 |
ENSRNOT00000088956
ENSRNOT00000065753 |
Nckap1l
|
NCK associated protein 1 like |
| chr9_+_94745217 | 54.10 |
ENSRNOT00000051338
|
Inpp5d
|
inositol polyphosphate-5-phosphatase D |
| chr9_-_52830457 | 53.68 |
ENSRNOT00000073557
|
Slc40a1
|
solute carrier family 40 member 1 |
| chr2_+_32820322 | 53.20 |
ENSRNOT00000013768
|
Cd180
|
CD180 molecule |
| chr11_+_67082193 | 52.78 |
ENSRNOT00000003129
|
Cd86
|
CD86 molecule |
| chr4_-_164357619 | 52.42 |
ENSRNOT00000078114
|
Ly49i5
|
Ly49 inhibitory receptor 5 |
| chr1_-_198662610 | 52.34 |
ENSRNOT00000055012
|
Sept1
|
septin 1 |
| chr1_+_199495298 | 52.03 |
ENSRNOT00000086003
ENSRNOT00000026748 |
Itgad
|
integrin subunit alpha D |
| chr4_-_165192647 | 51.89 |
ENSRNOT00000086461
|
Klra5
|
killer cell lectin-like receptor, subfamily A, member 5 |
| chr19_-_55257876 | 51.30 |
ENSRNOT00000017564
|
Cyba
|
cytochrome b-245 alpha chain |
| chrX_-_71616997 | 50.52 |
ENSRNOT00000004406
|
Cxcr3
|
C-X-C motif chemokine receptor 3 |
| chr4_-_170932618 | 50.19 |
ENSRNOT00000007779
|
Arhgdib
|
Rho GDP dissociation inhibitor beta |
| chr14_-_100184192 | 49.84 |
ENSRNOT00000007044
|
Plek
|
pleckstrin |
| chr1_-_63684189 | 49.34 |
ENSRNOT00000085651
|
Lilrc2
|
leukocyte immunoglobulin-like receptor, subfamily C, member 2 |
| chr3_+_16495748 | 49.03 |
ENSRNOT00000045492
|
AABR07051533.1
|
|
| chr13_-_61070599 | 48.68 |
ENSRNOT00000005251
|
Rgs1
|
regulator of G-protein signaling 1 |
| chr4_-_157252565 | 48.40 |
ENSRNOT00000079947
|
Ptpn6
|
protein tyrosine phosphatase, non-receptor type 6 |
| chr4_-_44136815 | 48.00 |
ENSRNOT00000086810
|
Tfec
|
transcription factor EC |
| chr10_-_103685844 | 47.87 |
ENSRNOT00000064284
|
Cd300lf
|
Cd300 molecule-like family member F |
| chr13_-_89606326 | 47.54 |
ENSRNOT00000029179
|
Fcer1g
|
Fc fragment of IgE receptor Ig |
| chrX_+_65271366 | 47.03 |
ENSRNOT00000093499
|
Msn
|
moesin |
| chr4_-_157252104 | 46.13 |
ENSRNOT00000082739
|
Ptpn6
|
protein tyrosine phosphatase, non-receptor type 6 |
| chr3_+_28416954 | 45.39 |
ENSRNOT00000043533
|
Kynu
|
kynureninase |
| chr4_-_164306500 | 45.16 |
ENSRNOT00000080133
|
Ly49i5
|
Ly49 inhibitory receptor 5 |
| chr4_+_163174487 | 45.15 |
ENSRNOT00000088108
|
Clec9a
|
C-type lectin domain family 9, member A |
| chr10_+_55013703 | 44.32 |
ENSRNOT00000032785
|
Pik3r5
|
phosphoinositide-3-kinase, regulatory subunit 5 |
| chr11_-_14304603 | 43.65 |
ENSRNOT00000040202
ENSRNOT00000082143 |
Samsn1
|
SAM domain, SH3 domain and nuclear localization signals, 1 |
| chr1_+_215628785 | 43.63 |
ENSRNOT00000054864
|
Lsp1
|
lymphocyte-specific protein 1 |
| chr5_+_61425746 | 42.86 |
ENSRNOT00000064113
|
RGD1305807
|
hypothetical LOC298077 |
| chr7_-_107616038 | 42.41 |
ENSRNOT00000088752
|
Sla
|
src-like adaptor |
| chr3_-_16753987 | 42.08 |
ENSRNOT00000091257
|
AABR07051548.1
|
|
| chr4_-_155923079 | 41.88 |
ENSRNOT00000013308
|
Clec4a3
|
C-type lectin domain family 4, member A3 |
| chr7_-_12899004 | 41.20 |
ENSRNOT00000011086
|
Gzmm
|
granzyme M |
| chr19_-_10513349 | 41.19 |
ENSRNOT00000061270
|
Adgrg5
|
adhesion G protein-coupled receptor G5 |
| chr20_-_5163247 | 41.03 |
ENSRNOT00000001135
|
Aif1
|
allograft inflammatory factor 1 |
| chr8_+_5768811 | 40.40 |
ENSRNOT00000013936
|
Mmp8
|
matrix metallopeptidase 8 |
| chr9_-_61528882 | 39.45 |
ENSRNOT00000015432
|
Ankrd44
|
ankyrin repeat domain 44 |
| chr15_+_57221292 | 39.40 |
ENSRNOT00000014502
|
Lcp1
|
lymphocyte cytosolic protein 1 |
| chr4_-_164536556 | 38.70 |
ENSRNOT00000087796
|
Ly49i2
|
Ly49 inhibitory receptor 2 |
| chrX_+_54390733 | 38.58 |
ENSRNOT00000004977
|
RGD1565785
|
similar to chromosome X open reading frame 21 |
| chr9_+_65614142 | 37.73 |
ENSRNOT00000016613
|
Casp8
|
caspase 8 |
| chrX_+_1311121 | 37.66 |
ENSRNOT00000038909
|
Cfp
|
complement factor properdin |
| chr18_+_55576239 | 37.59 |
ENSRNOT00000050063
|
LOC100910979
|
interferon-inducible GTPase 1-like |
| chr13_+_47602692 | 37.35 |
ENSRNOT00000038822
|
Fcmr
|
Fc fragment of IgM receptor |
| chr2_-_203413124 | 36.74 |
ENSRNOT00000077898
ENSRNOT00000056140 |
Cd101
|
CD101 molecule |
| chr1_-_227506822 | 36.38 |
ENSRNOT00000091506
|
Ms4a7
|
membrane spanning 4-domains A7 |
| chr1_+_87019975 | 36.13 |
ENSRNOT00000041205
|
Lgals4
|
galectin 4 |
| chr6_-_140715174 | 35.82 |
ENSRNOT00000085345
|
AABR07065773.1
|
|
| chr2_+_55835151 | 35.73 |
ENSRNOT00000018634
|
Fyb
|
FYN binding protein |
| chr7_+_12782491 | 35.69 |
ENSRNOT00000065093
|
Cnn2
|
calponin 2 |
| chr9_+_81518176 | 35.49 |
ENSRNOT00000078317
ENSRNOT00000019265 ENSRNOT00000088246 ENSRNOT00000084682 |
Arpc2
|
actin related protein 2/3 complex, subunit 2 |
| chr1_-_260254600 | 35.26 |
ENSRNOT00000019014
|
Blnk
|
B-cell linker |
| chr11_-_67756799 | 35.04 |
ENSRNOT00000030975
|
Parp9
|
poly (ADP-ribose) polymerase family, member 9 |
| chr11_+_31560530 | 34.87 |
ENSRNOT00000061345
|
Il10rb
|
interleukin 10 receptor subunit beta |
| chr8_-_128665988 | 33.44 |
ENSRNOT00000050543
|
Csrnp1
|
cysteine and serine rich nuclear protein 1 |
| chr1_+_197999037 | 33.23 |
ENSRNOT00000091065
|
Apobr
|
apolipoprotein B receptor |
| chr6_+_137323713 | 32.91 |
ENSRNOT00000029017
|
Pld4
|
phospholipase D family, member 4 |
| chr12_-_6879154 | 32.51 |
ENSRNOT00000001207
|
Alox5ap
|
arachidonate 5-lipoxygenase activating protein |
| chr20_-_49486550 | 32.09 |
ENSRNOT00000048270
ENSRNOT00000076541 |
Prdm1
|
PR/SET domain 1 |
| chr9_-_26932201 | 32.05 |
ENSRNOT00000017081
|
Mcm3
|
minichromosome maintenance complex component 3 |
| chr14_+_80195715 | 32.01 |
ENSRNOT00000010784
|
Sh3tc1
|
SH3 domain and tetratricopeptide repeats 1 |
| chr3_+_114772603 | 31.48 |
ENSRNOT00000073569
|
MGC105649
|
hypothetical LOC302884 |
| chr2_-_198002625 | 30.37 |
ENSRNOT00000091888
|
BC028528
|
cDNA sequence BC028528 |
| chr18_-_28535828 | 29.81 |
ENSRNOT00000068386
|
Tmem173
|
transmembrane protein 173 |
| chr3_+_17009089 | 29.32 |
ENSRNOT00000048829
|
LOC100361052
|
rCG64257-like |
| chr13_-_89433815 | 29.32 |
ENSRNOT00000091541
|
Fcgr2b
|
Fc fragment of IgG receptor IIb |
| chr20_+_5441876 | 28.94 |
ENSRNOT00000092476
|
Rps18
|
ribosomal protein S18 |
| chr4_-_165026414 | 28.73 |
ENSRNOT00000071421
|
Klra1
|
killer cell lectin-like receptor, subfamily A, member 1 |
| chr10_-_103590607 | 28.61 |
ENSRNOT00000034741
|
Cd300le
|
Cd300 molecule-like family member E |
| chr9_+_53906073 | 28.23 |
ENSRNOT00000017813
|
Nab1
|
Ngfi-A binding protein 1 |
| chr4_-_157433467 | 28.21 |
ENSRNOT00000028965
|
Lag3
|
lymphocyte activating 3 |
| chr17_-_34905117 | 28.05 |
ENSRNOT00000088931
|
Irf4
|
interferon regulatory factor 4 |
| chr1_-_13175876 | 27.62 |
ENSRNOT00000084870
|
Abracl
|
ABRA C-terminal like |
| chr9_+_81518584 | 27.15 |
ENSRNOT00000084309
|
Arpc2
|
actin related protein 2/3 complex, subunit 2 |
| chr9_+_46840992 | 27.04 |
ENSRNOT00000019415
|
Il1r2
|
interleukin 1 receptor type 2 |
| chr3_-_82368357 | 26.89 |
ENSRNOT00000000052
|
Cd82
|
Cd82 molecule |
| chr4_-_163649637 | 25.60 |
ENSRNOT00000080873
|
LOC690020
|
similar to killer cell lectin-like receptor, subfamily A, member 17 |
| chr14_-_33150509 | 25.40 |
ENSRNOT00000002837
|
Rest
|
RE1-silencing transcription factor |
| chr4_-_164691405 | 24.99 |
ENSRNOT00000090979
ENSRNOT00000091932 ENSRNOT00000078219 |
Ly49s4
Ly49i2
|
Ly49 stimulatory receptor 4 Ly49 inhibitory receptor 2 |
| chr1_+_197999336 | 24.72 |
ENSRNOT00000023555
|
Apobr
|
apolipoprotein B receptor |
| chr12_+_22435701 | 24.51 |
ENSRNOT00000071325
ENSRNOT00000073757 |
Slc12a9
|
solute carrier family 12, member 9 |
| chr17_+_15762030 | 24.43 |
ENSRNOT00000089310
|
Fgd3
|
FYVE, RhoGEF and PH domain containing 3 |
| chr6_-_103470427 | 22.85 |
ENSRNOT00000091560
ENSRNOT00000088795 ENSRNOT00000079824 |
Actn1
|
actinin, alpha 1 |
| chr19_+_25815207 | 22.72 |
ENSRNOT00000003980
|
Lyl1
|
LYL1, basic helix-loop-helix family member |
| chr10_+_87774552 | 22.15 |
ENSRNOT00000044342
|
Krtap9-1
|
keratin associated protein 9-1 |
| chr4_-_165460075 | 21.92 |
ENSRNOT00000035522
|
Klra2
|
killer cell lectin-like receptor, subfamily A, member 2 |
| chr7_+_58814805 | 21.81 |
ENSRNOT00000005909
|
Tspan8
|
tetraspanin 8 |
| chr1_-_221015929 | 21.72 |
ENSRNOT00000028137
|
Sipa1
|
signal-induced proliferation-associated 1 |
| chr2_-_210934749 | 21.19 |
ENSRNOT00000026710
|
Gnai3
|
G protein subunit alpha i3 |
| chr4_+_140886545 | 21.01 |
ENSRNOT00000088273
|
Edem1
|
ER degradation enhancing alpha-mannosidase like protein 1 |
| chr5_+_155935554 | 20.71 |
ENSRNOT00000031855
|
LOC100911993
|
ubiquitin carboxyl-terminal hydrolase 48-like |
| chr3_-_130114770 | 20.70 |
ENSRNOT00000010638
|
Jag1
|
jagged 1 |
| chr8_+_68526093 | 20.44 |
ENSRNOT00000011385
|
Aagab
|
alpha- and gamma-adaptin binding protein |
| chr14_+_81043454 | 20.42 |
ENSRNOT00000043609
|
AC114393.1
|
|
| chr8_+_114916122 | 19.56 |
ENSRNOT00000074194
|
Tlr9
|
toll-like receptor 9 |
| chr14_+_76657311 | 19.37 |
ENSRNOT00000076730
|
Clnk
|
cytokine-dependent hematopoietic cell linker |
| chr19_-_15540773 | 18.90 |
ENSRNOT00000022359
|
Lpcat2
|
lysophosphatidylcholine acyltransferase 2 |
| chrX_-_77700269 | 18.81 |
ENSRNOT00000092418
|
Cysltr1
|
cysteinyl leukotriene receptor 1 |
| chr1_-_192088520 | 18.73 |
ENSRNOT00000047420
|
Palb2
|
partner and localizer of BRCA2 |
| chr19_+_37252843 | 18.58 |
ENSRNOT00000021145
|
E2f4
|
E2F transcription factor 4 |
| chr12_+_46316236 | 18.54 |
ENSRNOT00000001508
|
Prkab1
|
protein kinase AMP-activated non-catalytic subunit beta 1 |
| chr10_+_69412017 | 18.18 |
ENSRNOT00000009448
|
Ccl2
|
C-C motif chemokine ligand 2 |
| chr19_-_10620671 | 17.63 |
ENSRNOT00000021842
|
Ccl17
|
C-C motif chemokine ligand 17 |
| chr1_+_199217016 | 17.17 |
ENSRNOT00000025732
|
Orai3
|
ORAI calcium release-activated calcium modulator 3 |
| chr6_-_86914883 | 17.09 |
ENSRNOT00000091202
|
Mis18bp1
|
MIS18 binding protein 1 |
| chr13_-_67206688 | 16.93 |
ENSRNOT00000003630
ENSRNOT00000090693 |
Pla2g4a
|
phospholipase A2 group IVA |
| chr8_-_122841477 | 16.59 |
ENSRNOT00000014861
|
Cmtm7
|
CKLF-like MARVEL transmembrane domain containing 7 |
| chr10_+_86819472 | 16.30 |
ENSRNOT00000081424
|
Cdc6
|
cell division cycle 6 |
| chr4_-_180722358 | 16.24 |
ENSRNOT00000040645
|
Itpr2
|
inositol 1,4,5-trisphosphate receptor, type 2 |
| chr16_-_23991570 | 15.94 |
ENSRNOT00000044198
ENSRNOT00000018854 |
Nat2
Nat1
|
N-acetyltransferase 2 N-acetyltransferase 1 |
| chr1_+_219481575 | 15.89 |
ENSRNOT00000025507
|
Pold4
|
DNA polymerase delta 4, accessory subunit |
| chr3_+_159995064 | 15.76 |
ENSRNOT00000012606
|
Ttpal
|
alpha tocopherol transfer protein like |
| chr16_-_21362955 | 15.50 |
ENSRNOT00000039607
|
Gmip
|
Gem-interacting protein |
| chr4_+_115024927 | 15.44 |
ENSRNOT00000090987
|
Mob1a
|
MOB kinase activator 1A |
| chr4_-_57625147 | 15.03 |
ENSRNOT00000074649
ENSRNOT00000078961 |
Ube2h
|
ubiquitin-conjugating enzyme E2H |
| chr2_-_208225888 | 14.53 |
ENSRNOT00000054860
|
AABR07012775.1
|
|
| chr16_+_20293229 | 14.39 |
ENSRNOT00000025421
|
Rpl18a
|
ribosomal protein L18A |
| chr1_-_101118825 | 14.37 |
ENSRNOT00000066328
|
Rps11
|
ribosomal protein S11 |
| chr17_+_69634890 | 14.26 |
ENSRNOT00000029049
|
Akr1c13
|
aldo-keto reductase family 1, member C13 |
| chr1_-_140535934 | 14.11 |
ENSRNOT00000065457
|
Det1
|
de-etiolated homolog 1 (Arabidopsis) |
| chr1_-_53520788 | 14.10 |
ENSRNOT00000060121
|
Gpr31
|
G protein-coupled receptor 31 |
| chr7_+_12471824 | 13.85 |
ENSRNOT00000068197
|
Sbno2
|
strawberry notch homolog 2 |
| chr11_-_64855353 | 13.83 |
ENSRNOT00000089625
|
Cd80
|
Cd80 molecule |
| chr3_+_160467552 | 13.83 |
ENSRNOT00000066657
|
Stk4
|
serine/threonine kinase 4 |
| chr5_+_113725717 | 13.53 |
ENSRNOT00000032248
|
Tek
|
TEK receptor tyrosine kinase |
| chr1_-_146289465 | 13.52 |
ENSRNOT00000017362
|
Abhd17c
|
abhydrolase domain containing 17C |
| chr10_+_85978691 | 13.52 |
ENSRNOT00000006359
|
Rpl19
|
ribosomal protein L19 |
| chr17_+_15749978 | 13.36 |
ENSRNOT00000067311
|
Fgd3
|
FYVE, RhoGEF and PH domain containing 3 |
| chr14_+_108007724 | 13.20 |
ENSRNOT00000014062
|
Xpo1
|
exportin 1 |
| chr12_+_22434814 | 13.13 |
ENSRNOT00000076829
|
Slc12a9
|
solute carrier family 12, member 9 |
| chr5_+_163612518 | 13.06 |
ENSRNOT00000071103
|
LOC103692519
|
60S ribosomal protein L9 pseudogene |
| chr9_-_52238564 | 12.92 |
ENSRNOT00000005073
|
Col5a2
|
collagen type V alpha 2 chain |
| chr4_-_87019219 | 12.84 |
ENSRNOT00000065625
|
Lsm5
|
LSM5 homolog, U6 small nuclear RNA and mRNA degradation associated |
| chr16_-_18766174 | 12.60 |
ENSRNOT00000084813
|
Sftpd
|
surfactant protein D |
| chr1_+_1180932 | 12.46 |
ENSRNOT00000087443
|
LOC102547056
|
retinoic acid early-inducible protein 1-gamma-like |
| chr10_-_106781950 | 12.40 |
ENSRNOT00000077495
|
Tmc6
|
transmembrane channel-like gene family 6 |
| chr9_-_42805673 | 12.27 |
ENSRNOT00000020558
|
Uggt1
|
UDP-glucose glycoprotein glucosyltransferase 1 |
| chr1_+_234749568 | 12.23 |
ENSRNOT00000016871
|
Ostf1
|
osteoclast stimulating factor 1 |
| chr7_-_12646960 | 12.20 |
ENSRNOT00000014687
|
Prtn3
|
proteinase 3 |
| chr8_+_23014956 | 12.18 |
ENSRNOT00000018009
|
Prkcsh
|
protein kinase C substrate 80K-H |
| chr17_+_80250521 | 11.97 |
ENSRNOT00000023446
|
Pter
|
phosphotriesterase related |
| chr10_-_56289882 | 11.86 |
ENSRNOT00000090762
ENSRNOT00000056903 |
Tnfsf13
|
tumor necrosis factor superfamily member 13 |
| chr7_-_63687978 | 11.57 |
ENSRNOT00000009260
|
Tbk1
|
TANK-binding kinase 1 |
| chr10_+_56524468 | 11.56 |
ENSRNOT00000022041
|
Gps2
|
G protein pathway suppressor 2 |
| chr6_+_26836216 | 11.55 |
ENSRNOT00000077903
ENSRNOT00000011373 |
Ost4
|
oligosaccharyltransferase complex subunit 4, non-catalytic |
| chr7_+_135803698 | 11.50 |
ENSRNOT00000007932
|
Irak4
|
interleukin-1 receptor-associated kinase 4 |
| chr10_-_14247886 | 11.48 |
ENSRNOT00000020504
|
Nubp2
|
nucleotide binding protein 2 |
| chr8_+_93439648 | 11.38 |
ENSRNOT00000043008
|
LOC100359563
|
ribosomal protein S20-like |
| chr1_+_100832324 | 11.24 |
ENSRNOT00000056364
|
Il4i1
|
interleukin 4 induced 1 |
| chr16_+_19068783 | 11.08 |
ENSRNOT00000017424
|
Cherp
|
calcium homeostasis endoplasmic reticulum protein |
| chr18_+_29386809 | 10.89 |
ENSRNOT00000082079
ENSRNOT00000024825 |
Eif4ebp3
|
eukaryotic translation initiation factor 4E binding protein 3 |
| chr8_-_22308706 | 10.88 |
ENSRNOT00000080236
|
Kri1
|
KRI1 homolog |
| chr3_+_47453821 | 10.73 |
ENSRNOT00000081682
|
Tank
|
TRAF family member-associated NFKB activator |
| chr10_+_86870523 | 10.59 |
ENSRNOT00000008659
|
Rara
|
retinoic acid receptor, alpha |
| chr3_+_110918243 | 10.04 |
ENSRNOT00000056432
|
Rad51
|
RAD51 recombinase |
| chr5_-_134978125 | 9.96 |
ENSRNOT00000018004
|
Rad54l
|
RAD54 like (S. cerevisiae) |
| chr14_+_86029335 | 9.91 |
ENSRNOT00000017375
|
Dbnl
|
drebrin-like |
| chr10_-_65437143 | 9.89 |
ENSRNOT00000017264
|
Nek8
|
NIMA-related kinase 8 |
| chr17_-_2660902 | 9.77 |
ENSRNOT00000067979
|
Mfsd14b
|
major facilitator superfamily domain containing 14B |
| chr3_+_9792899 | 9.70 |
ENSRNOT00000066618
|
Tor1b
|
torsin family 1, member B |
| chr6_+_129609375 | 9.69 |
ENSRNOT00000083732
|
Papola
|
poly (A) polymerase alpha |
| chr12_+_51937175 | 9.62 |
ENSRNOT00000056780
|
Pus1
|
pseudouridylate synthase 1 |
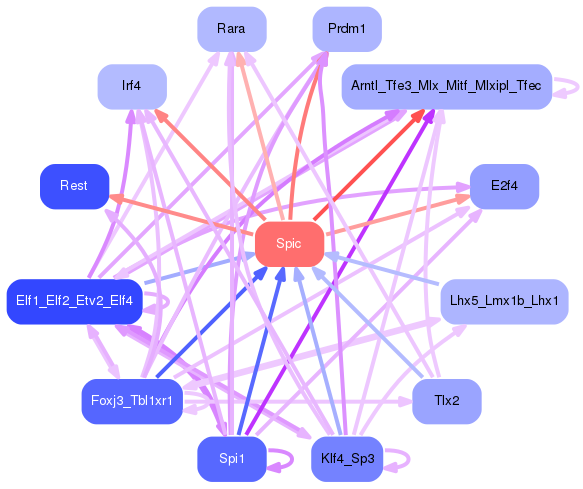
Network of associatons between targets according to the STRING database.

First level regulatory network of Spic
Gene Ontology Analysis
Gene overrepresentation in biological process category:
| Log-likelihood per target | Total log-likelihood | Term | Description |
|---|---|---|---|
| 27.9 | 111.5 | GO:0002434 | immune complex clearance(GO:0002434) |
| 24.7 | 74.2 | GO:1903969 | regulation of macrophage colony-stimulating factor signaling pathway(GO:1902226) regulation of response to macrophage colony-stimulating factor(GO:1903969) regulation of cellular response to macrophage colony-stimulating factor stimulus(GO:1903972) microglial cell migration(GO:1904124) regulation of microglial cell migration(GO:1904139) |
| 23.9 | 47.9 | GO:1902214 | regulation of interleukin-4-mediated signaling pathway(GO:1902214) |
| 23.6 | 94.5 | GO:0033277 | abortive mitotic cell cycle(GO:0033277) |
| 22.6 | 67.7 | GO:0046136 | positive regulation of vitamin metabolic process(GO:0046136) positive regulation of vitamin D biosynthetic process(GO:0060557) positive regulation of calcidiol 1-monooxygenase activity(GO:0060559) |
| 19.7 | 59.0 | GO:0071461 | cellular response to redox state(GO:0071461) |
| 18.2 | 54.7 | GO:0070358 | actin polymerization-dependent cell motility(GO:0070358) |
| 17.6 | 52.8 | GO:0002644 | negative regulation of tolerance induction(GO:0002644) |
| 17.4 | 52.3 | GO:0007056 | spindle assembly involved in female meiosis(GO:0007056) |
| 17.2 | 68.7 | GO:0030886 | negative regulation of myeloid dendritic cell activation(GO:0030886) |
| 17.1 | 51.3 | GO:1904844 | response to L-glutamine(GO:1904844) cellular response to L-glutamine(GO:1904845) |
| 16.0 | 80.2 | GO:0050859 | negative regulation of B cell receptor signaling pathway(GO:0050859) |
| 15.8 | 47.5 | GO:0002442 | serotonin production involved in inflammatory response(GO:0002351) serotonin secretion involved in inflammatory response(GO:0002442) serotonin secretion by platelet(GO:0002554) |
| 15.7 | 62.6 | GO:2000814 | positive regulation of barbed-end actin filament capping(GO:2000814) |
| 14.7 | 59.0 | GO:0042509 | regulation of tyrosine phosphorylation of STAT protein(GO:0042509) positive regulation of tyrosine phosphorylation of STAT protein(GO:0042531) |
| 14.3 | 100.2 | GO:0045650 | negative regulation of macrophage differentiation(GO:0045650) |
| 14.3 | 42.9 | GO:0046864 | isoprenoid transport(GO:0046864) terpenoid transport(GO:0046865) |
| 13.7 | 41.0 | GO:0014739 | positive regulation of muscle hyperplasia(GO:0014739) |
| 13.5 | 54.1 | GO:0045658 | regulation of neutrophil differentiation(GO:0045658) |
| 13.4 | 53.7 | GO:0070839 | regulation of transcription from RNA polymerase II promoter in response to iron(GO:0034395) divalent metal ion export(GO:0070839) |
| 12.5 | 49.8 | GO:0070560 | protein secretion by platelet(GO:0070560) |
| 12.4 | 161.7 | GO:0038095 | Fc-gamma receptor signaling pathway(GO:0038094) Fc-epsilon receptor signaling pathway(GO:0038095) |
| 11.3 | 45.4 | GO:0019805 | quinolinate biosynthetic process(GO:0019805) |
| 11.2 | 67.5 | GO:0061737 | leukotriene signaling pathway(GO:0061737) |
| 10.2 | 61.5 | GO:0002322 | B cell proliferation involved in immune response(GO:0002322) |
| 9.8 | 107.8 | GO:0035589 | G-protein coupled purinergic nucleotide receptor signaling pathway(GO:0035589) |
| 9.8 | 19.6 | GO:0032741 | positive regulation of interleukin-18 production(GO:0032741) |
| 9.4 | 28.1 | GO:0045082 | positive regulation of interleukin-10 biosynthetic process(GO:0045082) |
| 9.0 | 27.0 | GO:2000660 | negative regulation of interleukin-1-mediated signaling pathway(GO:2000660) |
| 8.1 | 32.5 | GO:0002540 | leukotriene production involved in inflammatory response(GO:0002540) |
| 7.8 | 47.0 | GO:1902966 | regulation of protein localization to early endosome(GO:1902965) positive regulation of protein localization to early endosome(GO:1902966) |
| 7.2 | 21.7 | GO:0042631 | cellular response to water deprivation(GO:0042631) |
| 7.0 | 21.0 | GO:1904380 | positive regulation of retrograde protein transport, ER to cytosol(GO:1904154) endoplasmic reticulum mannose trimming(GO:1904380) |
| 6.9 | 20.7 | GO:0061443 | endocardial cushion cell differentiation(GO:0061443) |
| 6.3 | 25.4 | GO:2000705 | regulation of dense core granule biogenesis(GO:2000705) |
| 6.3 | 18.9 | GO:0006663 | platelet activating factor biosynthetic process(GO:0006663) |
| 5.7 | 50.9 | GO:0010668 | ectodermal cell differentiation(GO:0010668) |
| 5.6 | 28.2 | GO:0045085 | negative regulation of interleukin-2 biosynthetic process(GO:0045085) |
| 5.5 | 16.6 | GO:0002337 | B-1a B cell differentiation(GO:0002337) |
| 5.3 | 32.1 | GO:0051136 | regulation of NK T cell differentiation(GO:0051136) |
| 5.2 | 67.2 | GO:0002551 | mast cell chemotaxis(GO:0002551) |
| 4.8 | 76.6 | GO:0000185 | activation of MAPKKK activity(GO:0000185) |
| 4.7 | 9.4 | GO:1903753 | negative regulation of p38MAPK cascade(GO:1903753) |
| 4.7 | 74.8 | GO:0001771 | immunological synapse formation(GO:0001771) |
| 4.6 | 13.8 | GO:0071348 | cellular response to interleukin-11(GO:0071348) |
| 4.5 | 13.5 | GO:0048014 | Tie signaling pathway(GO:0048014) |
| 4.4 | 62.2 | GO:0051764 | actin crosslink formation(GO:0051764) |
| 4.3 | 85.8 | GO:0001833 | inner cell mass cell proliferation(GO:0001833) |
| 4.1 | 12.2 | GO:0097029 | mature conventional dendritic cell differentiation(GO:0097029) |
| 4.0 | 11.9 | GO:0002426 | immunoglobulin production in mucosal tissue(GO:0002426) |
| 3.7 | 14.9 | GO:1990481 | mRNA pseudouridine synthesis(GO:1990481) |
| 3.6 | 50.5 | GO:1900118 | negative regulation of execution phase of apoptosis(GO:1900118) |
| 3.6 | 10.7 | GO:2000158 | positive regulation of ubiquitin-specific protease activity(GO:2000158) |
| 3.5 | 13.8 | GO:0060800 | regulation of cell differentiation involved in embryonic placenta development(GO:0060800) |
| 3.4 | 37.3 | GO:1990001 | inhibition of cysteine-type endopeptidase activity involved in apoptotic process(GO:1990001) |
| 3.3 | 10.0 | GO:0051106 | regulation of DNA ligation(GO:0051105) positive regulation of DNA ligation(GO:0051106) |
| 3.3 | 3.3 | GO:2001270 | regulation of cysteine-type endopeptidase activity involved in execution phase of apoptosis(GO:2001270) |
| 3.2 | 12.9 | GO:1903225 | negative regulation of endodermal cell differentiation(GO:1903225) |
| 3.1 | 12.3 | GO:0006011 | UDP-glucose metabolic process(GO:0006011) |
| 3.0 | 9.1 | GO:0042539 | hypotonic salinity response(GO:0042539) cellular hypotonic salinity response(GO:0071477) |
| 3.0 | 36.4 | GO:0036462 | TRAIL-activated apoptotic signaling pathway(GO:0036462) |
| 3.0 | 48.3 | GO:0050765 | negative regulation of phagocytosis(GO:0050765) |
| 2.9 | 35.0 | GO:0060330 | regulation of response to interferon-gamma(GO:0060330) |
| 2.9 | 90.2 | GO:0045954 | positive regulation of natural killer cell mediated cytotoxicity(GO:0045954) |
| 2.9 | 57.7 | GO:1901741 | positive regulation of myoblast fusion(GO:1901741) |
| 2.8 | 16.9 | GO:0031394 | positive regulation of prostaglandin biosynthetic process(GO:0031394) positive regulation of unsaturated fatty acid biosynthetic process(GO:2001280) |
| 2.7 | 29.8 | GO:0071360 | cellular response to exogenous dsRNA(GO:0071360) |
| 2.7 | 8.0 | GO:0070946 | neutrophil mediated killing of gram-positive bacterium(GO:0070946) |
| 2.3 | 16.3 | GO:1904117 | cellular response to vasopressin(GO:1904117) |
| 2.3 | 11.6 | GO:0045359 | positive regulation of interferon-beta biosynthetic process(GO:0045359) |
| 2.3 | 22.7 | GO:0001955 | blood vessel maturation(GO:0001955) |
| 2.0 | 20.4 | GO:0000447 | endonucleolytic cleavage in ITS1 to separate SSU-rRNA from 5.8S rRNA and LSU-rRNA from tricistronic rRNA transcript (SSU-rRNA, 5.8S rRNA, LSU-rRNA)(GO:0000447) |
| 2.0 | 5.9 | GO:0032510 | endosome to lysosome transport via multivesicular body sorting pathway(GO:0032510) multivesicular body assembly(GO:0036258) positive regulation of centriole replication(GO:0046601) negative regulation of exosomal secretion(GO:1903542) |
| 1.9 | 5.7 | GO:0010760 | negative regulation of macrophage chemotaxis(GO:0010760) |
| 1.9 | 13.2 | GO:0000056 | ribosomal small subunit export from nucleus(GO:0000056) |
| 1.8 | 57.8 | GO:0006958 | complement activation, classical pathway(GO:0006958) |
| 1.8 | 5.4 | GO:0010847 | regulation of chromatin assembly(GO:0010847) |
| 1.8 | 14.4 | GO:0097327 | response to antineoplastic agent(GO:0097327) |
| 1.8 | 10.6 | GO:0045630 | positive regulation of T-helper 2 cell differentiation(GO:0045630) |
| 1.7 | 45.3 | GO:0030101 | natural killer cell activation(GO:0030101) |
| 1.5 | 18.6 | GO:0000083 | regulation of transcription involved in G1/S transition of mitotic cell cycle(GO:0000083) |
| 1.5 | 43.7 | GO:0002820 | negative regulation of adaptive immune response(GO:0002820) |
| 1.4 | 15.9 | GO:0097068 | response to thyroxine(GO:0097068) |
| 1.4 | 41.2 | GO:0019835 | cytolysis(GO:0019835) |
| 1.4 | 12.5 | GO:0090070 | positive regulation of ribosome biogenesis(GO:0090070) positive regulation of rRNA processing(GO:2000234) |
| 1.4 | 31.7 | GO:0030574 | collagen catabolic process(GO:0030574) |
| 1.4 | 4.1 | GO:0090283 | regulation of protein glycosylation in Golgi(GO:0090283) |
| 1.4 | 2.7 | GO:0002913 | positive regulation of T cell anergy(GO:0002669) positive regulation of lymphocyte anergy(GO:0002913) |
| 1.4 | 5.4 | GO:0051343 | positive regulation of cyclic-nucleotide phosphodiesterase activity(GO:0051343) |
| 1.2 | 11.1 | GO:0051533 | positive regulation of NFAT protein import into nucleus(GO:0051533) |
| 1.2 | 5.9 | GO:0006269 | DNA replication, synthesis of RNA primer(GO:0006269) |
| 1.1 | 4.6 | GO:2000002 | negative regulation of DNA damage checkpoint(GO:2000002) |
| 1.1 | 32.1 | GO:0006270 | DNA replication initiation(GO:0006270) |
| 1.1 | 9.9 | GO:0035330 | regulation of hippo signaling(GO:0035330) |
| 1.1 | 69.4 | GO:0043507 | positive regulation of JUN kinase activity(GO:0043507) |
| 1.1 | 3.3 | GO:2000853 | negative regulation of corticosterone secretion(GO:2000853) |
| 1.1 | 44.3 | GO:0043551 | regulation of phosphatidylinositol 3-kinase activity(GO:0043551) |
| 1.1 | 6.4 | GO:1904749 | regulation of protein localization to nucleolus(GO:1904749) |
| 1.1 | 13.8 | GO:0046641 | positive regulation of alpha-beta T cell proliferation(GO:0046641) |
| 1.1 | 68.4 | GO:0002224 | toll-like receptor signaling pathway(GO:0002224) |
| 1.0 | 3.1 | GO:0006990 | positive regulation of transcription from RNA polymerase II promoter involved in unfolded protein response(GO:0006990) regulation of muscle atrophy(GO:0014735) N-terminal peptidyl-lysine acetylation(GO:0018076) |
| 1.0 | 7.2 | GO:0006517 | protein deglycosylation(GO:0006517) |
| 1.0 | 10.0 | GO:0000733 | DNA strand renaturation(GO:0000733) |
| 1.0 | 3.0 | GO:0030237 | female sex determination(GO:0030237) |
| 1.0 | 5.9 | GO:0010835 | regulation of protein ADP-ribosylation(GO:0010835) gas homeostasis(GO:0033483) |
| 1.0 | 6.7 | GO:0034773 | histone H4-K20 trimethylation(GO:0034773) |
| 0.9 | 7.5 | GO:0001842 | neural fold formation(GO:0001842) |
| 0.9 | 164.2 | GO:0002244 | hematopoietic progenitor cell differentiation(GO:0002244) |
| 0.9 | 28.2 | GO:0001958 | endochondral ossification(GO:0001958) replacement ossification(GO:0036075) |
| 0.9 | 33.4 | GO:0060325 | face morphogenesis(GO:0060325) |
| 0.9 | 52.9 | GO:0034605 | cellular response to heat(GO:0034605) |
| 0.9 | 4.3 | GO:0017182 | peptidyl-diphthamide metabolic process(GO:0017182) peptidyl-diphthamide biosynthetic process from peptidyl-histidine(GO:0017183) |
| 0.9 | 15.4 | GO:0035329 | hippo signaling(GO:0035329) |
| 0.8 | 42.4 | GO:0038083 | peptidyl-tyrosine autophosphorylation(GO:0038083) |
| 0.8 | 48.2 | GO:0045576 | mast cell activation(GO:0045576) |
| 0.8 | 5.1 | GO:2000622 | regulation of nuclear-transcribed mRNA catabolic process, nonsense-mediated decay(GO:2000622) negative regulation of nuclear-transcribed mRNA catabolic process, nonsense-mediated decay(GO:2000623) |
| 0.8 | 9.9 | GO:0051014 | actin filament severing(GO:0051014) |
| 0.8 | 1.6 | GO:1903797 | positive regulation of inorganic anion transmembrane transport(GO:1903797) |
| 0.8 | 17.2 | GO:0002115 | store-operated calcium entry(GO:0002115) |
| 0.8 | 36.7 | GO:0002763 | positive regulation of myeloid leukocyte differentiation(GO:0002763) |
| 0.8 | 2.4 | GO:1904211 | membrane protein proteolysis involved in retrograde protein transport, ER to cytosol(GO:1904211) |
| 0.8 | 13.4 | GO:0051084 | 'de novo' posttranslational protein folding(GO:0051084) |
| 0.7 | 6.0 | GO:0038063 | collagen-activated tyrosine kinase receptor signaling pathway(GO:0038063) |
| 0.7 | 17.6 | GO:0045662 | negative regulation of myoblast differentiation(GO:0045662) |
| 0.7 | 2.2 | GO:0002148 | hypochlorous acid metabolic process(GO:0002148) hypochlorous acid biosynthetic process(GO:0002149) |
| 0.7 | 10.9 | GO:0045947 | negative regulation of translational initiation(GO:0045947) |
| 0.7 | 12.2 | GO:0006491 | N-glycan processing(GO:0006491) |
| 0.7 | 2.0 | GO:0006059 | hexitol metabolic process(GO:0006059) |
| 0.7 | 15.9 | GO:0000731 | DNA synthesis involved in DNA repair(GO:0000731) |
| 0.6 | 6.9 | GO:0006516 | glycoprotein catabolic process(GO:0006516) |
| 0.6 | 21.2 | GO:0046039 | GTP metabolic process(GO:0046039) |
| 0.6 | 34.9 | GO:0046847 | filopodium assembly(GO:0046847) |
| 0.6 | 2.4 | GO:2000418 | positive regulation of eosinophil migration(GO:2000418) |
| 0.6 | 15.5 | GO:0034260 | negative regulation of GTPase activity(GO:0034260) |
| 0.6 | 8.0 | GO:0045023 | G0 to G1 transition(GO:0045023) |
| 0.6 | 59.7 | GO:0008277 | regulation of G-protein coupled receptor protein signaling pathway(GO:0008277) |
| 0.6 | 3.9 | GO:0033129 | positive regulation of histone phosphorylation(GO:0033129) |
| 0.5 | 21.8 | GO:1900047 | negative regulation of blood coagulation(GO:0030195) negative regulation of hemostasis(GO:1900047) |
| 0.5 | 58.0 | GO:0006641 | triglyceride metabolic process(GO:0006641) |
| 0.5 | 61.5 | GO:0008360 | regulation of cell shape(GO:0008360) |
| 0.5 | 33.4 | GO:0050715 | positive regulation of cytokine secretion(GO:0050715) |
| 0.5 | 4.1 | GO:0016584 | nucleosome positioning(GO:0016584) |
| 0.5 | 1.5 | GO:0042322 | negative regulation of circadian sleep/wake cycle, REM sleep(GO:0042322) |
| 0.5 | 5.6 | GO:0032534 | regulation of microvillus assembly(GO:0032534) |
| 0.5 | 2.0 | GO:0071802 | negative regulation of podosome assembly(GO:0071802) |
| 0.5 | 9.2 | GO:0031163 | iron-sulfur cluster assembly(GO:0016226) metallo-sulfur cluster assembly(GO:0031163) |
| 0.5 | 3.3 | GO:0043550 | regulation of lipid kinase activity(GO:0043550) |
| 0.5 | 55.2 | GO:0007127 | meiosis I(GO:0007127) |
| 0.5 | 2.3 | GO:0036337 | Fas signaling pathway(GO:0036337) |
| 0.4 | 4.8 | GO:0035357 | peroxisome proliferator activated receptor signaling pathway(GO:0035357) |
| 0.4 | 11.9 | GO:0035458 | cellular response to interferon-beta(GO:0035458) |
| 0.4 | 11.6 | GO:0046329 | negative regulation of JNK cascade(GO:0046329) |
| 0.4 | 3.4 | GO:1901096 | regulation of autophagosome maturation(GO:1901096) |
| 0.4 | 11.6 | GO:0018279 | protein N-linked glycosylation via asparagine(GO:0018279) |
| 0.4 | 10.1 | GO:0070979 | protein K11-linked ubiquitination(GO:0070979) |
| 0.3 | 3.3 | GO:0031954 | positive regulation of protein autophosphorylation(GO:0031954) |
| 0.3 | 13.5 | GO:0097421 | liver regeneration(GO:0097421) |
| 0.3 | 23.3 | GO:0042273 | ribosomal large subunit biogenesis(GO:0042273) |
| 0.3 | 33.7 | GO:0007596 | blood coagulation(GO:0007596) hemostasis(GO:0007599) |
| 0.3 | 0.9 | GO:2001288 | positive regulation of caveolin-mediated endocytosis(GO:2001288) |
| 0.3 | 35.3 | GO:0042113 | B cell activation(GO:0042113) |
| 0.3 | 23.2 | GO:0003333 | amino acid transmembrane transport(GO:0003333) |
| 0.3 | 0.8 | GO:0060459 | left lung development(GO:0060459) left lung morphogenesis(GO:0060460) |
| 0.2 | 30.3 | GO:0051607 | defense response to virus(GO:0051607) |
| 0.2 | 2.9 | GO:0035970 | peptidyl-threonine dephosphorylation(GO:0035970) |
| 0.2 | 4.9 | GO:0035641 | locomotory exploration behavior(GO:0035641) |
| 0.2 | 2.0 | GO:0051382 | kinetochore assembly(GO:0051382) |
| 0.2 | 2.3 | GO:0030238 | male sex determination(GO:0030238) nuclear body organization(GO:0030575) |
| 0.2 | 7.1 | GO:0010501 | RNA secondary structure unwinding(GO:0010501) |
| 0.2 | 8.8 | GO:0071427 | mRNA export from nucleus(GO:0006406) mRNA-containing ribonucleoprotein complex export from nucleus(GO:0071427) |
| 0.2 | 1.0 | GO:2000601 | positive regulation of Arp2/3 complex-mediated actin nucleation(GO:2000601) |
| 0.2 | 2.8 | GO:0001829 | trophectodermal cell differentiation(GO:0001829) |
| 0.1 | 1.2 | GO:0006983 | ER overload response(GO:0006983) |
| 0.1 | 1.8 | GO:0030970 | retrograde protein transport, ER to cytosol(GO:0030970) |
| 0.1 | 4.7 | GO:0001881 | receptor recycling(GO:0001881) |
| 0.1 | 10.3 | GO:0000956 | nuclear-transcribed mRNA catabolic process(GO:0000956) |
| 0.1 | 4.2 | GO:0033138 | positive regulation of peptidyl-serine phosphorylation(GO:0033138) |
| 0.1 | 0.9 | GO:0006388 | tRNA splicing, via endonucleolytic cleavage and ligation(GO:0006388) |
| 0.1 | 1.4 | GO:0000301 | retrograde transport, vesicle recycling within Golgi(GO:0000301) |
| 0.1 | 3.0 | GO:1990090 | cellular response to nerve growth factor stimulus(GO:1990090) |
| 0.1 | 0.9 | GO:0046037 | GMP metabolic process(GO:0046037) |
| 0.0 | 17.4 | GO:0042330 | chemotaxis(GO:0006935) taxis(GO:0042330) |
| 0.0 | 4.9 | GO:0051291 | protein heterooligomerization(GO:0051291) |
| 0.0 | 0.1 | GO:0009826 | unidimensional cell growth(GO:0009826) |
| 0.0 | 0.3 | GO:1902260 | negative regulation of delayed rectifier potassium channel activity(GO:1902260) negative regulation of voltage-gated potassium channel activity(GO:1903817) |
| 0.0 | 1.3 | GO:0090502 | RNA phosphodiester bond hydrolysis, endonucleolytic(GO:0090502) |
| 0.0 | 1.0 | GO:0006505 | GPI anchor metabolic process(GO:0006505) |
| 0.0 | 0.6 | GO:0055078 | sodium ion homeostasis(GO:0055078) |
| 0.0 | 0.2 | GO:0061462 | protein localization to lysosome(GO:0061462) |
Gene overrepresentation in cellular component category:
| Log-likelihood per target | Total log-likelihood | Term | Description |
|---|---|---|---|
| 14.8 | 44.3 | GO:0005944 | phosphatidylinositol 3-kinase complex, class IB(GO:0005944) |
| 12.6 | 37.7 | GO:0030690 | Noc1p-Noc2p complex(GO:0030690) |
| 11.8 | 94.5 | GO:0042105 | alpha-beta T cell receptor complex(GO:0042105) |
| 10.4 | 62.6 | GO:0036195 | muscle cell projection(GO:0036194) muscle cell projection membrane(GO:0036195) |
| 8.1 | 64.8 | GO:0097197 | tetraspanin-enriched microdomain(GO:0097197) |
| 6.2 | 55.8 | GO:0031209 | SCAR complex(GO:0031209) |
| 5.9 | 59.3 | GO:0043020 | NADPH oxidase complex(GO:0043020) |
| 4.6 | 22.8 | GO:0030485 | smooth muscle contractile fiber(GO:0030485) |
| 4.5 | 18.2 | GO:0044299 | C-fiber(GO:0044299) |
| 3.9 | 47.0 | GO:0051286 | cell tip(GO:0051286) |
| 3.7 | 135.1 | GO:0001772 | immunological synapse(GO:0001772) |
| 3.5 | 52.3 | GO:0072687 | meiotic spindle(GO:0072687) |
| 3.3 | 9.9 | GO:0097543 | ciliary inversin compartment(GO:0097543) |
| 3.2 | 12.9 | GO:0005588 | collagen type V trimer(GO:0005588) |
| 3.2 | 15.9 | GO:0043625 | delta DNA polymerase complex(GO:0043625) |
| 3.1 | 95.5 | GO:0042588 | zymogen granule(GO:0042588) |
| 3.0 | 80.4 | GO:0001891 | phagocytic cup(GO:0001891) |
| 2.9 | 23.4 | GO:0044322 | endoplasmic reticulum quality control compartment(GO:0044322) |
| 2.8 | 8.3 | GO:0046696 | lipopolysaccharide receptor complex(GO:0046696) |
| 2.6 | 12.8 | GO:1990726 | Lsm1-7-Pat1 complex(GO:1990726) |
| 2.3 | 165.0 | GO:0005581 | collagen trimer(GO:0005581) |
| 2.2 | 13.2 | GO:0005642 | annulate lamellae(GO:0005642) |
| 2.2 | 6.5 | GO:0071001 | U4/U6 snRNP(GO:0071001) |
| 2.0 | 31.5 | GO:0005751 | mitochondrial respiratory chain complex IV(GO:0005751) |
| 2.0 | 19.6 | GO:0032009 | early phagosome(GO:0032009) |
| 1.8 | 70.9 | GO:0005834 | heterotrimeric G-protein complex(GO:0005834) |
| 1.7 | 18.6 | GO:0042555 | MCM complex(GO:0042555) |
| 1.7 | 58.1 | GO:0098636 | protein complex involved in cell adhesion(GO:0098636) |
| 1.3 | 420.4 | GO:0009897 | external side of plasma membrane(GO:0009897) |
| 1.3 | 17.1 | GO:0000778 | condensed nuclear chromosome kinetochore(GO:0000778) |
| 1.2 | 28.4 | GO:0032588 | trans-Golgi network membrane(GO:0032588) |
| 1.1 | 4.6 | GO:0005688 | U6 snRNP(GO:0005688) |
| 1.1 | 9.0 | GO:0044615 | nuclear pore nuclear basket(GO:0044615) |
| 1.1 | 3.3 | GO:0035032 | phosphatidylinositol 3-kinase complex, class III(GO:0035032) |
| 1.1 | 18.5 | GO:0031588 | nucleotide-activated protein kinase complex(GO:0031588) |
| 1.0 | 5.2 | GO:0090661 | box H/ACA telomerase RNP complex(GO:0090661) |
| 1.0 | 28.1 | GO:0000788 | nuclear nucleosome(GO:0000788) |
| 1.0 | 5.9 | GO:0090543 | Flemming body(GO:0090543) |
| 1.0 | 3.9 | GO:0005885 | Arp2/3 protein complex(GO:0005885) |
| 1.0 | 11.5 | GO:0031616 | spindle pole centrosome(GO:0031616) |
| 0.9 | 23.3 | GO:0030687 | preribosome, large subunit precursor(GO:0030687) |
| 0.8 | 27.3 | GO:0033017 | sarcoplasmic reticulum membrane(GO:0033017) |
| 0.8 | 75.7 | GO:0031234 | extrinsic component of cytoplasmic side of plasma membrane(GO:0031234) |
| 0.8 | 11.6 | GO:0008250 | oligosaccharyltransferase complex(GO:0008250) |
| 0.8 | 71.1 | GO:0005776 | autophagosome(GO:0005776) |
| 0.8 | 55.1 | GO:0032587 | ruffle membrane(GO:0032587) |
| 0.7 | 16.3 | GO:0051233 | spindle midzone(GO:0051233) |
| 0.7 | 5.9 | GO:0005658 | alpha DNA polymerase:primase complex(GO:0005658) |
| 0.7 | 46.2 | GO:0001726 | ruffle(GO:0001726) |
| 0.7 | 70.7 | GO:0005884 | actin filament(GO:0005884) |
| 0.7 | 4.1 | GO:0000137 | Golgi cis cisterna(GO:0000137) |
| 0.6 | 35.7 | GO:0097517 | stress fiber(GO:0001725) contractile actin filament bundle(GO:0097517) |
| 0.6 | 2.8 | GO:0030015 | CCR4-NOT core complex(GO:0030015) |
| 0.6 | 40.2 | GO:0022627 | cytosolic small ribosomal subunit(GO:0022627) |
| 0.5 | 6.4 | GO:0005736 | DNA-directed RNA polymerase I complex(GO:0005736) |
| 0.5 | 10.0 | GO:0000800 | lateral element(GO:0000800) |
| 0.5 | 46.7 | GO:0017053 | transcriptional repressor complex(GO:0017053) |
| 0.5 | 51.6 | GO:0043235 | receptor complex(GO:0043235) |
| 0.4 | 4.1 | GO:0031010 | ISWI-type complex(GO:0031010) |
| 0.4 | 60.1 | GO:0031252 | cell leading edge(GO:0031252) |
| 0.4 | 5.6 | GO:0043240 | Fanconi anaemia nuclear complex(GO:0043240) |
| 0.3 | 31.1 | GO:0072562 | blood microparticle(GO:0072562) |
| 0.3 | 0.9 | GO:1902560 | GMP reductase complex(GO:1902560) |
| 0.3 | 1.8 | GO:0005785 | signal recognition particle receptor complex(GO:0005785) |
| 0.3 | 27.9 | GO:0022625 | cytosolic large ribosomal subunit(GO:0022625) |
| 0.3 | 70.8 | GO:0016323 | basolateral plasma membrane(GO:0016323) |
| 0.2 | 16.6 | GO:0005811 | lipid particle(GO:0005811) |
| 0.2 | 87.1 | GO:0031012 | extracellular matrix(GO:0031012) |
| 0.2 | 2.2 | GO:0042582 | primary lysosome(GO:0005766) azurophil granule(GO:0042582) |
| 0.2 | 4.6 | GO:0060077 | inhibitory synapse(GO:0060077) |
| 0.2 | 6.4 | GO:0080008 | Cul4-RING E3 ubiquitin ligase complex(GO:0080008) |
| 0.2 | 27.2 | GO:0016324 | apical plasma membrane(GO:0016324) |
| 0.2 | 78.3 | GO:0009986 | cell surface(GO:0009986) |
| 0.2 | 4.9 | GO:0030686 | 90S preribosome(GO:0030686) |
| 0.2 | 2.3 | GO:0072357 | PTW/PP1 phosphatase complex(GO:0072357) |
| 0.2 | 3.3 | GO:0055038 | recycling endosome membrane(GO:0055038) |
| 0.2 | 165.4 | GO:0005887 | integral component of plasma membrane(GO:0005887) |
| 0.2 | 9.2 | GO:0005777 | peroxisome(GO:0005777) microbody(GO:0042579) |
| 0.1 | 8.7 | GO:0005793 | endoplasmic reticulum-Golgi intermediate compartment(GO:0005793) |
| 0.1 | 20.5 | GO:0005789 | endoplasmic reticulum membrane(GO:0005789) |
| 0.1 | 12.4 | GO:0000323 | lytic vacuole(GO:0000323) lysosome(GO:0005764) |
| 0.1 | 1.3 | GO:0000445 | THO complex(GO:0000347) THO complex part of transcription export complex(GO:0000445) |
| 0.1 | 4.6 | GO:0005881 | cytoplasmic microtubule(GO:0005881) |
| 0.1 | 614.2 | GO:0016021 | integral component of membrane(GO:0016021) |
| 0.1 | 0.9 | GO:0072669 | tRNA-splicing ligase complex(GO:0072669) |
| 0.1 | 0.6 | GO:1990393 | 3M complex(GO:1990393) |
| 0.1 | 3.0 | GO:0045171 | intercellular bridge(GO:0045171) |
| 0.1 | 4.8 | GO:0030133 | transport vesicle(GO:0030133) |
| 0.1 | 4.7 | GO:0005769 | early endosome(GO:0005769) |
| 0.0 | 0.2 | GO:0071986 | Ragulator complex(GO:0071986) |
| 0.0 | 46.7 | GO:0005886 | plasma membrane(GO:0005886) |
| 0.0 | 2.3 | GO:0016605 | PML body(GO:0016605) |
| 0.0 | 40.5 | GO:0016020 | membrane(GO:0016020) |
| 0.0 | 1.2 | GO:0071013 | catalytic step 2 spliceosome(GO:0071013) |
| 0.0 | 0.9 | GO:0031463 | Cul3-RING ubiquitin ligase complex(GO:0031463) |
Gene overrepresentation in molecular function category:
| Log-likelihood per target | Total log-likelihood | Term | Description |
|---|---|---|---|
| 32.2 | 193.0 | GO:0019767 | IgE receptor activity(GO:0019767) |
| 24.7 | 74.2 | GO:0005157 | macrophage colony-stimulating factor receptor binding(GO:0005157) |
| 15.1 | 45.4 | GO:0016823 | hydrolase activity, acting on acid carbon-carbon bonds(GO:0016822) hydrolase activity, acting on acid carbon-carbon bonds, in ketonic substances(GO:0016823) |
| 13.5 | 54.1 | GO:0051425 | inositol bisphosphate phosphatase activity(GO:0016312) PTB domain binding(GO:0051425) |
| 12.8 | 76.6 | GO:0008349 | MAP kinase kinase kinase kinase activity(GO:0008349) |
| 12.0 | 47.9 | GO:0005136 | interleukin-4 receptor binding(GO:0005136) |
| 11.6 | 58.0 | GO:0030229 | very-low-density lipoprotein particle receptor activity(GO:0030229) |
| 10.8 | 32.5 | GO:0004464 | arachidonate 5-lipoxygenase activity(GO:0004051) leukotriene-C4 synthase activity(GO:0004464) |
| 10.5 | 94.5 | GO:0019198 | transmembrane receptor protein tyrosine phosphatase activity(GO:0005001) transmembrane receptor protein phosphatase activity(GO:0019198) |
| 10.4 | 62.6 | GO:0035650 | AP-1 adaptor complex binding(GO:0035650) |
| 9.6 | 67.0 | GO:0035375 | zymogen binding(GO:0035375) |
| 9.4 | 37.7 | GO:0035877 | death effector domain binding(GO:0035877) |
| 9.0 | 107.8 | GO:0001608 | G-protein coupled nucleotide receptor activity(GO:0001608) G-protein coupled purinergic nucleotide receptor activity(GO:0045028) |
| 8.5 | 93.3 | GO:0019864 | IgG binding(GO:0019864) |
| 8.2 | 65.5 | GO:0003924 | GTPase activity(GO:0003924) |
| 7.4 | 44.3 | GO:0046935 | 1-phosphatidylinositol-3-kinase regulator activity(GO:0046935) |
| 7.0 | 34.9 | GO:0004920 | interleukin-10 receptor activity(GO:0004920) |
| 6.7 | 67.2 | GO:0019957 | C-C chemokine binding(GO:0019957) |
| 6.6 | 59.3 | GO:0016175 | superoxide-generating NADPH oxidase activity(GO:0016175) |
| 6.3 | 50.5 | GO:0016494 | C-X-C chemokine receptor activity(GO:0016494) C-X-C chemokine binding(GO:0019958) |
| 6.1 | 18.2 | GO:0031727 | CCR2 chemokine receptor binding(GO:0031727) |
| 6.0 | 53.7 | GO:0015093 | ferrous iron transmembrane transporter activity(GO:0015093) |
| 5.3 | 15.9 | GO:0004060 | arylamine N-acetyltransferase activity(GO:0004060) |
| 5.3 | 100.2 | GO:0005149 | interleukin-1 receptor binding(GO:0005149) |
| 5.0 | 35.3 | GO:0005068 | transmembrane receptor protein tyrosine kinase adaptor activity(GO:0005068) |
| 4.7 | 18.9 | GO:0047184 | 1-acylglycerophosphocholine O-acyltransferase activity(GO:0047184) |
| 4.7 | 28.2 | GO:0042289 | MHC class II protein binding(GO:0042289) |
| 4.6 | 37.1 | GO:0004630 | phospholipase D activity(GO:0004630) |
| 4.1 | 12.3 | GO:0035251 | UDP-glucosyltransferase activity(GO:0035251) |
| 4.1 | 16.2 | GO:0005220 | inositol 1,4,5-trisphosphate-sensitive calcium-release channel activity(GO:0005220) |
| 3.9 | 59.0 | GO:0005092 | GDP-dissociation inhibitor activity(GO:0005092) |
| 3.9 | 46.7 | GO:0022820 | potassium:chloride symporter activity(GO:0015379) potassium ion symporter activity(GO:0022820) |
| 3.9 | 27.0 | GO:0004908 | interleukin-1 receptor activity(GO:0004908) |
| 3.8 | 18.8 | GO:0004974 | leukotriene receptor activity(GO:0004974) |
| 3.7 | 11.2 | GO:0001716 | L-amino-acid oxidase activity(GO:0001716) |
| 3.6 | 79.7 | GO:0030676 | Rac guanyl-nucleotide exchange factor activity(GO:0030676) |
| 3.6 | 10.7 | GO:0035800 | deubiquitinase activator activity(GO:0035800) |
| 3.5 | 10.6 | GO:0035014 | phosphatidylinositol 3-kinase regulator activity(GO:0035014) |
| 3.1 | 12.5 | GO:0046703 | natural killer cell lectin-like receptor binding(GO:0046703) |
| 3.0 | 21.2 | GO:0031821 | G-protein coupled serotonin receptor binding(GO:0031821) |
| 2.8 | 8.3 | GO:0001875 | lipopolysaccharide receptor activity(GO:0001875) |
| 2.7 | 13.5 | GO:1990932 | 5.8S rRNA binding(GO:1990932) |
| 2.6 | 20.7 | GO:0005049 | nuclear export signal receptor activity(GO:0005049) |
| 2.4 | 49.8 | GO:0043325 | phosphatidylinositol-3,4-bisphosphate binding(GO:0043325) |
| 2.3 | 753.3 | GO:0030246 | carbohydrate binding(GO:0030246) |
| 2.1 | 8.3 | GO:0004719 | protein-L-isoaspartate (D-aspartate) O-methyltransferase activity(GO:0004719) |
| 1.9 | 21.0 | GO:0004571 | mannosyl-oligosaccharide 1,2-alpha-mannosidase activity(GO:0004571) mannosyl-oligosaccharide mannosidase activity(GO:0015924) |
| 1.9 | 16.9 | GO:0047498 | calcium-dependent phospholipase A2 activity(GO:0047498) |
| 1.7 | 13.5 | GO:0004716 | receptor signaling protein tyrosine kinase activity(GO:0004716) |
| 1.7 | 10.0 | GO:0000150 | recombinase activity(GO:0000150) |
| 1.6 | 11.0 | GO:0004652 | polynucleotide adenylyltransferase activity(GO:0004652) |
| 1.5 | 50.7 | GO:1990841 | promoter-specific chromatin binding(GO:1990841) |
| 1.4 | 11.1 | GO:0030621 | U6 snRNA binding(GO:0017070) U4 snRNA binding(GO:0030621) |
| 1.4 | 48.7 | GO:0001965 | G-protein alpha-subunit binding(GO:0001965) |
| 1.3 | 95.6 | GO:0005089 | Rho guanyl-nucleotide exchange factor activity(GO:0005089) |
| 1.3 | 25.4 | GO:0015271 | outward rectifier potassium channel activity(GO:0015271) |
| 1.2 | 43.7 | GO:0001784 | phosphotyrosine binding(GO:0001784) |
| 1.2 | 18.5 | GO:0004679 | AMP-activated protein kinase activity(GO:0004679) |
| 1.2 | 26.9 | GO:0003950 | NAD+ ADP-ribosyltransferase activity(GO:0003950) |
| 1.0 | 17.2 | GO:0015279 | store-operated calcium channel activity(GO:0015279) |
| 1.0 | 10.0 | GO:0036310 | annealing helicase activity(GO:0036310) |
| 1.0 | 14.9 | GO:0009982 | pseudouridine synthase activity(GO:0009982) |
| 0.9 | 9.4 | GO:0000774 | adenyl-nucleotide exchange factor activity(GO:0000774) |
| 0.9 | 10.9 | GO:0008190 | eukaryotic initiation factor 4E binding(GO:0008190) |
| 0.9 | 20.7 | GO:0005112 | Notch binding(GO:0005112) |
| 0.9 | 42.4 | GO:0004715 | non-membrane spanning protein tyrosine kinase activity(GO:0004715) |
| 0.9 | 69.9 | GO:0003725 | double-stranded RNA binding(GO:0003725) |
| 0.8 | 3.4 | GO:0015165 | pyrimidine nucleotide-sugar transmembrane transporter activity(GO:0015165) |
| 0.8 | 5.9 | GO:0003896 | DNA primase activity(GO:0003896) |
| 0.8 | 58.0 | GO:0030295 | protein kinase activator activity(GO:0030295) |
| 0.8 | 2.4 | GO:0031728 | CCR3 chemokine receptor binding(GO:0031728) |
| 0.7 | 46.5 | GO:0019843 | rRNA binding(GO:0019843) |
| 0.7 | 6.4 | GO:0001054 | RNA polymerase I activity(GO:0001054) |
| 0.7 | 15.9 | GO:0003887 | DNA-directed DNA polymerase activity(GO:0003887) |
| 0.7 | 17.6 | GO:0048020 | CCR chemokine receptor binding(GO:0048020) |
| 0.6 | 4.2 | GO:0042030 | ATPase inhibitor activity(GO:0042030) |
| 0.6 | 23.8 | GO:0003678 | DNA helicase activity(GO:0003678) |
| 0.6 | 29.8 | GO:0030551 | cyclic nucleotide binding(GO:0030551) |
| 0.5 | 134.1 | GO:0005096 | GTPase activator activity(GO:0005096) |
| 0.5 | 86.6 | GO:0051015 | actin filament binding(GO:0051015) |
| 0.5 | 50.3 | GO:0001948 | glycoprotein binding(GO:0001948) |
| 0.4 | 3.1 | GO:0004468 | lysine N-acetyltransferase activity, acting on acetyl phosphate as donor(GO:0004468) |
| 0.4 | 25.2 | GO:0051219 | phosphoprotein binding(GO:0051219) |
| 0.4 | 42.9 | GO:0017124 | SH3 domain binding(GO:0017124) |
| 0.4 | 52.7 | GO:0005085 | guanyl-nucleotide exchange factor activity(GO:0005085) |
| 0.4 | 11.5 | GO:0051539 | 4 iron, 4 sulfur cluster binding(GO:0051539) |
| 0.4 | 43.8 | GO:0004222 | metalloendopeptidase activity(GO:0004222) |
| 0.4 | 22.2 | GO:0016279 | lysine N-methyltransferase activity(GO:0016278) protein-lysine N-methyltransferase activity(GO:0016279) |
| 0.4 | 11.1 | GO:0016676 | cytochrome-c oxidase activity(GO:0004129) heme-copper terminal oxidase activity(GO:0015002) oxidoreductase activity, acting on a heme group of donors, oxygen as acceptor(GO:0016676) |
| 0.4 | 5.9 | GO:0008568 | microtubule-severing ATPase activity(GO:0008568) |
| 0.4 | 137.6 | GO:0005525 | GTP binding(GO:0005525) |
| 0.3 | 11.9 | GO:0005164 | tumor necrosis factor receptor binding(GO:0005164) |
| 0.3 | 1.6 | GO:0015321 | sodium-dependent phosphate transmembrane transporter activity(GO:0015321) |
| 0.3 | 6.2 | GO:0032183 | SUMO binding(GO:0032183) |
| 0.3 | 0.9 | GO:0016657 | GMP reductase activity(GO:0003920) oxidoreductase activity, acting on NAD(P)H, nitrogenous group as acceptor(GO:0016657) |
| 0.3 | 9.1 | GO:0061631 | ubiquitin conjugating enzyme activity(GO:0061631) |
| 0.3 | 15.1 | GO:0008186 | RNA helicase activity(GO:0003724) ATP-dependent RNA helicase activity(GO:0004004) RNA-dependent ATPase activity(GO:0008186) |
| 0.3 | 6.5 | GO:0042923 | neuropeptide binding(GO:0042923) |
| 0.2 | 12.9 | GO:0005201 | extracellular matrix structural constituent(GO:0005201) |
| 0.2 | 5.9 | GO:0048487 | beta-tubulin binding(GO:0048487) |
| 0.2 | 2.7 | GO:0045236 | CXCR chemokine receptor binding(GO:0045236) |
| 0.2 | 1.5 | GO:0043495 | protein anchor(GO:0043495) |
| 0.2 | 2.9 | GO:0017017 | MAP kinase tyrosine/serine/threonine phosphatase activity(GO:0017017) |
| 0.2 | 14.1 | GO:0005178 | integrin binding(GO:0005178) |
| 0.2 | 4.6 | GO:0098632 | protein binding involved in cell-cell adhesion(GO:0098632) |
| 0.1 | 0.9 | GO:0019870 | potassium channel inhibitor activity(GO:0019870) |
| 0.1 | 2.3 | GO:0008157 | protein phosphatase 1 binding(GO:0008157) |
| 0.1 | 50.2 | GO:0001228 | transcriptional activator activity, RNA polymerase II transcription regulatory region sequence-specific binding(GO:0001228) |
| 0.1 | 2.1 | GO:0016891 | endoribonuclease activity, producing 5'-phosphomonoesters(GO:0016891) |
| 0.1 | 0.8 | GO:0070697 | activin receptor binding(GO:0070697) |
| 0.1 | 1.8 | GO:0042288 | MHC class I protein binding(GO:0042288) |
| 0.1 | 14.6 | GO:0004252 | serine-type endopeptidase activity(GO:0004252) |
| 0.1 | 8.7 | GO:0003714 | transcription corepressor activity(GO:0003714) |
| 0.1 | 1.0 | GO:0048365 | Rac GTPase binding(GO:0048365) |
| 0.1 | 2.2 | GO:0004601 | peroxidase activity(GO:0004601) |
| 0.0 | 6.5 | GO:0015293 | symporter activity(GO:0015293) |
| 0.0 | 0.6 | GO:0050750 | low-density lipoprotein particle receptor binding(GO:0050750) |
| 0.0 | 0.6 | GO:0005248 | voltage-gated sodium channel activity(GO:0005248) |
Gene overrepresentation in curated gene sets: canonical pathways category:
| Log-likelihood per target | Total log-likelihood | Term | Description |
|---|---|---|---|
| 11.8 | 213.1 | SA MMP CYTOKINE CONNECTION | Cytokines can induce activation of matrix metalloproteinases, which degrade extracellular matrix. |
| 6.2 | 86.5 | PID TCR JNK PATHWAY | JNK signaling in the CD4+ TCR pathway |
| 5.1 | 347.3 | PID FCER1 PATHWAY | Fc-epsilon receptor I signaling in mast cells |
| 4.2 | 37.7 | SA FAS SIGNALING | The TNF-type receptor Fas induces apoptosis on ligand binding. |
| 3.7 | 168.7 | PID KIT PATHWAY | Signaling events mediated by Stem cell factor receptor (c-Kit) |
| 3.2 | 35.3 | SA B CELL RECEPTOR COMPLEXES | Antigen binding to B cell receptors activates protein tyrosine kinases, such as the Src family, which ultimate activate MAP kinases. |
| 2.3 | 65.5 | PID CONE PATHWAY | Visual signal transduction: Cones |
| 2.3 | 66.6 | PID IL12 STAT4 PATHWAY | IL12 signaling mediated by STAT4 |
| 2.3 | 128.1 | PID RAC1 PATHWAY | RAC1 signaling pathway |
| 2.2 | 71.7 | PID CXCR3 PATHWAY | CXCR3-mediated signaling events |
| 2.2 | 60.6 | SIG PIP3 SIGNALING IN B LYMPHOCYTES | Genes related to PIP3 signaling in B lymphocytes |
| 1.8 | 52.0 | PID INTEGRIN2 PATHWAY | Beta2 integrin cell surface interactions |
| 1.8 | 39.1 | PID P38 MK2 PATHWAY | p38 signaling mediated by MAPKAP kinases |
| 1.5 | 241.1 | NABA ECM AFFILIATED | Genes encoding proteins affiliated structurally or functionally to extracellular matrix proteins |
| 1.5 | 40.0 | PID IL1 PATHWAY | IL1-mediated signaling events |
| 1.4 | 18.2 | PID GMCSF PATHWAY | GMCSF-mediated signaling events |
| 1.3 | 18.6 | SA REG CASCADE OF CYCLIN EXPR | Expression of cyclins regulates progression through the cell cycle by activating cyclin-dependent kinases. |
| 1.3 | 57.3 | PID CXCR4 PATHWAY | CXCR4-mediated signaling events |
| 1.3 | 52.6 | PID RHOA PATHWAY | RhoA signaling pathway |
| 1.2 | 35.7 | PID TCR PATHWAY | TCR signaling in naïve CD4+ T cells |
| 1.2 | 52.3 | PID AURORA B PATHWAY | Aurora B signaling |
| 1.1 | 13.2 | PID RANBP2 PATHWAY | Sumoylation by RanBP2 regulates transcriptional repression |
| 1.1 | 59.3 | PID RHOA REG PATHWAY | Regulation of RhoA activity |
| 0.9 | 20.3 | PID FAK PATHWAY | Signaling events mediated by focal adhesion kinase |
| 0.8 | 52.9 | PID CMYB PATHWAY | C-MYB transcription factor network |
| 0.8 | 13.5 | PID ANGIOPOIETIN RECEPTOR PATHWAY | Angiopoietin receptor Tie2-mediated signaling |
| 0.8 | 18.5 | PID VEGFR1 2 PATHWAY | Signaling events mediated by VEGFR1 and VEGFR2 |
| 0.8 | 37.0 | PID PDGFRB PATHWAY | PDGFR-beta signaling pathway |
| 0.8 | 28.1 | PID NFAT TFPATHWAY | Calcineurin-regulated NFAT-dependent transcription in lymphocytes |
| 0.8 | 51.5 | PID E2F PATHWAY | E2F transcription factor network |
| 0.6 | 18.7 | PID FANCONI PATHWAY | Fanconi anemia pathway |
| 0.5 | 5.4 | PID RHODOPSIN PATHWAY | Visual signal transduction: Rods |
| 0.5 | 18.8 | PID ENDOTHELIN PATHWAY | Endothelins |
| 0.5 | 8.3 | PID TOLL ENDOGENOUS PATHWAY | Endogenous TLR signaling |
| 0.5 | 14.0 | PID BARD1 PATHWAY | BARD1 signaling events |
| 0.5 | 2.3 | SA PROGRAMMED CELL DEATH | Programmed cell death, or apoptosis, eliminates damaged or unneeded cells. |
| 0.4 | 15.4 | PID RXR VDR PATHWAY | RXR and RAR heterodimerization with other nuclear receptor |
| 0.4 | 7.5 | PID SMAD2 3PATHWAY | Regulation of cytoplasmic and nuclear SMAD2/3 signaling |
| 0.4 | 15.8 | PID TAP63 PATHWAY | Validated transcriptional targets of TAp63 isoforms |
| 0.3 | 35.1 | PID P53 DOWNSTREAM PATHWAY | Direct p53 effectors |
| 0.3 | 5.1 | PID P38 MKK3 6PATHWAY | p38 MAPK signaling pathway |
| 0.3 | 12.9 | PID SYNDECAN 1 PATHWAY | Syndecan-1-mediated signaling events |
| 0.3 | 67.0 | NABA ECM GLYCOPROTEINS | Genes encoding structural ECM glycoproteins |
| 0.2 | 3.4 | PID INTEGRIN A4B1 PATHWAY | Alpha4 beta1 integrin signaling events |
| 0.2 | 3.3 | PID GLYPICAN 1PATHWAY | Glypican 1 network |
| 0.2 | 5.2 | PID TELOMERASE PATHWAY | Regulation of Telomerase |
| 0.1 | 3.8 | PID IL4 2PATHWAY | IL4-mediated signaling events |
| 0.1 | 3.9 | PID CASPASE PATHWAY | Caspase cascade in apoptosis |
| 0.1 | 4.7 | PID HDAC CLASSI PATHWAY | Signaling events mediated by HDAC Class I |
| 0.1 | 2.1 | PID P53 REGULATION PATHWAY | p53 pathway |
| 0.1 | 13.7 | NABA ECM REGULATORS | Genes encoding enzymes and their regulators involved in the remodeling of the extracellular matrix |
| 0.1 | 0.6 | PID HDAC CLASSII PATHWAY | Signaling events mediated by HDAC Class II |
| 0.0 | 0.9 | PID P73PATHWAY | p73 transcription factor network |
| 0.0 | 9.1 | NABA MATRISOME ASSOCIATED | Ensemble of genes encoding ECM-associated proteins including ECM-affilaited proteins, ECM regulators and secreted factors |
| 0.0 | 0.4 | PID SMAD2 3NUCLEAR PATHWAY | Regulation of nuclear SMAD2/3 signaling |
Gene overrepresentation in curated gene sets: REACTOME pathways category:
| Log-likelihood per target | Total log-likelihood | Term | Description |
|---|---|---|---|
| 14.4 | 157.9 | REACTOME CREATION OF C4 AND C2 ACTIVATORS | Genes involved in Creation of C4 and C2 activators |
| 9.0 | 107.8 | REACTOME P2Y RECEPTORS | Genes involved in P2Y receptors |
| 8.1 | 130.3 | REACTOME SIGNAL REGULATORY PROTEIN SIRP FAMILY INTERACTIONS | Genes involved in Signal regulatory protein (SIRP) family interactions |
| 7.2 | 144.4 | REACTOME CD28 DEPENDENT VAV1 PATHWAY | Genes involved in CD28 dependent Vav1 pathway |
| 7.1 | 21.2 | REACTOME ADP SIGNALLING THROUGH P2RY12 | Genes involved in ADP signalling through P2Y purinoceptor 12 |
| 5.0 | 45.4 | REACTOME TRYPTOPHAN CATABOLISM | Genes involved in Tryptophan catabolism |
| 4.9 | 238.8 | REACTOME IMMUNOREGULATORY INTERACTIONS BETWEEN A LYMPHOID AND A NON LYMPHOID CELL | Genes involved in Immunoregulatory interactions between a Lymphoid and a non-Lymphoid cell |
| 4.5 | 45.5 | REACTOME CALNEXIN CALRETICULIN CYCLE | Genes involved in Calnexin/calreticulin cycle |
| 4.3 | 47.5 | REACTOME PLATELET ADHESION TO EXPOSED COLLAGEN | Genes involved in Platelet Adhesion to exposed collagen |
| 3.8 | 109.8 | REACTOME G BETA GAMMA SIGNALLING THROUGH PI3KGAMMA | Genes involved in G beta:gamma signalling through PI3Kgamma |
| 3.6 | 32.5 | REACTOME TRAF6 MEDIATED IRF7 ACTIVATION IN TLR7 8 OR 9 SIGNALING | Genes involved in TRAF6 mediated IRF7 activation in TLR7/8 or 9 signaling |
| 3.4 | 37.7 | REACTOME NFKB ACTIVATION THROUGH FADD RIP1 PATHWAY MEDIATED BY CASPASE 8 AND10 | Genes involved in NF-kB activation through FADD/RIP-1 pathway mediated by caspase-8 and -10 |
| 3.1 | 153.5 | REACTOME CHEMOKINE RECEPTORS BIND CHEMOKINES | Genes involved in Chemokine receptors bind chemokines |
| 2.4 | 94.7 | REACTOME IL1 SIGNALING | Genes involved in Interleukin-1 signaling |
| 2.4 | 16.9 | REACTOME ADP SIGNALLING THROUGH P2RY1 | Genes involved in ADP signalling through P2Y purinoceptor 1 |
| 2.4 | 35.3 | REACTOME REGULATION OF SIGNALING BY CBL | Genes involved in Regulation of signaling by CBL |
| 2.1 | 18.5 | REACTOME REGULATION OF RHEB GTPASE ACTIVITY BY AMPK | Genes involved in Regulation of Rheb GTPase activity by AMPK |
| 2.0 | 298.1 | REACTOME SIGNALING BY RHO GTPASES | Genes involved in Signaling by Rho GTPases |
| 2.0 | 19.8 | REACTOME ACTIVATION OF IRF3 IRF7 MEDIATED BY TBK1 IKK EPSILON | Genes involved in Activation of IRF3/IRF7 mediated by TBK1/IKK epsilon |
| 1.9 | 53.7 | REACTOME METAL ION SLC TRANSPORTERS | Genes involved in Metal ion SLC transporters |
| 1.7 | 20.7 | REACTOME RECEPTOR LIGAND BINDING INITIATES THE SECOND PROTEOLYTIC CLEAVAGE OF NOTCH RECEPTOR | Genes involved in Receptor-ligand binding initiates the second proteolytic cleavage of Notch receptor |
| 1.7 | 18.6 | REACTOME UNWINDING OF DNA | Genes involved in Unwinding of DNA |
| 1.6 | 47.0 | REACTOME RECYCLING PATHWAY OF L1 | Genes involved in Recycling pathway of L1 |
| 1.4 | 18.8 | REACTOME EICOSANOID LIGAND BINDING RECEPTORS | Genes involved in Eicosanoid ligand-binding receptors |
| 1.4 | 15.9 | REACTOME REMOVAL OF THE FLAP INTERMEDIATE FROM THE C STRAND | Genes involved in Removal of the Flap Intermediate from the C-strand |
| 1.4 | 40.4 | REACTOME DEGRADATION OF THE EXTRACELLULAR MATRIX | Genes involved in Degradation of the extracellular matrix |
| 1.4 | 21.7 | REACTOME RAP1 SIGNALLING | Genes involved in Rap1 signalling |
| 1.4 | 16.2 | REACTOME ELEVATION OF CYTOSOLIC CA2 LEVELS | Genes involved in Elevation of cytosolic Ca2+ levels |
| 1.3 | 34.9 | REACTOME G0 AND EARLY G1 | Genes involved in G0 and Early G1 |
| 1.2 | 11.9 | REACTOME REGULATION OF MRNA STABILITY BY PROTEINS THAT BIND AU RICH ELEMENTS | Genes involved in Regulation of mRNA Stability by Proteins that Bind AU-rich Elements |
| 1.1 | 22.8 | REACTOME NEPHRIN INTERACTIONS | Genes involved in Nephrin interactions |
| 1.1 | 11.3 | REACTOME CYCLIN A B1 ASSOCIATED EVENTS DURING G2 M TRANSITION | Genes involved in Cyclin A/B1 associated events during G2/M transition |
| 1.1 | 59.0 | REACTOME FORMATION OF THE TERNARY COMPLEX AND SUBSEQUENTLY THE 43S COMPLEX | Genes involved in Formation of the ternary complex, and subsequently, the 43S complex |
| 1.1 | 24.7 | REACTOME SIGNALING BY HIPPO | Genes involved in Signaling by Hippo |
| 1.0 | 13.5 | REACTOME TIE2 SIGNALING | Genes involved in Tie2 Signaling |
| 0.9 | 22.7 | REACTOME FANCONI ANEMIA PATHWAY | Genes involved in Fanconi Anemia pathway |
| 0.9 | 13.2 | REACTOME MRNA DECAY BY 5 TO 3 EXORIBONUCLEASE | Genes involved in mRNA Decay by 5' to 3' Exoribonuclease |
| 0.8 | 115.9 | REACTOME G ALPHA I SIGNALLING EVENTS | Genes involved in G alpha (i) signalling events |
| 0.8 | 4.8 | REACTOME TRAF6 MEDIATED IRF7 ACTIVATION | Genes involved in TRAF6 mediated IRF7 activation |
| 0.8 | 3.1 | REACTOME TRAF3 DEPENDENT IRF ACTIVATION PATHWAY | Genes involved in TRAF3-dependent IRF activation pathway |
| 0.8 | 10.0 | REACTOME HOMOLOGOUS RECOMBINATION REPAIR OF REPLICATION INDEPENDENT DOUBLE STRAND BREAKS | Genes involved in Homologous recombination repair of replication-independent double-strand breaks |
| 0.7 | 5.9 | REACTOME PROCESSIVE SYNTHESIS ON THE LAGGING STRAND | Genes involved in Processive synthesis on the lagging strand |
| 0.7 | 18.9 | REACTOME ACYL CHAIN REMODELLING OF PC | Genes involved in Acyl chain remodelling of PC |
| 0.6 | 28.1 | REACTOME INTERFERON GAMMA SIGNALING | Genes involved in Interferon gamma signaling |
| 0.5 | 49.8 | REACTOME RESPONSE TO ELEVATED PLATELET CYTOSOLIC CA2 | Genes involved in Response to elevated platelet cytosolic Ca2+ |
| 0.5 | 21.2 | REACTOME DEPOSITION OF NEW CENPA CONTAINING NUCLEOSOMES AT THE CENTROMERE | Genes involved in Deposition of New CENPA-containing Nucleosomes at the Centromere |
| 0.5 | 11.0 | REACTOME PROCESSING OF INTRONLESS PRE MRNAS | Genes involved in Processing of Intronless Pre-mRNAs |
| 0.5 | 49.7 | REACTOME FACTORS INVOLVED IN MEGAKARYOCYTE DEVELOPMENT AND PLATELET PRODUCTION | Genes involved in Factors involved in megakaryocyte development and platelet production |
| 0.5 | 27.9 | REACTOME PEPTIDE CHAIN ELONGATION | Genes involved in Peptide chain elongation |
| 0.4 | 5.2 | REACTOME EXTENSION OF TELOMERES | Genes involved in Extension of Telomeres |
| 0.4 | 9.9 | REACTOME CASPASE MEDIATED CLEAVAGE OF CYTOSKELETAL PROTEINS | Genes involved in Caspase-mediated cleavage of cytoskeletal proteins |
| 0.4 | 3.3 | REACTOME SYNTHESIS OF PIPS AT THE LATE ENDOSOME MEMBRANE | Genes involved in Synthesis of PIPs at the late endosome membrane |
| 0.4 | 11.8 | REACTOME LATENT INFECTION OF HOMO SAPIENS WITH MYCOBACTERIUM TUBERCULOSIS | Genes involved in Latent infection of Homo sapiens with Mycobacterium tuberculosis |
| 0.3 | 6.4 | REACTOME RNA POL I TRANSCRIPTION TERMINATION | Genes involved in RNA Polymerase I Transcription Termination |
| 0.3 | 24.3 | REACTOME TOLL RECEPTOR CASCADES | Genes involved in Toll Receptor Cascades |
| 0.3 | 3.3 | REACTOME DOWNREGULATION OF ERBB2 ERBB3 SIGNALING | Genes involved in Downregulation of ERBB2:ERBB3 signaling |
| 0.3 | 12.9 | REACTOME NCAM1 INTERACTIONS | Genes involved in NCAM1 interactions |
| 0.3 | 9.0 | REACTOME NEP NS2 INTERACTS WITH THE CELLULAR EXPORT MACHINERY | Genes involved in NEP/NS2 Interacts with the Cellular Export Machinery |
| 0.3 | 5.9 | REACTOME ENDOSOMAL SORTING COMPLEX REQUIRED FOR TRANSPORT ESCRT | Genes involved in Endosomal Sorting Complex Required For Transport (ESCRT) |
| 0.1 | 10.6 | REACTOME NUCLEAR RECEPTOR TRANSCRIPTION PATHWAY | Genes involved in Nuclear Receptor transcription pathway |
| 0.1 | 2.8 | REACTOME DEADENYLATION OF MRNA | Genes involved in Deadenylation of mRNA |
| 0.1 | 3.4 | REACTOME TRANSPORT OF VITAMINS NUCLEOSIDES AND RELATED MOLECULES | Genes involved in Transport of vitamins, nucleosides, and related molecules |
| 0.1 | 10.7 | REACTOME TRANSPORT OF INORGANIC CATIONS ANIONS AND AMINO ACIDS OLIGOPEPTIDES | Genes involved in Transport of inorganic cations/anions and amino acids/oligopeptides |
| 0.1 | 6.5 | REACTOME MRNA SPLICING | Genes involved in mRNA Splicing |
| 0.1 | 0.9 | REACTOME PURINE SALVAGE | Genes involved in Purine salvage |
| 0.0 | 0.6 | REACTOME INTERACTION BETWEEN L1 AND ANKYRINS | Genes involved in Interaction between L1 and Ankyrins |
| 0.0 | 1.5 | REACTOME G ALPHA S SIGNALLING EVENTS | Genes involved in G alpha (s) signalling events |
| 0.0 | 1.0 | REACTOME GLYCEROPHOSPHOLIPID BIOSYNTHESIS | Genes involved in Glycerophospholipid biosynthesis |