Project
GSE53960: rat RNA-Seq transcriptomic Bodymap
Navigation
Downloads
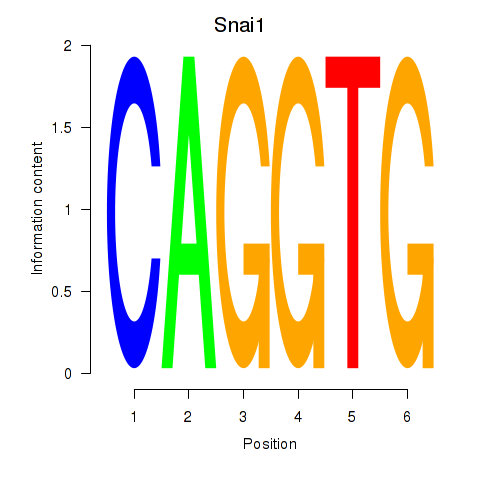
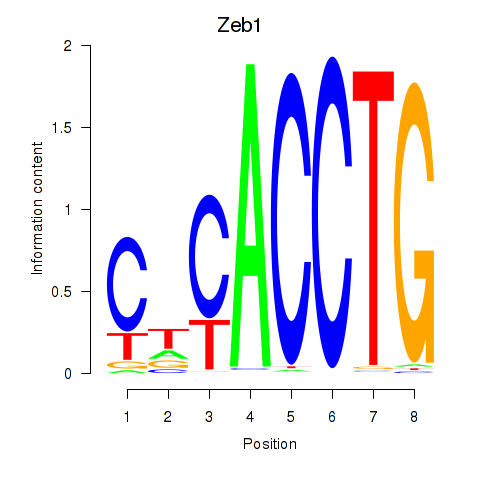
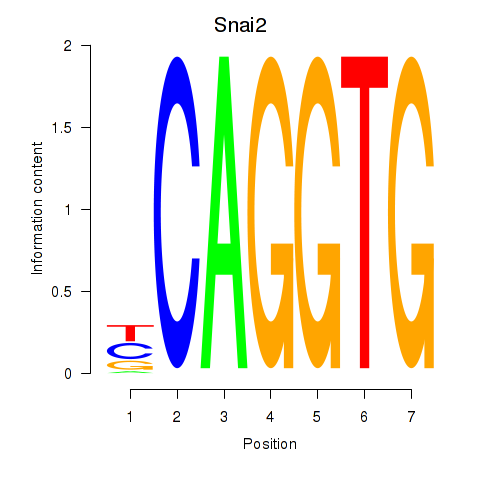
Results for Snai1_Zeb1_Snai2
Z-value: 4.28
Motif logo
Transcription factors associated with Snai1_Zeb1_Snai2
| Gene Symbol | Gene ID | Gene Info |
|---|---|---|
|
Snai1
|
ENSRNOG00000009594 | snail family transcriptional repressor 1 |
|
Zeb1
|
ENSRNOG00000017863 | zinc finger E-box binding homeobox 1 |
|
Snai2
|
ENSRNOG00000047699 | snail family transcriptional repressor 2 |
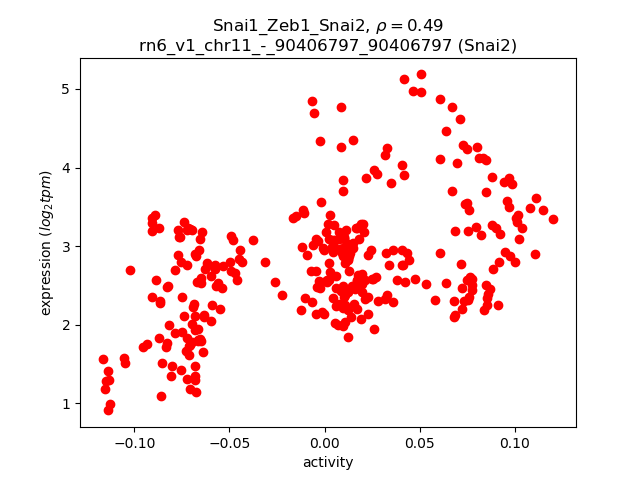
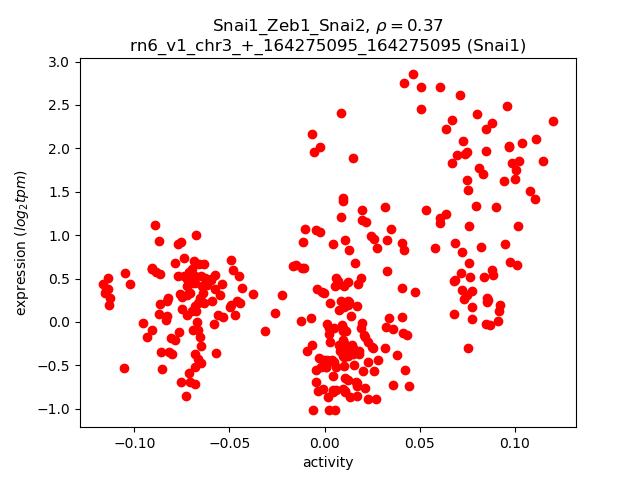
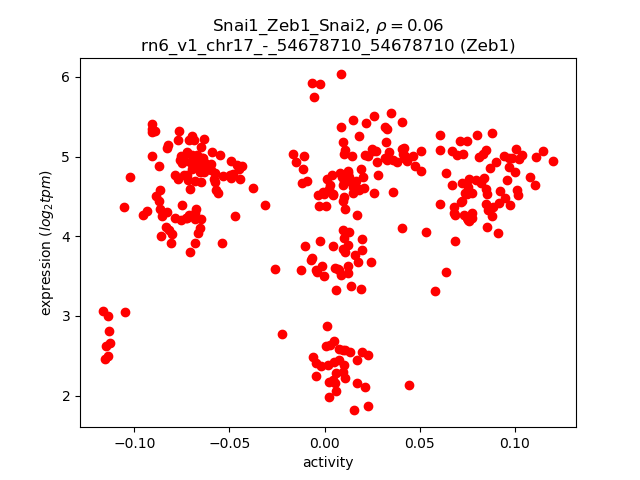
Activity-expression correlation:
| Gene | Promoter | Pearson corr. coef. | P-value | Plot |
|---|---|---|---|---|
| Snai2 | rn6_v1_chr11_-_90406797_90406797 | 0.49 | 8.4e-21 | Click! |
| Snai1 | rn6_v1_chr3_+_164275095_164275095 | 0.37 | 1.5e-11 | Click! |
| Zeb1 | rn6_v1_chr17_-_54678710_54678710 | 0.06 | 2.9e-01 | Click! |
Activity profile of Snai1_Zeb1_Snai2 motif
Sorted Z-values of Snai1_Zeb1_Snai2 motif
| Promoter | Log-likelihood | Transcript | Gene | Gene Info |
|---|---|---|---|---|
| chr10_+_56576428 | 280.46 |
ENSRNOT00000079237
ENSRNOT00000023291 |
Cldn7
|
claudin 7 |
| chr8_-_22336794 | 196.70 |
ENSRNOT00000066340
|
Ap1m2
|
adaptor-related protein complex 1, mu 2 subunit |
| chr2_-_30577218 | 190.07 |
ENSRNOT00000024674
|
Ocln
|
occludin |
| chr9_-_104350308 | 173.06 |
ENSRNOT00000033958
|
Slco4c1
|
solute carrier organic anion transporter family, member 4C1 |
| chr7_+_94130852 | 159.57 |
ENSRNOT00000011485
|
Mal2
|
mal, T-cell differentiation protein 2 |
| chr11_-_67037115 | 155.62 |
ENSRNOT00000003137
|
Ildr1
|
immunoglobulin-like domain containing receptor 1 |
| chr9_-_9985630 | 146.22 |
ENSRNOT00000071780
|
Crb3
|
crumbs 3, cell polarity complex component |
| chr3_+_164822111 | 139.16 |
ENSRNOT00000014568
|
Pard6b
|
par-6 family cell polarity regulator beta |
| chr1_-_87221826 | 133.98 |
ENSRNOT00000046611
ENSRNOT00000028006 |
Spint2
|
serine peptidase inhibitor, Kunitz type, 2 |
| chr10_-_31359699 | 132.59 |
ENSRNOT00000081280
|
Cyfip2
|
cytoplasmic FMR1 interacting protein 2 |
| chr19_+_38768467 | 130.27 |
ENSRNOT00000027346
|
Cdh1
|
cadherin 1 |
| chr3_+_119015412 | 121.41 |
ENSRNOT00000013605
|
Slc27a2
|
solute carrier family 27 member 2 |
| chr5_-_24631679 | 119.44 |
ENSRNOT00000010846
ENSRNOT00000067129 |
Esrp1
|
epithelial splicing regulatory protein 1 |
| chr1_-_54748763 | 118.80 |
ENSRNOT00000074549
|
LOC100911027
|
protein MAL2-like |
| chr2_-_30576591 | 116.35 |
ENSRNOT00000084667
|
Ocln
|
occludin |
| chr3_-_52212412 | 112.14 |
ENSRNOT00000007615
|
Galnt3
|
polypeptide N-acetylgalactosaminyltransferase 3 |
| chr6_-_96442682 | 108.09 |
ENSRNOT00000010923
|
Tmem30b
|
transmembrane protein 30B |
| chr13_+_34610684 | 107.79 |
ENSRNOT00000093019
ENSRNOT00000003280 |
Tfcp2l1
|
transcription factor CP2-like 1 |
| chr12_-_21832813 | 106.43 |
ENSRNOT00000075280
|
Cldn3
|
claudin 3 |
| chr2_-_187909394 | 106.10 |
ENSRNOT00000032355
|
Rab25
|
RAB25, member RAS oncogene family |
| chr6_-_99843245 | 101.00 |
ENSRNOT00000080270
|
Gpx2
|
glutathione peroxidase 2 |
| chr7_+_29435444 | 99.92 |
ENSRNOT00000008613
|
Slc5a8
|
solute carrier family 5 member 8 |
| chr5_-_159962218 | 97.85 |
ENSRNOT00000050729
|
Clcnkb
|
chloride voltage-gated channel Kb |
| chr3_+_161018511 | 96.76 |
ENSRNOT00000019804
ENSRNOT00000039664 |
Wfdc2
|
WAP four-disulfide core domain 2 |
| chr4_+_157836912 | 95.30 |
ENSRNOT00000067271
|
Scnn1a
|
sodium channel epithelial 1 alpha subunit |
| chr19_+_41710102 | 92.14 |
ENSRNOT00000021866
ENSRNOT00000079730 |
Marveld3
|
MARVEL domain containing 3 |
| chr1_+_214328071 | 92.02 |
ENSRNOT00000024725
|
Eps8l2
|
EPS8-like 2 |
| chr5_+_133896141 | 91.45 |
ENSRNOT00000011434
|
Pdzk1ip1
|
PDZK1 interacting protein 1 |
| chr3_+_111049118 | 90.91 |
ENSRNOT00000088870
|
Spint1
|
serine peptidase inhibitor, Kunitz type 1 |
| chr11_-_38274217 | 90.45 |
ENSRNOT00000002206
|
Ripk4
|
receptor-interacting serine-threonine kinase 4 |
| chr6_-_11298216 | 89.59 |
ENSRNOT00000021135
|
Epcam
|
epithelial cell adhesion molecule |
| chr13_+_111870121 | 88.57 |
ENSRNOT00000007333
|
Irf6
|
interferon regulatory factor 6 |
| chr2_+_188543137 | 87.72 |
ENSRNOT00000027850
|
Muc1
|
mucin 1, cell surface associated |
| chr1_-_213907144 | 85.79 |
ENSRNOT00000054874
|
Sigirr
|
single Ig and TIR domain containing |
| chr3_+_111049315 | 85.58 |
ENSRNOT00000017223
|
Spint1
|
serine peptidase inhibitor, Kunitz type 1 |
| chr11_-_28527890 | 84.24 |
ENSRNOT00000002138
|
Cldn8
|
claudin 8 |
| chr9_-_9985358 | 81.82 |
ENSRNOT00000080856
|
Crb3
|
crumbs 3, cell polarity complex component |
| chr2_-_211322719 | 79.03 |
ENSRNOT00000027493
|
RGD1310209
|
similar to KIAA1324 protein |
| chr10_+_86399827 | 78.23 |
ENSRNOT00000009299
|
Grb7
|
growth factor receptor bound protein 7 |
| chr5_+_137357674 | 77.88 |
ENSRNOT00000092813
|
RGD1305347
|
similar to RIKEN cDNA 2610528J11 |
| chr9_-_85445939 | 77.01 |
ENSRNOT00000072160
|
Ap1s3
|
adaptor-related protein complex 1, sigma 3 subunit |
| chr10_-_20818128 | 73.55 |
ENSRNOT00000011061
|
Wwc1
|
WW and C2 domain containing 1 |
| chr1_+_191704311 | 72.96 |
ENSRNOT00000024057
|
Scnn1g
|
sodium channel epithelial 1 gamma subunit |
| chr18_+_70427007 | 71.88 |
ENSRNOT00000087959
ENSRNOT00000019512 |
Myo5b
|
myosin Vb |
| chr6_-_132608600 | 71.00 |
ENSRNOT00000015855
|
Degs2
|
delta(4)-desaturase, sphingolipid 2 |
| chr6_-_138250089 | 69.90 |
ENSRNOT00000048378
|
Ighm
|
immunoglobulin heavy constant mu |
| chr14_+_16491573 | 69.89 |
ENSRNOT00000002995
|
Sowahb
|
sosondowah ankyrin repeat domain family member B |
| chr5_-_159962676 | 69.28 |
ENSRNOT00000013550
|
Clcnkb
|
chloride voltage-gated channel Kb |
| chr1_+_64046377 | 69.25 |
ENSRNOT00000085010
|
Tmc4
|
transmembrane channel-like 4 |
| chr6_-_50846965 | 69.00 |
ENSRNOT00000087300
|
Slc26a4
|
solute carrier family 26 member 4 |
| chr17_-_417480 | 68.85 |
ENSRNOT00000023685
|
Fbp1
|
fructose-bisphosphatase 1 |
| chr13_-_70625842 | 68.15 |
ENSRNOT00000092499
|
Lamc2
|
laminin subunit gamma 2 |
| chr3_-_81282157 | 68.11 |
ENSRNOT00000051258
|
Large2
|
LARGE xylosyl- and glucuronyltransferase 2 |
| chr16_-_75637789 | 67.85 |
ENSRNOT00000058029
|
Defb4
|
defensin beta 4 |
| chrX_+_33443186 | 67.64 |
ENSRNOT00000005622
|
S100g
|
S100 calcium binding protein G |
| chr13_-_70626252 | 66.23 |
ENSRNOT00000036947
|
Lamc2
|
laminin subunit gamma 2 |
| chr5_+_151741817 | 66.14 |
ENSRNOT00000081318
|
Kdf1
|
keratinocyte differentiation factor 1 |
| chr3_-_48372583 | 65.17 |
ENSRNOT00000040482
ENSRNOT00000077788 ENSRNOT00000085426 |
Dpp4
|
dipeptidylpeptidase 4 |
| chr10_-_31419235 | 64.79 |
ENSRNOT00000059496
|
Cyfip2
|
cytoplasmic FMR1 interacting protein 2 |
| chr8_+_117068582 | 63.98 |
ENSRNOT00000073559
|
Amt
|
aminomethyltransferase |
| chr12_+_2180150 | 63.87 |
ENSRNOT00000001322
|
Stxbp2
|
syntaxin binding protein 2 |
| chr10_+_13000090 | 63.69 |
ENSRNOT00000004845
|
Cldn6
|
claudin 6 |
| chr20_+_4593389 | 63.23 |
ENSRNOT00000001174
|
Slc44a4
|
solute carrier family 44, member 4 |
| chr7_+_76059386 | 61.83 |
ENSRNOT00000009337
|
Grhl2
|
grainyhead-like transcription factor 2 |
| chr10_+_91254058 | 59.76 |
ENSRNOT00000087218
ENSRNOT00000065373 |
Fmnl1
|
formin-like 1 |
| chr13_-_48848864 | 58.81 |
ENSRNOT00000077857
ENSRNOT00000068003 |
Mfsd4
|
major facilitator superfamily domain containing 4 |
| chr1_+_221673590 | 58.14 |
ENSRNOT00000038016
|
Cdc42bpg
|
CDC42 binding protein kinase gamma |
| chr10_+_47961056 | 57.89 |
ENSRNOT00000027312
|
Fam83g
|
family with sequence similarity 83, member G |
| chr20_+_48335540 | 57.47 |
ENSRNOT00000000352
|
Cd24
|
CD24 molecule |
| chr6_-_55001464 | 57.19 |
ENSRNOT00000006618
|
Ahr
|
aryl hydrocarbon receptor |
| chr7_-_143603803 | 57.10 |
ENSRNOT00000038480
|
Krt8
|
keratin 8 |
| chr17_+_15814132 | 55.42 |
ENSRNOT00000032997
|
Susd3
|
sushi domain containing 3 |
| chr10_+_71159869 | 54.85 |
ENSRNOT00000075977
ENSRNOT00000047427 |
Hnf1b
|
HNF1 homeobox B |
| chr14_-_18839420 | 54.76 |
ENSRNOT00000034090
|
Cxcl3
|
chemokine (C-X-C motif) ligand 3 |
| chr8_+_54925607 | 54.11 |
ENSRNOT00000059210
|
Plet1
|
placenta expressed transcript 1 |
| chr7_-_117070936 | 53.58 |
ENSRNOT00000048446
|
Fam83h
|
family with sequence similarity 83, member H |
| chr10_+_10644572 | 53.28 |
ENSRNOT00000004026
|
Ppl
|
periplakin |
| chr17_-_8607494 | 53.06 |
ENSRNOT00000016138
|
Slc25a48
|
solute carrier family 25, member 48 |
| chr3_-_138462063 | 52.25 |
ENSRNOT00000065553
|
Ovol2
|
ovo-like zinc finger 2 |
| chr14_-_60276794 | 52.04 |
ENSRNOT00000048509
|
Slc34a2
|
solute carrier family 34 member 2 |
| chr5_-_171648327 | 52.04 |
ENSRNOT00000082847
|
Arhgef16
|
Rho guanine nucleotide exchange factor 16 |
| chr9_+_81689802 | 51.37 |
ENSRNOT00000021432
|
Vil1
|
villin 1 |
| chr3_-_6626284 | 51.27 |
ENSRNOT00000012494
|
Fcnb
|
ficolin B |
| chr7_+_130296897 | 50.72 |
ENSRNOT00000044854
|
Adm2
|
adrenomedullin 2 |
| chrX_+_71272042 | 50.46 |
ENSRNOT00000076034
ENSRNOT00000076816 |
Gjb1
|
gap junction protein, beta 1 |
| chr11_+_71211768 | 49.76 |
ENSRNOT00000079753
|
LOC100910650
|
uncharacterized LOC100910650 |
| chr2_+_209097927 | 49.29 |
ENSRNOT00000023807
|
Dennd2d
|
DENN domain containing 2D |
| chr2_-_192671059 | 49.26 |
ENSRNOT00000012174
|
Sprr1a
|
small proline-rich protein 1A |
| chr7_-_139394166 | 49.21 |
ENSRNOT00000082429
|
Vdr
|
vitamin D (1,25- dihydroxyvitamin D3) receptor |
| chr7_+_143060597 | 49.19 |
ENSRNOT00000087481
|
Krt7
|
keratin 7 |
| chr15_-_37383277 | 49.00 |
ENSRNOT00000011711
|
Gjb2
|
gap junction protein, beta 2 |
| chr6_+_33885495 | 48.98 |
ENSRNOT00000086633
|
Sdc1
|
syndecan 1 |
| chr2_-_238468435 | 48.59 |
ENSRNOT00000055537
|
LOC102556447
|
rho guanine nucleotide exchange factor 38-like |
| chr4_+_84478839 | 48.49 |
ENSRNOT00000012668
|
Prr15
|
proline rich 15 |
| chr1_-_189199376 | 48.34 |
ENSRNOT00000021027
|
Umod
|
uromodulin |
| chr11_-_70499200 | 47.20 |
ENSRNOT00000002439
|
Slc12a8
|
solute carrier family 12, member 8 |
| chr10_+_14122878 | 47.06 |
ENSRNOT00000052008
|
Hs3st6
|
heparan sulfate-glucosamine 3-sulfotransferase 6 |
| chr11_+_50781127 | 47.04 |
ENSRNOT00000002738
|
Alcam
|
activated leukocyte cell adhesion molecule |
| chr10_-_82887497 | 46.48 |
ENSRNOT00000005644
|
Itga3
|
integrin subunit alpha 3 |
| chr6_+_99356509 | 46.13 |
ENSRNOT00000008416
|
Akap5
|
A-kinase anchoring protein 5 |
| chr7_-_107634287 | 46.07 |
ENSRNOT00000093672
ENSRNOT00000087116 |
Sla
|
src-like adaptor |
| chr5_-_79008363 | 45.17 |
ENSRNOT00000010040
|
Kif12
|
kinesin family member 12 |
| chr3_-_93216495 | 44.97 |
ENSRNOT00000010580
|
Ehf
|
ets homologous factor |
| chr5_-_171648563 | 44.82 |
ENSRNOT00000072786
|
Arhgef16
|
Rho guanine nucleotide exchange factor 16 |
| chr7_-_12707922 | 44.78 |
ENSRNOT00000013857
|
Misp
|
mitotic spindle positioning |
| chr3_-_44342355 | 44.71 |
ENSRNOT00000059280
|
Acvr1c
|
activin A receptor type 1C |
| chr4_-_85386231 | 44.54 |
ENSRNOT00000015316
|
Inmt
|
indolethylamine N-methyltransferase |
| chr11_-_38088753 | 44.39 |
ENSRNOT00000002713
|
Tmprss2
|
transmembrane protease, serine 2 |
| chr17_+_32904119 | 44.38 |
ENSRNOT00000059854
|
Serpinb1a
|
serpin family B member 1A |
| chr7_-_101140308 | 44.01 |
ENSRNOT00000006279
|
Fam84b
|
family with sequence similarity 84, member B |
| chr10_+_109904259 | 43.26 |
ENSRNOT00000073886
|
Rac3
|
ras-related C3 botulinum toxin substrate 3 (rho family, small GTP binding protein Rac3) |
| chr12_+_16912249 | 43.14 |
ENSRNOT00000085936
|
Tmem184a
|
transmembrane protein 184A |
| chr6_-_138508753 | 43.13 |
ENSRNOT00000006888
|
Ighm
|
immunoglobulin heavy constant mu |
| chr4_-_68597586 | 42.73 |
ENSRNOT00000015921
|
RGD1563986
|
similar to RIKEN cDNA E330009J07 gene |
| chr6_+_27975417 | 42.25 |
ENSRNOT00000077830
|
Dtnb
|
dystrobrevin, beta |
| chr13_+_52645257 | 42.20 |
ENSRNOT00000012801
|
Lad1
|
ladinin 1 |
| chr1_+_32199810 | 42.02 |
ENSRNOT00000036714
|
Slc6a19
|
solute carrier family 6 member 19 |
| chr9_-_14706557 | 42.00 |
ENSRNOT00000048975
|
Treml4
|
triggering receptor expressed on myeloid cells-like 4 |
| chr1_-_89399039 | 41.62 |
ENSRNOT00000028585
ENSRNOT00000044678 |
Lsr
|
lipolysis stimulated lipoprotein receptor |
| chr10_-_88060561 | 41.53 |
ENSRNOT00000019133
|
Krt19
|
keratin 19 |
| chr5_-_158439078 | 41.24 |
ENSRNOT00000025517
|
Klhdc7a
|
kelch domain containing 7A |
| chr7_-_51353068 | 41.09 |
ENSRNOT00000008222
|
Pawr
|
pro-apoptotic WT1 regulator |
| chr6_-_39363367 | 41.05 |
ENSRNOT00000088687
ENSRNOT00000065531 |
Fam84a
|
family with sequence similarity 84, member A |
| chr6_-_26486695 | 40.84 |
ENSRNOT00000073236
|
Krtcap3
|
keratinocyte associated protein 3 |
| chrX_+_120624518 | 40.53 |
ENSRNOT00000007967
|
Slc6a14
|
solute carrier family 6 member 14 |
| chr5_-_79874671 | 40.42 |
ENSRNOT00000084563
|
Tnc
|
tenascin C |
| chr9_+_4107246 | 40.35 |
ENSRNOT00000078212
|
AABR07066160.1
|
|
| chr8_-_76579099 | 40.34 |
ENSRNOT00000088628
|
Fam81a
|
family with sequence similarity 81, member A |
| chr1_+_277689729 | 40.04 |
ENSRNOT00000051834
|
Vwa2
|
von Willebrand factor A domain containing 2 |
| chr9_-_100306194 | 40.00 |
ENSRNOT00000087584
|
RGD1563692
|
similar to hypothetical protein FLJ22671 |
| chr1_-_227441442 | 39.99 |
ENSRNOT00000028433
|
Ms4a1
|
membrane spanning 4-domains A1 |
| chr2_+_251983339 | 39.67 |
ENSRNOT00000020230
|
Mcoln3
|
mucolipin 3 |
| chr19_-_11341863 | 39.64 |
ENSRNOT00000025694
|
Mt4
|
metallothionein 4 |
| chr20_+_9743269 | 39.29 |
ENSRNOT00000001533
ENSRNOT00000083505 |
Abcg1
|
ATP binding cassette subfamily G member 1 |
| chr13_+_52553775 | 38.74 |
ENSRNOT00000011991
|
Csrp1
|
cysteine and glycine-rich protein 1 |
| chr1_+_64114721 | 38.66 |
ENSRNOT00000080466
|
Tmc4
|
transmembrane channel-like 4 |
| chr5_-_126080698 | 38.59 |
ENSRNOT00000008739
|
Bsnd
|
barttin CLCNK type accessory beta subunit |
| chr10_-_105116916 | 38.53 |
ENSRNOT00000012373
|
Evpl
|
envoplakin |
| chr16_-_37495758 | 38.43 |
ENSRNOT00000014229
|
Hpgd
|
hydroxyprostaglandin dehydrogenase 15 (NAD) |
| chr1_+_83933942 | 38.41 |
ENSRNOT00000068690
|
Cyp2f4
|
cytochrome P450, family 2, subfamily f, polypeptide 4 |
| chr7_-_3010350 | 38.37 |
ENSRNOT00000006796
|
Erbb3
|
erb-b2 receptor tyrosine kinase 3 |
| chr20_+_9586075 | 38.35 |
ENSRNOT00000001527
ENSRNOT00000079509 |
Glp1r
|
glucagon-like peptide 1 receptor |
| chr15_-_42947656 | 38.35 |
ENSRNOT00000030007
|
Ptk2b
|
protein tyrosine kinase 2 beta |
| chr10_-_65424802 | 38.33 |
ENSRNOT00000018468
|
Traf4
|
Tnf receptor associated factor 4 |
| chr14_-_35149608 | 38.19 |
ENSRNOT00000003050
ENSRNOT00000090654 |
Kit
|
KIT proto-oncogene receptor tyrosine kinase |
| chr7_+_99158119 | 38.16 |
ENSRNOT00000044127
|
LOC108348266
|
cytochrome P450 2B1 |
| chr10_-_19164505 | 38.14 |
ENSRNOT00000009058
|
Foxi1
|
forkhead box I1 |
| chr4_+_65801505 | 37.83 |
ENSRNOT00000018331
|
Tmem213
|
transmembrane protein 213 |
| chr5_-_172769421 | 37.77 |
ENSRNOT00000021285
|
Prkcz
|
protein kinase C, zeta |
| chr2_-_211207465 | 37.62 |
ENSRNOT00000027263
|
Celsr2
|
cadherin, EGF LAG seven-pass G-type receptor 2 |
| chr4_+_98457810 | 37.44 |
ENSRNOT00000074175
|
AABR07060872.1
|
|
| chr5_+_29538380 | 37.40 |
ENSRNOT00000010845
|
Calb1
|
calbindin 1 |
| chr11_-_38103290 | 37.33 |
ENSRNOT00000066413
|
Tmprss2
|
transmembrane protease, serine 2 |
| chr5_-_75005567 | 36.95 |
ENSRNOT00000016068
|
LOC685849
|
hypothetical protein LOC685849 |
| chr6_+_27975849 | 36.78 |
ENSRNOT00000060810
|
Dtnb
|
dystrobrevin, beta |
| chr1_-_280233929 | 36.72 |
ENSRNOT00000085778
|
Shtn1
|
shootin 1 |
| chrX_+_70596901 | 36.63 |
ENSRNOT00000088114
|
Dlg3
|
discs large MAGUK scaffold protein 3 |
| chr1_+_242959488 | 36.59 |
ENSRNOT00000015668
|
Dock8
|
dedicator of cytokinesis 8 |
| chr9_-_82336806 | 36.27 |
ENSRNOT00000024667
|
Slc23a3
|
solute carrier family 23, member 3 |
| chr1_-_198128857 | 36.19 |
ENSRNOT00000026496
|
Coro1a
|
coronin 1A |
| chr1_-_22206505 | 36.12 |
ENSRNOT00000061234
|
Moxd1
|
monooxygenase, DBH-like 1 |
| chr13_+_89755845 | 36.10 |
ENSRNOT00000005550
|
Nectin4
|
nectin cell adhesion molecule 4 |
| chr7_-_143317674 | 35.94 |
ENSRNOT00000080010
|
Krt5
|
keratin 5 |
| chr4_+_106323089 | 35.83 |
ENSRNOT00000091402
|
AABR07061134.1
|
|
| chr14_-_82975263 | 35.77 |
ENSRNOT00000024165
|
Slc5a1
|
solute carrier family 5 member 1 |
| chr16_+_6078122 | 35.72 |
ENSRNOT00000021407
|
Chdh
|
choline dehydrogenase |
| chr8_+_91070073 | 35.61 |
ENSRNOT00000012904
|
Sh3bgrl2
|
SH3 domain binding glutamate-rich protein like 2 |
| chr14_-_80973456 | 35.60 |
ENSRNOT00000013257
|
Hgfac
|
HGF activator |
| chr10_-_90410569 | 35.16 |
ENSRNOT00000036112
|
Itga2b
|
integrin subunit alpha 2b |
| chr7_+_143629455 | 35.07 |
ENSRNOT00000073951
|
Krt18
|
keratin 18 |
| chrX_+_29430831 | 35.02 |
ENSRNOT00000068337
ENSRNOT00000087621 |
Egfl6
|
EGF-like-domain, multiple 6 |
| chr5_+_149077412 | 34.97 |
ENSRNOT00000014666
|
Matn1
|
matrilin 1, cartilage matrix protein |
| chr10_+_10555337 | 34.88 |
ENSRNOT00000032495
|
RGD1565166
|
similar to MGC45438 protein |
| chr3_+_79918969 | 34.71 |
ENSRNOT00000016306
|
Spi1
|
Spi-1 proto-oncogene |
| chr16_-_18757918 | 34.65 |
ENSRNOT00000084172
|
Sftpd
|
surfactant protein D |
| chr1_+_235166718 | 34.47 |
ENSRNOT00000020201
|
Gna14
|
G protein subunit alpha 14 |
| chr2_-_195935878 | 34.42 |
ENSRNOT00000028440
|
Cgn
|
cingulin |
| chr5_-_159946446 | 34.19 |
ENSRNOT00000089184
|
Clcnka
|
chloride voltage-gated channel Ka |
| chr11_-_37993204 | 34.10 |
ENSRNOT00000077050
ENSRNOT00000091614 ENSRNOT00000002683 |
Fam3b
|
family with sequence similarity 3, member B |
| chr7_+_99142450 | 33.98 |
ENSRNOT00000079036
ENSRNOT00000091923 |
LOC108348266
|
cytochrome P450 2B1 |
| chr20_-_22004209 | 33.97 |
ENSRNOT00000086250
ENSRNOT00000068778 |
Rtkn2
|
rhotekin 2 |
| chr10_+_103713045 | 33.83 |
ENSRNOT00000004351
|
Slc9a3r1
|
SLC9A3 regulator 1 |
| chr17_-_84488480 | 33.45 |
ENSRNOT00000000158
ENSRNOT00000075983 |
Nebl
|
nebulette |
| chr9_-_19476646 | 33.25 |
ENSRNOT00000013703
|
Enpp5
|
ectonucleotide pyrophosphatase/phosphodiesterase 5 |
| chr5_+_137257637 | 33.21 |
ENSRNOT00000093001
|
Elovl1
|
ELOVL fatty acid elongase 1 |
| chr8_-_32280869 | 33.16 |
ENSRNOT00000009139
|
St14
|
suppression of tumorigenicity 14 |
| chr3_+_16413080 | 33.14 |
ENSRNOT00000040386
|
LOC100912707
|
Ig kappa chain V19-17-like |
| chr19_+_784618 | 33.13 |
ENSRNOT00000014749
|
Cmtm4
|
CKLF-like MARVEL transmembrane domain containing 4 |
| chr7_+_114724610 | 33.08 |
ENSRNOT00000014541
|
Dennd3
|
DENN domain containing 3 |
| chr10_-_65692016 | 32.99 |
ENSRNOT00000085074
ENSRNOT00000038690 |
Slc13a2
|
solute carrier family 13 member 2 |
| chr8_-_119012671 | 32.94 |
ENSRNOT00000028435
|
Pth1r
|
parathyroid hormone 1 receptor |
| chr2_-_80408672 | 32.79 |
ENSRNOT00000067638
|
Fam105a
|
family with sequence similarity 105, member A |
| chr4_+_102489916 | 32.72 |
ENSRNOT00000082031
|
AABR07061001.1
|
|
| chr4_-_56114254 | 32.63 |
ENSRNOT00000010673
|
Lrrc4
|
leucine rich repeat containing 4 |
| chr8_+_57886168 | 32.53 |
ENSRNOT00000039336
|
Exph5
|
exophilin 5 |
| chr11_+_61662270 | 32.52 |
ENSRNOT00000079521
|
Zdhhc23
|
zinc finger, DHHC-type containing 23 |
| chr4_+_116968000 | 32.47 |
ENSRNOT00000020786
|
Emx1
|
empty spiracles homeobox 1 |
| chr16_-_18766174 | 32.45 |
ENSRNOT00000084813
|
Sftpd
|
surfactant protein D |
| chr1_+_201429771 | 32.42 |
ENSRNOT00000027836
|
Plekha1
|
pleckstrin homology domain containing A1 |
| chr1_+_91363492 | 32.34 |
ENSRNOT00000014517
|
Cebpa
|
CCAAT/enhancer binding protein alpha |
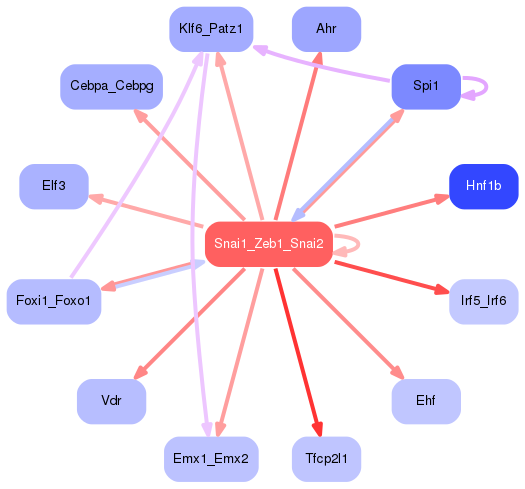
Network of associatons between targets according to the STRING database.

First level regulatory network of Snai1_Zeb1_Snai2
Gene Ontology Analysis
Gene overrepresentation in biological process category:
| Log-likelihood per target | Total log-likelihood | Term | Description |
|---|---|---|---|
| 57.2 | 229.0 | GO:0060671 | epithelial cell differentiation involved in embryonic placenta development(GO:0060671) epithelial cell morphogenesis involved in placental branching(GO:0060672) |
| 43.3 | 129.9 | GO:0097089 | methyl-branched fatty acid metabolic process(GO:0097089) |
| 34.7 | 312.7 | GO:0001766 | membrane raft polarization(GO:0001766) membrane raft distribution(GO:0031580) |
| 34.5 | 137.9 | GO:0060066 | oviduct development(GO:0060066) |
| 33.9 | 101.6 | GO:0009609 | response to symbiotic bacterium(GO:0009609) |
| 32.2 | 418.6 | GO:0016338 | calcium-independent cell-cell adhesion via plasma membrane cell-adhesion molecules(GO:0016338) |
| 30.4 | 304.3 | GO:0070673 | response to interleukin-18(GO:0070673) |
| 29.2 | 87.6 | GO:0006667 | sphinganine metabolic process(GO:0006667) |
| 28.6 | 85.8 | GO:0045079 | negative regulation of chemokine biosynthetic process(GO:0045079) |
| 25.7 | 128.6 | GO:0050828 | regulation of liquid surface tension(GO:0050828) |
| 23.7 | 189.7 | GO:0051388 | positive regulation of neurotrophin TRK receptor signaling pathway(GO:0051388) |
| 23.3 | 69.9 | GO:0061296 | mesonephros morphogenesis(GO:0061206) mesonephric nephron development(GO:0061215) mesonephric nephron morphogenesis(GO:0061228) mesenchymal stem cell maintenance involved in mesonephric nephron morphogenesis(GO:0061235) regulation of mesenchymal cell apoptotic process involved in mesonephric nephron morphogenesis(GO:0061295) negative regulation of mesenchymal cell apoptotic process involved in mesonephric nephron morphogenesis(GO:0061296) mesenchymal cell apoptotic process involved in mesonephric nephron morphogenesis(GO:1901146) |
| 23.1 | 69.2 | GO:0061744 | motor behavior(GO:0061744) |
| 22.6 | 113.2 | GO:0060327 | cytoplasmic actin-based contraction involved in cell motility(GO:0060327) |
| 22.4 | 112.1 | GO:0018242 | protein O-linked glycosylation via serine(GO:0018242) protein O-linked glycosylation via threonine(GO:0018243) |
| 22.0 | 88.0 | GO:0072139 | glomerular parietal epithelial cell differentiation(GO:0072139) positive regulation of nephron tubule epithelial cell differentiation(GO:2000768) |
| 21.6 | 86.6 | GO:2000048 | negative regulation of cell-cell adhesion mediated by cadherin(GO:2000048) |
| 21.5 | 64.4 | GO:0042939 | glutathione transport(GO:0034635) tripeptide transport(GO:0042939) |
| 21.2 | 169.3 | GO:0030321 | transepithelial chloride transport(GO:0030321) |
| 21.1 | 21.1 | GO:1904673 | regulation of mesenchymal cell apoptotic process involved in nephron morphogenesis(GO:0072039) negative regulation of mesenchymal cell apoptotic process involved in nephron morphogenesis(GO:0072040) mesenchymal cell apoptotic process involved in nephron morphogenesis(GO:1901145) negative regulation of somatic stem cell population maintenance(GO:1904673) |
| 19.5 | 38.9 | GO:0099545 | trans-synaptic signaling by trans-synaptic complex(GO:0099545) |
| 19.4 | 38.9 | GO:0002378 | immunoglobulin biosynthetic process(GO:0002378) |
| 18.8 | 131.9 | GO:0072025 | distal convoluted tubule development(GO:0072025) metanephric distal convoluted tubule development(GO:0072221) |
| 18.3 | 54.9 | GO:0072714 | response to selenite ion(GO:0072714) |
| 17.2 | 68.8 | GO:0046351 | disaccharide biosynthetic process(GO:0046351) |
| 17.2 | 68.7 | GO:0036394 | amylase secretion(GO:0036394) |
| 17.0 | 51.1 | GO:0072053 | renal inner medulla development(GO:0072053) |
| 16.8 | 50.5 | GO:1905218 | cellular response to astaxanthin(GO:1905218) |
| 16.7 | 217.3 | GO:0060670 | branching involved in labyrinthine layer morphogenesis(GO:0060670) |
| 16.0 | 64.0 | GO:0019464 | glycine catabolic process(GO:0006546) glycine decarboxylation via glycine cleavage system(GO:0019464) |
| 15.7 | 94.2 | GO:0032439 | endosome localization(GO:0032439) |
| 15.7 | 47.0 | GO:0042197 | chlorinated hydrocarbon metabolic process(GO:0042196) halogenated hydrocarbon metabolic process(GO:0042197) |
| 15.6 | 62.4 | GO:0038183 | bile acid signaling pathway(GO:0038183) |
| 15.5 | 62.0 | GO:0040009 | regulation of growth rate(GO:0040009) |
| 15.2 | 60.8 | GO:2000664 | positive regulation of interleukin-5 secretion(GO:2000664) |
| 14.9 | 44.7 | GO:0007181 | transforming growth factor beta receptor complex assembly(GO:0007181) |
| 14.7 | 58.6 | GO:0060214 | endocardium formation(GO:0060214) |
| 14.5 | 43.5 | GO:0000738 | DNA catabolic process, exonucleolytic(GO:0000738) |
| 14.4 | 57.6 | GO:0018992 | germ-line sex determination(GO:0018992) |
| 14.2 | 42.7 | GO:2000611 | basement membrane disassembly(GO:0034769) positive regulation of thyroid hormone generation(GO:2000611) |
| 13.9 | 83.4 | GO:0035331 | negative regulation of hippo signaling(GO:0035331) |
| 13.7 | 41.1 | GO:1903238 | positive regulation of leukocyte tethering or rolling(GO:1903238) |
| 13.7 | 54.7 | GO:0002752 | cell surface pattern recognition receptor signaling pathway(GO:0002752) |
| 13.6 | 95.5 | GO:0044341 | sodium-dependent phosphate transport(GO:0044341) |
| 13.5 | 40.6 | GO:0042125 | protein glycosylation at cell surface(GO:0033575) protein galactosylation at cell surface(GO:0033580) protein galactosylation(GO:0042125) |
| 13.5 | 54.0 | GO:0000050 | urea cycle(GO:0000050) |
| 13.3 | 40.0 | GO:0007161 | calcium-independent cell-matrix adhesion(GO:0007161) |
| 13.2 | 66.1 | GO:0000066 | mitochondrial ornithine transport(GO:0000066) |
| 13.1 | 65.7 | GO:0061218 | negative regulation of mesonephros development(GO:0061218) negative regulation of branching involved in ureteric bud morphogenesis(GO:0090191) |
| 12.9 | 38.8 | GO:0071529 | cementum mineralization(GO:0071529) |
| 12.9 | 38.6 | GO:0042412 | taurine biosynthetic process(GO:0042412) |
| 12.9 | 51.5 | GO:1903553 | positive regulation of extracellular exosome assembly(GO:1903553) |
| 12.8 | 38.4 | GO:0060974 | cell migration involved in heart formation(GO:0060974) |
| 12.8 | 38.3 | GO:2000537 | regulation of cGMP-mediated signaling(GO:0010752) regulation of B cell chemotaxis(GO:2000537) positive regulation of B cell chemotaxis(GO:2000538) |
| 12.8 | 76.5 | GO:0010481 | epidermal cell division(GO:0010481) regulation of epidermal cell division(GO:0010482) |
| 12.7 | 38.2 | GO:1904694 | negative regulation of vascular smooth muscle contraction(GO:1904694) |
| 12.6 | 63.2 | GO:0008292 | acetylcholine biosynthetic process(GO:0008292) acetate ester biosynthetic process(GO:1900620) |
| 12.5 | 112.1 | GO:1902414 | protein localization to cell junction(GO:1902414) |
| 12.0 | 36.1 | GO:0046333 | octopamine biosynthetic process(GO:0006589) octopamine metabolic process(GO:0046333) |
| 11.8 | 47.1 | GO:0072679 | thymocyte migration(GO:0072679) |
| 11.7 | 23.4 | GO:0070602 | regulation of centromeric sister chromatid cohesion(GO:0070602) |
| 11.5 | 34.6 | GO:0071691 | cardiac muscle thin filament assembly(GO:0071691) |
| 11.4 | 34.3 | GO:0032759 | TRAIL production(GO:0032639) regulation of TRAIL production(GO:0032679) positive regulation of TRAIL production(GO:0032759) |
| 11.4 | 34.1 | GO:0042539 | hypotonic salinity response(GO:0042539) cellular hypotonic salinity response(GO:0071477) |
| 11.3 | 11.3 | GO:0070650 | actin filament bundle distribution(GO:0070650) |
| 11.2 | 33.7 | GO:0070904 | L-ascorbic acid transport(GO:0015882) transepithelial L-ascorbic acid transport(GO:0070904) |
| 11.2 | 145.4 | GO:0071377 | cellular response to glucagon stimulus(GO:0071377) |
| 11.2 | 44.7 | GO:0060447 | bud outgrowth involved in lung branching(GO:0060447) |
| 11.2 | 44.6 | GO:0033277 | abortive mitotic cell cycle(GO:0033277) |
| 11.1 | 33.3 | GO:0007056 | spindle assembly involved in female meiosis(GO:0007056) |
| 11.1 | 33.2 | GO:0010133 | proline catabolic process to glutamate(GO:0010133) |
| 10.9 | 21.7 | GO:0002572 | pro-T cell differentiation(GO:0002572) |
| 10.8 | 32.5 | GO:0044240 | multicellular organism lipid catabolic process(GO:0044240) |
| 10.8 | 32.4 | GO:0015680 | intracellular copper ion transport(GO:0015680) |
| 10.7 | 96.7 | GO:1900029 | positive regulation of ruffle assembly(GO:1900029) |
| 10.6 | 42.3 | GO:0006015 | 5-phosphoribose 1-diphosphate biosynthetic process(GO:0006015) 5-phosphoribose 1-diphosphate metabolic process(GO:0046391) |
| 10.5 | 52.6 | GO:0033326 | cerebrospinal fluid secretion(GO:0033326) |
| 10.4 | 124.5 | GO:1902166 | negative regulation of intrinsic apoptotic signaling pathway in response to DNA damage by p53 class mediator(GO:1902166) |
| 10.3 | 30.8 | GO:0038163 | thrombopoietin-mediated signaling pathway(GO:0038163) |
| 10.0 | 30.1 | GO:1900368 | regulation of RNA interference(GO:1900368) |
| 9.9 | 29.7 | GO:0035408 | histone H3-T6 phosphorylation(GO:0035408) |
| 9.9 | 118.3 | GO:0070863 | positive regulation of protein exit from endoplasmic reticulum(GO:0070863) |
| 9.8 | 39.3 | GO:0034436 | glycoprotein transport(GO:0034436) |
| 9.6 | 28.9 | GO:0071461 | cellular response to redox state(GO:0071461) |
| 9.6 | 28.8 | GO:0060369 | positive regulation of Fc receptor mediated stimulatory signaling pathway(GO:0060369) |
| 9.6 | 57.4 | GO:0032762 | mast cell cytokine production(GO:0032762) |
| 9.5 | 19.0 | GO:0060300 | regulation of cytokine activity(GO:0060300) |
| 9.4 | 18.9 | GO:2001199 | negative regulation of dendritic cell differentiation(GO:2001199) |
| 9.4 | 113.2 | GO:0051014 | actin filament severing(GO:0051014) |
| 9.4 | 18.8 | GO:1904204 | regulation of skeletal muscle hypertrophy(GO:1904204) |
| 9.2 | 18.5 | GO:0060800 | regulation of cell differentiation involved in embryonic placenta development(GO:0060800) |
| 9.2 | 36.8 | GO:0045347 | negative regulation of MHC class II biosynthetic process(GO:0045347) |
| 9.2 | 36.7 | GO:0006565 | L-serine catabolic process(GO:0006565) |
| 9.1 | 9.1 | GO:0060648 | mammary gland bud morphogenesis(GO:0060648) |
| 9.1 | 27.3 | GO:0001698 | gastrin-induced gastric acid secretion(GO:0001698) |
| 9.1 | 27.2 | GO:1903596 | regulation of gap junction assembly(GO:1903596) |
| 9.1 | 54.3 | GO:0035963 | cellular response to interleukin-13(GO:0035963) |
| 8.9 | 35.8 | GO:0001951 | intestinal D-glucose absorption(GO:0001951) |
| 8.8 | 44.2 | GO:0090168 | Golgi reassembly(GO:0090168) |
| 8.8 | 8.8 | GO:2000662 | interleukin-5 secretion(GO:0072603) regulation of interleukin-5 secretion(GO:2000662) |
| 8.8 | 26.3 | GO:1901740 | negative regulation of myoblast fusion(GO:1901740) |
| 8.8 | 17.5 | GO:0002581 | negative regulation of antigen processing and presentation of peptide or polysaccharide antigen via MHC class II(GO:0002581) |
| 8.8 | 70.1 | GO:0015705 | iodide transport(GO:0015705) |
| 8.7 | 26.0 | GO:0015864 | pyrimidine nucleoside transport(GO:0015864) |
| 8.6 | 60.3 | GO:0070782 | phosphatidylserine exposure on apoptotic cell surface(GO:0070782) |
| 8.6 | 51.5 | GO:0002457 | T cell antigen processing and presentation(GO:0002457) |
| 8.4 | 92.3 | GO:0046598 | positive regulation of viral entry into host cell(GO:0046598) |
| 8.3 | 100.2 | GO:0007028 | cytoplasm organization(GO:0007028) |
| 8.3 | 16.6 | GO:0008592 | regulation of Toll signaling pathway(GO:0008592) negative regulation of Toll signaling pathway(GO:0045751) |
| 8.3 | 24.8 | GO:0042938 | dipeptide transport(GO:0042938) |
| 8.2 | 123.4 | GO:0097284 | hepatocyte apoptotic process(GO:0097284) |
| 8.2 | 8.2 | GO:0006212 | uracil catabolic process(GO:0006212) |
| 8.2 | 16.4 | GO:2000830 | vacuolar phosphate transport(GO:0007037) positive regulation of parathyroid hormone secretion(GO:2000830) |
| 8.2 | 32.8 | GO:0032911 | negative regulation of transforming growth factor beta1 production(GO:0032911) |
| 8.1 | 32.4 | GO:0021564 | vagus nerve development(GO:0021564) |
| 8.1 | 24.2 | GO:0019740 | regulation of nitrogen utilization(GO:0006808) nitrogen utilization(GO:0019740) negative regulation of retinal cell programmed cell death(GO:0046671) |
| 8.0 | 8.0 | GO:0043366 | beta selection(GO:0043366) |
| 8.0 | 119.6 | GO:0035313 | wound healing, spreading of epidermal cells(GO:0035313) |
| 7.9 | 7.9 | GO:1903225 | negative regulation of endodermal cell differentiation(GO:1903225) |
| 7.6 | 7.6 | GO:0021769 | orbitofrontal cortex development(GO:0021769) |
| 7.6 | 68.4 | GO:0060056 | mammary gland involution(GO:0060056) |
| 7.6 | 22.8 | GO:0032789 | saturated monocarboxylic acid metabolic process(GO:0032788) unsaturated monocarboxylic acid metabolic process(GO:0032789) |
| 7.6 | 22.8 | GO:0032532 | regulation of microvillus length(GO:0032532) |
| 7.6 | 37.8 | GO:0070633 | transepithelial transport(GO:0070633) |
| 7.5 | 29.8 | GO:0097069 | cellular response to thyroxine stimulus(GO:0097069) |
| 7.4 | 134.0 | GO:0001771 | immunological synapse formation(GO:0001771) |
| 7.4 | 7.4 | GO:0070947 | neutrophil mediated killing of fungus(GO:0070947) |
| 7.3 | 22.0 | GO:0071934 | thiamine transmembrane transport(GO:0071934) |
| 7.3 | 7.3 | GO:0051121 | hepoxilin metabolic process(GO:0051121) hepoxilin biosynthetic process(GO:0051122) |
| 7.3 | 36.5 | GO:0010533 | regulation of activation of Janus kinase activity(GO:0010533) |
| 7.3 | 51.1 | GO:0035338 | long-chain fatty-acyl-CoA biosynthetic process(GO:0035338) |
| 7.3 | 43.7 | GO:0001992 | regulation of systemic arterial blood pressure by vasopressin(GO:0001992) |
| 7.3 | 29.1 | GO:0038044 | transforming growth factor-beta secretion(GO:0038044) |
| 7.3 | 36.3 | GO:0045218 | zonula adherens maintenance(GO:0045218) |
| 7.2 | 43.3 | GO:0097070 | ductus arteriosus closure(GO:0097070) |
| 7.2 | 35.8 | GO:0038027 | apolipoprotein A-I-mediated signaling pathway(GO:0038027) |
| 7.1 | 14.3 | GO:0071586 | CAAX-box protein processing(GO:0071586) CAAX-box protein maturation(GO:0080120) |
| 7.1 | 21.3 | GO:0071163 | pre-replicative complex assembly involved in nuclear cell cycle DNA replication(GO:0006267) pre-replicative complex assembly(GO:0036388) DNA replication preinitiation complex assembly(GO:0071163) pre-replicative complex assembly involved in cell cycle DNA replication(GO:1902299) |
| 7.1 | 177.4 | GO:0060445 | branching involved in salivary gland morphogenesis(GO:0060445) |
| 7.1 | 7.1 | GO:0007529 | establishment of synaptic specificity at neuromuscular junction(GO:0007529) |
| 7.0 | 28.1 | GO:1903999 | negative regulation of eating behavior(GO:1903999) |
| 7.0 | 21.0 | GO:0016267 | O-glycan processing, core 1(GO:0016267) |
| 7.0 | 48.9 | GO:0045341 | MHC class I biosynthetic process(GO:0045341) regulation of MHC class I biosynthetic process(GO:0045343) positive regulation of MHC class I biosynthetic process(GO:0045345) |
| 6.9 | 27.5 | GO:0002386 | immune response in mucosal-associated lymphoid tissue(GO:0002386) |
| 6.7 | 33.7 | GO:0046104 | thymidine metabolic process(GO:0046104) |
| 6.7 | 13.4 | GO:0002426 | immunoglobulin production in mucosal tissue(GO:0002426) |
| 6.6 | 39.9 | GO:0045198 | establishment of epithelial cell apical/basal polarity(GO:0045198) |
| 6.6 | 19.9 | GO:1902226 | regulation of macrophage colony-stimulating factor signaling pathway(GO:1902226) regulation of response to macrophage colony-stimulating factor(GO:1903969) regulation of cellular response to macrophage colony-stimulating factor stimulus(GO:1903972) |
| 6.6 | 13.2 | GO:0070103 | regulation of interleukin-6-mediated signaling pathway(GO:0070103) |
| 6.6 | 19.8 | GO:0002238 | response to molecule of fungal origin(GO:0002238) |
| 6.6 | 6.6 | GO:0003430 | growth plate cartilage chondrocyte growth(GO:0003430) |
| 6.6 | 19.8 | GO:0060157 | urinary bladder development(GO:0060157) |
| 6.6 | 19.7 | GO:2000182 | regulation of progesterone biosynthetic process(GO:2000182) |
| 6.6 | 13.1 | GO:0002901 | mature B cell apoptotic process(GO:0002901) regulation of mature B cell apoptotic process(GO:0002905) negative regulation of mature B cell apoptotic process(GO:0002906) |
| 6.5 | 32.7 | GO:0002934 | desmosome organization(GO:0002934) |
| 6.5 | 26.1 | GO:0090118 | receptor-mediated endocytosis of low-density lipoprotein particle involved in cholesterol transport(GO:0090118) |
| 6.5 | 32.5 | GO:1900020 | regulation of protein kinase C activity(GO:1900019) positive regulation of protein kinase C activity(GO:1900020) |
| 6.4 | 76.9 | GO:2000786 | positive regulation of autophagosome assembly(GO:2000786) |
| 6.4 | 102.1 | GO:0031268 | pseudopodium organization(GO:0031268) |
| 6.4 | 44.6 | GO:0046710 | GDP metabolic process(GO:0046710) |
| 6.4 | 25.4 | GO:0002343 | peripheral B cell selection(GO:0002343) B cell affinity maturation(GO:0002344) |
| 6.2 | 12.4 | GO:1904387 | cellular response to L-phenylalanine derivative(GO:1904387) |
| 6.2 | 24.7 | GO:0042126 | nitrate metabolic process(GO:0042126) |
| 6.2 | 30.8 | GO:0010037 | response to carbon dioxide(GO:0010037) |
| 6.1 | 18.4 | GO:0042822 | pyridoxal phosphate metabolic process(GO:0042822) |
| 6.1 | 24.5 | GO:0071847 | TNFSF11-mediated signaling pathway(GO:0071847) |
| 6.1 | 12.2 | GO:2000721 | positive regulation of transcription from RNA polymerase II promoter involved in smooth muscle cell differentiation(GO:2000721) |
| 6.1 | 6.1 | GO:0006701 | progesterone biosynthetic process(GO:0006701) |
| 6.1 | 30.4 | GO:0003433 | chondrocyte development involved in endochondral bone morphogenesis(GO:0003433) |
| 6.1 | 18.2 | GO:0051977 | lysophospholipid transport(GO:0051977) |
| 6.1 | 18.2 | GO:2000853 | negative regulation of corticosterone secretion(GO:2000853) |
| 6.0 | 18.1 | GO:0060414 | aorta smooth muscle tissue morphogenesis(GO:0060414) |
| 6.0 | 66.4 | GO:0070072 | vacuolar proton-transporting V-type ATPase complex assembly(GO:0070072) |
| 6.0 | 78.5 | GO:0034063 | stress granule assembly(GO:0034063) |
| 6.0 | 18.0 | GO:0070384 | Harderian gland development(GO:0070384) |
| 6.0 | 17.9 | GO:0071422 | succinate transport(GO:0015744) succinate transmembrane transport(GO:0071422) |
| 5.9 | 5.9 | GO:0060160 | negative regulation of dopamine receptor signaling pathway(GO:0060160) |
| 5.9 | 17.8 | GO:2000298 | regulation of Rho-dependent protein serine/threonine kinase activity(GO:2000298) |
| 5.9 | 17.8 | GO:0090271 | positive regulation of fibroblast growth factor production(GO:0090271) |
| 5.9 | 23.7 | GO:0009992 | cellular water homeostasis(GO:0009992) |
| 5.9 | 11.8 | GO:1903588 | negative regulation of blood vessel endothelial cell proliferation involved in sprouting angiogenesis(GO:1903588) |
| 5.9 | 76.4 | GO:0007342 | fusion of sperm to egg plasma membrane(GO:0007342) |
| 5.9 | 17.6 | GO:1904580 | regulation of intracellular mRNA localization(GO:1904580) |
| 5.8 | 23.3 | GO:0051958 | methotrexate transport(GO:0051958) |
| 5.8 | 28.9 | GO:0050917 | sensory perception of umami taste(GO:0050917) |
| 5.8 | 11.5 | GO:0021782 | glial cell development(GO:0021782) |
| 5.8 | 11.5 | GO:2000660 | negative regulation of interleukin-1-mediated signaling pathway(GO:2000660) |
| 5.7 | 28.7 | GO:2000504 | positive regulation of blood vessel remodeling(GO:2000504) |
| 5.7 | 28.6 | GO:0051387 | negative regulation of neurotrophin TRK receptor signaling pathway(GO:0051387) |
| 5.7 | 17.2 | GO:1902202 | regulation of hepatocyte growth factor receptor signaling pathway(GO:1902202) |
| 5.7 | 5.7 | GO:2000338 | chemokine (C-X-C motif) ligand 1 production(GO:0072566) regulation of chemokine (C-X-C motif) ligand 1 production(GO:2000338) |
| 5.7 | 22.9 | GO:0061002 | negative regulation of dendritic spine morphogenesis(GO:0061002) |
| 5.7 | 11.4 | GO:0008588 | release of cytoplasmic sequestered NF-kappaB(GO:0008588) |
| 5.7 | 34.1 | GO:1904714 | regulation of chaperone-mediated autophagy(GO:1904714) |
| 5.6 | 78.9 | GO:0043312 | neutrophil degranulation(GO:0043312) |
| 5.6 | 56.3 | GO:0006968 | cellular defense response(GO:0006968) |
| 5.6 | 16.8 | GO:0086097 | regulation of renal output by angiotensin(GO:0002019) phospholipase C-activating angiotensin-activated signaling pathway(GO:0086097) |
| 5.6 | 11.1 | GO:1904685 | positive regulation of metalloendopeptidase activity(GO:1904685) |
| 5.6 | 99.9 | GO:1900027 | regulation of ruffle assembly(GO:1900027) |
| 5.5 | 16.6 | GO:1902287 | trigeminal nerve morphogenesis(GO:0021636) trigeminal nerve structural organization(GO:0021637) trunk segmentation(GO:0035290) trunk neural crest cell migration(GO:0036484) ventral trunk neural crest cell migration(GO:0036486) sympathetic neuron projection extension(GO:0097490) sympathetic neuron projection guidance(GO:0097491) semaphorin-plexin signaling pathway involved in axon guidance(GO:1902287) |
| 5.5 | 16.5 | GO:0042350 | GDP-L-fucose biosynthetic process(GO:0042350) |
| 5.5 | 16.4 | GO:0032380 | regulation of intracellular lipid transport(GO:0032377) regulation of intracellular sterol transport(GO:0032380) regulation of intracellular cholesterol transport(GO:0032383) |
| 5.4 | 21.8 | GO:0010730 | negative regulation of hydrogen peroxide biosynthetic process(GO:0010730) |
| 5.4 | 108.7 | GO:0070831 | basement membrane assembly(GO:0070831) |
| 5.4 | 10.8 | GO:0015746 | citrate transport(GO:0015746) |
| 5.4 | 32.4 | GO:0051136 | regulation of NK T cell differentiation(GO:0051136) |
| 5.3 | 5.3 | GO:0035622 | intrahepatic bile duct development(GO:0035622) |
| 5.3 | 37.3 | GO:0050915 | sensory perception of sour taste(GO:0050915) |
| 5.3 | 31.9 | GO:0033031 | positive regulation of neutrophil apoptotic process(GO:0033031) |
| 5.3 | 5.3 | GO:0002710 | negative regulation of T cell mediated immunity(GO:0002710) |
| 5.3 | 47.4 | GO:0045656 | negative regulation of monocyte differentiation(GO:0045656) |
| 5.3 | 21.1 | GO:0014028 | notochord formation(GO:0014028) |
| 5.3 | 68.4 | GO:0038094 | Fc-gamma receptor signaling pathway(GO:0038094) |
| 5.2 | 10.5 | GO:0032747 | positive regulation of interleukin-23 production(GO:0032747) |
| 5.2 | 36.7 | GO:0060600 | dichotomous subdivision of an epithelial terminal unit(GO:0060600) |
| 5.2 | 20.6 | GO:0046655 | folic acid metabolic process(GO:0046655) |
| 5.1 | 20.6 | GO:0045404 | positive regulation of interleukin-4 biosynthetic process(GO:0045404) |
| 5.1 | 5.1 | GO:0042531 | regulation of tyrosine phosphorylation of STAT protein(GO:0042509) positive regulation of tyrosine phosphorylation of STAT protein(GO:0042531) |
| 5.1 | 15.4 | GO:0071640 | regulation of macrophage inflammatory protein 1 alpha production(GO:0071640) |
| 5.1 | 40.6 | GO:0042421 | norepinephrine biosynthetic process(GO:0042421) |
| 5.0 | 10.1 | GO:2000562 | negative regulation of CD4-positive, alpha-beta T cell proliferation(GO:2000562) |
| 5.0 | 20.1 | GO:2001288 | positive regulation of caveolin-mediated endocytosis(GO:2001288) |
| 5.0 | 9.9 | GO:2000587 | negative regulation of platelet-derived growth factor receptor-beta signaling pathway(GO:2000587) |
| 5.0 | 9.9 | GO:0022614 | membrane to membrane docking(GO:0022614) |
| 5.0 | 14.9 | GO:0019375 | galactosylceramide biosynthetic process(GO:0006682) galactolipid biosynthetic process(GO:0019375) |
| 4.9 | 4.9 | GO:0070946 | neutrophil mediated killing of gram-positive bacterium(GO:0070946) |
| 4.9 | 4.9 | GO:0002634 | regulation of germinal center formation(GO:0002634) |
| 4.9 | 34.4 | GO:0007182 | common-partner SMAD protein phosphorylation(GO:0007182) |
| 4.9 | 14.6 | GO:1903165 | response to polycyclic arene(GO:1903165) |
| 4.8 | 14.4 | GO:0060545 | positive regulation of necroptotic process(GO:0060545) |
| 4.8 | 9.5 | GO:1900222 | negative regulation of beta-amyloid clearance(GO:1900222) |
| 4.8 | 14.3 | GO:0071579 | regulation of zinc ion transport(GO:0071579) |
| 4.7 | 14.2 | GO:0039534 | negative regulation of MDA-5 signaling pathway(GO:0039534) |
| 4.7 | 14.2 | GO:0046416 | D-amino acid metabolic process(GO:0046416) |
| 4.7 | 4.7 | GO:0090050 | positive regulation of cell migration involved in sprouting angiogenesis(GO:0090050) |
| 4.7 | 42.3 | GO:0003376 | sphingosine-1-phosphate signaling pathway(GO:0003376) |
| 4.7 | 14.1 | GO:1903173 | phytol metabolic process(GO:0033306) fatty alcohol metabolic process(GO:1903173) |
| 4.7 | 18.7 | GO:0038110 | interleukin-2-mediated signaling pathway(GO:0038110) |
| 4.7 | 70.2 | GO:0007250 | activation of NF-kappaB-inducing kinase activity(GO:0007250) |
| 4.7 | 14.0 | GO:0034224 | cellular response to zinc ion starvation(GO:0034224) |
| 4.7 | 9.3 | GO:0042360 | vitamin E metabolic process(GO:0042360) |
| 4.6 | 9.3 | GO:2001027 | negative regulation of endothelial cell chemotaxis(GO:2001027) |
| 4.6 | 9.3 | GO:0070494 | regulation of thrombin receptor signaling pathway(GO:0070494) negative regulation of thrombin receptor signaling pathway(GO:0070495) |
| 4.6 | 9.3 | GO:0002476 | antigen processing and presentation of endogenous peptide antigen via MHC class Ib(GO:0002476) |
| 4.6 | 13.9 | GO:0006713 | glucocorticoid catabolic process(GO:0006713) |
| 4.6 | 9.2 | GO:0042159 | lipoprotein catabolic process(GO:0042159) |
| 4.6 | 69.2 | GO:0035269 | protein O-linked mannosylation(GO:0035269) |
| 4.6 | 9.2 | GO:0060155 | platelet dense granule organization(GO:0060155) |
| 4.6 | 13.8 | GO:1900060 | negative regulation of ceramide biosynthetic process(GO:1900060) |
| 4.6 | 13.7 | GO:0090310 | negative regulation of methylation-dependent chromatin silencing(GO:0090310) |
| 4.6 | 18.2 | GO:0016103 | diterpenoid catabolic process(GO:0016103) retinoic acid catabolic process(GO:0034653) |
| 4.6 | 13.7 | GO:1904721 | negative regulation of mRNA cleavage(GO:0031438) negative regulation of mRNA endonucleolytic cleavage involved in unfolded protein response(GO:1904721) |
| 4.5 | 77.2 | GO:0031424 | keratinization(GO:0031424) |
| 4.5 | 18.1 | GO:0032485 | regulation of Ral protein signal transduction(GO:0032485) |
| 4.5 | 22.6 | GO:0051005 | negative regulation of lipoprotein lipase activity(GO:0051005) |
| 4.5 | 58.7 | GO:0060856 | establishment of blood-brain barrier(GO:0060856) |
| 4.5 | 13.5 | GO:0042636 | negative regulation of hair cycle(GO:0042636) |
| 4.5 | 4.5 | GO:0061153 | trachea submucosa development(GO:0061152) trachea gland development(GO:0061153) |
| 4.5 | 44.5 | GO:0070244 | negative regulation of thymocyte apoptotic process(GO:0070244) |
| 4.4 | 13.3 | GO:0090611 | ubiquitin-independent protein catabolic process via the multivesicular body sorting pathway(GO:0090611) |
| 4.4 | 30.9 | GO:0061086 | negative regulation of histone H3-K27 methylation(GO:0061086) |
| 4.3 | 8.7 | GO:0071072 | negative regulation of phospholipid biosynthetic process(GO:0071072) |
| 4.3 | 13.0 | GO:0046061 | dATP catabolic process(GO:0046061) |
| 4.3 | 13.0 | GO:0044209 | AMP salvage(GO:0044209) |
| 4.3 | 12.9 | GO:2000670 | positive regulation of dendritic cell apoptotic process(GO:2000670) |
| 4.3 | 12.9 | GO:0002541 | activation of plasma proteins involved in acute inflammatory response(GO:0002541) |
| 4.3 | 8.6 | GO:2000566 | positive regulation of CD8-positive, alpha-beta T cell proliferation(GO:2000566) |
| 4.3 | 17.2 | GO:0046878 | positive regulation of saliva secretion(GO:0046878) |
| 4.2 | 25.4 | GO:0098967 | exocytic insertion of neurotransmitter receptor to plasma membrane(GO:0098881) exocytic insertion of neurotransmitter receptor to postsynaptic membrane(GO:0098967) |
| 4.2 | 29.6 | GO:0060075 | regulation of resting membrane potential(GO:0060075) |
| 4.2 | 42.2 | GO:0006054 | N-acetylneuraminate metabolic process(GO:0006054) |
| 4.2 | 46.4 | GO:1900165 | negative regulation of interleukin-6 secretion(GO:1900165) |
| 4.2 | 37.8 | GO:2000035 | regulation of stem cell division(GO:2000035) |
| 4.2 | 12.6 | GO:0035483 | gastric emptying(GO:0035483) |
| 4.2 | 54.5 | GO:0032836 | glomerular basement membrane development(GO:0032836) |
| 4.2 | 4.2 | GO:1904100 | regulation of protein O-linked glycosylation(GO:1904098) positive regulation of protein O-linked glycosylation(GO:1904100) |
| 4.2 | 12.5 | GO:0044375 | regulation of peroxisome size(GO:0044375) |
| 4.2 | 12.5 | GO:0042590 | antigen processing and presentation of exogenous peptide antigen via MHC class I(GO:0042590) |
| 4.2 | 96.0 | GO:0090023 | positive regulation of neutrophil chemotaxis(GO:0090023) |
| 4.2 | 4.2 | GO:1904170 | regulation of bleb assembly(GO:1904170) |
| 4.2 | 91.7 | GO:0060644 | mammary gland epithelial cell differentiation(GO:0060644) |
| 4.2 | 37.4 | GO:0046146 | tetrahydrobiopterin metabolic process(GO:0046146) |
| 4.1 | 37.2 | GO:0045217 | cell-cell junction maintenance(GO:0045217) |
| 4.1 | 12.3 | GO:0061146 | Peyer's patch morphogenesis(GO:0061146) |
| 4.1 | 44.8 | GO:0033630 | positive regulation of cell adhesion mediated by integrin(GO:0033630) |
| 4.0 | 36.4 | GO:0060287 | epithelial cilium movement involved in determination of left/right asymmetry(GO:0060287) |
| 4.0 | 12.1 | GO:0034154 | toll-like receptor 7 signaling pathway(GO:0034154) |
| 4.0 | 16.1 | GO:0002032 | desensitization of G-protein coupled receptor protein signaling pathway by arrestin(GO:0002032) |
| 4.0 | 8.1 | GO:0007223 | Wnt signaling pathway, calcium modulating pathway(GO:0007223) |
| 4.0 | 12.1 | GO:0030824 | negative regulation of cGMP metabolic process(GO:0030824) |
| 4.0 | 12.1 | GO:0032978 | protein insertion into membrane from inner side(GO:0032978) |
| 4.0 | 8.0 | GO:0033631 | cell-cell adhesion mediated by integrin(GO:0033631) |
| 4.0 | 4.0 | GO:0045626 | negative regulation of T-helper 1 cell differentiation(GO:0045626) |
| 4.0 | 12.0 | GO:0035624 | receptor transactivation(GO:0035624) epidermal growth factor-activated receptor transactivation by G-protein coupled receptor signaling pathway(GO:0035625) |
| 4.0 | 8.0 | GO:0032847 | regulation of cellular pH reduction(GO:0032847) positive regulation of cellular pH reduction(GO:0032849) |
| 4.0 | 12.0 | GO:0006742 | NADP catabolic process(GO:0006742) |
| 4.0 | 4.0 | GO:0019860 | uracil metabolic process(GO:0019860) |
| 4.0 | 8.0 | GO:0002408 | myeloid dendritic cell chemotaxis(GO:0002408) |
| 4.0 | 11.9 | GO:1901377 | toxin catabolic process(GO:0009407) mycotoxin catabolic process(GO:0043387) aflatoxin catabolic process(GO:0046223) secondary metabolite catabolic process(GO:0090487) organic heteropentacyclic compound catabolic process(GO:1901377) |
| 3.9 | 27.4 | GO:0002315 | marginal zone B cell differentiation(GO:0002315) |
| 3.9 | 31.3 | GO:0006578 | amino-acid betaine biosynthetic process(GO:0006578) |
| 3.9 | 11.7 | GO:1902527 | positive regulation of protein monoubiquitination(GO:1902527) |
| 3.9 | 54.6 | GO:0010759 | positive regulation of macrophage chemotaxis(GO:0010759) |
| 3.9 | 11.7 | GO:0018094 | protein polyglycylation(GO:0018094) |
| 3.8 | 11.5 | GO:0016129 | phytosteroid metabolic process(GO:0016128) phytosteroid biosynthetic process(GO:0016129) |
| 3.8 | 38.4 | GO:0006670 | sphingosine metabolic process(GO:0006670) |
| 3.8 | 11.5 | GO:2001013 | epithelial cell proliferation involved in renal tubule morphogenesis(GO:2001013) |
| 3.8 | 22.9 | GO:0010990 | regulation of SMAD protein complex assembly(GO:0010990) negative regulation of SMAD protein complex assembly(GO:0010991) |
| 3.8 | 15.2 | GO:0070839 | divalent metal ion export(GO:0070839) |
| 3.8 | 7.6 | GO:0097187 | dentinogenesis(GO:0097187) |
| 3.8 | 19.0 | GO:0010760 | negative regulation of macrophage chemotaxis(GO:0010760) |
| 3.8 | 3.8 | GO:0043316 | cytotoxic T cell degranulation(GO:0043316) |
| 3.8 | 7.5 | GO:0002586 | regulation of antigen processing and presentation of peptide or polysaccharide antigen via MHC class II(GO:0002580) regulation of antigen processing and presentation of peptide antigen via MHC class II(GO:0002586) |
| 3.8 | 22.5 | GO:0060481 | lobar bronchus epithelium development(GO:0060481) |
| 3.8 | 11.3 | GO:1902959 | regulation of aspartic-type endopeptidase activity involved in amyloid precursor protein catabolic process(GO:1902959) positive regulation of aspartic-type endopeptidase activity involved in amyloid precursor protein catabolic process(GO:1902961) regulation of metalloendopeptidase activity involved in amyloid precursor protein catabolic process(GO:1902962) negative regulation of metalloendopeptidase activity involved in amyloid precursor protein catabolic process(GO:1902963) regulation of aspartic-type peptidase activity(GO:1905245) positive regulation of aspartic-type peptidase activity(GO:1905247) |
| 3.7 | 11.2 | GO:0071395 | response to jasmonic acid(GO:0009753) cellular response to jasmonic acid stimulus(GO:0071395) |
| 3.7 | 7.5 | GO:0035771 | interleukin-4-mediated signaling pathway(GO:0035771) |
| 3.7 | 18.6 | GO:0032020 | ISG15-protein conjugation(GO:0032020) |
| 3.7 | 3.7 | GO:1902164 | positive regulation of DNA damage response, signal transduction by p53 class mediator resulting in transcription of p21 class mediator(GO:1902164) |
| 3.7 | 3.7 | GO:0032423 | regulation of mismatch repair(GO:0032423) |
| 3.7 | 14.8 | GO:2000389 | regulation of neutrophil extravasation(GO:2000389) |
| 3.7 | 18.4 | GO:0045110 | intermediate filament bundle assembly(GO:0045110) |
| 3.7 | 25.8 | GO:0000103 | sulfate assimilation(GO:0000103) |
| 3.7 | 11.1 | GO:0061073 | ciliary body morphogenesis(GO:0061073) |
| 3.7 | 14.7 | GO:0031642 | negative regulation of myelination(GO:0031642) |
| 3.6 | 7.2 | GO:0051695 | actin filament uncapping(GO:0051695) |
| 3.6 | 7.2 | GO:0000320 | re-entry into mitotic cell cycle(GO:0000320) |
| 3.6 | 46.6 | GO:0021796 | cerebral cortex regionalization(GO:0021796) |
| 3.6 | 7.2 | GO:0031652 | positive regulation of heat generation(GO:0031652) |
| 3.6 | 17.8 | GO:0050925 | negative regulation of negative chemotaxis(GO:0050925) |
| 3.6 | 10.7 | GO:0090206 | negative regulation of cholesterol biosynthetic process(GO:0045541) negative regulation of cholesterol metabolic process(GO:0090206) |
| 3.6 | 39.1 | GO:0019886 | antigen processing and presentation of exogenous peptide antigen via MHC class II(GO:0019886) |
| 3.5 | 127.6 | GO:0050853 | B cell receptor signaling pathway(GO:0050853) |
| 3.5 | 35.4 | GO:0045060 | negative thymic T cell selection(GO:0045060) |
| 3.5 | 10.6 | GO:0034696 | response to prostaglandin F(GO:0034696) |
| 3.5 | 17.6 | GO:0043415 | positive regulation of skeletal muscle tissue regeneration(GO:0043415) |
| 3.5 | 10.6 | GO:0048133 | germ-line stem cell division(GO:0042078) male germ-line stem cell asymmetric division(GO:0048133) germline stem cell asymmetric division(GO:0098728) |
| 3.5 | 3.5 | GO:0061364 | apoptotic process involved in luteolysis(GO:0061364) |
| 3.5 | 7.0 | GO:2000977 | regulation of forebrain neuron differentiation(GO:2000977) |
| 3.5 | 21.0 | GO:0015791 | polyol transport(GO:0015791) |
| 3.5 | 27.9 | GO:0016191 | synaptic vesicle uncoating(GO:0016191) |
| 3.5 | 7.0 | GO:0072061 | inner medullary collecting duct development(GO:0072061) |
| 3.5 | 17.3 | GO:0070162 | adiponectin secretion(GO:0070162) regulation of adiponectin secretion(GO:0070163) negative regulation of adiponectin secretion(GO:0070164) |
| 3.5 | 10.4 | GO:0010070 | zygote asymmetric cell division(GO:0010070) |
| 3.4 | 31.0 | GO:0071985 | multivesicular body sorting pathway(GO:0071985) |
| 3.4 | 10.2 | GO:0016199 | axon midline choice point recognition(GO:0016199) |
| 3.4 | 10.2 | GO:0036451 | cap mRNA methylation(GO:0036451) |
| 3.4 | 10.1 | GO:2000121 | regulation of removal of superoxide radicals(GO:2000121) |
| 3.3 | 16.7 | GO:0000706 | meiotic DNA double-strand break processing(GO:0000706) |
| 3.3 | 16.6 | GO:0007621 | negative regulation of female receptivity(GO:0007621) |
| 3.3 | 99.4 | GO:0030104 | water homeostasis(GO:0030104) |
| 3.3 | 75.7 | GO:0071801 | regulation of podosome assembly(GO:0071801) |
| 3.3 | 3.3 | GO:0045819 | positive regulation of glycogen catabolic process(GO:0045819) |
| 3.3 | 13.1 | GO:0002084 | protein depalmitoylation(GO:0002084) |
| 3.3 | 6.6 | GO:0003025 | regulation of systemic arterial blood pressure by baroreceptor feedback(GO:0003025) |
| 3.3 | 9.8 | GO:0050854 | regulation of antigen receptor-mediated signaling pathway(GO:0050854) |
| 3.3 | 13.1 | GO:0050930 | induction of positive chemotaxis(GO:0050930) |
| 3.2 | 6.5 | GO:0036091 | positive regulation of transcription from RNA polymerase II promoter in response to oxidative stress(GO:0036091) |
| 3.2 | 9.7 | GO:0032687 | negative regulation of interferon-alpha production(GO:0032687) |
| 3.2 | 12.9 | GO:0044725 | chromatin reprogramming in the zygote(GO:0044725) |
| 3.2 | 12.8 | GO:0030382 | sperm mitochondrion organization(GO:0030382) |
| 3.2 | 6.4 | GO:1905225 | regulation of phospholipase C-activating G-protein coupled receptor signaling pathway(GO:1900736) positive regulation of phospholipase C-activating G-protein coupled receptor signaling pathway(GO:1900738) response to thyrotropin-releasing hormone(GO:1905225) |
| 3.2 | 44.6 | GO:0015868 | purine nucleotide transport(GO:0015865) purine ribonucleotide transport(GO:0015868) |
| 3.2 | 12.7 | GO:0097117 | guanylate kinase-associated protein clustering(GO:0097117) |
| 3.2 | 3.2 | GO:0046520 | sphingoid biosynthetic process(GO:0046520) |
| 3.2 | 25.3 | GO:0070995 | NADPH oxidation(GO:0070995) |
| 3.1 | 34.6 | GO:0019720 | Mo-molybdopterin cofactor biosynthetic process(GO:0006777) Mo-molybdopterin cofactor metabolic process(GO:0019720) |
| 3.1 | 9.4 | GO:0046060 | dATP metabolic process(GO:0046060) |
| 3.1 | 15.6 | GO:1990086 | lens fiber cell apoptotic process(GO:1990086) |
| 3.1 | 46.8 | GO:0006517 | protein deglycosylation(GO:0006517) |
| 3.1 | 9.3 | GO:0001561 | fatty acid alpha-oxidation(GO:0001561) |
| 3.1 | 9.3 | GO:1902715 | positive regulation of interferon-gamma secretion(GO:1902715) |
| 3.1 | 9.3 | GO:0034145 | positive regulation of toll-like receptor 4 signaling pathway(GO:0034145) |
| 3.1 | 9.3 | GO:0080144 | amino acid homeostasis(GO:0080144) |
| 3.1 | 12.4 | GO:0045903 | positive regulation of translational fidelity(GO:0045903) |
| 3.1 | 139.0 | GO:0007157 | heterophilic cell-cell adhesion via plasma membrane cell adhesion molecules(GO:0007157) |
| 3.1 | 9.2 | GO:0061009 | common bile duct development(GO:0061009) |
| 3.1 | 27.6 | GO:0042415 | norepinephrine metabolic process(GO:0042415) |
| 3.0 | 6.1 | GO:0030035 | microspike assembly(GO:0030035) |
| 3.0 | 15.2 | GO:1902732 | positive regulation of chondrocyte proliferation(GO:1902732) |
| 3.0 | 9.1 | GO:1905146 | regulation of protein catabolic process in the vacuole(GO:1904350) lysosomal protein catabolic process(GO:1905146) |
| 3.0 | 18.1 | GO:0046836 | glycolipid transport(GO:0046836) |
| 3.0 | 6.0 | GO:1990169 | detoxification of copper ion(GO:0010273) stress response to copper ion(GO:1990169) |
| 3.0 | 26.9 | GO:0035542 | regulation of SNARE complex assembly(GO:0035542) |
| 3.0 | 11.9 | GO:0010615 | positive regulation of cardiac muscle adaptation(GO:0010615) positive regulation of cardiac muscle hypertrophy in response to stress(GO:1903244) |
| 3.0 | 8.9 | GO:0002644 | negative regulation of tolerance induction(GO:0002644) |
| 3.0 | 8.9 | GO:0072734 | response to staurosporine(GO:0072733) cellular response to staurosporine(GO:0072734) |
| 3.0 | 8.9 | GO:0072156 | distal tubule morphogenesis(GO:0072156) |
| 2.9 | 11.8 | GO:0018406 | protein C-linked glycosylation(GO:0018103) peptidyl-tryptophan modification(GO:0018211) protein C-linked glycosylation via tryptophan(GO:0018317) protein C-linked glycosylation via 2'-alpha-mannosyl-L-tryptophan(GO:0018406) |
| 2.9 | 8.8 | GO:0072378 | blood coagulation, fibrin clot formation(GO:0072378) |
| 2.9 | 32.3 | GO:0007175 | negative regulation of epidermal growth factor-activated receptor activity(GO:0007175) |
| 2.9 | 14.6 | GO:0045084 | positive regulation of interleukin-12 biosynthetic process(GO:0045084) |
| 2.9 | 43.6 | GO:0031295 | T cell costimulation(GO:0031295) |
| 2.9 | 5.8 | GO:0060684 | epithelial-mesenchymal cell signaling(GO:0060684) |
| 2.9 | 11.6 | GO:1905007 | positive regulation of epithelial to mesenchymal transition involved in endocardial cushion formation(GO:1905007) |
| 2.9 | 5.8 | GO:0060534 | trachea cartilage development(GO:0060534) |
| 2.8 | 14.2 | GO:0048012 | hepatocyte growth factor receptor signaling pathway(GO:0048012) |
| 2.8 | 5.7 | GO:0030327 | prenylated protein catabolic process(GO:0030327) |
| 2.8 | 62.4 | GO:0070830 | bicellular tight junction assembly(GO:0070830) |
| 2.8 | 11.3 | GO:0072660 | maintenance of protein location in membrane(GO:0072658) maintenance of protein location in plasma membrane(GO:0072660) |
| 2.8 | 47.8 | GO:0060706 | cell differentiation involved in embryonic placenta development(GO:0060706) |
| 2.8 | 25.3 | GO:0043402 | glucocorticoid mediated signaling pathway(GO:0043402) |
| 2.8 | 8.4 | GO:0090158 | endoplasmic reticulum membrane organization(GO:0090158) |
| 2.8 | 72.3 | GO:0015701 | bicarbonate transport(GO:0015701) |
| 2.8 | 22.1 | GO:0071267 | amino acid salvage(GO:0043102) L-methionine salvage(GO:0071267) |
| 2.8 | 5.5 | GO:0060449 | bud elongation involved in lung branching(GO:0060449) |
| 2.8 | 8.3 | GO:0045607 | regulation of auditory receptor cell differentiation(GO:0045607) regulation of mechanoreceptor differentiation(GO:0045631) regulation of inner ear receptor cell differentiation(GO:2000980) |
| 2.7 | 35.7 | GO:0006880 | intracellular sequestering of iron ion(GO:0006880) sequestering of iron ion(GO:0097577) |
| 2.7 | 2.7 | GO:0071874 | response to norepinephrine(GO:0071873) cellular response to norepinephrine stimulus(GO:0071874) |
| 2.7 | 10.9 | GO:0038180 | nerve growth factor signaling pathway(GO:0038180) |
| 2.7 | 27.3 | GO:0006590 | thyroid hormone generation(GO:0006590) |
| 2.7 | 40.4 | GO:1904262 | negative regulation of TORC1 signaling(GO:1904262) |
| 2.7 | 2.7 | GO:0009912 | auditory receptor cell fate commitment(GO:0009912) inner ear receptor cell fate commitment(GO:0060120) |
| 2.7 | 5.4 | GO:0061366 | behavioral response to chemical pain(GO:0061366) behavioral response to formalin induced pain(GO:0061368) |
| 2.7 | 45.5 | GO:0042737 | drug catabolic process(GO:0042737) |
| 2.7 | 5.3 | GO:0045085 | negative regulation of interleukin-2 biosynthetic process(GO:0045085) |
| 2.7 | 5.3 | GO:1901674 | histone H3-K27 acetylation(GO:0043974) regulation of histone H3-K27 acetylation(GO:1901674) |
| 2.7 | 10.6 | GO:0010624 | regulation of Schwann cell proliferation(GO:0010624) |
| 2.6 | 5.3 | GO:0002887 | negative regulation of myeloid leukocyte mediated immunity(GO:0002887) |
| 2.6 | 23.7 | GO:0003084 | positive regulation of systemic arterial blood pressure(GO:0003084) |
| 2.6 | 23.7 | GO:0034214 | protein hexamerization(GO:0034214) |
| 2.6 | 7.9 | GO:0060821 | inactivation of X chromosome by DNA methylation(GO:0060821) |
| 2.6 | 7.9 | GO:0030889 | negative regulation of B cell proliferation(GO:0030889) |
| 2.6 | 31.4 | GO:0071280 | cellular response to copper ion(GO:0071280) |
| 2.6 | 2.6 | GO:0033864 | positive regulation of NAD(P)H oxidase activity(GO:0033864) |
| 2.6 | 7.8 | GO:1903593 | regulation of histamine secretion by mast cell(GO:1903593) |
| 2.6 | 10.4 | GO:0008063 | Toll signaling pathway(GO:0008063) |
| 2.6 | 36.5 | GO:0009435 | NAD biosynthetic process(GO:0009435) |
| 2.6 | 5.2 | GO:0034140 | negative regulation of toll-like receptor 3 signaling pathway(GO:0034140) |
| 2.6 | 18.2 | GO:0042905 | 9-cis-retinoic acid biosynthetic process(GO:0042904) 9-cis-retinoic acid metabolic process(GO:0042905) |
| 2.6 | 7.8 | GO:0001780 | neutrophil homeostasis(GO:0001780) |
| 2.6 | 10.4 | GO:0060842 | arterial endothelial cell differentiation(GO:0060842) |
| 2.6 | 5.2 | GO:0061724 | lipophagy(GO:0061724) negative regulation of exosomal secretion(GO:1903542) |
| 2.6 | 38.6 | GO:0090162 | establishment of epithelial cell polarity(GO:0090162) |
| 2.6 | 28.3 | GO:0097119 | postsynaptic density protein 95 clustering(GO:0097119) |
| 2.6 | 5.1 | GO:0051490 | negative regulation of filopodium assembly(GO:0051490) |
| 2.6 | 7.7 | GO:0060355 | positive regulation of cell adhesion molecule production(GO:0060355) |
| 2.6 | 5.1 | GO:0052564 | response to immune response of other organism involved in symbiotic interaction(GO:0052564) response to host immune response(GO:0052572) |
| 2.5 | 10.2 | GO:0001913 | T cell mediated cytotoxicity(GO:0001913) |
| 2.5 | 2.5 | GO:0034134 | toll-like receptor 2 signaling pathway(GO:0034134) |
| 2.5 | 5.0 | GO:0021773 | striatal medium spiny neuron differentiation(GO:0021773) |
| 2.5 | 25.2 | GO:0070314 | G1 to G0 transition(GO:0070314) |
| 2.5 | 7.5 | GO:0072086 | specification of loop of Henle identity(GO:0072086) |
| 2.5 | 5.0 | GO:0042891 | antibiotic transport(GO:0042891) |
| 2.5 | 5.0 | GO:0034312 | diol metabolic process(GO:0034311) diol biosynthetic process(GO:0034312) |
| 2.5 | 7.5 | GO:2000644 | regulation of receptor catabolic process(GO:2000644) |
| 2.5 | 34.9 | GO:1903830 | magnesium ion transmembrane transport(GO:1903830) |
| 2.5 | 9.9 | GO:0046855 | inositol phosphate dephosphorylation(GO:0046855) |
| 2.5 | 4.9 | GO:0038001 | paracrine signaling(GO:0038001) |
| 2.4 | 19.6 | GO:0046174 | polyol catabolic process(GO:0046174) |
| 2.4 | 12.2 | GO:0048318 | axial mesoderm development(GO:0048318) |
| 2.4 | 12.1 | GO:0021785 | branchiomotor neuron axon guidance(GO:0021785) |
| 2.4 | 7.2 | GO:0006529 | asparagine biosynthetic process(GO:0006529) |
| 2.4 | 7.2 | GO:0061091 | regulation of phospholipid translocation(GO:0061091) positive regulation of phospholipid translocation(GO:0061092) |
| 2.4 | 7.2 | GO:0038031 | non-canonical Wnt signaling pathway via JNK cascade(GO:0038031) |
| 2.4 | 16.7 | GO:0051256 | mitotic spindle elongation(GO:0000022) mitotic spindle midzone assembly(GO:0051256) |
| 2.4 | 14.2 | GO:0048194 | Golgi vesicle budding(GO:0048194) |
| 2.4 | 9.5 | GO:0042339 | keratan sulfate metabolic process(GO:0042339) |
| 2.4 | 7.1 | GO:1901491 | negative regulation of lymphangiogenesis(GO:1901491) |
| 2.4 | 4.7 | GO:0018199 | peptidyl-glutamine modification(GO:0018199) |
| 2.4 | 9.4 | GO:0007221 | positive regulation of transcription of Notch receptor target(GO:0007221) |
| 2.4 | 11.8 | GO:0071918 | urea transport(GO:0015840) urea transmembrane transport(GO:0071918) |
| 2.3 | 4.7 | GO:0050893 | sensory processing(GO:0050893) |
| 2.3 | 30.2 | GO:0046069 | cGMP catabolic process(GO:0046069) |
| 2.3 | 4.6 | GO:0021540 | corpus callosum morphogenesis(GO:0021540) |
| 2.3 | 13.9 | GO:0010668 | ectodermal cell differentiation(GO:0010668) |
| 2.3 | 23.2 | GO:0090557 | establishment of endothelial intestinal barrier(GO:0090557) |
| 2.3 | 4.6 | GO:0070859 | positive regulation of bile acid biosynthetic process(GO:0070859) positive regulation of bile acid metabolic process(GO:1904253) |
| 2.3 | 15.9 | GO:0006957 | complement activation, alternative pathway(GO:0006957) |
| 2.3 | 36.4 | GO:0042832 | defense response to protozoan(GO:0042832) |
| 2.3 | 27.3 | GO:0072673 | lamellipodium morphogenesis(GO:0072673) |
| 2.3 | 2.3 | GO:1902514 | regulation of calcium ion transmembrane transport via high voltage-gated calcium channel(GO:1902514) |
| 2.3 | 4.5 | GO:0045054 | constitutive secretory pathway(GO:0045054) |
| 2.2 | 6.7 | GO:0060279 | positive regulation of ovulation(GO:0060279) |
| 2.2 | 4.5 | GO:1904009 | cellular response to monosodium glutamate(GO:1904009) |
| 2.2 | 26.8 | GO:0060158 | phospholipase C-activating dopamine receptor signaling pathway(GO:0060158) |
| 2.2 | 2.2 | GO:0032077 | positive regulation of deoxyribonuclease activity(GO:0032077) |
| 2.2 | 8.9 | GO:0046462 | monoacylglycerol metabolic process(GO:0046462) monoacylglycerol catabolic process(GO:0052651) |
| 2.2 | 86.4 | GO:0090662 | ATP hydrolysis coupled transmembrane transport(GO:0090662) |
| 2.2 | 6.6 | GO:0010635 | regulation of mitochondrial fusion(GO:0010635) negative regulation of mitochondrial fusion(GO:0010637) |
| 2.2 | 8.8 | GO:0045112 | integrin biosynthetic process(GO:0045112) regulation of integrin biosynthetic process(GO:0045113) |
| 2.2 | 17.5 | GO:0072015 | glomerular visceral epithelial cell development(GO:0072015) glomerular epithelial cell development(GO:0072310) |
| 2.2 | 32.8 | GO:0002675 | positive regulation of acute inflammatory response(GO:0002675) |
| 2.2 | 2.2 | GO:0035983 | response to trichostatin A(GO:0035983) cellular response to trichostatin A(GO:0035984) |
| 2.2 | 8.7 | GO:0019372 | lipoxygenase pathway(GO:0019372) |
| 2.2 | 2.2 | GO:0010870 | positive regulation of receptor biosynthetic process(GO:0010870) |
| 2.2 | 4.3 | GO:0044268 | multicellular organismal protein metabolic process(GO:0044268) |
| 2.2 | 8.7 | GO:0032071 | regulation of endodeoxyribonuclease activity(GO:0032071) |
| 2.2 | 8.7 | GO:0051643 | endoplasmic reticulum localization(GO:0051643) |
| 2.1 | 10.7 | GO:1903715 | regulation of aerobic respiration(GO:1903715) |
| 2.1 | 2.1 | GO:0071245 | cellular response to carbon monoxide(GO:0071245) |
| 2.1 | 8.6 | GO:0033353 | S-adenosylmethionine cycle(GO:0033353) |
| 2.1 | 6.4 | GO:1904646 | cellular response to beta-amyloid(GO:1904646) |
| 2.1 | 8.5 | GO:0015811 | L-cystine transport(GO:0015811) |
| 2.1 | 17.0 | GO:0034143 | regulation of toll-like receptor 4 signaling pathway(GO:0034143) negative regulation of toll-like receptor 4 signaling pathway(GO:0034144) |
| 2.1 | 46.5 | GO:0019835 | cytolysis(GO:0019835) |
| 2.1 | 19.0 | GO:0009143 | nucleoside triphosphate catabolic process(GO:0009143) |
| 2.1 | 22.9 | GO:0015732 | prostaglandin transport(GO:0015732) |
| 2.1 | 16.7 | GO:0097067 | cellular response to thyroid hormone stimulus(GO:0097067) |
| 2.1 | 4.2 | GO:0061684 | chaperone-mediated autophagy(GO:0061684) |
| 2.1 | 14.5 | GO:0010839 | negative regulation of keratinocyte proliferation(GO:0010839) |
| 2.1 | 6.2 | GO:0002380 | immunoglobulin secretion involved in immune response(GO:0002380) |
| 2.1 | 10.4 | GO:0097011 | cellular response to granulocyte macrophage colony-stimulating factor stimulus(GO:0097011) response to granulocyte macrophage colony-stimulating factor(GO:0097012) |
| 2.1 | 6.2 | GO:0006649 | phospholipid transfer to membrane(GO:0006649) |
| 2.1 | 220.5 | GO:0035023 | regulation of Rho protein signal transduction(GO:0035023) |
| 2.0 | 10.2 | GO:0034242 | negative regulation of syncytium formation by plasma membrane fusion(GO:0034242) |
| 2.0 | 14.3 | GO:0045063 | T-helper 1 cell differentiation(GO:0045063) |
| 2.0 | 4.1 | GO:0008078 | mesodermal cell migration(GO:0008078) |
| 2.0 | 12.2 | GO:0034058 | endosomal vesicle fusion(GO:0034058) |
| 2.0 | 73.0 | GO:0045576 | mast cell activation(GO:0045576) |
| 2.0 | 10.1 | GO:0006677 | glycosylceramide metabolic process(GO:0006677) |
| 2.0 | 36.3 | GO:0061157 | mRNA destabilization(GO:0061157) |
| 2.0 | 8.1 | GO:0089700 | protein kinase D signaling(GO:0089700) |
| 2.0 | 2.0 | GO:0030997 | regulation of centriole-centriole cohesion(GO:0030997) |
| 2.0 | 4.0 | GO:0051933 | amino acid neurotransmitter reuptake(GO:0051933) glutamate reuptake(GO:0051935) |
| 2.0 | 8.1 | GO:0060536 | cartilage morphogenesis(GO:0060536) |
| 2.0 | 14.1 | GO:0050862 | positive regulation of T cell receptor signaling pathway(GO:0050862) |
| 2.0 | 8.0 | GO:0030210 | heparin biosynthetic process(GO:0030210) |
| 2.0 | 12.0 | GO:0009405 | pathogenesis(GO:0009405) |
| 2.0 | 35.9 | GO:0001573 | ganglioside metabolic process(GO:0001573) |
| 2.0 | 21.9 | GO:0006646 | phosphatidylethanolamine biosynthetic process(GO:0006646) |
| 2.0 | 7.9 | GO:0070560 | protein secretion by platelet(GO:0070560) |
| 2.0 | 7.9 | GO:0007084 | mitotic nuclear envelope reassembly(GO:0007084) |
| 2.0 | 21.7 | GO:0007202 | activation of phospholipase C activity(GO:0007202) |
| 2.0 | 9.8 | GO:0042256 | mature ribosome assembly(GO:0042256) |
| 2.0 | 9.8 | GO:0072678 | T cell migration(GO:0072678) |
| 2.0 | 3.9 | GO:1905232 | cellular response to L-glutamate(GO:1905232) |
| 1.9 | 9.7 | GO:0023021 | termination of signal transduction(GO:0023021) |
| 1.9 | 13.6 | GO:0090308 | regulation of methylation-dependent chromatin silencing(GO:0090308) |
| 1.9 | 5.8 | GO:0021615 | glossopharyngeal nerve morphogenesis(GO:0021615) |
| 1.9 | 7.7 | GO:0015691 | cadmium ion transport(GO:0015691) cadmium ion transmembrane transport(GO:0070574) |
| 1.9 | 1.9 | GO:0034124 | regulation of MyD88-dependent toll-like receptor signaling pathway(GO:0034124) |
| 1.9 | 3.8 | GO:0045869 | negative regulation of single stranded viral RNA replication via double stranded DNA intermediate(GO:0045869) |
| 1.9 | 13.4 | GO:0071712 | ER-associated misfolded protein catabolic process(GO:0071712) |
| 1.9 | 13.4 | GO:0003374 | dynamin polymerization involved in membrane fission(GO:0003373) dynamin polymerization involved in mitochondrial fission(GO:0003374) |
| 1.9 | 3.8 | GO:0046968 | cytosol to ER transport(GO:0046967) peptide antigen transport(GO:0046968) |
| 1.9 | 9.4 | GO:0033572 | transferrin transport(GO:0033572) |
| 1.9 | 26.3 | GO:0006198 | cAMP catabolic process(GO:0006198) |
| 1.9 | 3.8 | GO:0032494 | response to peptidoglycan(GO:0032494) |
| 1.9 | 22.5 | GO:0015914 | phospholipid transport(GO:0015914) |
| 1.9 | 3.7 | GO:0007356 | thorax and anterior abdomen determination(GO:0007356) |
| 1.9 | 3.7 | GO:1904760 | myofibroblast differentiation(GO:0036446) regulation of myofibroblast differentiation(GO:1904760) |
| 1.9 | 15.0 | GO:0035729 | cellular response to hepatocyte growth factor stimulus(GO:0035729) |
| 1.9 | 37.4 | GO:0006855 | drug transmembrane transport(GO:0006855) |
| 1.9 | 20.6 | GO:0001887 | selenium compound metabolic process(GO:0001887) |
| 1.9 | 1.9 | GO:0001781 | neutrophil apoptotic process(GO:0001781) regulation of neutrophil apoptotic process(GO:0033029) |
| 1.9 | 5.6 | GO:2000271 | positive regulation of fibroblast apoptotic process(GO:2000271) |
| 1.9 | 1.9 | GO:0033159 | negative regulation of protein import into nucleus, translocation(GO:0033159) |
| 1.8 | 9.1 | GO:0045838 | positive regulation of membrane potential(GO:0045838) |
| 1.8 | 12.8 | GO:0002326 | B cell lineage commitment(GO:0002326) |
| 1.8 | 7.3 | GO:0006013 | mannose metabolic process(GO:0006013) |
| 1.8 | 7.3 | GO:0048050 | post-embryonic eye morphogenesis(GO:0048050) |
| 1.8 | 7.3 | GO:0002023 | reduction of food intake in response to dietary excess(GO:0002023) |
| 1.8 | 5.4 | GO:0002329 | pre-B cell differentiation(GO:0002329) |
| 1.8 | 1.8 | GO:0043615 | astrocyte cell migration(GO:0043615) |
| 1.8 | 5.4 | GO:0006227 | dUDP biosynthetic process(GO:0006227) pyrimidine nucleoside diphosphate biosynthetic process(GO:0009139) deoxyribonucleoside diphosphate biosynthetic process(GO:0009189) pyrimidine deoxyribonucleoside diphosphate metabolic process(GO:0009196) pyrimidine deoxyribonucleoside diphosphate biosynthetic process(GO:0009197) dUDP metabolic process(GO:0046077) |
| 1.8 | 9.0 | GO:0038166 | angiotensin-activated signaling pathway(GO:0038166) |
| 1.8 | 9.0 | GO:0036089 | cleavage furrow formation(GO:0036089) |
| 1.8 | 38.9 | GO:0061245 | establishment or maintenance of apical/basal cell polarity(GO:0035088) establishment or maintenance of bipolar cell polarity(GO:0061245) |
| 1.8 | 7.0 | GO:0050852 | T cell receptor signaling pathway(GO:0050852) |
| 1.7 | 10.5 | GO:0008611 | ether lipid biosynthetic process(GO:0008611) glycerol ether biosynthetic process(GO:0046504) cellular lipid biosynthetic process(GO:0097384) ether biosynthetic process(GO:1901503) |
| 1.7 | 10.5 | GO:0046514 | ceramide catabolic process(GO:0046514) |
| 1.7 | 15.7 | GO:0006044 | N-acetylglucosamine metabolic process(GO:0006044) |
| 1.7 | 3.5 | GO:0045959 | negative regulation of complement activation, classical pathway(GO:0045959) |
| 1.7 | 5.2 | GO:0051919 | positive regulation of fibrinolysis(GO:0051919) |
| 1.7 | 10.3 | GO:0071397 | cellular response to cholesterol(GO:0071397) |
| 1.7 | 18.9 | GO:0051593 | response to folic acid(GO:0051593) |
| 1.7 | 15.5 | GO:0099562 | maintenance of postsynaptic specialization structure(GO:0098880) maintenance of postsynaptic density structure(GO:0099562) |
| 1.7 | 17.1 | GO:0032237 | activation of store-operated calcium channel activity(GO:0032237) positive regulation of store-operated calcium channel activity(GO:1901341) |
| 1.7 | 1.7 | GO:0090370 | negative regulation of cholesterol efflux(GO:0090370) |
| 1.7 | 3.4 | GO:0061181 | regulation of chondrocyte development(GO:0061181) |
| 1.7 | 10.2 | GO:0010571 | positive regulation of nuclear cell cycle DNA replication(GO:0010571) |
| 1.7 | 5.1 | GO:0045647 | negative regulation of erythrocyte differentiation(GO:0045647) |
| 1.7 | 8.4 | GO:0071557 | histone H3-K27 demethylation(GO:0071557) |
| 1.7 | 3.4 | GO:1900272 | negative regulation of long-term synaptic potentiation(GO:1900272) |
| 1.7 | 3.4 | GO:0002215 | defense response to nematode(GO:0002215) |
| 1.7 | 72.1 | GO:0038083 | peptidyl-tyrosine autophosphorylation(GO:0038083) |
| 1.7 | 6.7 | GO:0070842 | aggresome assembly(GO:0070842) |
| 1.7 | 15.1 | GO:1900017 | positive regulation of cytokine production involved in inflammatory response(GO:1900017) |
| 1.7 | 25.1 | GO:0006895 | Golgi to endosome transport(GO:0006895) |
| 1.7 | 16.7 | GO:0042182 | ketone catabolic process(GO:0042182) |
| 1.7 | 5.0 | GO:0019626 | short-chain fatty acid catabolic process(GO:0019626) |
| 1.7 | 14.9 | GO:0061042 | vascular wound healing(GO:0061042) |
| 1.7 | 16.6 | GO:0033127 | regulation of histone phosphorylation(GO:0033127) |
| 1.7 | 6.6 | GO:0032919 | spermine acetylation(GO:0032919) |
| 1.7 | 16.5 | GO:0043252 | sodium-independent organic anion transport(GO:0043252) |
| 1.7 | 6.6 | GO:1903576 | response to L-arginine(GO:1903576) |
| 1.6 | 13.2 | GO:0007023 | post-chaperonin tubulin folding pathway(GO:0007023) |
| 1.6 | 14.8 | GO:0052697 | xenobiotic glucuronidation(GO:0052697) |
| 1.6 | 4.9 | GO:2001183 | negative regulation of interleukin-12 secretion(GO:2001183) |
| 1.6 | 3.3 | GO:2001038 | regulation of cellular response to drug(GO:2001038) |
| 1.6 | 6.5 | GO:0001783 | B cell apoptotic process(GO:0001783) |
| 1.6 | 3.3 | GO:0043418 | homocysteine catabolic process(GO:0043418) |
| 1.6 | 9.7 | GO:0010838 | positive regulation of keratinocyte proliferation(GO:0010838) |
| 1.6 | 1.6 | GO:1903977 | positive regulation of glial cell migration(GO:1903977) |
| 1.6 | 1.6 | GO:0048861 | leukemia inhibitory factor signaling pathway(GO:0048861) |
| 1.6 | 8.0 | GO:0035279 | mRNA cleavage involved in gene silencing by miRNA(GO:0035279) mRNA cleavage involved in gene silencing(GO:0098795) |
| 1.6 | 6.4 | GO:0015801 | aromatic amino acid transport(GO:0015801) |
| 1.6 | 4.8 | GO:0000715 | nucleotide-excision repair, DNA damage recognition(GO:0000715) |
| 1.6 | 6.3 | GO:2000483 | negative regulation of interleukin-8 secretion(GO:2000483) |
| 1.6 | 4.7 | GO:0051660 | establishment of centrosome localization(GO:0051660) |
| 1.6 | 3.1 | GO:0006579 | amino-acid betaine catabolic process(GO:0006579) |
| 1.5 | 15.5 | GO:0060512 | prostate gland morphogenesis(GO:0060512) |
| 1.5 | 20.1 | GO:0006972 | hyperosmotic response(GO:0006972) |
| 1.5 | 3.1 | GO:1901509 | regulation of endothelial tube morphogenesis(GO:1901509) |
| 1.5 | 6.2 | GO:0097332 | response to antipsychotic drug(GO:0097332) |
| 1.5 | 1.5 | GO:0043382 | positive regulation of memory T cell differentiation(GO:0043382) |
| 1.5 | 3.1 | GO:0031585 | regulation of inositol 1,4,5-trisphosphate-sensitive calcium-release channel activity(GO:0031585) |
| 1.5 | 30.6 | GO:0006308 | DNA catabolic process(GO:0006308) |
| 1.5 | 19.9 | GO:0032814 | regulation of natural killer cell activation(GO:0032814) |
| 1.5 | 7.6 | GO:2000310 | regulation of N-methyl-D-aspartate selective glutamate receptor activity(GO:2000310) |
| 1.5 | 4.6 | GO:0032484 | Ral protein signal transduction(GO:0032484) |
| 1.5 | 4.5 | GO:0045357 | interferon-beta biosynthetic process(GO:0045350) regulation of interferon-beta biosynthetic process(GO:0045357) |
| 1.5 | 31.7 | GO:0007257 | activation of JUN kinase activity(GO:0007257) |
| 1.5 | 4.5 | GO:0000350 | generation of catalytic spliceosome for second transesterification step(GO:0000350) |
| 1.5 | 9.0 | GO:0042492 | gamma-delta T cell differentiation(GO:0042492) |
| 1.5 | 10.4 | GO:0098903 | regulation of membrane repolarization during action potential(GO:0098903) |
| 1.5 | 10.4 | GO:0002430 | complement receptor mediated signaling pathway(GO:0002430) |
| 1.5 | 4.4 | GO:1901844 | regulation of cell communication by electrical coupling involved in cardiac conduction(GO:1901844) |
| 1.5 | 3.0 | GO:0009756 | carbohydrate mediated signaling(GO:0009756) hexose mediated signaling(GO:0009757) sugar mediated signaling pathway(GO:0010182) glucose mediated signaling pathway(GO:0010255) |
| 1.5 | 26.6 | GO:0045671 | negative regulation of osteoclast differentiation(GO:0045671) |
| 1.5 | 8.9 | GO:0097435 | fibril organization(GO:0097435) |
| 1.5 | 1.5 | GO:1904017 | cellular response to Thyroglobulin triiodothyronine(GO:1904017) |
| 1.5 | 48.7 | GO:0018345 | protein palmitoylation(GO:0018345) |
| 1.5 | 1.5 | GO:0061588 | calcium activated phospholipid scrambling(GO:0061588) calcium activated phosphatidylcholine scrambling(GO:0061590) calcium activated galactosylceramide scrambling(GO:0061591) |
| 1.5 | 5.9 | GO:0001582 | detection of chemical stimulus involved in sensory perception of sweet taste(GO:0001582) |
| 1.5 | 2.9 | GO:0072602 | interleukin-4 secretion(GO:0072602) |
| 1.5 | 10.2 | GO:0030225 | macrophage differentiation(GO:0030225) |
| 1.5 | 4.4 | GO:0048263 | determination of dorsal identity(GO:0048263) |
| 1.4 | 1.4 | GO:0006272 | leading strand elongation(GO:0006272) |
| 1.4 | 13.0 | GO:0071294 | cellular response to zinc ion(GO:0071294) |
| 1.4 | 15.8 | GO:0030033 | microvillus assembly(GO:0030033) |
| 1.4 | 5.7 | GO:0097680 | double-strand break repair via classical nonhomologous end joining(GO:0097680) |
| 1.4 | 17.2 | GO:0006525 | arginine metabolic process(GO:0006525) |
| 1.4 | 47.2 | GO:0008333 | endosome to lysosome transport(GO:0008333) |
| 1.4 | 7.1 | GO:0033234 | negative regulation of protein sumoylation(GO:0033234) |
| 1.4 | 14.3 | GO:0000083 | regulation of transcription involved in G1/S transition of mitotic cell cycle(GO:0000083) |
| 1.4 | 4.3 | GO:0071929 | alpha-tubulin acetylation(GO:0071929) |
| 1.4 | 58.4 | GO:0044380 | protein localization to cytoskeleton(GO:0044380) |
| 1.4 | 19.9 | GO:1902043 | positive regulation of extrinsic apoptotic signaling pathway via death domain receptors(GO:1902043) |
| 1.4 | 2.8 | GO:0046947 | hydroxylysine metabolic process(GO:0046946) hydroxylysine biosynthetic process(GO:0046947) |
| 1.4 | 1.4 | GO:0035627 | ceramide transport(GO:0035627) |
| 1.4 | 40.7 | GO:0030593 | neutrophil chemotaxis(GO:0030593) |
| 1.4 | 4.2 | GO:0032058 | positive regulation of translational initiation in response to stress(GO:0032058) |
| 1.4 | 19.6 | GO:0014044 | Schwann cell development(GO:0014044) |
| 1.4 | 71.4 | GO:0050830 | defense response to Gram-positive bacterium(GO:0050830) |
| 1.4 | 1.4 | GO:0038128 | ERBB2 signaling pathway(GO:0038128) |
| 1.4 | 19.6 | GO:0045066 | regulatory T cell differentiation(GO:0045066) |
| 1.4 | 7.0 | GO:0017183 | peptidyl-diphthamide metabolic process(GO:0017182) peptidyl-diphthamide biosynthetic process from peptidyl-histidine(GO:0017183) |
| 1.4 | 23.6 | GO:0048013 | ephrin receptor signaling pathway(GO:0048013) |
| 1.4 | 4.2 | GO:0043321 | regulation of natural killer cell degranulation(GO:0043321) positive regulation of natural killer cell degranulation(GO:0043323) |
| 1.4 | 4.2 | GO:0090289 | apoptotic process in bone marrow(GO:0071839) regulation of osteoclast proliferation(GO:0090289) |
| 1.4 | 2.8 | GO:0030908 | intein-mediated protein splicing(GO:0016539) protein splicing(GO:0030908) |
| 1.4 | 8.2 | GO:0034315 | regulation of Arp2/3 complex-mediated actin nucleation(GO:0034315) |
| 1.4 | 5.5 | GO:1901298 | hydrogen peroxide-mediated programmed cell death(GO:0010421) programmed cell death in response to reactive oxygen species(GO:0097468) regulation of hydrogen peroxide-mediated programmed cell death(GO:1901298) |
| 1.4 | 13.7 | GO:0032793 | positive regulation of CREB transcription factor activity(GO:0032793) |
| 1.4 | 5.5 | GO:0060830 | ciliary receptor clustering involved in smoothened signaling pathway(GO:0060830) |
| 1.4 | 13.6 | GO:0045332 | lipid translocation(GO:0034204) phospholipid translocation(GO:0045332) |
| 1.4 | 17.7 | GO:0002250 | adaptive immune response(GO:0002250) |
| 1.3 | 4.0 | GO:1903966 | monounsaturated fatty acid metabolic process(GO:1903964) monounsaturated fatty acid biosynthetic process(GO:1903966) |
| 1.3 | 4.0 | GO:0051902 | negative regulation of mitochondrial depolarization(GO:0051902) negative regulation of membrane depolarization(GO:1904180) |
| 1.3 | 4.0 | GO:0043129 | surfactant homeostasis(GO:0043129) |
| 1.3 | 2.7 | GO:0051835 | positive regulation of synapse structural plasticity(GO:0051835) |
| 1.3 | 2.7 | GO:0010911 | regulation of isomerase activity(GO:0010911) positive regulation of isomerase activity(GO:0010912) regulation of DNA topoisomerase (ATP-hydrolyzing) activity(GO:2000371) positive regulation of DNA topoisomerase (ATP-hydrolyzing) activity(GO:2000373) |
| 1.3 | 2.7 | GO:0002741 | positive regulation of cytokine secretion involved in immune response(GO:0002741) |
| 1.3 | 11.8 | GO:0010919 | regulation of inositol phosphate biosynthetic process(GO:0010919) positive regulation of inositol phosphate biosynthetic process(GO:0060732) |
| 1.3 | 11.7 | GO:0019934 | cGMP-mediated signaling(GO:0019934) |
| 1.3 | 67.6 | GO:0030183 | B cell differentiation(GO:0030183) |
| 1.3 | 3.9 | GO:0071386 | cellular response to corticosterone stimulus(GO:0071386) |
| 1.3 | 20.6 | GO:0046339 | diacylglycerol metabolic process(GO:0046339) |
| 1.3 | 14.2 | GO:0014052 | regulation of gamma-aminobutyric acid secretion(GO:0014052) |
| 1.3 | 9.0 | GO:0061088 | sequestering of zinc ion(GO:0032119) regulation of sequestering of zinc ion(GO:0061088) |
| 1.3 | 8.9 | GO:0043011 | myeloid dendritic cell differentiation(GO:0043011) |
| 1.3 | 1.3 | GO:0051797 | regulation of hair follicle development(GO:0051797) |
| 1.3 | 3.8 | GO:1903575 | cornified envelope assembly(GO:1903575) |
| 1.3 | 2.5 | GO:0045683 | negative regulation of epidermis development(GO:0045683) |
| 1.3 | 11.4 | GO:0035871 | protein K11-linked deubiquitination(GO:0035871) |
| 1.3 | 1.3 | GO:0075509 | receptor-mediated endocytosis of virus by host cell(GO:0019065) endocytosis involved in viral entry into host cell(GO:0075509) |
| 1.3 | 5.0 | GO:2000074 | regulation of type B pancreatic cell development(GO:2000074) |
| 1.3 | 2.5 | GO:0016080 | synaptic vesicle targeting(GO:0016080) |
| 1.3 | 15.1 | GO:0070933 | histone H4 deacetylation(GO:0070933) |
| 1.3 | 16.3 | GO:0006851 | mitochondrial calcium ion transport(GO:0006851) |
| 1.2 | 2.5 | GO:0032915 | positive regulation of transforming growth factor beta2 production(GO:0032915) |
| 1.2 | 3.7 | GO:1902254 | negative regulation of intrinsic apoptotic signaling pathway by p53 class mediator(GO:1902254) |
| 1.2 | 11.2 | GO:0097150 | neuronal stem cell population maintenance(GO:0097150) |
| 1.2 | 5.0 | GO:2000253 | positive regulation of feeding behavior(GO:2000253) |
| 1.2 | 1.2 | GO:0045658 | regulation of neutrophil differentiation(GO:0045658) |
| 1.2 | 6.2 | GO:0031640 | killing of cells of other organism(GO:0031640) disruption of cells of other organism(GO:0044364) |
| 1.2 | 2.5 | GO:0045351 | type I interferon biosynthetic process(GO:0045351) |
| 1.2 | 6.1 | GO:1990416 | cellular response to brain-derived neurotrophic factor stimulus(GO:1990416) |
| 1.2 | 9.8 | GO:0048149 | behavioral response to ethanol(GO:0048149) |
| 1.2 | 4.9 | GO:0034421 | post-translational protein acetylation(GO:0034421) |
| 1.2 | 45.1 | GO:1900046 | regulation of blood coagulation(GO:0030193) regulation of hemostasis(GO:1900046) |
| 1.2 | 1.2 | GO:0002913 | positive regulation of T cell anergy(GO:0002669) positive regulation of lymphocyte anergy(GO:0002913) |
| 1.2 | 7.2 | GO:0030644 | cellular chloride ion homeostasis(GO:0030644) |
| 1.2 | 7.2 | GO:0061179 | negative regulation of insulin secretion involved in cellular response to glucose stimulus(GO:0061179) |
| 1.2 | 1.2 | GO:0001828 | inner cell mass cellular morphogenesis(GO:0001828) |
| 1.2 | 9.6 | GO:0000395 | mRNA 5'-splice site recognition(GO:0000395) |
| 1.2 | 7.2 | GO:0031115 | negative regulation of microtubule polymerization(GO:0031115) |
| 1.2 | 19.2 | GO:0006661 | phosphatidylinositol biosynthetic process(GO:0006661) |
| 1.2 | 13.1 | GO:0090382 | phagosome maturation(GO:0090382) |
| 1.2 | 7.2 | GO:1902230 | negative regulation of intrinsic apoptotic signaling pathway in response to DNA damage(GO:1902230) |
| 1.2 | 6.0 | GO:0021683 | cerebellar granular layer morphogenesis(GO:0021683) cerebellar granular layer formation(GO:0021684) cerebellar granule cell differentiation(GO:0021707) |
| 1.2 | 3.6 | GO:2000353 | positive regulation of endothelial cell apoptotic process(GO:2000353) |
| 1.2 | 5.9 | GO:0046602 | regulation of mitotic centrosome separation(GO:0046602) |
| 1.2 | 2.4 | GO:0071718 | sodium-independent icosanoid transport(GO:0071718) |
| 1.2 | 1.2 | GO:0048294 | negative regulation of isotype switching to IgE isotypes(GO:0048294) |
| 1.2 | 3.5 | GO:0045723 | positive regulation of fatty acid biosynthetic process(GO:0045723) |
| 1.2 | 60.8 | GO:0031532 | actin cytoskeleton reorganization(GO:0031532) |
| 1.2 | 14.0 | GO:0035067 | negative regulation of histone acetylation(GO:0035067) |
| 1.2 | 3.5 | GO:0051697 | protein delipidation(GO:0051697) |
| 1.2 | 7.0 | GO:2001275 | positive regulation of glucose import in response to insulin stimulus(GO:2001275) |
| 1.2 | 33.7 | GO:0035987 | endodermal cell differentiation(GO:0035987) |
| 1.2 | 8.1 | GO:0014886 | transition between slow and fast fiber(GO:0014886) |
| 1.1 | 1.1 | GO:0010454 | negative regulation of cell fate commitment(GO:0010454) |
| 1.1 | 3.4 | GO:2000774 | positive regulation of cellular senescence(GO:2000774) |
| 1.1 | 3.4 | GO:0043324 | eye pigment metabolic process(GO:0042441) pigment metabolic process involved in developmental pigmentation(GO:0043324) pigment metabolic process involved in pigmentation(GO:0043474) rhodopsin metabolic process(GO:0046154) |
| 1.1 | 3.4 | GO:0009758 | carbohydrate utilization(GO:0009758) |
| 1.1 | 2.3 | GO:0019348 | dolichol metabolic process(GO:0019348) |
| 1.1 | 3.4 | GO:0035694 | mitochondrial protein catabolic process(GO:0035694) |
| 1.1 | 18.3 | GO:0043507 | positive regulation of JUN kinase activity(GO:0043507) |
| 1.1 | 2.3 | GO:1901187 | regulation of ephrin receptor signaling pathway(GO:1901187) |
| 1.1 | 3.4 | GO:0032957 | inositol trisphosphate metabolic process(GO:0032957) |
| 1.1 | 5.6 | GO:0071409 | cellular response to cycloheximide(GO:0071409) |
| 1.1 | 4.5 | GO:0030311 | poly-N-acetyllactosamine metabolic process(GO:0030309) poly-N-acetyllactosamine biosynthetic process(GO:0030311) |
| 1.1 | 5.6 | GO:0017121 | phospholipid scrambling(GO:0017121) |
| 1.1 | 2.2 | GO:0051533 | positive regulation of NFAT protein import into nucleus(GO:0051533) |
| 1.1 | 36.7 | GO:0046839 | phospholipid dephosphorylation(GO:0046839) |
| 1.1 | 4.4 | GO:1904354 | negative regulation of telomere capping(GO:1904354) |
| 1.1 | 11.0 | GO:0036065 | fucosylation(GO:0036065) |
| 1.1 | 1.1 | GO:1902037 | negative regulation of hematopoietic stem cell differentiation(GO:1902037) |
| 1.1 | 2.2 | GO:0015820 | leucine transport(GO:0015820) |
| 1.1 | 2.2 | GO:1903525 | regulation of membrane tubulation(GO:1903525) |
| 1.1 | 13.1 | GO:0031573 | intra-S DNA damage checkpoint(GO:0031573) |
| 1.1 | 2.2 | GO:1903976 | negative regulation of glial cell migration(GO:1903976) |
| 1.1 | 9.8 | GO:0042559 | pteridine-containing compound biosynthetic process(GO:0042559) |
| 1.1 | 2.2 | GO:0070375 | ERK5 cascade(GO:0070375) |
| 1.1 | 6.5 | GO:2001270 | regulation of cysteine-type endopeptidase activity involved in execution phase of apoptosis(GO:2001270) negative regulation of cysteine-type endopeptidase activity involved in execution phase of apoptosis(GO:2001271) |
| 1.1 | 3.2 | GO:0009133 | nucleoside diphosphate biosynthetic process(GO:0009133) |
| 1.1 | 4.3 | GO:0006369 | termination of RNA polymerase II transcription(GO:0006369) |
| 1.1 | 69.0 | GO:0019882 | antigen processing and presentation(GO:0019882) |
| 1.1 | 5.4 | GO:0071318 | cellular response to ATP(GO:0071318) |
| 1.1 | 25.7 | GO:0002260 | lymphocyte homeostasis(GO:0002260) |
| 1.1 | 6.4 | GO:0042148 | strand invasion(GO:0042148) |
| 1.1 | 7.5 | GO:1902042 | negative regulation of extrinsic apoptotic signaling pathway via death domain receptors(GO:1902042) |
| 1.1 | 2.1 | GO:0030299 | intestinal cholesterol absorption(GO:0030299) |
| 1.1 | 3.2 | GO:0070343 | white fat cell proliferation(GO:0070343) regulation of white fat cell proliferation(GO:0070350) |
| 1.1 | 3.2 | GO:0035234 | ectopic germ cell programmed cell death(GO:0035234) |
| 1.1 | 13.8 | GO:0070228 | regulation of lymphocyte apoptotic process(GO:0070228) |
| 1.1 | 7.4 | GO:0002861 | regulation of inflammatory response to antigenic stimulus(GO:0002861) |
| 1.1 | 10.6 | GO:0045002 | DNA double-strand break processing involved in repair via single-strand annealing(GO:0010792) double-strand break repair via single-strand annealing(GO:0045002) |
| 1.1 | 15.9 | GO:0030866 | cortical actin cytoskeleton organization(GO:0030866) |
| 1.1 | 2.1 | GO:1902336 | positive regulation of retinal ganglion cell axon guidance(GO:1902336) |
| 1.1 | 34.0 | GO:0006505 | GPI anchor metabolic process(GO:0006505) |
| 1.1 | 4.2 | GO:0042635 | positive regulation of hair cycle(GO:0042635) |
| 1.0 | 4.2 | GO:0040033 | miRNA mediated inhibition of translation(GO:0035278) negative regulation of translation, ncRNA-mediated(GO:0040033) regulation of translation, ncRNA-mediated(GO:0045974) |
| 1.0 | 22.0 | GO:0009225 | nucleotide-sugar metabolic process(GO:0009225) |
| 1.0 | 10.4 | GO:0031293 | membrane protein intracellular domain proteolysis(GO:0031293) |
| 1.0 | 3.1 | GO:0039530 | MDA-5 signaling pathway(GO:0039530) |
| 1.0 | 3.1 | GO:0035754 | B cell chemotaxis(GO:0035754) |
| 1.0 | 5.2 | GO:0035589 | G-protein coupled purinergic nucleotide receptor signaling pathway(GO:0035589) |
| 1.0 | 7.3 | GO:0035455 | response to interferon-alpha(GO:0035455) |
| 1.0 | 3.1 | GO:0071494 | cellular response to UV-C(GO:0071494) |
| 1.0 | 1.0 | GO:1902035 | positive regulation of hematopoietic stem cell proliferation(GO:1902035) |
| 1.0 | 4.1 | GO:0001579 | medium-chain fatty acid transport(GO:0001579) |
| 1.0 | 11.3 | GO:0019511 | peptidyl-proline hydroxylation(GO:0019511) |
| 1.0 | 1.0 | GO:2000053 | regulation of Wnt signaling pathway involved in dorsal/ventral axis specification(GO:2000053) |
| 1.0 | 6.1 | GO:0060159 | regulation of dopamine receptor signaling pathway(GO:0060159) |
| 1.0 | 7.1 | GO:0031643 | positive regulation of myelination(GO:0031643) |
| 1.0 | 2.0 | GO:0021678 | third ventricle development(GO:0021678) |
| 1.0 | 23.2 | GO:0051453 | regulation of intracellular pH(GO:0051453) |
| 1.0 | 1.0 | GO:0032056 | positive regulation of translation in response to stress(GO:0032056) |
| 1.0 | 2.0 | GO:1904796 | regulation of core promoter binding(GO:1904796) positive regulation of core promoter binding(GO:1904798) |
| 1.0 | 22.0 | GO:0014003 | oligodendrocyte development(GO:0014003) |
| 1.0 | 2.0 | GO:0042908 | xenobiotic transport(GO:0042908) |
| 1.0 | 2.0 | GO:0001866 | NK T cell proliferation(GO:0001866) |
| 1.0 | 2.9 | GO:0032218 | riboflavin transport(GO:0032218) |
| 1.0 | 2.9 | GO:0002692 | negative regulation of cellular extravasation(GO:0002692) |
| 1.0 | 2.9 | GO:0033299 | secretion of lysosomal enzymes(GO:0033299) |
| 1.0 | 18.5 | GO:0045806 | negative regulation of endocytosis(GO:0045806) |
| 1.0 | 1.9 | GO:0021869 | forebrain ventricular zone progenitor cell division(GO:0021869) |
| 1.0 | 1.9 | GO:0021530 | spinal cord oligodendrocyte cell differentiation(GO:0021529) spinal cord oligodendrocyte cell fate specification(GO:0021530) |
| 1.0 | 8.7 | GO:0030206 | chondroitin sulfate biosynthetic process(GO:0030206) |
| 1.0 | 1.0 | GO:0034146 | toll-like receptor 5 signaling pathway(GO:0034146) |
| 1.0 | 6.7 | GO:0035879 | plasma membrane lactate transport(GO:0035879) |
| 1.0 | 4.8 | GO:1990440 | positive regulation of transcription from RNA polymerase II promoter in response to endoplasmic reticulum stress(GO:1990440) |
| 1.0 | 1.9 | GO:1900118 | negative regulation of execution phase of apoptosis(GO:1900118) |
| 1.0 | 5.7 | GO:0038169 | somatostatin receptor signaling pathway(GO:0038169) somatostatin signaling pathway(GO:0038170) |
| 1.0 | 2.9 | GO:0038165 | oncostatin-M-mediated signaling pathway(GO:0038165) |
| 1.0 | 11.4 | GO:0060716 | labyrinthine layer blood vessel development(GO:0060716) |
| 1.0 | 2.9 | GO:0042985 | negative regulation of amyloid precursor protein biosynthetic process(GO:0042985) |
| 0.9 | 6.6 | GO:0061099 | negative regulation of protein tyrosine kinase activity(GO:0061099) |
| 0.9 | 5.7 | GO:0090367 | regulation of mRNA modification(GO:0090365) negative regulation of mRNA modification(GO:0090367) |
| 0.9 | 9.4 | GO:2001241 | positive regulation of extrinsic apoptotic signaling pathway in absence of ligand(GO:2001241) |
| 0.9 | 1.9 | GO:2001166 | regulation of histone H2B ubiquitination(GO:2001166) positive regulation of histone H2B ubiquitination(GO:2001168) |
| 0.9 | 3.7 | GO:0033689 | negative regulation of osteoblast proliferation(GO:0033689) |
| 0.9 | 7.4 | GO:0030903 | notochord development(GO:0030903) |
| 0.9 | 4.6 | GO:0042659 | regulation of cell fate specification(GO:0042659) |
| 0.9 | 3.7 | GO:0043985 | histone H4-R3 methylation(GO:0043985) |
| 0.9 | 15.5 | GO:0007032 | endosome organization(GO:0007032) |
| 0.9 | 31.7 | GO:0016126 | sterol biosynthetic process(GO:0016126) |
| 0.9 | 4.5 | GO:0030853 | negative regulation of granulocyte differentiation(GO:0030853) |
| 0.9 | 4.5 | GO:0019471 | 4-hydroxyproline metabolic process(GO:0019471) |
| 0.9 | 4.5 | GO:0032757 | positive regulation of interleukin-8 production(GO:0032757) |
| 0.9 | 18.9 | GO:0002687 | positive regulation of leukocyte migration(GO:0002687) |
| 0.9 | 14.4 | GO:0006911 | phagocytosis, engulfment(GO:0006911) |
| 0.9 | 6.3 | GO:1900262 | regulation of DNA-directed DNA polymerase activity(GO:1900262) positive regulation of DNA-directed DNA polymerase activity(GO:1900264) |
| 0.9 | 5.4 | GO:0070327 | thyroid hormone transport(GO:0070327) |
| 0.9 | 3.6 | GO:0035336 | long-chain fatty-acyl-CoA metabolic process(GO:0035336) |
| 0.9 | 3.6 | GO:0007220 | Notch receptor processing(GO:0007220) |
| 0.9 | 12.4 | GO:0090280 | positive regulation of calcium ion import(GO:0090280) |
| 0.9 | 15.0 | GO:0006730 | one-carbon metabolic process(GO:0006730) |
| 0.9 | 15.0 | GO:0006958 | complement activation, classical pathway(GO:0006958) |
| 0.9 | 0.9 | GO:0060017 | parathyroid gland development(GO:0060017) |
| 0.9 | 1.7 | GO:2001268 | negative regulation of cysteine-type endopeptidase activity involved in apoptotic signaling pathway(GO:2001268) |
| 0.9 | 2.6 | GO:0031053 | primary miRNA processing(GO:0031053) |
| 0.9 | 17.2 | GO:0071353 | cellular response to interleukin-4(GO:0071353) |
| 0.9 | 2.6 | GO:0046833 | positive regulation of RNA export from nucleus(GO:0046833) |
| 0.9 | 5.1 | GO:0060318 | regulation of definitive erythrocyte differentiation(GO:0010724) definitive erythrocyte differentiation(GO:0060318) |
| 0.9 | 6.8 | GO:0006269 | DNA replication, synthesis of RNA primer(GO:0006269) |
| 0.8 | 5.1 | GO:0038063 | collagen-activated tyrosine kinase receptor signaling pathway(GO:0038063) |
| 0.8 | 109.0 | GO:0006898 | receptor-mediated endocytosis(GO:0006898) |
| 0.8 | 4.2 | GO:0010815 | bradykinin catabolic process(GO:0010815) |
| 0.8 | 6.7 | GO:0015760 | hexose phosphate transport(GO:0015712) glucose-6-phosphate transport(GO:0015760) |
| 0.8 | 5.8 | GO:0038179 | neurotrophin signaling pathway(GO:0038179) |
| 0.8 | 10.0 | GO:0006687 | glycosphingolipid metabolic process(GO:0006687) |
| 0.8 | 1.7 | GO:1901722 | regulation of cell proliferation involved in kidney development(GO:1901722) |
| 0.8 | 6.6 | GO:0006620 | posttranslational protein targeting to membrane(GO:0006620) |
| 0.8 | 2.5 | GO:0045061 | thymic T cell selection(GO:0045061) |
| 0.8 | 1.7 | GO:0090283 | regulation of protein glycosylation in Golgi(GO:0090283) |
| 0.8 | 3.3 | GO:0030917 | midbrain-hindbrain boundary development(GO:0030917) |
| 0.8 | 1.6 | GO:0034349 | glial cell apoptotic process(GO:0034349) |
| 0.8 | 4.1 | GO:0001921 | positive regulation of receptor recycling(GO:0001921) |
| 0.8 | 8.2 | GO:1902743 | regulation of lamellipodium organization(GO:1902743) |
| 0.8 | 4.1 | GO:0045730 | respiratory burst(GO:0045730) |
| 0.8 | 2.4 | GO:0080009 | mRNA methylation(GO:0080009) |
| 0.8 | 6.4 | GO:0017145 | stem cell division(GO:0017145) |
| 0.8 | 2.4 | GO:2000696 | regulation of epithelial cell differentiation involved in kidney development(GO:2000696) |
| 0.8 | 0.8 | GO:0072102 | glomerulus morphogenesis(GO:0072102) |
| 0.8 | 39.8 | GO:0043123 | positive regulation of I-kappaB kinase/NF-kappaB signaling(GO:0043123) |
| 0.8 | 1.6 | GO:0010804 | negative regulation of tumor necrosis factor-mediated signaling pathway(GO:0010804) |
| 0.8 | 57.0 | GO:1902017 | regulation of cilium assembly(GO:1902017) |
| 0.8 | 3.2 | GO:1904322 | response to forskolin(GO:1904321) cellular response to forskolin(GO:1904322) |
| 0.8 | 3.1 | GO:0019074 | viral genome packaging(GO:0019072) viral RNA genome packaging(GO:0019074) positive regulation of phospholipid biosynthetic process(GO:0071073) |
| 0.8 | 23.4 | GO:0018149 | peptide cross-linking(GO:0018149) |
| 0.8 | 0.8 | GO:1904908 | negative regulation of maintenance of sister chromatid cohesion(GO:0034092) negative regulation of maintenance of mitotic sister chromatid cohesion(GO:0034183) maintenance of mitotic sister chromatid cohesion, telomeric(GO:0099403) mitotic sister chromatid cohesion, telomeric(GO:0099404) regulation of maintenance of mitotic sister chromatid cohesion, telomeric(GO:1904907) negative regulation of maintenance of mitotic sister chromatid cohesion, telomeric(GO:1904908) |
| 0.8 | 5.4 | GO:0006384 | transcription initiation from RNA polymerase III promoter(GO:0006384) |
| 0.8 | 9.3 | GO:0046597 | negative regulation of viral entry into host cell(GO:0046597) |
| 0.8 | 23.1 | GO:0010811 | positive regulation of cell-substrate adhesion(GO:0010811) |
| 0.7 | 1.5 | GO:0061188 | regulation of chromatin silencing at rDNA(GO:0061187) negative regulation of chromatin silencing at rDNA(GO:0061188) |
| 0.7 | 3.7 | GO:0051601 | exocyst localization(GO:0051601) |
| 0.7 | 5.9 | GO:0046579 | positive regulation of Ras protein signal transduction(GO:0046579) |
| 0.7 | 2.9 | GO:0060315 | negative regulation of ryanodine-sensitive calcium-release channel activity(GO:0060315) |
| 0.7 | 3.7 | GO:0051044 | positive regulation of membrane protein ectodomain proteolysis(GO:0051044) |
| 0.7 | 10.2 | GO:0045653 | negative regulation of megakaryocyte differentiation(GO:0045653) |
| 0.7 | 0.7 | GO:0048842 | positive regulation of axon extension involved in axon guidance(GO:0048842) |
| 0.7 | 3.6 | GO:0016078 | tRNA catabolic process(GO:0016078) |
| 0.7 | 4.2 | GO:0031284 | regulation of guanylate cyclase activity(GO:0031282) positive regulation of guanylate cyclase activity(GO:0031284) |
| 0.7 | 2.1 | GO:0006543 | glutamine catabolic process(GO:0006543) |
| 0.7 | 3.4 | GO:0019521 | aldonic acid metabolic process(GO:0019520) D-gluconate metabolic process(GO:0019521) |
| 0.7 | 2.7 | GO:0072530 | purine-containing compound transmembrane transport(GO:0072530) |
| 0.7 | 1.4 | GO:0042756 | drinking behavior(GO:0042756) |
| 0.7 | 5.4 | GO:0046116 | queuosine biosynthetic process(GO:0008616) queuosine metabolic process(GO:0046116) |
| 0.7 | 3.4 | GO:0048505 | regulation of timing of cell differentiation(GO:0048505) |
| 0.7 | 2.0 | GO:0021590 | cerebellum maturation(GO:0021590) cerebellar cortex maturation(GO:0021699) |
| 0.7 | 2.0 | GO:0033262 | regulation of nuclear cell cycle DNA replication(GO:0033262) |
| 0.7 | 4.0 | GO:0060143 | positive regulation of syncytium formation by plasma membrane fusion(GO:0060143) |
| 0.7 | 10.7 | GO:0050435 | beta-amyloid metabolic process(GO:0050435) |
| 0.7 | 1.3 | GO:0035405 | histone-threonine phosphorylation(GO:0035405) |
| 0.7 | 5.3 | GO:0048733 | sebaceous gland development(GO:0048733) |
| 0.7 | 18.4 | GO:0007189 | adenylate cyclase-activating G-protein coupled receptor signaling pathway(GO:0007189) |
| 0.7 | 2.0 | GO:0033385 | geranyl diphosphate metabolic process(GO:0033383) geranyl diphosphate biosynthetic process(GO:0033384) geranylgeranyl diphosphate metabolic process(GO:0033385) geranylgeranyl diphosphate biosynthetic process(GO:0033386) farnesyl diphosphate biosynthetic process(GO:0045337) |
| 0.7 | 2.0 | GO:0033132 | negative regulation of glucokinase activity(GO:0033132) negative regulation of hexokinase activity(GO:1903300) |
| 0.7 | 5.2 | GO:0060965 | negative regulation of gene silencing by miRNA(GO:0060965) |
| 0.6 | 3.2 | GO:0060770 | epithelial cell proliferation involved in prostate gland development(GO:0060767) regulation of epithelial cell proliferation involved in prostate gland development(GO:0060768) negative regulation of epithelial cell proliferation involved in prostate gland development(GO:0060770) |
| 0.6 | 1.9 | GO:0032506 | cytokinetic process(GO:0032506) |
| 0.6 | 7.1 | GO:0071285 | cellular response to lithium ion(GO:0071285) |
| 0.6 | 5.8 | GO:0031935 | regulation of chromatin silencing(GO:0031935) |
| 0.6 | 5.8 | GO:0031641 | regulation of myelination(GO:0031641) |
| 0.6 | 2.5 | GO:0070537 | histone H2A K63-linked deubiquitination(GO:0070537) |
| 0.6 | 1.9 | GO:0000389 | mRNA 3'-splice site recognition(GO:0000389) |
| 0.6 | 8.8 | GO:0015721 | bile acid and bile salt transport(GO:0015721) |
| 0.6 | 15.1 | GO:0042491 | auditory receptor cell differentiation(GO:0042491) |
| 0.6 | 4.4 | GO:0016576 | histone dephosphorylation(GO:0016576) |
| 0.6 | 0.6 | GO:0031584 | activation of phospholipase D activity(GO:0031584) |
| 0.6 | 1.2 | GO:0045652 | regulation of megakaryocyte differentiation(GO:0045652) |
| 0.6 | 3.7 | GO:0099612 | protein localization to axon(GO:0099612) |
| 0.6 | 18.2 | GO:1902850 | microtubule cytoskeleton organization involved in mitosis(GO:1902850) |
| 0.6 | 1.8 | GO:1900095 | random inactivation of X chromosome(GO:0060816) regulation of dosage compensation by inactivation of X chromosome(GO:1900095) |
| 0.6 | 4.2 | GO:0071364 | cellular response to epidermal growth factor stimulus(GO:0071364) |
| 0.6 | 7.2 | GO:0050691 | regulation of defense response to virus by host(GO:0050691) |
| 0.6 | 0.6 | GO:0006408 | snRNA export from nucleus(GO:0006408) |
| 0.6 | 13.1 | GO:0000188 | inactivation of MAPK activity(GO:0000188) |
| 0.6 | 3.6 | GO:0035721 | intraciliary retrograde transport(GO:0035721) |
| 0.6 | 2.4 | GO:0009052 | pentose-phosphate shunt, non-oxidative branch(GO:0009052) |
| 0.6 | 1.2 | GO:0044791 | modulation by host of viral release from host cell(GO:0044789) positive regulation by host of viral release from host cell(GO:0044791) |
| 0.6 | 59.1 | GO:0072659 | protein localization to plasma membrane(GO:0072659) |
| 0.6 | 1.2 | GO:1902172 | keratinocyte apoptotic process(GO:0097283) regulation of keratinocyte apoptotic process(GO:1902172) |
| 0.6 | 3.0 | GO:1901621 | negative regulation of smoothened signaling pathway involved in dorsal/ventral neural tube patterning(GO:1901621) |
| 0.6 | 2.9 | GO:0060749 | mammary gland alveolus development(GO:0060749) mammary gland lobule development(GO:0061377) |
| 0.6 | 3.5 | GO:0046827 | positive regulation of protein export from nucleus(GO:0046827) |
| 0.6 | 22.1 | GO:0051092 | positive regulation of NF-kappaB transcription factor activity(GO:0051092) |
| 0.6 | 1.7 | GO:0033600 | negative regulation of mammary gland epithelial cell proliferation(GO:0033600) |
| 0.6 | 1.2 | GO:0045105 | intermediate filament polymerization or depolymerization(GO:0045105) |
| 0.6 | 3.5 | GO:0042136 | neurotransmitter biosynthetic process(GO:0042136) |
| 0.6 | 0.6 | GO:0001773 | myeloid dendritic cell activation(GO:0001773) |
| 0.6 | 2.9 | GO:1990592 | protein polyufmylation(GO:1990564) protein K69-linked ufmylation(GO:1990592) |
| 0.6 | 1.1 | GO:0035735 | intraciliary transport involved in cilium morphogenesis(GO:0035735) |
| 0.6 | 3.4 | GO:0046415 | urate metabolic process(GO:0046415) |
| 0.6 | 1.7 | GO:0046098 | guanine metabolic process(GO:0046098) |
| 0.6 | 1.1 | GO:0007190 | activation of adenylate cyclase activity(GO:0007190) |
| 0.6 | 2.3 | GO:1904386 | response to L-phenylalanine derivative(GO:1904386) |
| 0.6 | 2.2 | GO:0007171 | activation of transmembrane receptor protein tyrosine kinase activity(GO:0007171) |
| 0.6 | 3.9 | GO:0001938 | positive regulation of endothelial cell proliferation(GO:0001938) |
| 0.5 | 3.8 | GO:0034773 | histone H4-K20 trimethylation(GO:0034773) |
| 0.5 | 2.2 | GO:1900273 | positive regulation of long-term synaptic potentiation(GO:1900273) |
| 0.5 | 14.0 | GO:0006904 | vesicle docking involved in exocytosis(GO:0006904) |
| 0.5 | 10.2 | GO:0048286 | lung alveolus development(GO:0048286) |
| 0.5 | 1.6 | GO:0045920 | negative regulation of exocytosis(GO:0045920) |
| 0.5 | 0.5 | GO:0071869 | response to catecholamine(GO:0071869) |
| 0.5 | 0.5 | GO:0043654 | recognition of apoptotic cell(GO:0043654) |
| 0.5 | 6.9 | GO:0030032 | lamellipodium assembly(GO:0030032) |
| 0.5 | 2.1 | GO:0044211 | CTP salvage(GO:0044211) |
| 0.5 | 12.6 | GO:0045071 | negative regulation of viral genome replication(GO:0045071) |
| 0.5 | 3.1 | GO:0050829 | defense response to Gram-negative bacterium(GO:0050829) |
| 0.5 | 4.2 | GO:1990126 | retrograde transport, endosome to plasma membrane(GO:1990126) |
| 0.5 | 2.1 | GO:0044598 | polyketide metabolic process(GO:0030638) aminoglycoside antibiotic metabolic process(GO:0030647) daunorubicin metabolic process(GO:0044597) doxorubicin metabolic process(GO:0044598) |
| 0.5 | 3.1 | GO:0071157 | negative regulation of cell cycle arrest(GO:0071157) |
| 0.5 | 6.1 | GO:0030574 | collagen catabolic process(GO:0030574) |
| 0.5 | 4.1 | GO:0005513 | detection of calcium ion(GO:0005513) |
| 0.5 | 2.0 | GO:0033160 | positive regulation of protein import into nucleus, translocation(GO:0033160) |
| 0.5 | 1.0 | GO:0010157 | response to chlorate(GO:0010157) |
| 0.5 | 10.7 | GO:0006909 | phagocytosis(GO:0006909) |
| 0.5 | 6.1 | GO:0080182 | histone H3-K4 trimethylation(GO:0080182) |
| 0.5 | 1.5 | GO:1903232 | melanosome assembly(GO:1903232) |
| 0.5 | 3.5 | GO:1900113 | negative regulation of histone H3-K9 trimethylation(GO:1900113) |
| 0.5 | 21.9 | GO:0007599 | hemostasis(GO:0007599) |
| 0.5 | 8.5 | GO:0042073 | intraciliary transport(GO:0042073) |
| 0.5 | 1.0 | GO:2001170 | negative regulation of ATP biosynthetic process(GO:2001170) negative regulation of glucose import in response to insulin stimulus(GO:2001274) |
| 0.5 | 3.5 | GO:0060272 | embryonic skeletal joint morphogenesis(GO:0060272) |
| 0.5 | 2.0 | GO:0071872 | cellular response to epinephrine stimulus(GO:0071872) |
| 0.5 | 3.4 | GO:0050710 | negative regulation of cytokine secretion(GO:0050710) |
| 0.5 | 3.4 | GO:1903053 | regulation of extracellular matrix organization(GO:1903053) |
| 0.5 | 54.8 | GO:0098742 | cell-cell adhesion via plasma-membrane adhesion molecules(GO:0098742) |
| 0.5 | 4.4 | GO:0043923 | positive regulation by host of viral transcription(GO:0043923) |
| 0.5 | 1.5 | GO:0006659 | phosphatidylserine biosynthetic process(GO:0006659) |
| 0.5 | 3.4 | GO:0030259 | lipid glycosylation(GO:0030259) |
| 0.5 | 1.0 | GO:0060729 | intestinal epithelial structure maintenance(GO:0060729) |
| 0.5 | 10.7 | GO:0019373 | epoxygenase P450 pathway(GO:0019373) |
| 0.5 | 1.5 | GO:0070318 | positive regulation of G0 to G1 transition(GO:0070318) |
| 0.5 | 1.0 | GO:0035315 | hair cell differentiation(GO:0035315) |
| 0.5 | 1.4 | GO:0070309 | lens fiber cell morphogenesis(GO:0070309) |
| 0.5 | 3.4 | GO:0015812 | gamma-aminobutyric acid transport(GO:0015812) |
| 0.5 | 1.4 | GO:0015822 | ornithine transport(GO:0015822) |
| 0.5 | 0.9 | GO:0010248 | establishment or maintenance of transmembrane electrochemical gradient(GO:0010248) |
| 0.5 | 4.7 | GO:0032780 | negative regulation of ATPase activity(GO:0032780) |
| 0.5 | 1.4 | GO:1902591 | single-organism membrane budding(GO:1902591) |
| 0.5 | 0.9 | GO:0046112 | nucleobase biosynthetic process(GO:0046112) |
| 0.5 | 1.4 | GO:0061045 | negative regulation of wound healing(GO:0061045) |
| 0.5 | 6.9 | GO:1901998 | toxin transport(GO:1901998) |
| 0.5 | 22.9 | GO:0030217 | T cell differentiation(GO:0030217) |
| 0.5 | 0.9 | GO:0048333 | mesodermal cell differentiation(GO:0048333) |
| 0.5 | 0.5 | GO:0006971 | hypotonic response(GO:0006971) cellular hypotonic response(GO:0071476) |
| 0.5 | 4.5 | GO:0070266 | necroptotic process(GO:0070266) |
| 0.5 | 9.5 | GO:0050707 | regulation of cytokine secretion(GO:0050707) |
| 0.5 | 3.6 | GO:0048280 | vesicle fusion with Golgi apparatus(GO:0048280) |
| 0.4 | 7.1 | GO:0006336 | DNA replication-independent nucleosome assembly(GO:0006336) |
| 0.4 | 0.9 | GO:0044068 | modulation by symbiont of host cellular process(GO:0044068) |
| 0.4 | 3.5 | GO:2001238 | positive regulation of extrinsic apoptotic signaling pathway(GO:2001238) |
| 0.4 | 5.7 | GO:0006892 | post-Golgi vesicle-mediated transport(GO:0006892) |
| 0.4 | 4.4 | GO:0014009 | glial cell proliferation(GO:0014009) |
| 0.4 | 3.4 | GO:0071625 | vocalization behavior(GO:0071625) |
| 0.4 | 2.5 | GO:0031848 | protection from non-homologous end joining at telomere(GO:0031848) |
| 0.4 | 0.4 | GO:0048199 | vesicle targeting, to, from or within Golgi(GO:0048199) |
| 0.4 | 17.9 | GO:0045216 | cell-cell junction organization(GO:0045216) |
| 0.4 | 1.7 | GO:0071169 | establishment of protein localization to chromatin(GO:0071169) |
| 0.4 | 0.4 | GO:0051987 | positive regulation of attachment of spindle microtubules to kinetochore(GO:0051987) |
| 0.4 | 2.0 | GO:0036342 | post-anal tail morphogenesis(GO:0036342) |
| 0.4 | 2.0 | GO:0035414 | negative regulation of catenin import into nucleus(GO:0035414) |
| 0.4 | 2.0 | GO:1901029 | negative regulation of mitochondrial outer membrane permeabilization involved in apoptotic signaling pathway(GO:1901029) |
| 0.4 | 4.0 | GO:1901409 | regulation of phosphorylation of RNA polymerase II C-terminal domain(GO:1901407) positive regulation of phosphorylation of RNA polymerase II C-terminal domain(GO:1901409) |
| 0.4 | 4.0 | GO:0051569 | regulation of histone H3-K4 methylation(GO:0051569) |
| 0.4 | 2.0 | GO:0030174 | regulation of DNA-dependent DNA replication initiation(GO:0030174) |
| 0.4 | 2.8 | GO:0035634 | response to stilbenoid(GO:0035634) |
| 0.4 | 0.4 | GO:0010936 | negative regulation of macrophage cytokine production(GO:0010936) |
| 0.4 | 2.7 | GO:0010606 | positive regulation of cytoplasmic mRNA processing body assembly(GO:0010606) |
| 0.4 | 1.2 | GO:0002225 | positive regulation of antimicrobial peptide production(GO:0002225) positive regulation of antibacterial peptide production(GO:0002803) |
| 0.4 | 1.6 | GO:0010470 | regulation of gastrulation(GO:0010470) |
| 0.4 | 7.0 | GO:0006270 | DNA replication initiation(GO:0006270) |
| 0.4 | 10.0 | GO:0014065 | phosphatidylinositol 3-kinase signaling(GO:0014065) |
| 0.4 | 2.7 | GO:0018377 | protein myristoylation(GO:0018377) |
| 0.4 | 1.9 | GO:0034498 | early endosome to Golgi transport(GO:0034498) |
| 0.4 | 0.8 | GO:0032703 | negative regulation of interleukin-2 production(GO:0032703) |
| 0.4 | 1.1 | GO:2000051 | negative regulation of non-canonical Wnt signaling pathway(GO:2000051) |
| 0.4 | 3.7 | GO:0098743 | cartilage condensation(GO:0001502) cell aggregation(GO:0098743) |
| 0.4 | 19.5 | GO:0006487 | protein N-linked glycosylation(GO:0006487) |
| 0.4 | 2.2 | GO:1990035 | calcium ion import across plasma membrane(GO:0098703) calcium ion import into cell(GO:1990035) |
| 0.4 | 1.8 | GO:0002002 | regulation of angiotensin levels in blood(GO:0002002) |
| 0.4 | 0.7 | GO:0043562 | cellular response to nitrogen starvation(GO:0006995) cellular response to nitrogen levels(GO:0043562) |
| 0.4 | 5.7 | GO:0046834 | lipid phosphorylation(GO:0046834) |
| 0.4 | 1.8 | GO:0000729 | DNA double-strand break processing(GO:0000729) |
| 0.4 | 17.5 | GO:0010833 | telomere maintenance via telomere lengthening(GO:0010833) |
| 0.4 | 2.5 | GO:2000766 | negative regulation of cytoplasmic translation(GO:2000766) |
| 0.4 | 1.8 | GO:0001842 | neural fold formation(GO:0001842) |
| 0.3 | 0.3 | GO:0006501 | C-terminal protein lipidation(GO:0006501) |
| 0.3 | 3.3 | GO:2000234 | positive regulation of ribosome biogenesis(GO:0090070) positive regulation of rRNA processing(GO:2000234) |
| 0.3 | 2.0 | GO:0060040 | retinal bipolar neuron differentiation(GO:0060040) |
| 0.3 | 4.0 | GO:2000780 | negative regulation of double-strand break repair(GO:2000780) |
| 0.3 | 1.0 | GO:0006567 | threonine catabolic process(GO:0006567) |
| 0.3 | 2.6 | GO:0031065 | positive regulation of histone deacetylation(GO:0031065) |
| 0.3 | 11.5 | GO:0051607 | defense response to virus(GO:0051607) |
| 0.3 | 0.3 | GO:0006930 | substrate-dependent cell migration, cell extension(GO:0006930) |
| 0.3 | 1.3 | GO:0007638 | mechanosensory behavior(GO:0007638) |
| 0.3 | 0.6 | GO:0046578 | regulation of Ras protein signal transduction(GO:0046578) |
| 0.3 | 0.6 | GO:0032474 | otolith morphogenesis(GO:0032474) |
| 0.3 | 4.6 | GO:0006379 | mRNA cleavage(GO:0006379) |
| 0.3 | 1.8 | GO:0005981 | regulation of glycogen catabolic process(GO:0005981) |
| 0.3 | 4.9 | GO:0033363 | secretory granule organization(GO:0033363) |
| 0.3 | 0.3 | GO:1900135 | positive regulation of renin secretion into blood stream(GO:1900135) |
| 0.3 | 1.8 | GO:0030157 | pancreatic juice secretion(GO:0030157) |
| 0.3 | 10.5 | GO:0051865 | protein autoubiquitination(GO:0051865) |
| 0.3 | 2.4 | GO:0001967 | suckling behavior(GO:0001967) |
| 0.3 | 16.4 | GO:0010923 | negative regulation of phosphatase activity(GO:0010923) |
| 0.3 | 2.6 | GO:0000244 | spliceosomal tri-snRNP complex assembly(GO:0000244) |
| 0.3 | 1.7 | GO:0072488 | ammonium transmembrane transport(GO:0072488) |
| 0.3 | 1.1 | GO:0010810 | regulation of cell-substrate adhesion(GO:0010810) |
| 0.3 | 3.4 | GO:0015816 | glycine transport(GO:0015816) |
| 0.3 | 2.5 | GO:0007041 | lysosomal transport(GO:0007041) |
| 0.3 | 2.0 | GO:0035329 | hippo signaling(GO:0035329) |
| 0.3 | 3.3 | GO:0000185 | activation of MAPKKK activity(GO:0000185) |
| 0.3 | 0.8 | GO:0018364 | peptidyl-glutamine methylation(GO:0018364) snoRNA localization(GO:0048254) |
| 0.3 | 1.1 | GO:0007213 | G-protein coupled acetylcholine receptor signaling pathway(GO:0007213) |
| 0.3 | 1.1 | GO:0042796 | snRNA transcription from RNA polymerase III promoter(GO:0042796) |
| 0.3 | 0.3 | GO:1990314 | cellular response to insulin-like growth factor stimulus(GO:1990314) |
| 0.3 | 1.1 | GO:0043388 | positive regulation of DNA binding(GO:0043388) |
| 0.3 | 2.1 | GO:0071025 | RNA surveillance(GO:0071025) |
| 0.3 | 2.8 | GO:0003351 | epithelial cilium movement(GO:0003351) |
| 0.2 | 0.7 | GO:0006370 | 7-methylguanosine mRNA capping(GO:0006370) |
| 0.2 | 0.7 | GO:0000492 | box C/D snoRNP assembly(GO:0000492) |
| 0.2 | 0.7 | GO:0044752 | response to human chorionic gonadotropin(GO:0044752) |
| 0.2 | 2.0 | GO:0008340 | determination of adult lifespan(GO:0008340) |
| 0.2 | 2.2 | GO:0007603 | phototransduction, visible light(GO:0007603) |
| 0.2 | 1.2 | GO:0031954 | positive regulation of protein autophosphorylation(GO:0031954) |
| 0.2 | 0.5 | GO:0033505 | floor plate morphogenesis(GO:0033505) |
| 0.2 | 2.2 | GO:0030970 | retrograde protein transport, ER to cytosol(GO:0030970) |
| 0.2 | 0.5 | GO:0035887 | aortic smooth muscle cell differentiation(GO:0035887) |
| 0.2 | 0.5 | GO:0016240 | autophagosome docking(GO:0016240) |
| 0.2 | 1.9 | GO:0006465 | signal peptide processing(GO:0006465) |
| 0.2 | 0.7 | GO:1902895 | positive regulation of pri-miRNA transcription from RNA polymerase II promoter(GO:1902895) |
| 0.2 | 1.4 | GO:0006349 | regulation of gene expression by genetic imprinting(GO:0006349) |
| 0.2 | 7.3 | GO:0042113 | B cell activation(GO:0042113) |
| 0.2 | 2.3 | GO:0071392 | cellular response to estradiol stimulus(GO:0071392) |
| 0.2 | 1.9 | GO:0060218 | hematopoietic stem cell differentiation(GO:0060218) |
| 0.2 | 0.7 | GO:0009452 | 7-methylguanosine RNA capping(GO:0009452) RNA capping(GO:0036260) |
| 0.2 | 0.5 | GO:0033079 | immature T cell proliferation(GO:0033079) |
| 0.2 | 0.9 | GO:0046208 | spermine catabolic process(GO:0046208) |
| 0.2 | 1.6 | GO:0071359 | cellular response to dsRNA(GO:0071359) |
| 0.2 | 1.5 | GO:0046326 | positive regulation of glucose import(GO:0046326) |
| 0.2 | 3.3 | GO:0018027 | peptidyl-lysine dimethylation(GO:0018027) |
| 0.2 | 0.9 | GO:0097062 | dendritic spine maintenance(GO:0097062) |
| 0.2 | 1.7 | GO:0030511 | positive regulation of transforming growth factor beta receptor signaling pathway(GO:0030511) positive regulation of cellular response to transforming growth factor beta stimulus(GO:1903846) |
| 0.2 | 1.7 | GO:0033148 | positive regulation of intracellular estrogen receptor signaling pathway(GO:0033148) |
| 0.2 | 4.9 | GO:0042147 | retrograde transport, endosome to Golgi(GO:0042147) |
| 0.2 | 3.2 | GO:0032012 | regulation of ARF protein signal transduction(GO:0032012) |
| 0.2 | 0.8 | GO:0007258 | JUN phosphorylation(GO:0007258) |
| 0.2 | 1.0 | GO:0031119 | tRNA pseudouridine synthesis(GO:0031119) |
| 0.2 | 2.6 | GO:0021983 | pituitary gland development(GO:0021983) |
| 0.2 | 1.4 | GO:0010718 | positive regulation of epithelial to mesenchymal transition(GO:0010718) |
| 0.2 | 0.6 | GO:0002347 | response to tumor cell(GO:0002347) |
| 0.2 | 1.1 | GO:0016926 | protein desumoylation(GO:0016926) |
| 0.2 | 0.9 | GO:2000114 | regulation of establishment of cell polarity(GO:2000114) |
| 0.2 | 1.1 | GO:0006654 | phosphatidic acid biosynthetic process(GO:0006654) |
| 0.2 | 1.3 | GO:0019388 | galactose catabolic process(GO:0019388) |
| 0.2 | 1.6 | GO:0043550 | regulation of lipid kinase activity(GO:0043550) |
| 0.2 | 0.5 | GO:0070092 | glucagon secretion(GO:0070091) regulation of glucagon secretion(GO:0070092) |
| 0.2 | 0.5 | GO:0030091 | protein repair(GO:0030091) |
| 0.2 | 5.6 | GO:0045089 | positive regulation of innate immune response(GO:0045089) |
| 0.2 | 0.3 | GO:1904640 | response to methionine(GO:1904640) |
| 0.2 | 10.7 | GO:1902476 | chloride transmembrane transport(GO:1902476) |
| 0.2 | 1.0 | GO:0050650 | chondroitin sulfate proteoglycan biosynthetic process(GO:0050650) |
| 0.2 | 0.6 | GO:0070345 | negative regulation of fat cell proliferation(GO:0070345) |
| 0.2 | 0.5 | GO:0061743 | motor learning(GO:0061743) |
| 0.2 | 0.2 | GO:2001273 | regulation of glucose import in response to insulin stimulus(GO:2001273) |
| 0.2 | 0.3 | GO:0090521 | glomerular visceral epithelial cell migration(GO:0090521) |
| 0.2 | 24.2 | GO:0010466 | negative regulation of peptidase activity(GO:0010466) |
| 0.2 | 1.8 | GO:0051058 | negative regulation of Ras protein signal transduction(GO:0046580) negative regulation of small GTPase mediated signal transduction(GO:0051058) |
| 0.1 | 3.0 | GO:0051123 | RNA polymerase II transcriptional preinitiation complex assembly(GO:0051123) |
| 0.1 | 0.1 | GO:0060701 | negative regulation of ribonuclease activity(GO:0060701) negative regulation of endoribonuclease activity(GO:0060702) |
| 0.1 | 1.2 | GO:0034310 | ethanol catabolic process(GO:0006068) primary alcohol catabolic process(GO:0034310) |
| 0.1 | 1.1 | GO:1902259 | regulation of delayed rectifier potassium channel activity(GO:1902259) |
| 0.1 | 0.5 | GO:0046600 | negative regulation of centriole replication(GO:0046600) |
| 0.1 | 0.3 | GO:0045875 | negative regulation of sister chromatid cohesion(GO:0045875) |
| 0.1 | 0.4 | GO:0014856 | skeletal muscle cell proliferation(GO:0014856) |
| 0.1 | 0.8 | GO:0000012 | single strand break repair(GO:0000012) |
| 0.1 | 0.5 | GO:0006983 | ER overload response(GO:0006983) |
| 0.1 | 0.9 | GO:0007616 | long-term memory(GO:0007616) |
| 0.1 | 0.3 | GO:0036119 | response to platelet-derived growth factor(GO:0036119) |
| 0.1 | 0.5 | GO:1904294 | positive regulation of ERAD pathway(GO:1904294) |
| 0.1 | 0.3 | GO:0036010 | protein localization to endosome(GO:0036010) |
| 0.1 | 0.3 | GO:0006104 | succinyl-CoA metabolic process(GO:0006104) |
| 0.1 | 1.1 | GO:0048015 | phosphatidylinositol-mediated signaling(GO:0048015) inositol lipid-mediated signaling(GO:0048017) |
| 0.1 | 0.7 | GO:0006335 | DNA replication-dependent nucleosome assembly(GO:0006335) DNA replication-dependent nucleosome organization(GO:0034723) |
| 0.1 | 1.0 | GO:0060479 | lung cell differentiation(GO:0060479) lung epithelial cell differentiation(GO:0060487) |
| 0.1 | 0.2 | GO:0030948 | negative regulation of vascular endothelial growth factor receptor signaling pathway(GO:0030948) |
| 0.1 | 0.9 | GO:0051703 | social behavior(GO:0035176) intraspecies interaction between organisms(GO:0051703) |
| 0.1 | 0.4 | GO:0046341 | CDP-diacylglycerol biosynthetic process(GO:0016024) CDP-diacylglycerol metabolic process(GO:0046341) |
| 0.1 | 0.2 | GO:0021526 | medial motor column neuron differentiation(GO:0021526) |
| 0.1 | 1.8 | GO:0000387 | spliceosomal snRNP assembly(GO:0000387) |
| 0.1 | 0.6 | GO:2000647 | negative regulation of stem cell proliferation(GO:2000647) |
| 0.1 | 0.3 | GO:0010457 | centriole-centriole cohesion(GO:0010457) |
| 0.1 | 0.1 | GO:0010519 | negative regulation of phospholipase activity(GO:0010519) |
| 0.1 | 2.7 | GO:0000413 | protein peptidyl-prolyl isomerization(GO:0000413) |
| 0.1 | 0.9 | GO:0001825 | blastocyst formation(GO:0001825) |
| 0.1 | 1.0 | GO:0021591 | ventricular system development(GO:0021591) |
| 0.1 | 0.3 | GO:0006346 | methylation-dependent chromatin silencing(GO:0006346) |
| 0.1 | 0.1 | GO:0001560 | regulation of cell growth by extracellular stimulus(GO:0001560) |
| 0.0 | 0.3 | GO:0010842 | retina layer formation(GO:0010842) |
| 0.0 | 9.0 | GO:0043087 | regulation of GTPase activity(GO:0043087) |
| 0.0 | 0.4 | GO:0030497 | fatty acid elongation(GO:0030497) |
| 0.0 | 0.1 | GO:0000448 | cleavage in ITS2 between 5.8S rRNA and LSU-rRNA of tricistronic rRNA transcript (SSU-rRNA, 5.8S rRNA, LSU-rRNA)(GO:0000448) |
| 0.0 | 0.1 | GO:0070682 | proteasome regulatory particle assembly(GO:0070682) |
| 0.0 | 0.1 | GO:0007096 | regulation of exit from mitosis(GO:0007096) |
| 0.0 | 0.2 | GO:0033209 | tumor necrosis factor-mediated signaling pathway(GO:0033209) |
| 0.0 | 0.0 | GO:0072344 | rescue of stalled ribosome(GO:0072344) |
| 0.0 | 0.1 | GO:0048490 | anterograde synaptic vesicle transport(GO:0048490) synaptic vesicle cytoskeletal transport(GO:0099514) synaptic vesicle transport along microtubule(GO:0099517) |
| 0.0 | 0.2 | GO:0034620 | cellular response to unfolded protein(GO:0034620) |
Gene overrepresentation in cellular component category:
| Log-likelihood per target | Total log-likelihood | Term | Description |
|---|---|---|---|
| 47.8 | 238.9 | GO:0061689 | tricellular tight junction(GO:0061689) |
| 40.0 | 960.0 | GO:0016327 | apicolateral plasma membrane(GO:0016327) |
| 33.6 | 134.4 | GO:0005607 | laminin-2 complex(GO:0005607) |
| 25.2 | 75.7 | GO:0034667 | integrin alpha3-beta1 complex(GO:0034667) |
| 16.3 | 65.2 | GO:0071438 | invadopodium membrane(GO:0071438) |
| 13.7 | 41.1 | GO:1990796 | photoreceptor cell terminal bouton(GO:1990796) |
| 13.4 | 40.1 | GO:0034686 | integrin alphav-beta8 complex(GO:0034686) |
| 13.3 | 39.9 | GO:0031308 | intrinsic component of nuclear outer membrane(GO:0031308) integral component of nuclear outer membrane(GO:0031309) |
| 13.2 | 39.6 | GO:0032398 | MHC class Ib protein complex(GO:0032398) |
| 12.7 | 139.7 | GO:0016342 | catenin complex(GO:0016342) |
| 10.7 | 85.8 | GO:0042105 | alpha-beta T cell receptor complex(GO:0042105) |
| 10.6 | 84.6 | GO:0044194 | cytolytic granule(GO:0044194) |
| 10.4 | 31.2 | GO:0036488 | CHOP-C/EBP complex(GO:0036488) |
| 10.3 | 51.3 | GO:0034751 | aryl hydrocarbon receptor complex(GO:0034751) |
| 10.1 | 101.0 | GO:0042101 | T cell receptor complex(GO:0042101) |
| 9.8 | 48.9 | GO:0000220 | vacuolar proton-transporting V-type ATPase, V0 domain(GO:0000220) |
| 9.0 | 27.1 | GO:0035692 | macrophage migration inhibitory factor receptor complex(GO:0035692) |
| 8.9 | 8.9 | GO:0005945 | 6-phosphofructokinase complex(GO:0005945) |
| 8.9 | 44.4 | GO:0048179 | activin receptor complex(GO:0048179) |
| 8.7 | 26.2 | GO:0005944 | phosphatidylinositol 3-kinase complex, class IB(GO:0005944) |
| 8.7 | 26.2 | GO:0097232 | lamellar body membrane(GO:0097232) alveolar lamellar body membrane(GO:0097233) |
| 8.0 | 16.0 | GO:0035577 | azurophil granule membrane(GO:0035577) |
| 8.0 | 48.0 | GO:0005610 | laminin-5 complex(GO:0005610) |
| 8.0 | 103.6 | GO:0031143 | pseudopodium(GO:0031143) |
| 7.9 | 7.9 | GO:0005588 | collagen type V trimer(GO:0005588) |
| 7.7 | 77.4 | GO:0045179 | apical cortex(GO:0045179) |
| 7.6 | 30.5 | GO:0071914 | prominosome(GO:0071914) |
| 7.6 | 251.7 | GO:0030131 | clathrin adaptor complex(GO:0030131) |
| 7.4 | 154.7 | GO:0031528 | microvillus membrane(GO:0031528) |
| 7.2 | 50.5 | GO:0097136 | Bcl-2 family protein complex(GO:0097136) |
| 7.1 | 21.3 | GO:0005656 | nuclear pre-replicative complex(GO:0005656) pre-replicative complex(GO:0036387) |
| 7.1 | 7.1 | GO:0031094 | platelet dense tubular network(GO:0031094) |
| 7.0 | 48.7 | GO:0001651 | dense fibrillar component(GO:0001651) |
| 6.5 | 124.2 | GO:0031231 | integral component of peroxisomal membrane(GO:0005779) intrinsic component of peroxisomal membrane(GO:0031231) |
| 6.5 | 516.3 | GO:0031526 | brush border membrane(GO:0031526) |
| 6.4 | 12.8 | GO:0032010 | phagolysosome(GO:0032010) |
| 6.3 | 50.3 | GO:0097197 | tetraspanin-enriched microdomain(GO:0097197) |
| 6.2 | 61.8 | GO:0032437 | cuticular plate(GO:0032437) |
| 6.0 | 23.9 | GO:0042571 | immunoglobulin complex, circulating(GO:0042571) |
| 5.6 | 39.5 | GO:0036057 | filtration diaphragm(GO:0036056) slit diaphragm(GO:0036057) |
| 5.6 | 22.3 | GO:0097513 | myosin II filament(GO:0097513) |
| 5.5 | 38.8 | GO:0065010 | extracellular membrane-bounded organelle(GO:0065010) |
| 5.5 | 10.9 | GO:0070821 | tertiary granule membrane(GO:0070821) |
| 5.4 | 21.8 | GO:0097025 | MPP7-DLG1-LIN7 complex(GO:0097025) |
| 5.2 | 41.8 | GO:0097208 | alveolar lamellar body(GO:0097208) |
| 5.2 | 20.8 | GO:0070022 | transforming growth factor beta receptor homodimeric complex(GO:0070022) |
| 5.1 | 633.0 | GO:0070160 | bicellular tight junction(GO:0005923) occluding junction(GO:0070160) |
| 4.9 | 14.7 | GO:0019815 | B cell receptor complex(GO:0019815) |
| 4.8 | 38.5 | GO:0033179 | proton-transporting V-type ATPase, V0 domain(GO:0033179) |
| 4.8 | 33.4 | GO:0036449 | microtubule minus-end(GO:0036449) |
| 4.8 | 62.0 | GO:0032591 | dendritic spine membrane(GO:0032591) |
| 4.7 | 56.8 | GO:0032433 | filopodium tip(GO:0032433) |
| 4.7 | 37.7 | GO:0005587 | collagen type IV trimer(GO:0005587) network-forming collagen trimer(GO:0098642) collagen network(GO:0098645) |
| 4.6 | 129.5 | GO:0008305 | integrin complex(GO:0008305) |
| 4.6 | 156.7 | GO:0016328 | lateral plasma membrane(GO:0016328) |
| 4.6 | 22.8 | GO:0002189 | ribose phosphate diphosphokinase complex(GO:0002189) |
| 4.5 | 13.6 | GO:0005594 | collagen type IX trimer(GO:0005594) |
| 4.5 | 4.5 | GO:0035068 | micro-ribonucleoprotein complex(GO:0035068) |
| 4.5 | 120.7 | GO:0001772 | immunological synapse(GO:0001772) |
| 4.4 | 65.3 | GO:0042613 | MHC class II protein complex(GO:0042613) |
| 4.2 | 33.5 | GO:0017059 | serine C-palmitoyltransferase complex(GO:0017059) endoplasmic reticulum palmitoyltransferase complex(GO:0031211) |
| 4.0 | 20.2 | GO:1990726 | Lsm1-7-Pat1 complex(GO:1990726) |
| 4.0 | 20.1 | GO:0031904 | endosome lumen(GO:0031904) |
| 4.0 | 7.9 | GO:0031095 | platelet dense tubular network membrane(GO:0031095) |
| 4.0 | 106.7 | GO:0001533 | cornified envelope(GO:0001533) |
| 3.9 | 3.9 | GO:0005593 | FACIT collagen trimer(GO:0005593) |
| 3.6 | 3.6 | GO:0098651 | basement membrane collagen trimer(GO:0098651) |
| 3.5 | 297.1 | GO:0032587 | ruffle membrane(GO:0032587) |
| 3.5 | 7.0 | GO:0097487 | multivesicular body, internal vesicle(GO:0097487) |
| 3.5 | 83.3 | GO:0034706 | sodium channel complex(GO:0034706) |
| 3.4 | 24.1 | GO:0042406 | extrinsic component of endoplasmic reticulum membrane(GO:0042406) |
| 3.3 | 16.3 | GO:0097524 | sperm plasma membrane(GO:0097524) |
| 3.2 | 19.0 | GO:0097342 | ripoptosome(GO:0097342) |
| 3.2 | 217.8 | GO:0045095 | keratin filament(GO:0045095) |
| 3.1 | 24.8 | GO:0097443 | sorting endosome(GO:0097443) |
| 3.1 | 12.4 | GO:0033269 | internode region of axon(GO:0033269) |
| 3.0 | 6.1 | GO:0036195 | muscle cell projection(GO:0036194) muscle cell projection membrane(GO:0036195) |
| 3.0 | 74.8 | GO:0042629 | mast cell granule(GO:0042629) |
| 3.0 | 17.7 | GO:0042567 | insulin-like growth factor ternary complex(GO:0042567) |
| 2.9 | 5.8 | GO:0045098 | type III intermediate filament(GO:0045098) |
| 2.9 | 5.8 | GO:0031166 | integral component of vacuolar membrane(GO:0031166) intrinsic component of vacuolar membrane(GO:0031310) |
| 2.9 | 11.6 | GO:0097451 | glial limiting end-foot(GO:0097451) |
| 2.9 | 8.7 | GO:0042642 | actomyosin, myosin complex part(GO:0042642) |
| 2.8 | 2.8 | GO:0044393 | microspike(GO:0044393) |
| 2.8 | 8.3 | GO:0005896 | interleukin-6 receptor complex(GO:0005896) ciliary neurotrophic factor receptor complex(GO:0070110) |
| 2.7 | 19.2 | GO:0090543 | Flemming body(GO:0090543) |
| 2.7 | 8.1 | GO:0060091 | kinocilium(GO:0060091) |
| 2.6 | 13.2 | GO:0000836 | ER ubiquitin ligase complex(GO:0000835) Hrd1p ubiquitin ligase complex(GO:0000836) |
| 2.6 | 7.8 | GO:0031230 | intrinsic component of cell outer membrane(GO:0031230) integral component of cell outer membrane(GO:0045203) |
| 2.6 | 15.4 | GO:0032444 | activin responsive factor complex(GO:0032444) |
| 2.6 | 35.9 | GO:0017146 | NMDA selective glutamate receptor complex(GO:0017146) |
| 2.5 | 27.7 | GO:0034663 | endoplasmic reticulum chaperone complex(GO:0034663) |
| 2.5 | 110.5 | GO:0055038 | recycling endosome membrane(GO:0055038) |
| 2.5 | 9.9 | GO:0032059 | bleb(GO:0032059) |
| 2.5 | 9.8 | GO:0031088 | platelet dense granule membrane(GO:0031088) |
| 2.5 | 7.4 | GO:0048269 | methionine adenosyltransferase complex(GO:0048269) |
| 2.4 | 85.7 | GO:0044295 | axonal growth cone(GO:0044295) |
| 2.4 | 138.3 | GO:0034707 | chloride channel complex(GO:0034707) |
| 2.4 | 33.8 | GO:0030670 | phagocytic vesicle membrane(GO:0030670) |
| 2.4 | 38.3 | GO:0001891 | phagocytic cup(GO:0001891) |
| 2.4 | 19.1 | GO:0070578 | RISC-loading complex(GO:0070578) |
| 2.3 | 11.6 | GO:0042581 | specific granule(GO:0042581) |
| 2.3 | 16.2 | GO:0000788 | nuclear nucleosome(GO:0000788) |
| 2.3 | 4.6 | GO:0000306 | extrinsic component of vacuolar membrane(GO:0000306) |
| 2.3 | 9.2 | GO:0071256 | Sec61 translocon complex(GO:0005784) translocon complex(GO:0071256) |
| 2.3 | 41.2 | GO:0005614 | interstitial matrix(GO:0005614) |
| 2.3 | 20.5 | GO:0044327 | dendritic spine head(GO:0044327) |
| 2.3 | 6.8 | GO:0035355 | Toll-like receptor 2-Toll-like receptor 6 protein complex(GO:0035355) |
| 2.3 | 27.2 | GO:0001939 | female pronucleus(GO:0001939) |
| 2.2 | 123.3 | GO:0031901 | early endosome membrane(GO:0031901) |
| 2.2 | 22.3 | GO:0032588 | trans-Golgi network membrane(GO:0032588) |
| 2.2 | 49.0 | GO:0008074 | guanylate cyclase complex, soluble(GO:0008074) |
| 2.2 | 13.2 | GO:0071458 | integral component of cytoplasmic side of endoplasmic reticulum membrane(GO:0071458) integral component of lumenal side of endoplasmic reticulum membrane(GO:0071556) lumenal side of endoplasmic reticulum membrane(GO:0098553) |
| 2.2 | 24.1 | GO:0033180 | proton-transporting V-type ATPase, V1 domain(GO:0033180) |
| 2.2 | 571.9 | GO:0009897 | external side of plasma membrane(GO:0009897) |
| 2.1 | 6.4 | GO:1990769 | proximal neuron projection(GO:1990769) |
| 2.1 | 430.6 | GO:0016323 | basolateral plasma membrane(GO:0016323) |
| 2.1 | 4.3 | GO:0097427 | microtubule bundle(GO:0097427) |
| 2.1 | 2.1 | GO:0005943 | phosphatidylinositol 3-kinase complex, class IA(GO:0005943) |
| 2.1 | 138.7 | GO:0032580 | Golgi cisterna membrane(GO:0032580) |
| 2.1 | 14.9 | GO:0071598 | neuronal ribonucleoprotein granule(GO:0071598) |
| 2.1 | 14.8 | GO:0005579 | membrane attack complex(GO:0005579) |
| 2.1 | 12.7 | GO:0042584 | chromaffin granule membrane(GO:0042584) |
| 2.1 | 25.0 | GO:0044232 | organelle membrane contact site(GO:0044232) |
| 2.1 | 20.8 | GO:1990635 | proximal dendrite(GO:1990635) |
| 2.1 | 10.3 | GO:0031091 | platelet alpha granule(GO:0031091) |
| 2.0 | 4.1 | GO:0070033 | synaptobrevin 2-SNAP-25-syntaxin-1a-complexin II complex(GO:0070033) |
| 2.0 | 8.2 | GO:0033093 | Weibel-Palade body(GO:0033093) |
| 2.0 | 53.8 | GO:0045335 | phagocytic vesicle(GO:0045335) |
| 1.9 | 9.7 | GO:0071953 | elastic fiber(GO:0071953) |
| 1.9 | 15.4 | GO:0033263 | CORVET complex(GO:0033263) |
| 1.9 | 15.4 | GO:0031209 | SCAR complex(GO:0031209) |
| 1.9 | 45.9 | GO:0031225 | anchored component of membrane(GO:0031225) |
| 1.9 | 9.6 | GO:0070695 | FHF complex(GO:0070695) |
| 1.9 | 9.3 | GO:1990716 | axonemal central apparatus(GO:1990716) |
| 1.8 | 5.5 | GO:1990032 | parallel fiber(GO:1990032) |
| 1.8 | 11.1 | GO:0005785 | signal recognition particle receptor complex(GO:0005785) |
| 1.8 | 1.8 | GO:0001740 | Barr body(GO:0001740) |
| 1.8 | 439.9 | GO:0045177 | apical part of cell(GO:0045177) |
| 1.8 | 16.3 | GO:0030140 | trans-Golgi network transport vesicle(GO:0030140) |
| 1.8 | 34.1 | GO:0030665 | clathrin-coated vesicle membrane(GO:0030665) |
| 1.8 | 12.5 | GO:0042599 | lamellar body(GO:0042599) |
| 1.8 | 40.8 | GO:0046658 | anchored component of plasma membrane(GO:0046658) |
| 1.8 | 8.8 | GO:1990130 | Iml1 complex(GO:1990130) |
| 1.7 | 5.2 | GO:0002193 | MAML1-RBP-Jkappa- ICN1 complex(GO:0002193) |
| 1.7 | 8.7 | GO:0044530 | supraspliceosomal complex(GO:0044530) |
| 1.7 | 3.5 | GO:0005818 | astral microtubule(GO:0000235) aster(GO:0005818) |
| 1.7 | 112.1 | GO:0005871 | kinesin complex(GO:0005871) |
| 1.7 | 201.5 | GO:0031234 | extrinsic component of cytoplasmic side of plasma membrane(GO:0031234) |
| 1.7 | 10.2 | GO:0042825 | MHC class I peptide loading complex(GO:0042824) TAP complex(GO:0042825) |
| 1.7 | 3.3 | GO:0005839 | proteasome core complex(GO:0005839) |
| 1.6 | 4.8 | GO:0044224 | juxtaparanode region of axon(GO:0044224) |
| 1.6 | 85.1 | GO:0048475 | membrane coat(GO:0030117) coated membrane(GO:0048475) |
| 1.6 | 6.4 | GO:0033063 | Rad51B-Rad51C-Rad51D-XRCC2 complex(GO:0033063) |
| 1.6 | 25.4 | GO:0097610 | cleavage furrow(GO:0032154) cell surface furrow(GO:0097610) |
| 1.6 | 4.8 | GO:0071942 | XPC complex(GO:0071942) |
| 1.6 | 6.3 | GO:0048476 | Holliday junction resolvase complex(GO:0048476) |
| 1.6 | 17.4 | GO:0042612 | MHC class I protein complex(GO:0042612) |
| 1.6 | 4.7 | GO:0033557 | Slx1-Slx4 complex(GO:0033557) |
| 1.6 | 11.0 | GO:0030057 | desmosome(GO:0030057) |
| 1.5 | 4.6 | GO:0071149 | TEAD-2-YAP complex(GO:0071149) |
| 1.5 | 50.8 | GO:0005791 | rough endoplasmic reticulum(GO:0005791) |
| 1.5 | 3.0 | GO:0036398 | TCR signalosome(GO:0036398) |
| 1.5 | 8.9 | GO:0071014 | post-mRNA release spliceosomal complex(GO:0071014) |
| 1.5 | 8.8 | GO:0043020 | NADPH oxidase complex(GO:0043020) |
| 1.5 | 4.4 | GO:0071001 | U4/U6 snRNP(GO:0071001) |
| 1.4 | 4.3 | GO:0005940 | septin ring(GO:0005940) |
| 1.4 | 27.9 | GO:0035098 | ESC/E(Z) complex(GO:0035098) |
| 1.4 | 4.1 | GO:0034363 | intermediate-density lipoprotein particle(GO:0034363) |
| 1.3 | 6.7 | GO:0032389 | MutLalpha complex(GO:0032389) |
| 1.3 | 14.8 | GO:0036038 | MKS complex(GO:0036038) |
| 1.3 | 7.9 | GO:1990111 | spermatoproteasome complex(GO:1990111) |
| 1.3 | 1.3 | GO:0044299 | C-fiber(GO:0044299) |
| 1.3 | 26.2 | GO:0046930 | pore complex(GO:0046930) |
| 1.3 | 443.1 | GO:0005764 | lytic vacuole(GO:0000323) lysosome(GO:0005764) |
| 1.3 | 9.2 | GO:0031390 | Ctf18 RFC-like complex(GO:0031390) |
| 1.3 | 2.5 | GO:0044317 | rod spherule(GO:0044317) |
| 1.3 | 2.5 | GO:0033588 | Elongator holoenzyme complex(GO:0033588) |
| 1.2 | 14.5 | GO:0061702 | inflammasome complex(GO:0061702) |
| 1.2 | 2624.4 | GO:0070062 | extracellular exosome(GO:0070062) |
| 1.2 | 3.6 | GO:0009328 | phenylalanine-tRNA ligase complex(GO:0009328) |
| 1.2 | 2.4 | GO:0031933 | telomeric heterochromatin(GO:0031933) |
| 1.2 | 5.8 | GO:0035189 | Rb-E2F complex(GO:0035189) |
| 1.1 | 2.3 | GO:0001674 | female germ cell nucleus(GO:0001674) |
| 1.1 | 14.7 | GO:0097038 | perinuclear endoplasmic reticulum(GO:0097038) |
| 1.1 | 13.5 | GO:0000124 | SAGA complex(GO:0000124) |
| 1.1 | 49.9 | GO:0072686 | mitotic spindle(GO:0072686) |
| 1.1 | 4.4 | GO:0044322 | endoplasmic reticulum quality control compartment(GO:0044322) |
| 1.1 | 5.5 | GO:0030136 | clathrin-coated vesicle(GO:0030136) |
| 1.1 | 190.3 | GO:0005925 | focal adhesion(GO:0005925) |
| 1.1 | 28.5 | GO:0060170 | ciliary membrane(GO:0060170) |
| 1.1 | 10.8 | GO:0005721 | pericentric heterochromatin(GO:0005721) |
| 1.1 | 43.1 | GO:0005604 | basement membrane(GO:0005604) |
| 1.1 | 18.0 | GO:0005795 | Golgi stack(GO:0005795) |
| 1.0 | 4.2 | GO:0032021 | NELF complex(GO:0032021) |
| 1.0 | 5.2 | GO:1903768 | sweet taste receptor complex(GO:1903767) taste receptor complex(GO:1903768) |
| 1.0 | 1.0 | GO:0097125 | cyclin B1-CDK1 complex(GO:0097125) |
| 1.0 | 9.3 | GO:0012507 | ER to Golgi transport vesicle membrane(GO:0012507) |
| 1.0 | 4.1 | GO:0042589 | zymogen granule membrane(GO:0042589) |
| 1.0 | 34.6 | GO:0005720 | nuclear heterochromatin(GO:0005720) |
| 1.0 | 35.6 | GO:0001726 | ruffle(GO:0001726) |
| 1.0 | 21.7 | GO:0005902 | microvillus(GO:0005902) |
| 1.0 | 9.8 | GO:0000940 | condensed chromosome outer kinetochore(GO:0000940) |
| 1.0 | 6.9 | GO:0031616 | spindle pole centrosome(GO:0031616) |
| 1.0 | 10.7 | GO:0008278 | cohesin complex(GO:0008278) |
| 1.0 | 2.9 | GO:0016533 | cyclin-dependent protein kinase 5 holoenzyme complex(GO:0016533) |
| 1.0 | 12.6 | GO:0032045 | guanyl-nucleotide exchange factor complex(GO:0032045) |
| 1.0 | 6.7 | GO:0016581 | NuRD complex(GO:0016581) CHD-type complex(GO:0090545) |
| 1.0 | 4.8 | GO:0005796 | Golgi lumen(GO:0005796) |
| 0.9 | 90.0 | GO:0016605 | PML body(GO:0016605) |
| 0.9 | 9.4 | GO:0035102 | PRC1 complex(GO:0035102) |
| 0.9 | 10.3 | GO:0033116 | endoplasmic reticulum-Golgi intermediate compartment membrane(GO:0033116) |
| 0.9 | 196.6 | GO:0000139 | Golgi membrane(GO:0000139) |
| 0.9 | 1.8 | GO:0034457 | Mpp10 complex(GO:0034457) |
| 0.9 | 6.1 | GO:0016602 | CCAAT-binding factor complex(GO:0016602) |
| 0.9 | 3.5 | GO:0043159 | acrosomal matrix(GO:0043159) |
| 0.9 | 2.6 | GO:0005846 | nuclear cap binding complex(GO:0005846) |
| 0.9 | 3.4 | GO:0035859 | Seh1-associated complex(GO:0035859) |
| 0.9 | 4.3 | GO:0031262 | Ndc80 complex(GO:0031262) |
| 0.8 | 7.6 | GO:0072687 | meiotic spindle(GO:0072687) |
| 0.8 | 1.6 | GO:0005828 | kinetochore microtubule(GO:0005828) |
| 0.8 | 1.6 | GO:0043293 | apoptosome(GO:0043293) |
| 0.8 | 8.1 | GO:0032541 | cortical endoplasmic reticulum(GO:0032541) |
| 0.8 | 31.8 | GO:0005788 | endoplasmic reticulum lumen(GO:0005788) |
| 0.8 | 7.0 | GO:0000506 | glycosylphosphatidylinositol-N-acetylglucosaminyltransferase (GPI-GnT) complex(GO:0000506) |
| 0.8 | 4.6 | GO:0005883 | neurofilament(GO:0005883) |
| 0.8 | 9.2 | GO:0032809 | neuronal cell body membrane(GO:0032809) |
| 0.8 | 6.1 | GO:0005658 | alpha DNA polymerase:primase complex(GO:0005658) |
| 0.8 | 13.1 | GO:0005849 | mRNA cleavage factor complex(GO:0005849) |
| 0.7 | 79.9 | GO:0001650 | fibrillar center(GO:0001650) |
| 0.7 | 6.3 | GO:0090576 | RNA polymerase III transcription factor complex(GO:0090576) |
| 0.7 | 2.0 | GO:0031254 | uropod(GO:0001931) cell trailing edge(GO:0031254) |
| 0.7 | 2.7 | GO:0032777 | Piccolo NuA4 histone acetyltransferase complex(GO:0032777) |
| 0.7 | 2.0 | GO:0044609 | DBIRD complex(GO:0044609) |
| 0.7 | 2.0 | GO:0000172 | ribonuclease MRP complex(GO:0000172) |
| 0.7 | 329.1 | GO:0005789 | endoplasmic reticulum membrane(GO:0005789) |
| 0.6 | 1.2 | GO:0009330 | DNA topoisomerase complex (ATP-hydrolyzing)(GO:0009330) |
| 0.6 | 10.5 | GO:0000145 | exocyst(GO:0000145) |
| 0.6 | 10.3 | GO:0034451 | centriolar satellite(GO:0034451) |
| 0.6 | 2.3 | GO:1990851 | Wnt-Frizzled-LRP5/6 complex(GO:1990851) |
| 0.6 | 3.5 | GO:0090571 | RNA polymerase II transcription repressor complex(GO:0090571) |
| 0.6 | 2.9 | GO:0000808 | origin recognition complex(GO:0000808) nuclear origin of replication recognition complex(GO:0005664) |
| 0.6 | 4.0 | GO:0005677 | chromatin silencing complex(GO:0005677) |
| 0.6 | 22.0 | GO:0008023 | transcription elongation factor complex(GO:0008023) |
| 0.6 | 54.0 | GO:0045121 | membrane raft(GO:0045121) membrane microdomain(GO:0098857) |
| 0.6 | 5.5 | GO:0042555 | MCM complex(GO:0042555) |
| 0.5 | 1.6 | GO:0035032 | phosphatidylinositol 3-kinase complex, class III(GO:0035032) |
| 0.5 | 7.1 | GO:0005905 | clathrin-coated pit(GO:0005905) |
| 0.5 | 1.6 | GO:1990745 | EARP complex(GO:1990745) |
| 0.5 | 1.1 | GO:0031436 | BRCA1-BARD1 complex(GO:0031436) |
| 0.5 | 0.5 | GO:0044316 | cone cell pedicle(GO:0044316) |
| 0.5 | 39.8 | GO:0000932 | cytoplasmic mRNA processing body(GO:0000932) |
| 0.5 | 4.0 | GO:0005793 | endoplasmic reticulum-Golgi intermediate compartment(GO:0005793) |
| 0.5 | 31.7 | GO:0016363 | nuclear matrix(GO:0016363) |
| 0.5 | 31.6 | GO:0031463 | Cul3-RING ubiquitin ligase complex(GO:0031463) |
| 0.5 | 2.5 | GO:0043625 | delta DNA polymerase complex(GO:0043625) |
| 0.5 | 2.9 | GO:0005640 | nuclear outer membrane(GO:0005640) |
| 0.5 | 25.3 | GO:0031252 | cell leading edge(GO:0031252) |
| 0.5 | 7.6 | GO:0005776 | autophagosome(GO:0005776) |
| 0.5 | 1.9 | GO:0000974 | Prp19 complex(GO:0000974) |
| 0.5 | 1.4 | GO:0034399 | nuclear periphery(GO:0034399) |
| 0.5 | 0.9 | GO:0030134 | ER to Golgi transport vesicle(GO:0030134) |
| 0.5 | 0.9 | GO:0071782 | endoplasmic reticulum tubular network(GO:0071782) endoplasmic reticulum subcompartment(GO:0098827) |
| 0.5 | 1.9 | GO:0031371 | ubiquitin conjugating enzyme complex(GO:0031371) HULC complex(GO:0033503) |
| 0.5 | 6.8 | GO:0035145 | exon-exon junction complex(GO:0035145) |
| 0.5 | 1.8 | GO:0036156 | inner dynein arm(GO:0036156) |
| 0.4 | 3.1 | GO:0030991 | intraciliary transport particle A(GO:0030991) |
| 0.4 | 7.5 | GO:0005689 | U12-type spliceosomal complex(GO:0005689) |
| 0.4 | 2.7 | GO:0000796 | condensin complex(GO:0000796) |
| 0.4 | 4.8 | GO:0071004 | U2-type prespliceosome(GO:0071004) |
| 0.4 | 14.3 | GO:0005657 | replication fork(GO:0005657) |
| 0.4 | 6.3 | GO:0035861 | site of double-strand break(GO:0035861) |
| 0.4 | 2.3 | GO:0032590 | dendrite membrane(GO:0032590) |
| 0.4 | 8.3 | GO:0005921 | gap junction(GO:0005921) |
| 0.4 | 1.8 | GO:0042587 | glycogen granule(GO:0042587) |
| 0.4 | 4.6 | GO:0032420 | stereocilium(GO:0032420) |
| 0.4 | 0.7 | GO:0033647 | host intracellular organelle(GO:0033647) host intracellular membrane-bounded organelle(GO:0033648) |
| 0.3 | 0.3 | GO:0034274 | Atg12-Atg5-Atg16 complex(GO:0034274) |
| 0.3 | 1.4 | GO:0035976 | AP1 complex(GO:0035976) |
| 0.3 | 0.7 | GO:0033186 | CAF-1 complex(GO:0033186) |
| 0.3 | 2.4 | GO:0000164 | protein phosphatase type 1 complex(GO:0000164) |
| 0.3 | 3.0 | GO:0033256 | I-kappaB/NF-kappaB complex(GO:0033256) |
| 0.3 | 3.2 | GO:0030014 | CCR4-NOT complex(GO:0030014) |
| 0.3 | 3.2 | GO:0030688 | preribosome, small subunit precursor(GO:0030688) |
| 0.3 | 22.9 | GO:0005769 | early endosome(GO:0005769) |
| 0.3 | 66.6 | GO:0009986 | cell surface(GO:0009986) |
| 0.3 | 1.9 | GO:0045293 | MIS complex(GO:0036396) mRNA editing complex(GO:0045293) |
| 0.3 | 5.4 | GO:0032281 | AMPA glutamate receptor complex(GO:0032281) |
| 0.3 | 6.9 | GO:0055037 | recycling endosome(GO:0055037) |
| 0.3 | 2.1 | GO:0044292 | dendrite terminus(GO:0044292) |
| 0.3 | 1.8 | GO:1990246 | uniplex complex(GO:1990246) |
| 0.3 | 1.4 | GO:0008540 | proteasome regulatory particle, base subcomplex(GO:0008540) |
| 0.3 | 2.3 | GO:0097550 | transcriptional preinitiation complex(GO:0097550) |
| 0.3 | 10.1 | GO:0044452 | nucleolar part(GO:0044452) |
| 0.2 | 2.2 | GO:0005868 | cytoplasmic dynein complex(GO:0005868) |
| 0.2 | 1.5 | GO:0030289 | protein phosphatase 4 complex(GO:0030289) |
| 0.2 | 7.5 | GO:0009898 | cytoplasmic side of plasma membrane(GO:0009898) |
| 0.2 | 3.8 | GO:0043240 | Fanconi anaemia nuclear complex(GO:0043240) |
| 0.2 | 0.9 | GO:0005832 | chaperonin-containing T-complex(GO:0005832) |
| 0.2 | 1.8 | GO:0070775 | H3 histone acetyltransferase complex(GO:0070775) MOZ/MORF histone acetyltransferase complex(GO:0070776) |
| 0.2 | 0.7 | GO:0032301 | MutSalpha complex(GO:0032301) |
| 0.2 | 3.0 | GO:0019013 | viral nucleocapsid(GO:0019013) |
| 0.2 | 1.7 | GO:0097542 | ciliary tip(GO:0097542) |
| 0.2 | 31.1 | GO:0031965 | nuclear membrane(GO:0031965) |
| 0.2 | 0.2 | GO:0042627 | chylomicron(GO:0042627) |
| 0.2 | 2.7 | GO:0005671 | Ada2/Gcn5/Ada3 transcription activator complex(GO:0005671) |
| 0.2 | 2.3 | GO:0032040 | small-subunit processome(GO:0032040) |
| 0.2 | 5.8 | GO:0005802 | trans-Golgi network(GO:0005802) |
| 0.2 | 2.7 | GO:0030687 | preribosome, large subunit precursor(GO:0030687) |
| 0.2 | 2.3 | GO:0032391 | photoreceptor connecting cilium(GO:0032391) |
| 0.2 | 2.1 | GO:1904115 | axon cytoplasm(GO:1904115) |
| 0.2 | 1.2 | GO:0097504 | Gemini of coiled bodies(GO:0097504) |
| 0.2 | 8.5 | GO:0019898 | extrinsic component of membrane(GO:0019898) |
| 0.2 | 1.6 | GO:0000176 | nuclear exosome (RNase complex)(GO:0000176) |
| 0.1 | 29.0 | GO:0000790 | nuclear chromatin(GO:0000790) |
| 0.1 | 0.5 | GO:0043083 | synaptic cleft(GO:0043083) |
| 0.1 | 3.0 | GO:0005882 | intermediate filament(GO:0005882) |
| 0.1 | 0.9 | GO:0019907 | cyclin-dependent protein kinase activating kinase holoenzyme complex(GO:0019907) |
| 0.1 | 0.7 | GO:0000800 | lateral element(GO:0000800) |
| 0.1 | 2.3 | GO:0045111 | intermediate filament cytoskeleton(GO:0045111) |
| 0.1 | 0.2 | GO:0055087 | Ski complex(GO:0055087) |
| 0.1 | 0.4 | GO:0030008 | TRAPP complex(GO:0030008) |
| 0.1 | 229.8 | GO:0016021 | integral component of membrane(GO:0016021) |
| 0.0 | 1.7 | GO:0016592 | mediator complex(GO:0016592) |
| 0.0 | 0.1 | GO:0000780 | condensed nuclear chromosome, centromeric region(GO:0000780) |
Gene overrepresentation in molecular function category:
| Log-likelihood per target | Total log-likelihood | Term | Description |
|---|---|---|---|
| 48.3 | 144.9 | GO:0070506 | high-density lipoprotein particle receptor activity(GO:0070506) |
| 27.0 | 324.6 | GO:0019911 | structural constituent of myelin sheath(GO:0019911) |
| 24.4 | 73.2 | GO:0042284 | sphingolipid delta-4 desaturase activity(GO:0042284) |
| 23.2 | 208.4 | GO:0015280 | ligand-gated sodium channel activity(GO:0015280) |
| 20.2 | 101.0 | GO:0015321 | sodium-dependent phosphate transmembrane transporter activity(GO:0015321) |
| 20.2 | 80.7 | GO:0031731 | CCR6 chemokine receptor binding(GO:0031731) |
| 19.1 | 57.2 | GO:0004874 | aryl hydrocarbon receptor activity(GO:0004874) |
| 18.8 | 93.9 | GO:1990254 | keratin filament binding(GO:1990254) |
| 18.2 | 109.0 | GO:0005499 | vitamin D binding(GO:0005499) |
| 17.6 | 70.5 | GO:0015111 | iodide transmembrane transporter activity(GO:0015111) |
| 15.4 | 184.4 | GO:0015245 | fatty acid transporter activity(GO:0015245) |
| 14.4 | 43.3 | GO:0070573 | metallodipeptidase activity(GO:0070573) |
| 13.8 | 68.8 | GO:0050785 | advanced glycation end-product receptor activity(GO:0050785) |
| 13.4 | 40.2 | GO:0038100 | nodal binding(GO:0038100) |
| 13.1 | 39.3 | GO:0034040 | lipid-transporting ATPase activity(GO:0034040) sterol-transporting ATPase activity(GO:0034041) glycoprotein transporter activity(GO:0034437) |
| 12.6 | 37.9 | GO:0003845 | 11-beta-hydroxysteroid dehydrogenase [NAD(P)] activity(GO:0003845) |
| 12.5 | 74.8 | GO:0051434 | BH3 domain binding(GO:0051434) |
| 12.3 | 209.3 | GO:0005247 | voltage-gated chloride channel activity(GO:0005247) |
| 12.2 | 48.6 | GO:0035727 | lysophosphatidic acid binding(GO:0035727) |
| 12.0 | 36.1 | GO:0004500 | dopamine beta-monooxygenase activity(GO:0004500) |
| 11.3 | 56.4 | GO:0030348 | syntaxin-3 binding(GO:0030348) |
| 11.2 | 33.7 | GO:0070890 | L-ascorbate:sodium symporter activity(GO:0008520) L-ascorbic acid transporter activity(GO:0015229) sodium-dependent L-ascorbate transmembrane transporter activity(GO:0070890) |
| 11.1 | 33.2 | GO:0004657 | proline dehydrogenase activity(GO:0004657) |
| 10.9 | 32.8 | GO:0002060 | purine nucleobase binding(GO:0002060) |
| 10.8 | 43.1 | GO:0004967 | glucagon receptor activity(GO:0004967) |
| 10.8 | 161.4 | GO:0045295 | gamma-catenin binding(GO:0045295) |
| 10.7 | 32.2 | GO:0015389 | pyrimidine- and adenine-specific:sodium symporter activity(GO:0015389) |
| 10.7 | 117.2 | GO:0004653 | polypeptide N-acetylgalactosaminyltransferase activity(GO:0004653) |
| 10.6 | 42.4 | GO:0008265 | Mo-molybdopterin cofactor sulfurase activity(GO:0008265) |
| 10.4 | 52.1 | GO:0038132 | neuregulin binding(GO:0038132) |
| 10.2 | 40.6 | GO:0047276 | N-acetyllactosaminide 3-alpha-galactosyltransferase activity(GO:0047276) |
| 10.1 | 60.8 | GO:0005005 | transmembrane-ephrin receptor activity(GO:0005005) |
| 10.0 | 29.9 | GO:0042392 | sphingosine-1-phosphate phosphatase activity(GO:0042392) |
| 9.9 | 29.7 | GO:0035403 | histone kinase activity (H3-T6 specific)(GO:0035403) |
| 9.9 | 39.5 | GO:0035827 | rubidium ion transmembrane transporter activity(GO:0035827) |
| 9.6 | 38.4 | GO:0051870 | methotrexate binding(GO:0051870) |
| 9.4 | 46.8 | GO:0008310 | single-stranded DNA 3'-5' exodeoxyribonuclease activity(GO:0008310) |
| 9.3 | 37.0 | GO:0045159 | myosin II binding(GO:0045159) |
| 9.2 | 27.5 | GO:0019763 | immunoglobulin receptor activity(GO:0019763) |
| 9.1 | 81.9 | GO:0005001 | transmembrane receptor protein tyrosine phosphatase activity(GO:0005001) transmembrane receptor protein phosphatase activity(GO:0019198) |
| 9.0 | 27.1 | GO:0050294 | steroid sulfotransferase activity(GO:0050294) |
| 8.5 | 68.0 | GO:0008172 | S-methyltransferase activity(GO:0008172) |
| 8.5 | 50.8 | GO:0008467 | [heparan sulfate]-glucosamine 3-sulfotransferase 1 activity(GO:0008467) |
| 8.4 | 67.5 | GO:0000064 | L-ornithine transmembrane transporter activity(GO:0000064) |
| 8.4 | 16.8 | GO:0031711 | bradykinin receptor binding(GO:0031711) |
| 8.1 | 24.4 | GO:0004505 | phenylalanine 4-monooxygenase activity(GO:0004505) |
| 8.0 | 56.3 | GO:0004957 | prostaglandin E receptor activity(GO:0004957) |
| 7.9 | 79.3 | GO:0015379 | potassium:chloride symporter activity(GO:0015379) potassium ion symporter activity(GO:0022820) |
| 7.9 | 31.7 | GO:0004706 | JUN kinase kinase kinase activity(GO:0004706) |
| 7.9 | 110.6 | GO:0042609 | CD4 receptor binding(GO:0042609) |
| 7.8 | 38.8 | GO:0004920 | interleukin-10 receptor activity(GO:0004920) |
| 7.7 | 69.6 | GO:0008239 | dipeptidyl-peptidase activity(GO:0008239) |
| 7.7 | 38.4 | GO:0043682 | copper-exporting ATPase activity(GO:0004008) copper-transporting ATPase activity(GO:0043682) |
| 7.7 | 23.0 | GO:0016403 | dimethylargininase activity(GO:0016403) |
| 7.6 | 68.1 | GO:0042285 | xylosyltransferase activity(GO:0042285) |
| 7.3 | 22.0 | GO:0015563 | thiamine transmembrane transporter activity(GO:0015234) uptake transmembrane transporter activity(GO:0015563) |
| 7.1 | 21.2 | GO:0098603 | selenol Se-methyltransferase activity(GO:0098603) |
| 7.0 | 35.2 | GO:0070051 | fibrinogen binding(GO:0070051) |
| 7.0 | 21.0 | GO:0016263 | glycoprotein-N-acetylgalactosamine 3-beta-galactosyltransferase activity(GO:0016263) |
| 7.0 | 70.1 | GO:0004385 | guanylate kinase activity(GO:0004385) |
| 7.0 | 28.0 | GO:0008427 | calcium-dependent protein kinase inhibitor activity(GO:0008427) |
| 7.0 | 97.7 | GO:0005243 | gap junction channel activity(GO:0005243) |
| 7.0 | 48.8 | GO:0043423 | 3-phosphoinositide-dependent protein kinase binding(GO:0043423) |
| 7.0 | 146.0 | GO:0098641 | cadherin binding involved in cell-cell adhesion(GO:0098641) |
| 6.9 | 20.7 | GO:0009384 | N-acylmannosamine kinase activity(GO:0009384) |
| 6.8 | 34.1 | GO:0052813 | phosphatidylinositol-4,5-bisphosphate 3-kinase activity(GO:0046934) phosphatidylinositol bisphosphate kinase activity(GO:0052813) |
| 6.8 | 81.2 | GO:0016208 | AMP binding(GO:0016208) |
| 6.7 | 20.2 | GO:0004566 | beta-glucuronidase activity(GO:0004566) |
| 6.7 | 93.8 | GO:0045236 | CXCR chemokine receptor binding(GO:0045236) |
| 6.7 | 40.2 | GO:0019767 | IgE receptor activity(GO:0019767) |
| 6.7 | 20.0 | GO:0042895 | antibiotic transporter activity(GO:0042895) |
| 6.6 | 19.8 | GO:0008241 | peptidyl-dipeptidase activity(GO:0008241) |
| 6.5 | 45.8 | GO:0004716 | receptor signaling protein tyrosine kinase activity(GO:0004716) |
| 6.4 | 141.8 | GO:0030676 | Rac guanyl-nucleotide exchange factor activity(GO:0030676) |
| 6.3 | 37.9 | GO:0090554 | phosphatidylcholine-translocating ATPase activity(GO:0090554) |
| 6.3 | 18.9 | GO:0008401 | retinoic acid 4-hydroxylase activity(GO:0008401) |
| 6.2 | 18.7 | GO:0004911 | interleukin-2 receptor activity(GO:0004911) |
| 6.2 | 6.2 | GO:0090555 | phosphatidylethanolamine-translocating ATPase activity(GO:0090555) |
| 6.0 | 17.9 | GO:0015141 | succinate transmembrane transporter activity(GO:0015141) |
| 5.8 | 17.5 | GO:0003941 | L-serine ammonia-lyase activity(GO:0003941) |
| 5.8 | 23.3 | GO:0015350 | methotrexate transporter activity(GO:0015350) |
| 5.8 | 40.8 | GO:0016661 | oxidoreductase activity, acting on other nitrogenous compounds as donors(GO:0016661) |
| 5.8 | 69.4 | GO:0070008 | serine-type exopeptidase activity(GO:0070008) |
| 5.8 | 17.3 | GO:0019797 | procollagen-proline 3-dioxygenase activity(GO:0019797) |
| 5.7 | 40.1 | GO:1990430 | extracellular matrix protein binding(GO:1990430) |
| 5.6 | 22.5 | GO:0004514 | nicotinate-nucleotide diphosphorylase (carboxylating) activity(GO:0004514) |
| 5.6 | 16.9 | GO:1902379 | chemoattractant activity involved in axon guidance(GO:1902379) |
| 5.6 | 22.5 | GO:0034739 | histone deacetylase activity (H4-K16 specific)(GO:0034739) |
| 5.6 | 22.4 | GO:0031750 | D3 dopamine receptor binding(GO:0031750) |
| 5.6 | 16.7 | GO:0031714 | C5a anaphylatoxin chemotactic receptor binding(GO:0031714) |
| 5.5 | 11.0 | GO:0004999 | vasoactive intestinal polypeptide receptor activity(GO:0004999) |
| 5.5 | 65.9 | GO:0004499 | N,N-dimethylaniline monooxygenase activity(GO:0004499) |
| 5.5 | 43.6 | GO:0045545 | syndecan binding(GO:0045545) |
| 5.4 | 21.8 | GO:0019136 | deoxynucleoside kinase activity(GO:0019136) |
| 5.4 | 59.9 | GO:0019864 | IgG binding(GO:0019864) |
| 5.4 | 10.8 | GO:0015137 | citrate transmembrane transporter activity(GO:0015137) |
| 5.3 | 42.6 | GO:0008430 | selenium binding(GO:0008430) |
| 5.3 | 15.9 | GO:0050429 | calcium-dependent phospholipase C activity(GO:0050429) |
| 5.2 | 26.2 | GO:0042608 | T cell receptor binding(GO:0042608) |
| 5.2 | 26.0 | GO:0070401 | NADP+ binding(GO:0070401) |
| 5.2 | 15.5 | GO:0051380 | norepinephrine binding(GO:0051380) |
| 5.1 | 25.7 | GO:0022841 | potassium ion leak channel activity(GO:0022841) |
| 5.1 | 46.3 | GO:0047760 | butyrate-CoA ligase activity(GO:0047760) |
| 5.1 | 51.5 | GO:0019957 | C-C chemokine binding(GO:0019957) |
| 5.1 | 10.2 | GO:0046935 | 1-phosphatidylinositol-3-kinase regulator activity(GO:0046935) |
| 5.0 | 95.6 | GO:0030296 | protein tyrosine kinase activator activity(GO:0030296) |
| 5.0 | 20.1 | GO:0002054 | nucleobase binding(GO:0002054) |
| 5.0 | 119.8 | GO:0031489 | myosin V binding(GO:0031489) |
| 5.0 | 19.9 | GO:0043120 | tumor necrosis factor binding(GO:0043120) |
| 5.0 | 9.9 | GO:0031735 | CCR10 chemokine receptor binding(GO:0031735) |
| 5.0 | 14.9 | GO:0005157 | macrophage colony-stimulating factor receptor binding(GO:0005157) |
| 4.9 | 4.9 | GO:0070653 | high-density lipoprotein particle receptor binding(GO:0070653) |
| 4.9 | 29.3 | GO:0004726 | non-membrane spanning protein tyrosine phosphatase activity(GO:0004726) |
| 4.9 | 43.9 | GO:0017034 | Rap guanyl-nucleotide exchange factor activity(GO:0017034) |
| 4.9 | 14.6 | GO:0004528 | phosphodiesterase I activity(GO:0004528) |
| 4.9 | 14.6 | GO:0035662 | Toll-like receptor 4 binding(GO:0035662) |
| 4.8 | 86.7 | GO:0005522 | profilin binding(GO:0005522) |
| 4.8 | 52.5 | GO:0005000 | vasopressin receptor activity(GO:0005000) |
| 4.8 | 14.3 | GO:0031826 | type 2A serotonin receptor binding(GO:0031826) |
| 4.8 | 19.0 | GO:0003986 | acetyl-CoA hydrolase activity(GO:0003986) |
| 4.7 | 28.5 | GO:0004028 | 3-chloroallyl aldehyde dehydrogenase activity(GO:0004028) |
| 4.7 | 94.3 | GO:0004602 | glutathione peroxidase activity(GO:0004602) |
| 4.6 | 22.9 | GO:0042289 | MHC class II protein binding(GO:0042289) |
| 4.6 | 13.7 | GO:0015252 | hydrogen ion channel activity(GO:0015252) |
| 4.5 | 63.3 | GO:0033691 | sialic acid binding(GO:0033691) |
| 4.5 | 18.1 | GO:0017089 | glycolipid transporter activity(GO:0017089) |
| 4.5 | 58.2 | GO:0004089 | carbonate dehydratase activity(GO:0004089) |
| 4.5 | 8.9 | GO:0003872 | 6-phosphofructokinase activity(GO:0003872) |
| 4.5 | 22.4 | GO:0046912 | transferase activity, transferring acyl groups, acyl groups converted into alkyl on transfer(GO:0046912) |
| 4.4 | 13.3 | GO:0005171 | hepatocyte growth factor receptor binding(GO:0005171) |
| 4.4 | 17.7 | GO:0010465 | nerve growth factor receptor activity(GO:0010465) |
| 4.4 | 4.4 | GO:0019862 | IgA binding(GO:0019862) |
| 4.4 | 4.4 | GO:0031727 | CCR2 chemokine receptor binding(GO:0031727) |
| 4.4 | 13.2 | GO:0038181 | bile acid receptor activity(GO:0038181) |
| 4.4 | 48.2 | GO:0070700 | BMP receptor binding(GO:0070700) |
| 4.4 | 43.6 | GO:0102337 | fatty acid elongase activity(GO:0009922) 3-oxo-arachidoyl-CoA synthase activity(GO:0102336) 3-oxo-cerotoyl-CoA synthase activity(GO:0102337) 3-oxo-lignoceronyl-CoA synthase activity(GO:0102338) |
| 4.4 | 13.1 | GO:0072590 | N-acetyl-L-aspartate-L-glutamate ligase activity(GO:0072590) |
| 4.4 | 17.4 | GO:0004771 | sterol esterase activity(GO:0004771) |
| 4.3 | 13.0 | GO:0070548 | L-glutamine aminotransferase activity(GO:0070548) |
| 4.3 | 8.5 | GO:0035005 | 1-phosphatidylinositol-4-phosphate 3-kinase activity(GO:0035005) |
| 4.2 | 12.6 | GO:0070061 | fructose binding(GO:0070061) |
| 4.2 | 492.3 | GO:0004867 | serine-type endopeptidase inhibitor activity(GO:0004867) |
| 4.2 | 12.6 | GO:0003876 | AMP deaminase activity(GO:0003876) adenosine-phosphate deaminase activity(GO:0047623) |
| 4.1 | 16.6 | GO:0050998 | nitric-oxide synthase binding(GO:0050998) |
| 4.1 | 12.4 | GO:1990460 | leptin receptor binding(GO:1990460) |
| 4.1 | 28.8 | GO:0004111 | creatine kinase activity(GO:0004111) |
| 4.1 | 20.3 | GO:0046923 | ER retention sequence binding(GO:0046923) |
| 4.0 | 16.1 | GO:0047619 | acylcarnitine hydrolase activity(GO:0047619) |
| 4.0 | 20.0 | GO:0070513 | death domain binding(GO:0070513) |
| 4.0 | 35.9 | GO:0034987 | immunoglobulin receptor binding(GO:0034987) |
| 4.0 | 11.9 | GO:0005006 | epidermal growth factor-activated receptor activity(GO:0005006) |
| 4.0 | 119.2 | GO:0031435 | mitogen-activated protein kinase kinase kinase binding(GO:0031435) |
| 3.9 | 19.7 | GO:0004758 | serine C-palmitoyltransferase activity(GO:0004758) C-palmitoyltransferase activity(GO:0016454) |
| 3.9 | 82.6 | GO:0001530 | lipopolysaccharide binding(GO:0001530) |
| 3.9 | 31.4 | GO:0030368 | interleukin-17 receptor activity(GO:0030368) |
| 3.9 | 11.7 | GO:0070735 | protein-glycine ligase activity(GO:0070735) |
| 3.9 | 69.9 | GO:0017081 | chloride channel regulator activity(GO:0017081) |
| 3.9 | 15.5 | GO:0016716 | oxidoreductase activity, acting on paired donors, with incorporation or reduction of molecular oxygen, another compound as one donor, and incorporation of one atom of oxygen(GO:0016716) |
| 3.9 | 11.6 | GO:0032810 | sterol response element binding(GO:0032810) |
| 3.9 | 30.8 | GO:0004035 | alkaline phosphatase activity(GO:0004035) |
| 3.8 | 34.6 | GO:0001013 | RNA polymerase I regulatory region DNA binding(GO:0001013) |
| 3.8 | 15.4 | GO:0003918 | DNA topoisomerase type II (ATP-hydrolyzing) activity(GO:0003918) DNA topoisomerase II activity(GO:0061505) |
| 3.8 | 11.5 | GO:0004605 | phosphatidate cytidylyltransferase activity(GO:0004605) |
| 3.8 | 15.3 | GO:0043533 | inositol 1,3,4,5 tetrakisphosphate binding(GO:0043533) |
| 3.8 | 26.6 | GO:0015651 | quaternary ammonium group transmembrane transporter activity(GO:0015651) |
| 3.7 | 11.1 | GO:0004307 | ethanolaminephosphotransferase activity(GO:0004307) |
| 3.7 | 29.5 | GO:0008046 | axon guidance receptor activity(GO:0008046) |
| 3.7 | 18.3 | GO:0097001 | ceramide binding(GO:0097001) |
| 3.6 | 29.2 | GO:0050544 | icosatetraenoic acid binding(GO:0050543) arachidonic acid binding(GO:0050544) |
| 3.6 | 36.5 | GO:0038036 | sphingosine-1-phosphate receptor activity(GO:0038036) |
| 3.6 | 10.9 | GO:0004040 | amidase activity(GO:0004040) |
| 3.6 | 14.5 | GO:0003835 | beta-galactoside alpha-2,6-sialyltransferase activity(GO:0003835) |
| 3.6 | 10.8 | GO:0004918 | interleukin-8 receptor activity(GO:0004918) interleukin-8 binding(GO:0019959) |
| 3.6 | 18.0 | GO:0008321 | Ral guanyl-nucleotide exchange factor activity(GO:0008321) |
| 3.6 | 10.8 | GO:0005220 | inositol 1,4,5-trisphosphate-sensitive calcium-release channel activity(GO:0005220) |
| 3.6 | 64.7 | GO:0015106 | bicarbonate transmembrane transporter activity(GO:0015106) |
| 3.6 | 35.8 | GO:0005412 | glucose:sodium symporter activity(GO:0005412) |
| 3.5 | 35.5 | GO:0051959 | dynein light intermediate chain binding(GO:0051959) |
| 3.5 | 91.6 | GO:0005154 | epidermal growth factor receptor binding(GO:0005154) |
| 3.5 | 31.3 | GO:0046790 | virion binding(GO:0046790) |
| 3.4 | 13.8 | GO:0060698 | endoribonuclease inhibitor activity(GO:0060698) |
| 3.4 | 20.5 | GO:0004749 | ribose phosphate diphosphokinase activity(GO:0004749) |
| 3.4 | 13.6 | GO:0030144 | alpha-1,6-mannosylglycoprotein 6-beta-N-acetylglucosaminyltransferase activity(GO:0030144) |
| 3.4 | 10.2 | GO:0004483 | mRNA (nucleoside-2'-O-)-methyltransferase activity(GO:0004483) |
| 3.4 | 10.2 | GO:0001605 | adrenomedullin receptor activity(GO:0001605) |
| 3.3 | 70.3 | GO:0046961 | proton-transporting ATPase activity, rotational mechanism(GO:0046961) |
| 3.3 | 16.6 | GO:0034235 | GPI anchor binding(GO:0034235) |
| 3.3 | 165.4 | GO:0004715 | non-membrane spanning protein tyrosine kinase activity(GO:0004715) |
| 3.2 | 13.0 | GO:0097108 | hedgehog family protein binding(GO:0097108) |
| 3.2 | 9.7 | GO:0035651 | AP-3 adaptor complex binding(GO:0035651) |
| 3.2 | 9.7 | GO:0046624 | sphingolipid transporter activity(GO:0046624) |
| 3.2 | 35.2 | GO:0030346 | protein phosphatase 2B binding(GO:0030346) |
| 3.2 | 6.4 | GO:0070053 | thrombospondin receptor activity(GO:0070053) |
| 3.2 | 86.2 | GO:0005328 | neurotransmitter:sodium symporter activity(GO:0005328) |
| 3.2 | 12.7 | GO:0003726 | double-stranded RNA adenosine deaminase activity(GO:0003726) |
| 3.2 | 6.3 | GO:0004027 | alcohol sulfotransferase activity(GO:0004027) |
| 3.1 | 9.3 | GO:0015189 | L-lysine transmembrane transporter activity(GO:0015189) |
| 3.1 | 102.0 | GO:0019707 | protein-cysteine S-palmitoyltransferase activity(GO:0019706) protein-cysteine S-acyltransferase activity(GO:0019707) |
| 3.1 | 15.4 | GO:0004994 | somatostatin receptor activity(GO:0004994) |
| 3.0 | 18.0 | GO:0016493 | C-C chemokine receptor activity(GO:0016493) |
| 3.0 | 50.2 | GO:0004697 | protein kinase C activity(GO:0004697) |
| 2.9 | 14.4 | GO:0004908 | interleukin-1 receptor activity(GO:0004908) |
| 2.9 | 11.5 | GO:0047756 | chondroitin 4-sulfotransferase activity(GO:0047756) |
| 2.9 | 25.8 | GO:0042577 | lipid phosphatase activity(GO:0042577) |
| 2.9 | 45.8 | GO:0031996 | thioesterase binding(GO:0031996) |
| 2.9 | 14.3 | GO:0016175 | superoxide-generating NADPH oxidase activity(GO:0016175) |
| 2.8 | 22.7 | GO:0030249 | guanylate cyclase regulator activity(GO:0030249) |
| 2.8 | 11.3 | GO:0019956 | chemokine binding(GO:0019956) |
| 2.8 | 47.8 | GO:0015643 | toxic substance binding(GO:0015643) |
| 2.8 | 8.4 | GO:0019958 | C-X-C chemokine binding(GO:0019958) |
| 2.8 | 25.1 | GO:0034483 | heparan sulfate sulfotransferase activity(GO:0034483) |
| 2.8 | 11.1 | GO:0070579 | methylcytosine dioxygenase activity(GO:0070579) |
| 2.8 | 49.5 | GO:0030159 | receptor signaling complex scaffold activity(GO:0030159) |
| 2.7 | 32.8 | GO:0001161 | intronic transcription regulatory region sequence-specific DNA binding(GO:0001161) |
| 2.7 | 2.7 | GO:0001637 | G-protein coupled chemoattractant receptor activity(GO:0001637) |
| 2.7 | 8.2 | GO:0070300 | phosphatidic acid binding(GO:0070300) |
| 2.7 | 21.7 | GO:0001075 | transcription factor activity, RNA polymerase II core promoter sequence-specific binding involved in preinitiation complex assembly(GO:0001075) |
| 2.7 | 24.4 | GO:0001730 | 2'-5'-oligoadenylate synthetase activity(GO:0001730) |
| 2.6 | 7.9 | GO:0005168 | neurotrophin TRKA receptor binding(GO:0005168) |
| 2.6 | 185.0 | GO:0005089 | Rho guanyl-nucleotide exchange factor activity(GO:0005089) |
| 2.6 | 33.6 | GO:0097200 | cysteine-type endopeptidase activity involved in apoptotic process(GO:0097153) cysteine-type endopeptidase activity involved in execution phase of apoptosis(GO:0097200) |
| 2.6 | 36.1 | GO:0070411 | I-SMAD binding(GO:0070411) |
| 2.6 | 25.8 | GO:0032036 | myosin heavy chain binding(GO:0032036) |
| 2.6 | 30.6 | GO:0016290 | palmitoyl-CoA hydrolase activity(GO:0016290) |
| 2.5 | 71.0 | GO:0016701 | oxidoreductase activity, acting on single donors with incorporation of molecular oxygen(GO:0016701) |
| 2.5 | 15.1 | GO:0015349 | thyroid hormone transmembrane transporter activity(GO:0015349) |
| 2.5 | 67.9 | GO:0016849 | cyclase activity(GO:0009975) phosphorus-oxygen lyase activity(GO:0016849) |
| 2.5 | 7.5 | GO:0004315 | 3-oxoacyl-[acyl-carrier-protein] synthase activity(GO:0004315) |
| 2.5 | 89.8 | GO:0035255 | ionotropic glutamate receptor binding(GO:0035255) |
| 2.5 | 10.0 | GO:0035650 | AP-1 adaptor complex binding(GO:0035650) |
| 2.5 | 22.2 | GO:0008381 | mechanically-gated ion channel activity(GO:0008381) mechanically gated channel activity(GO:0022833) |
| 2.5 | 27.1 | GO:0005451 | monovalent cation:proton antiporter activity(GO:0005451) |
| 2.5 | 4.9 | GO:0015265 | urea channel activity(GO:0015265) |
| 2.5 | 9.8 | GO:0004430 | 1-phosphatidylinositol 4-kinase activity(GO:0004430) |
| 2.5 | 7.4 | GO:0003945 | N-acetyllactosamine synthase activity(GO:0003945) |
| 2.4 | 7.3 | GO:0015220 | choline transmembrane transporter activity(GO:0015220) |
| 2.4 | 2.4 | GO:0097603 | temperature-gated ion channel activity(GO:0097603) |
| 2.4 | 9.7 | GO:0019776 | Atg8 ligase activity(GO:0019776) |
| 2.4 | 7.2 | GO:0004066 | asparagine synthase (glutamine-hydrolyzing) activity(GO:0004066) |
| 2.4 | 26.5 | GO:0051011 | microtubule minus-end binding(GO:0051011) |
| 2.4 | 14.4 | GO:0046920 | alpha-(1->3)-fucosyltransferase activity(GO:0046920) |
| 2.4 | 55.0 | GO:0001968 | fibronectin binding(GO:0001968) |
| 2.4 | 7.1 | GO:0016309 | 1-phosphatidylinositol-5-phosphate 4-kinase activity(GO:0016309) |
| 2.4 | 9.5 | GO:0004949 | cannabinoid receptor activity(GO:0004949) |
| 2.4 | 26.1 | GO:0008131 | primary amine oxidase activity(GO:0008131) |
| 2.4 | 11.8 | GO:0016262 | protein N-acetylglucosaminyltransferase activity(GO:0016262) |
| 2.4 | 14.2 | GO:0008526 | phosphatidylinositol transporter activity(GO:0008526) |
| 2.4 | 4.7 | GO:0005176 | ErbB-2 class receptor binding(GO:0005176) |
| 2.4 | 14.1 | GO:0008508 | bile acid:sodium symporter activity(GO:0008508) |
| 2.3 | 14.0 | GO:0032554 | purine deoxyribonucleotide binding(GO:0032554) |
| 2.3 | 111.3 | GO:0005044 | scavenger receptor activity(GO:0005044) |
| 2.3 | 27.5 | GO:0036312 | phosphatidylinositol 3-kinase regulatory subunit binding(GO:0036312) |
| 2.3 | 11.4 | GO:0018812 | 3-hydroxyacyl-CoA dehydratase activity(GO:0018812) |
| 2.3 | 32.0 | GO:0005391 | sodium:potassium-exchanging ATPase activity(GO:0005391) |
| 2.3 | 16.0 | GO:0052742 | phosphatidylinositol kinase activity(GO:0052742) |
| 2.3 | 6.9 | GO:0015204 | urea transmembrane transporter activity(GO:0015204) |
| 2.3 | 6.8 | GO:0004769 | steroid delta-isomerase activity(GO:0004769) |
| 2.3 | 6.8 | GO:0048403 | brain-derived neurotrophic factor binding(GO:0048403) |
| 2.3 | 47.4 | GO:0043325 | phosphatidylinositol-3,4-bisphosphate binding(GO:0043325) |
| 2.2 | 9.0 | GO:0004945 | angiotensin type II receptor activity(GO:0004945) |
| 2.2 | 17.9 | GO:0003964 | telomerase activity(GO:0003720) RNA-directed DNA polymerase activity(GO:0003964) |
| 2.2 | 11.2 | GO:0050694 | galactose 3-O-sulfotransferase activity(GO:0050694) |
| 2.2 | 13.4 | GO:0008889 | glycerophosphodiester phosphodiesterase activity(GO:0008889) |
| 2.2 | 13.3 | GO:0046979 | TAP binding(GO:0046977) TAP1 binding(GO:0046978) TAP2 binding(GO:0046979) |
| 2.2 | 28.9 | GO:0005092 | GDP-dissociation inhibitor activity(GO:0005092) |
| 2.2 | 31.1 | GO:0047555 | 3',5'-cyclic-GMP phosphodiesterase activity(GO:0047555) |
| 2.2 | 6.6 | GO:0019809 | spermidine binding(GO:0019809) |
| 2.2 | 13.2 | GO:0042500 | aspartic endopeptidase activity, intramembrane cleaving(GO:0042500) |
| 2.2 | 19.8 | GO:0050750 | low-density lipoprotein particle receptor binding(GO:0050750) |
| 2.2 | 15.4 | GO:0070097 | delta-catenin binding(GO:0070097) |
| 2.2 | 6.6 | GO:0052650 | NADP-retinol dehydrogenase activity(GO:0052650) |
| 2.2 | 13.2 | GO:0005172 | vascular endothelial growth factor receptor binding(GO:0005172) |
| 2.2 | 11.0 | GO:0003886 | DNA (cytosine-5-)-methyltransferase activity(GO:0003886) |
| 2.2 | 11.0 | GO:1990932 | 5.8S rRNA binding(GO:1990932) |
| 2.2 | 6.5 | GO:0033906 | hyaluronoglucuronidase activity(GO:0033906) |
| 2.2 | 106.4 | GO:0016712 | oxidoreductase activity, acting on paired donors, with incorporation or reduction of molecular oxygen, reduced flavin or flavoprotein as one donor, and incorporation of one atom of oxygen(GO:0016712) |
| 2.2 | 8.6 | GO:0045125 | bioactive lipid receptor activity(GO:0045125) |
| 2.2 | 12.9 | GO:0001517 | N-acetylglucosamine 6-O-sulfotransferase activity(GO:0001517) |
| 2.1 | 8.6 | GO:0004013 | adenosylhomocysteinase activity(GO:0004013) trialkylsulfonium hydrolase activity(GO:0016802) |
| 2.1 | 15.0 | GO:0019808 | polyamine binding(GO:0019808) |
| 2.1 | 47.0 | GO:0005452 | inorganic anion exchanger activity(GO:0005452) |
| 2.1 | 8.5 | GO:0034452 | dynactin binding(GO:0034452) |
| 2.1 | 6.4 | GO:0004793 | threonine aldolase activity(GO:0004793) L-allo-threonine aldolase activity(GO:0008732) serine binding(GO:0070905) |
| 2.1 | 8.5 | GO:0015184 | L-cystine transmembrane transporter activity(GO:0015184) |
| 2.1 | 8.4 | GO:0071558 | histone demethylase activity (H3-K27 specific)(GO:0071558) |
| 2.1 | 6.3 | GO:0004655 | porphobilinogen synthase activity(GO:0004655) |
| 2.1 | 8.3 | GO:0004897 | ciliary neurotrophic factor receptor activity(GO:0004897) |
| 2.1 | 18.7 | GO:0001727 | lipid kinase activity(GO:0001727) |
| 2.1 | 6.2 | GO:0005068 | transmembrane receptor protein tyrosine kinase adaptor activity(GO:0005068) |
| 2.1 | 43.6 | GO:0042169 | SH2 domain binding(GO:0042169) |
| 2.1 | 10.4 | GO:0017169 | CDP-alcohol phosphatidyltransferase activity(GO:0017169) |
| 2.1 | 10.3 | GO:0030955 | potassium ion binding(GO:0030955) |
| 2.1 | 8.2 | GO:0044729 | hemi-methylated DNA-binding(GO:0044729) |
| 2.1 | 16.4 | GO:0005007 | fibroblast growth factor-activated receptor activity(GO:0005007) |
| 2.0 | 8.2 | GO:0004694 | eukaryotic translation initiation factor 2alpha kinase activity(GO:0004694) |
| 2.0 | 10.2 | GO:0031404 | chloride ion binding(GO:0031404) |
| 2.0 | 12.2 | GO:0017162 | aryl hydrocarbon receptor binding(GO:0017162) |
| 2.0 | 36.4 | GO:0005031 | tumor necrosis factor-activated receptor activity(GO:0005031) death receptor activity(GO:0005035) |
| 2.0 | 28.3 | GO:0003688 | DNA replication origin binding(GO:0003688) |
| 2.0 | 16.0 | GO:0031681 | G-protein beta-subunit binding(GO:0031681) |
| 2.0 | 14.0 | GO:0004630 | phospholipase D activity(GO:0004630) |
| 2.0 | 39.9 | GO:0030742 | GTP-dependent protein binding(GO:0030742) |
| 2.0 | 61.7 | GO:0042605 | peptide antigen binding(GO:0042605) |
| 2.0 | 4.0 | GO:0030977 | taurine binding(GO:0030977) |
| 2.0 | 25.6 | GO:0047372 | acylglycerol lipase activity(GO:0047372) |
| 2.0 | 3.9 | GO:0030235 | nitric-oxide synthase regulator activity(GO:0030235) |
| 2.0 | 3.9 | GO:0008158 | hedgehog receptor activity(GO:0008158) |
| 2.0 | 9.8 | GO:0033142 | progesterone receptor binding(GO:0033142) |
| 2.0 | 5.9 | GO:0001565 | phorbol ester receptor activity(GO:0001565) |
| 1.9 | 9.7 | GO:0004969 | histamine receptor activity(GO:0004969) |
| 1.9 | 92.8 | GO:0004896 | cytokine receptor activity(GO:0004896) |
| 1.9 | 9.6 | GO:0098918 | structural constituent of synapse(GO:0098918) |
| 1.9 | 140.6 | GO:0005178 | integrin binding(GO:0005178) |
| 1.9 | 3.8 | GO:0051022 | Rho GDP-dissociation inhibitor binding(GO:0051022) |
| 1.9 | 24.7 | GO:0015095 | magnesium ion transmembrane transporter activity(GO:0015095) |
| 1.9 | 7.6 | GO:0000293 | ferric-chelate reductase activity(GO:0000293) |
| 1.9 | 235.6 | GO:0008201 | heparin binding(GO:0008201) |
| 1.9 | 5.6 | GO:0043812 | phosphatidylinositol-4-phosphate phosphatase activity(GO:0043812) |
| 1.9 | 20.5 | GO:0016888 | endodeoxyribonuclease activity, producing 5'-phosphomonoesters(GO:0016888) |
| 1.9 | 33.3 | GO:0033613 | activating transcription factor binding(GO:0033613) |
| 1.8 | 5.5 | GO:0017168 | 5-oxoprolinase (ATP-hydrolyzing) activity(GO:0017168) |
| 1.8 | 7.3 | GO:0047179 | platelet-activating factor acetyltransferase activity(GO:0047179) |
| 1.8 | 9.1 | GO:0001758 | retinal dehydrogenase activity(GO:0001758) |
| 1.8 | 12.7 | GO:0051861 | glycolipid binding(GO:0051861) |
| 1.8 | 3.6 | GO:0000253 | 3-keto sterol reductase activity(GO:0000253) |
| 1.8 | 52.3 | GO:0005504 | fatty acid binding(GO:0005504) |
| 1.8 | 5.4 | GO:0009041 | uridylate kinase activity(GO:0009041) |
| 1.8 | 7.1 | GO:0004301 | epoxide hydrolase activity(GO:0004301) |
| 1.8 | 5.3 | GO:1990715 | mRNA CDS binding(GO:1990715) |
| 1.8 | 21.2 | GO:0008097 | 5S rRNA binding(GO:0008097) |
| 1.8 | 5.3 | GO:0001069 | regulatory region RNA binding(GO:0001069) |
| 1.8 | 185.8 | GO:0017124 | SH3 domain binding(GO:0017124) |
| 1.8 | 7.0 | GO:0001093 | TFIIB-class transcription factor binding(GO:0001093) |
| 1.7 | 10.5 | GO:0051880 | G-quadruplex DNA binding(GO:0051880) |
| 1.7 | 26.2 | GO:0070412 | R-SMAD binding(GO:0070412) |
| 1.7 | 13.8 | GO:0051525 | NFAT protein binding(GO:0051525) |
| 1.7 | 10.4 | GO:0004982 | N-formyl peptide receptor activity(GO:0004982) |
| 1.7 | 34.1 | GO:0005388 | calcium-transporting ATPase activity(GO:0005388) |
| 1.7 | 3.4 | GO:0015143 | urate transmembrane transporter activity(GO:0015143) salt transmembrane transporter activity(GO:1901702) |
| 1.7 | 1.7 | GO:0004677 | DNA-dependent protein kinase activity(GO:0004677) |
| 1.7 | 13.5 | GO:0023026 | MHC class II protein complex binding(GO:0023026) |
| 1.7 | 8.4 | GO:0015166 | polyol transmembrane transporter activity(GO:0015166) glycerol transmembrane transporter activity(GO:0015168) |
| 1.7 | 24.8 | GO:0043522 | leucine zipper domain binding(GO:0043522) |
| 1.6 | 4.9 | GO:0004814 | arginine-tRNA ligase activity(GO:0004814) |
| 1.6 | 13.1 | GO:0042043 | neurexin family protein binding(GO:0042043) |
| 1.6 | 21.1 | GO:0033130 | acetylcholine receptor binding(GO:0033130) |
| 1.6 | 4.9 | GO:0030626 | U12 snRNA binding(GO:0030626) |
| 1.6 | 25.9 | GO:0048020 | CCR chemokine receptor binding(GO:0048020) |
| 1.6 | 33.8 | GO:0015923 | mannosidase activity(GO:0015923) |
| 1.6 | 19.3 | GO:0003708 | retinoic acid receptor activity(GO:0003708) |
| 1.6 | 35.3 | GO:0017075 | syntaxin-1 binding(GO:0017075) |
| 1.6 | 30.4 | GO:0008199 | ferric iron binding(GO:0008199) |
| 1.6 | 17.6 | GO:0008242 | omega peptidase activity(GO:0008242) |
| 1.6 | 570.4 | GO:0050839 | cell adhesion molecule binding(GO:0050839) |
| 1.6 | 4.7 | GO:0004359 | glutaminase activity(GO:0004359) |
| 1.6 | 12.6 | GO:0015299 | solute:proton antiporter activity(GO:0015299) |
| 1.6 | 11.1 | GO:0015038 | glutathione disulfide oxidoreductase activity(GO:0015038) |
| 1.6 | 9.3 | GO:0030976 | thiamine pyrophosphate binding(GO:0030976) |
| 1.6 | 6.2 | GO:0008449 | N-acetylglucosamine-6-sulfatase activity(GO:0008449) |
| 1.5 | 1.5 | GO:0005294 | neutral L-amino acid secondary active transmembrane transporter activity(GO:0005294) |
| 1.5 | 29.2 | GO:0017056 | structural constituent of nuclear pore(GO:0017056) |
| 1.5 | 13.8 | GO:0015187 | glycine transmembrane transporter activity(GO:0015187) |
| 1.5 | 4.6 | GO:0033823 | procollagen-lysine 5-dioxygenase activity(GO:0008475) procollagen glucosyltransferase activity(GO:0033823) |
| 1.5 | 12.1 | GO:0035033 | histone deacetylase regulator activity(GO:0035033) |
| 1.5 | 7.6 | GO:0004064 | arylesterase activity(GO:0004064) |
| 1.5 | 4.5 | GO:0015292 | uniporter activity(GO:0015292) |
| 1.5 | 16.6 | GO:0004115 | 3',5'-cyclic-AMP phosphodiesterase activity(GO:0004115) |
| 1.5 | 11.9 | GO:0050291 | sphingosine N-acyltransferase activity(GO:0050291) |
| 1.5 | 5.9 | GO:0051377 | mannose-ethanolamine phosphotransferase activity(GO:0051377) |
| 1.5 | 14.8 | GO:0070679 | inositol 1,4,5 trisphosphate binding(GO:0070679) |
| 1.5 | 25.1 | GO:0005149 | interleukin-1 receptor binding(GO:0005149) |
| 1.5 | 4.4 | GO:0000026 | alpha-1,2-mannosyltransferase activity(GO:0000026) |
| 1.5 | 47.1 | GO:0008146 | sulfotransferase activity(GO:0008146) |
| 1.5 | 5.9 | GO:0003842 | 1-pyrroline-5-carboxylate dehydrogenase activity(GO:0003842) |
| 1.4 | 20.1 | GO:0017127 | cholesterol transporter activity(GO:0017127) |
| 1.4 | 55.7 | GO:0017112 | Rab guanyl-nucleotide exchange factor activity(GO:0017112) |
| 1.4 | 20.9 | GO:0004012 | phospholipid-translocating ATPase activity(GO:0004012) |
| 1.4 | 4.1 | GO:0016414 | carnitine O-octanoyltransferase activity(GO:0008458) O-octanoyltransferase activity(GO:0016414) |
| 1.4 | 9.6 | GO:0019870 | potassium channel inhibitor activity(GO:0019870) |
| 1.4 | 4.1 | GO:0032422 | purine-rich negative regulatory element binding(GO:0032422) |
| 1.4 | 12.2 | GO:1904264 | ubiquitin protein ligase activity involved in ERAD pathway(GO:1904264) |
| 1.4 | 4.1 | GO:0000991 | transcription factor activity, core RNA polymerase II binding(GO:0000991) |
| 1.3 | 41.7 | GO:0097110 | scaffold protein binding(GO:0097110) |
| 1.3 | 9.4 | GO:0015526 | hexose phosphate transmembrane transporter activity(GO:0015119) organophosphate:inorganic phosphate antiporter activity(GO:0015315) hexose-phosphate:inorganic phosphate antiporter activity(GO:0015526) glucose 6-phosphate:inorganic phosphate antiporter activity(GO:0061513) |
| 1.3 | 10.6 | GO:0047134 | protein-disulfide reductase activity(GO:0047134) |
| 1.3 | 6.6 | GO:0047631 | ADP-ribose diphosphatase activity(GO:0047631) |
| 1.3 | 5.2 | GO:0045322 | unmethylated CpG binding(GO:0045322) |
| 1.3 | 6.5 | GO:0001665 | alpha-N-acetylgalactosaminide alpha-2,6-sialyltransferase activity(GO:0001665) |
| 1.3 | 9.2 | GO:0005432 | calcium:sodium antiporter activity(GO:0005432) |
| 1.3 | 5.2 | GO:0016176 | superoxide-generating NADPH oxidase activator activity(GO:0016176) |
| 1.3 | 12.9 | GO:0048407 | platelet-derived growth factor binding(GO:0048407) |
| 1.3 | 3.9 | GO:0008384 | IkappaB kinase activity(GO:0008384) |
| 1.3 | 14.0 | GO:0017151 | DEAD/H-box RNA helicase binding(GO:0017151) |
| 1.3 | 6.3 | GO:0072345 | NAADP-sensitive calcium-release channel activity(GO:0072345) |
| 1.2 | 8.7 | GO:0004468 | lysine N-acetyltransferase activity, acting on acetyl phosphate as donor(GO:0004468) |
| 1.2 | 7.5 | GO:1990239 | steroid hormone binding(GO:1990239) |
| 1.2 | 28.0 | GO:0050699 | WW domain binding(GO:0050699) |
| 1.2 | 7.3 | GO:0017176 | phosphatidylinositol N-acetylglucosaminyltransferase activity(GO:0017176) |
| 1.2 | 4.8 | GO:0019002 | GMP binding(GO:0019002) |
| 1.2 | 2.4 | GO:0035939 | microsatellite binding(GO:0035939) |
| 1.2 | 11.9 | GO:0005132 | type I interferon receptor binding(GO:0005132) |
| 1.2 | 14.2 | GO:0004033 | aldo-keto reductase (NADP) activity(GO:0004033) |
| 1.2 | 2.4 | GO:0015347 | sodium-independent organic anion transmembrane transporter activity(GO:0015347) |
| 1.2 | 8.2 | GO:0008331 | high voltage-gated calcium channel activity(GO:0008331) |
| 1.2 | 3.5 | GO:0003976 | UDP-N-acetylglucosamine-lysosomal-enzyme N-acetylglucosaminephosphotransferase activity(GO:0003976) |
| 1.2 | 3.5 | GO:0097100 | supercoiled DNA binding(GO:0097100) |
| 1.2 | 2.3 | GO:0001635 | calcitonin gene-related peptide receptor activity(GO:0001635) |
| 1.2 | 2.3 | GO:0043398 | HLH domain binding(GO:0043398) |
| 1.2 | 8.1 | GO:0038062 | protein tyrosine kinase collagen receptor activity(GO:0038062) |
| 1.2 | 5.8 | GO:0005041 | low-density lipoprotein receptor activity(GO:0005041) |
| 1.1 | 3.4 | GO:0004724 | magnesium-dependent protein serine/threonine phosphatase activity(GO:0004724) |
| 1.1 | 5.7 | GO:0015616 | DNA translocase activity(GO:0015616) |
| 1.1 | 5.7 | GO:0001134 | transcription factor activity, transcription factor recruiting(GO:0001134) |
| 1.1 | 5.6 | GO:0070137 | ubiquitin-like protein-specific endopeptidase activity(GO:0070137) SUMO-specific endopeptidase activity(GO:0070139) |
| 1.1 | 220.3 | GO:0008236 | serine-type peptidase activity(GO:0008236) |
| 1.1 | 7.9 | GO:0008308 | voltage-gated anion channel activity(GO:0008308) |
| 1.1 | 4.5 | GO:0016634 | oxidoreductase activity, acting on the CH-CH group of donors, oxygen as acceptor(GO:0016634) |
| 1.1 | 14.3 | GO:0052866 | phosphatidylinositol phosphate phosphatase activity(GO:0052866) |
| 1.1 | 86.3 | GO:0030165 | PDZ domain binding(GO:0030165) |
| 1.1 | 6.6 | GO:0008392 | arachidonic acid epoxygenase activity(GO:0008392) |
| 1.1 | 4.3 | GO:0015093 | iron ion transmembrane transporter activity(GO:0005381) ferrous iron transmembrane transporter activity(GO:0015093) |
| 1.1 | 5.4 | GO:0004931 | extracellular ATP-gated cation channel activity(GO:0004931) ATP-gated ion channel activity(GO:0035381) |
| 1.1 | 13.9 | GO:0001540 | beta-amyloid binding(GO:0001540) |
| 1.1 | 85.7 | GO:0003777 | microtubule motor activity(GO:0003777) |
| 1.1 | 6.4 | GO:0000150 | recombinase activity(GO:0000150) |
| 1.1 | 11.7 | GO:0031434 | mitogen-activated protein kinase kinase binding(GO:0031434) |
| 1.1 | 10.7 | GO:0030306 | ADP-ribosylation factor binding(GO:0030306) |
| 1.1 | 13.8 | GO:0071837 | HMG box domain binding(GO:0071837) |
| 1.1 | 3.2 | GO:0030229 | very-low-density lipoprotein particle receptor activity(GO:0030229) |
| 1.1 | 13.8 | GO:0022829 | wide pore channel activity(GO:0022829) |
| 1.1 | 5.3 | GO:0034597 | phosphatidylinositol-4,5-bisphosphate 4-phosphatase activity(GO:0034597) |
| 1.1 | 3.2 | GO:0016774 | phosphotransferase activity, carboxyl group as acceptor(GO:0016774) |
| 1.0 | 5.2 | GO:0048018 | receptor agonist activity(GO:0048018) |
| 1.0 | 3.1 | GO:0004736 | pyruvate carboxylase activity(GO:0004736) |
| 1.0 | 28.9 | GO:0004693 | cyclin-dependent protein serine/threonine kinase activity(GO:0004693) |
| 1.0 | 11.3 | GO:0008641 | small protein activating enzyme activity(GO:0008641) |
| 1.0 | 12.2 | GO:0046966 | thyroid hormone receptor binding(GO:0046966) |
| 1.0 | 4.0 | GO:0032896 | palmitoyl-CoA 9-desaturase activity(GO:0032896) |
| 1.0 | 11.0 | GO:0015238 | drug transmembrane transporter activity(GO:0015238) |
| 1.0 | 11.9 | GO:0004435 | phosphatidylinositol phospholipase C activity(GO:0004435) |
| 1.0 | 2.0 | GO:0042910 | xenobiotic transporter activity(GO:0042910) |
| 1.0 | 2.9 | GO:0032217 | riboflavin transporter activity(GO:0032217) |
| 1.0 | 6.8 | GO:0003896 | DNA primase activity(GO:0003896) |
| 1.0 | 9.7 | GO:0033170 | DNA clamp loader activity(GO:0003689) protein-DNA loading ATPase activity(GO:0033170) |
| 1.0 | 2.9 | GO:1901612 | cardiolipin binding(GO:1901612) |
| 1.0 | 12.5 | GO:0017049 | GTP-Rho binding(GO:0017049) |
| 1.0 | 6.7 | GO:0050700 | CARD domain binding(GO:0050700) |
| 0.9 | 3.8 | GO:0048495 | Roundabout binding(GO:0048495) |
| 0.9 | 4.7 | GO:0005338 | nucleotide-sugar transmembrane transporter activity(GO:0005338) |
| 0.9 | 5.6 | GO:0005542 | folic acid binding(GO:0005542) |
| 0.9 | 13.8 | GO:0035497 | cAMP response element binding(GO:0035497) |
| 0.9 | 2.8 | GO:0016822 | hydrolase activity, acting on acid carbon-carbon bonds(GO:0016822) hydrolase activity, acting on acid carbon-carbon bonds, in ketonic substances(GO:0016823) |
| 0.9 | 1.8 | GO:0034211 | GTP-dependent protein kinase activity(GO:0034211) |
| 0.9 | 2.7 | GO:0004556 | alpha-amylase activity(GO:0004556) |
| 0.9 | 37.8 | GO:0005201 | extracellular matrix structural constituent(GO:0005201) |
| 0.9 | 11.6 | GO:0031005 | filamin binding(GO:0031005) |
| 0.9 | 5.3 | GO:0038024 | cargo receptor activity(GO:0038024) |
| 0.9 | 42.7 | GO:0035064 | methylated histone binding(GO:0035064) |
| 0.9 | 13.9 | GO:0017017 | MAP kinase tyrosine/serine/threonine phosphatase activity(GO:0017017) |
| 0.9 | 3.4 | GO:0042731 | PH domain binding(GO:0042731) |
| 0.8 | 4.2 | GO:0008349 | MAP kinase kinase kinase kinase activity(GO:0008349) |
| 0.8 | 2.5 | GO:0004809 | tRNA (guanine-N2-)-methyltransferase activity(GO:0004809) |
| 0.8 | 31.8 | GO:0032947 | protein complex scaffold(GO:0032947) |
| 0.8 | 21.8 | GO:0017091 | AU-rich element binding(GO:0017091) |
| 0.8 | 68.3 | GO:0008080 | N-acetyltransferase activity(GO:0008080) |
| 0.8 | 4.1 | GO:0030492 | hemoglobin binding(GO:0030492) |
| 0.8 | 1.6 | GO:0008432 | JUN kinase binding(GO:0008432) |
| 0.8 | 24.4 | GO:0019205 | nucleobase-containing compound kinase activity(GO:0019205) |
| 0.8 | 5.7 | GO:0016670 | oxidoreductase activity, acting on a sulfur group of donors, oxygen as acceptor(GO:0016670) |
| 0.8 | 4.1 | GO:0004614 | phosphoglucomutase activity(GO:0004614) |
| 0.8 | 2.4 | GO:0004691 | cAMP-dependent protein kinase activity(GO:0004691) |
| 0.8 | 36.2 | GO:0005085 | guanyl-nucleotide exchange factor activity(GO:0005085) |
| 0.8 | 8.7 | GO:0008443 | 6-phosphofructo-2-kinase activity(GO:0003873) phosphofructokinase activity(GO:0008443) |
| 0.8 | 47.8 | GO:0002039 | p53 binding(GO:0002039) |
| 0.8 | 13.2 | GO:0070273 | phosphatidylinositol-4-phosphate binding(GO:0070273) |
| 0.8 | 4.7 | GO:0047961 | glycine N-acyltransferase activity(GO:0047961) |
| 0.8 | 3.1 | GO:0000995 | transcription factor activity, core RNA polymerase III binding(GO:0000995) |
| 0.8 | 3.1 | GO:0004114 | 3',5'-cyclic-nucleotide phosphodiesterase activity(GO:0004114) |
| 0.8 | 3.0 | GO:0036122 | BMP binding(GO:0036122) |
| 0.8 | 3.8 | GO:0008296 | 3'-5'-exodeoxyribonuclease activity(GO:0008296) |
| 0.8 | 5.3 | GO:0050897 | cobalt ion binding(GO:0050897) |
| 0.7 | 2.2 | GO:0004030 | aldehyde dehydrogenase [NAD(P)+] activity(GO:0004030) |
| 0.7 | 49.6 | GO:0000979 | RNA polymerase II core promoter sequence-specific DNA binding(GO:0000979) |
| 0.7 | 6.7 | GO:0070182 | DNA polymerase binding(GO:0070182) |
| 0.7 | 2.2 | GO:0071617 | lysophospholipid acyltransferase activity(GO:0071617) |
| 0.7 | 45.4 | GO:0001948 | glycoprotein binding(GO:0001948) |
| 0.7 | 5.1 | GO:0052832 | inositol monophosphate 1-phosphatase activity(GO:0008934) inositol monophosphate 3-phosphatase activity(GO:0052832) |
| 0.7 | 3.6 | GO:0008140 | cAMP response element binding protein binding(GO:0008140) |
| 0.7 | 87.0 | GO:0035091 | phosphatidylinositol binding(GO:0035091) |
| 0.7 | 7.1 | GO:0001608 | G-protein coupled nucleotide receptor activity(GO:0001608) G-protein coupled purinergic nucleotide receptor activity(GO:0045028) |
| 0.7 | 12.7 | GO:0004714 | transmembrane receptor protein tyrosine kinase activity(GO:0004714) |
| 0.7 | 1.4 | GO:0042799 | histone methyltransferase activity (H4-K20 specific)(GO:0042799) |
| 0.7 | 7.0 | GO:0004551 | nucleotide diphosphatase activity(GO:0004551) |
| 0.7 | 2.1 | GO:0001224 | RNA polymerase II transcription cofactor binding(GO:0001224) RNA polymerase II transcription corepressor binding(GO:0001226) |
| 0.7 | 7.6 | GO:0043548 | phosphatidylinositol 3-kinase binding(GO:0043548) |
| 0.7 | 5.5 | GO:0047498 | calcium-dependent phospholipase A2 activity(GO:0047498) |
| 0.7 | 3.4 | GO:0031748 | D1 dopamine receptor binding(GO:0031748) |
| 0.7 | 2.1 | GO:0004582 | dolichyl-phosphate beta-D-mannosyltransferase activity(GO:0004582) |
| 0.7 | 2.1 | GO:0005534 | galactose binding(GO:0005534) |
| 0.7 | 12.3 | GO:0016628 | oxidoreductase activity, acting on the CH-CH group of donors, NAD or NADP as acceptor(GO:0016628) |
| 0.7 | 2.7 | GO:0044547 | DNA topoisomerase binding(GO:0044547) |
| 0.7 | 2.0 | GO:0000171 | ribonuclease MRP activity(GO:0000171) |
| 0.7 | 2.0 | GO:0042809 | vitamin D receptor binding(GO:0042809) |
| 0.6 | 3.9 | GO:0035368 | selenocysteine insertion sequence binding(GO:0035368) |
| 0.6 | 11.6 | GO:0015297 | antiporter activity(GO:0015297) |
| 0.6 | 13.6 | GO:0001965 | G-protein alpha-subunit binding(GO:0001965) |
| 0.6 | 14.1 | GO:0051059 | NF-kappaB binding(GO:0051059) |
| 0.6 | 4.5 | GO:0016286 | small conductance calcium-activated potassium channel activity(GO:0016286) |
| 0.6 | 39.5 | GO:0016811 | hydrolase activity, acting on carbon-nitrogen (but not peptide) bonds, in linear amides(GO:0016811) |
| 0.6 | 3.8 | GO:0005113 | patched binding(GO:0005113) |
| 0.6 | 11.3 | GO:0042288 | MHC class I protein binding(GO:0042288) |
| 0.6 | 10.7 | GO:0004190 | aspartic-type endopeptidase activity(GO:0004190) |
| 0.6 | 1.9 | GO:0052723 | inositol hexakisphosphate 1-kinase activity(GO:0052723) inositol hexakisphosphate 3-kinase activity(GO:0052724) |
| 0.6 | 17.9 | GO:0005385 | zinc ion transmembrane transporter activity(GO:0005385) |
| 0.6 | 2.5 | GO:0002046 | opsin binding(GO:0002046) |
| 0.6 | 17.2 | GO:0015020 | glucuronosyltransferase activity(GO:0015020) |
| 0.6 | 1.8 | GO:0034190 | apolipoprotein receptor binding(GO:0034190) apolipoprotein A-I receptor binding(GO:0034191) |
| 0.6 | 1.8 | GO:0010521 | telomerase inhibitor activity(GO:0010521) |
| 0.6 | 4.6 | GO:0070628 | proteasome binding(GO:0070628) |
| 0.6 | 5.8 | GO:0008484 | sulfuric ester hydrolase activity(GO:0008484) |
| 0.6 | 2.9 | GO:0004427 | inorganic diphosphatase activity(GO:0004427) |
| 0.6 | 6.8 | GO:0046875 | ephrin receptor binding(GO:0046875) |
| 0.6 | 4.5 | GO:0031386 | protein tag(GO:0031386) |
| 0.6 | 5.6 | GO:0043023 | ribosomal large subunit binding(GO:0043023) |
| 0.6 | 3.9 | GO:0035312 | 5'-3' exodeoxyribonuclease activity(GO:0035312) |
| 0.6 | 12.8 | GO:0008527 | taste receptor activity(GO:0008527) |
| 0.6 | 3.3 | GO:0070492 | oligosaccharide binding(GO:0070492) |
| 0.6 | 3.3 | GO:0055102 | lipase inhibitor activity(GO:0055102) |
| 0.6 | 5.0 | GO:0004143 | diacylglycerol kinase activity(GO:0004143) |
| 0.5 | 2.2 | GO:0008532 | N-acetyllactosaminide beta-1,3-N-acetylglucosaminyltransferase activity(GO:0008532) |
| 0.5 | 1.6 | GO:0005146 | leukemia inhibitory factor receptor binding(GO:0005146) |
| 0.5 | 8.9 | GO:0008327 | methyl-CpG binding(GO:0008327) |
| 0.5 | 12.5 | GO:0017048 | Rho GTPase binding(GO:0017048) |
| 0.5 | 2.6 | GO:0004416 | hydroxyacylglutathione hydrolase activity(GO:0004416) |
| 0.5 | 1.5 | GO:0004937 | alpha1-adrenergic receptor activity(GO:0004937) |
| 0.5 | 3.4 | GO:1990247 | N6-methyladenosine-containing RNA binding(GO:1990247) |
| 0.5 | 2.9 | GO:0019855 | calcium channel inhibitor activity(GO:0019855) |
| 0.5 | 4.9 | GO:0043295 | glutathione binding(GO:0043295) |
| 0.5 | 5.3 | GO:0001618 | virus receptor activity(GO:0001618) |
| 0.5 | 1.0 | GO:0032552 | deoxyribonucleotide binding(GO:0032552) |
| 0.5 | 1.0 | GO:0008332 | low voltage-gated calcium channel activity(GO:0008332) |
| 0.5 | 2.7 | GO:0008420 | CTD phosphatase activity(GO:0008420) |
| 0.5 | 2.3 | GO:0004351 | glutamate decarboxylase activity(GO:0004351) |
| 0.4 | 1.3 | GO:0042296 | ISG15 transferase activity(GO:0042296) |
| 0.4 | 1.7 | GO:0045134 | uridine-diphosphatase activity(GO:0045134) |
| 0.4 | 1.7 | GO:0003691 | double-stranded telomeric DNA binding(GO:0003691) |
| 0.4 | 4.2 | GO:0043236 | laminin binding(GO:0043236) |
| 0.4 | 14.3 | GO:0019905 | syntaxin binding(GO:0019905) |
| 0.4 | 2.1 | GO:0036033 | mediator complex binding(GO:0036033) |
| 0.4 | 4.6 | GO:0005225 | volume-sensitive anion channel activity(GO:0005225) |
| 0.4 | 2.5 | GO:0061133 | endopeptidase activator activity(GO:0061133) |
| 0.4 | 6.3 | GO:0004003 | ATP-dependent DNA helicase activity(GO:0004003) |
| 0.4 | 1.7 | GO:0002151 | G-quadruplex RNA binding(GO:0002151) |
| 0.4 | 1.2 | GO:0070883 | pre-miRNA binding(GO:0070883) |
| 0.4 | 4.1 | GO:1990841 | promoter-specific chromatin binding(GO:1990841) |
| 0.4 | 3.3 | GO:0070567 | cytidylyltransferase activity(GO:0070567) |
| 0.4 | 8.0 | GO:0031683 | G-protein beta/gamma-subunit complex binding(GO:0031683) |
| 0.4 | 12.3 | GO:0016831 | carboxy-lyase activity(GO:0016831) |
| 0.4 | 3.2 | GO:0001055 | RNA polymerase II activity(GO:0001055) |
| 0.4 | 1.2 | GO:0044378 | non-sequence-specific DNA binding, bending(GO:0044378) |
| 0.4 | 3.5 | GO:0016886 | ligase activity, forming phosphoric ester bonds(GO:0016886) |
| 0.4 | 1.5 | GO:1990226 | histone methyltransferase binding(GO:1990226) |
| 0.4 | 6.8 | GO:0046332 | SMAD binding(GO:0046332) |
| 0.4 | 8.9 | GO:0001102 | RNA polymerase II activating transcription factor binding(GO:0001102) |
| 0.4 | 0.4 | GO:0035851 | Krueppel-associated box domain binding(GO:0035851) |
| 0.4 | 0.7 | GO:0034512 | box C/D snoRNA binding(GO:0034512) |
| 0.4 | 9.3 | GO:0005164 | tumor necrosis factor receptor binding(GO:0005164) |
| 0.4 | 22.6 | GO:0031490 | chromatin DNA binding(GO:0031490) |
| 0.4 | 7.0 | GO:0051019 | mitogen-activated protein kinase binding(GO:0051019) |
| 0.4 | 0.7 | GO:0001042 | RNA polymerase I core binding(GO:0001042) |
| 0.3 | 4.5 | GO:0016881 | acid-amino acid ligase activity(GO:0016881) |
| 0.3 | 1.0 | GO:0089720 | caspase binding(GO:0089720) |
| 0.3 | 2.1 | GO:0034648 | histone demethylase activity (H3-trimethyl-K4 specific)(GO:0034647) histone demethylase activity (H3-dimethyl-K4 specific)(GO:0034648) |
| 0.3 | 1.0 | GO:0030911 | TPR domain binding(GO:0030911) |
| 0.3 | 1.4 | GO:0004169 | dolichyl-phosphate-mannose-protein mannosyltransferase activity(GO:0004169) |
| 0.3 | 62.7 | GO:0030695 | GTPase regulator activity(GO:0030695) |
| 0.3 | 3.3 | GO:0017154 | semaphorin receptor activity(GO:0017154) |
| 0.3 | 2.0 | GO:0004305 | ethanolamine kinase activity(GO:0004305) |
| 0.3 | 2.0 | GO:0051400 | BH domain binding(GO:0051400) |
| 0.3 | 1.0 | GO:0071208 | histone pre-mRNA DCP binding(GO:0071208) |
| 0.3 | 4.7 | GO:0016638 | oxidoreductase activity, acting on the CH-NH2 group of donors(GO:0016638) |
| 0.3 | 4.0 | GO:0005402 | sugar:proton symporter activity(GO:0005351) cation:sugar symporter activity(GO:0005402) |
| 0.3 | 3.4 | GO:0008301 | DNA binding, bending(GO:0008301) |
| 0.3 | 0.9 | GO:0046592 | polyamine oxidase activity(GO:0046592) |
| 0.3 | 0.9 | GO:0001609 | G-protein coupled adenosine receptor activity(GO:0001609) |
| 0.3 | 3.0 | GO:0005537 | mannose binding(GO:0005537) |
| 0.3 | 0.9 | GO:0031531 | thyrotropin-releasing hormone receptor binding(GO:0031531) |
| 0.3 | 1.5 | GO:0005123 | death receptor binding(GO:0005123) |
| 0.3 | 6.1 | GO:0004198 | calcium-dependent cysteine-type endopeptidase activity(GO:0004198) |
| 0.3 | 1.7 | GO:0008519 | ammonium transmembrane transporter activity(GO:0008519) |
| 0.3 | 1.1 | GO:0000014 | single-stranded DNA endodeoxyribonuclease activity(GO:0000014) |
| 0.3 | 0.8 | GO:0001091 | RNA polymerase II basal transcription factor binding(GO:0001091) TFIID-class transcription factor binding(GO:0001094) |
| 0.3 | 2.2 | GO:0008157 | protein phosphatase 1 binding(GO:0008157) |
| 0.3 | 2.9 | GO:0017160 | Ral GTPase binding(GO:0017160) |
| 0.3 | 2.4 | GO:0016857 | racemase and epimerase activity, acting on carbohydrates and derivatives(GO:0016857) |
| 0.3 | 73.0 | GO:0001228 | transcriptional activator activity, RNA polymerase II transcription regulatory region sequence-specific binding(GO:0001228) |
| 0.3 | 0.8 | GO:0071535 | RING-like zinc finger domain binding(GO:0071535) |
| 0.2 | 0.7 | GO:0098518 | polynucleotide phosphatase activity(GO:0098518) |
| 0.2 | 7.7 | GO:0001205 | transcriptional activator activity, RNA polymerase II distal enhancer sequence-specific binding(GO:0001205) |
| 0.2 | 1.2 | GO:0003958 | NADPH-hemoprotein reductase activity(GO:0003958) |
| 0.2 | 2.4 | GO:0001848 | complement binding(GO:0001848) |
| 0.2 | 2.3 | GO:0016918 | retinal binding(GO:0016918) |
| 0.2 | 1.2 | GO:0032454 | histone demethylase activity (H3-K9 specific)(GO:0032454) |
| 0.2 | 4.4 | GO:0005086 | ARF guanyl-nucleotide exchange factor activity(GO:0005086) |
| 0.2 | 1.1 | GO:0016929 | SUMO-specific protease activity(GO:0016929) |
| 0.2 | 4.4 | GO:0004298 | threonine-type endopeptidase activity(GO:0004298) threonine-type peptidase activity(GO:0070003) |
| 0.2 | 0.2 | GO:0043560 | insulin receptor substrate binding(GO:0043560) |
| 0.2 | 0.6 | GO:0043138 | 3'-5' DNA helicase activity(GO:0043138) |
| 0.2 | 17.5 | GO:0008565 | protein transporter activity(GO:0008565) |
| 0.2 | 7.4 | GO:0005544 | calcium-dependent phospholipid binding(GO:0005544) |
| 0.2 | 2.2 | GO:0016863 | intramolecular oxidoreductase activity, transposing C=C bonds(GO:0016863) |
| 0.2 | 8.1 | GO:0004197 | cysteine-type endopeptidase activity(GO:0004197) |
| 0.2 | 43.1 | GO:0019904 | protein domain specific binding(GO:0019904) |
| 0.2 | 3.1 | GO:0031491 | nucleosome binding(GO:0031491) |
| 0.2 | 0.4 | GO:0072542 | phosphatase activator activity(GO:0019211) protein phosphatase activator activity(GO:0072542) |
| 0.2 | 1.0 | GO:0004029 | aldehyde dehydrogenase (NAD) activity(GO:0004029) |
| 0.2 | 1.9 | GO:0004579 | oligosaccharyl transferase activity(GO:0004576) dolichyl-diphosphooligosaccharide-protein glycotransferase activity(GO:0004579) |
| 0.2 | 0.8 | GO:0005042 | netrin receptor activity(GO:0005042) |
| 0.2 | 0.8 | GO:0032404 | mismatch repair complex binding(GO:0032404) |
| 0.2 | 0.9 | GO:0035613 | RNA stem-loop binding(GO:0035613) |
| 0.1 | 0.7 | GO:0035612 | AP-2 adaptor complex binding(GO:0035612) |
| 0.1 | 1.6 | GO:0005521 | lamin binding(GO:0005521) |
| 0.1 | 1.6 | GO:0019104 | DNA N-glycosylase activity(GO:0019104) |
| 0.1 | 0.4 | GO:0004478 | methionine adenosyltransferase activity(GO:0004478) |
| 0.1 | 1.4 | GO:0005520 | insulin-like growth factor binding(GO:0005520) |
| 0.1 | 2.9 | GO:0004864 | protein phosphatase inhibitor activity(GO:0004864) |
| 0.1 | 0.7 | GO:0008479 | queuine tRNA-ribosyltransferase activity(GO:0008479) |
| 0.1 | 1.4 | GO:0001221 | transcription cofactor binding(GO:0001221) |
| 0.1 | 0.3 | GO:0004774 | succinate-CoA ligase activity(GO:0004774) succinate-CoA ligase (ADP-forming) activity(GO:0004775) |
| 0.1 | 0.3 | GO:0035184 | histone threonine kinase activity(GO:0035184) |
| 0.1 | 1.4 | GO:0015144 | carbohydrate transmembrane transporter activity(GO:0015144) carbohydrate transporter activity(GO:1901476) |
| 0.1 | 7.4 | GO:0030414 | peptidase inhibitor activity(GO:0030414) |
| 0.1 | 0.5 | GO:0008821 | crossover junction endodeoxyribonuclease activity(GO:0008821) |
| 0.1 | 3.1 | GO:0003755 | peptidyl-prolyl cis-trans isomerase activity(GO:0003755) |
| 0.1 | 1.5 | GO:0016411 | acylglycerol O-acyltransferase activity(GO:0016411) |
| 0.1 | 0.4 | GO:0019213 | deacetylase activity(GO:0019213) |
| 0.1 | 0.2 | GO:0031708 | endothelin B receptor binding(GO:0031708) |
| 0.1 | 0.2 | GO:0008429 | phosphatidylethanolamine binding(GO:0008429) |
| 0.0 | 0.2 | GO:1990825 | sequence-specific mRNA binding(GO:1990825) |
| 0.0 | 0.9 | GO:0043022 | ribosome binding(GO:0043022) |
| 0.0 | 0.2 | GO:0001671 | ATPase activator activity(GO:0001671) |
| 0.0 | 0.8 | GO:0042393 | histone binding(GO:0042393) |
Gene overrepresentation in curated gene sets: canonical pathways category:
| Log-likelihood per target | Total log-likelihood | Term | Description |
|---|---|---|---|
| 10.4 | 176.6 | PID INTEGRIN4 PATHWAY | Alpha6 beta4 integrin-ligand interactions |
| 7.9 | 411.3 | PID ECADHERIN STABILIZATION PATHWAY | Stabilization and expansion of the E-cadherin adherens junction |
| 7.7 | 207.7 | PID INTEGRIN CS PATHWAY | Integrin family cell surface interactions |
| 6.4 | 12.8 | PID S1P S1P1 PATHWAY | S1P1 pathway |
| 5.8 | 92.5 | SA PROGRAMMED CELL DEATH | Programmed cell death, or apoptosis, eliminates damaged or unneeded cells. |
| 5.5 | 82.0 | SA MMP CYTOKINE CONNECTION | Cytokines can induce activation of matrix metalloproteinases, which degrade extracellular matrix. |
| 5.3 | 184.4 | PID IL8 CXCR2 PATHWAY | IL8- and CXCR2-mediated signaling events |
| 5.2 | 82.8 | PID ERBB NETWORK PATHWAY | ErbB receptor signaling network |
| 5.1 | 361.4 | PID TGFBR PATHWAY | TGF-beta receptor signaling |
| 4.5 | 244.9 | PID CD8 TCR PATHWAY | TCR signaling in naïve CD8+ T cells |
| 4.3 | 146.6 | PID EPHB FWD PATHWAY | EPHB forward signaling |
| 4.3 | 107.6 | PID EPHA FWDPATHWAY | EPHA forward signaling |
| 4.1 | 244.0 | PID DELTA NP63 PATHWAY | Validated transcriptional targets of deltaNp63 isoforms |
| 4.0 | 176.7 | PID INTEGRIN3 PATHWAY | Beta3 integrin cell surface interactions |
| 3.9 | 35.5 | SA PTEN PATHWAY | PTEN is a tumor suppressor that dephosphorylates the lipid messenger phosphatidylinositol triphosphate. |
| 3.9 | 150.5 | PID PI3KCI PATHWAY | Class I PI3K signaling events |
| 3.5 | 55.2 | PID IGF1 PATHWAY | IGF1 pathway |
| 3.4 | 127.0 | PID KIT PATHWAY | Signaling events mediated by Stem cell factor receptor (c-Kit) |
| 2.9 | 192.5 | PID AR PATHWAY | Coregulation of Androgen receptor activity |
| 2.9 | 23.1 | PID AJDISS 2PATHWAY | Posttranslational regulation of adherens junction stability and dissassembly |
| 2.7 | 52.2 | ST GA12 PATHWAY | G alpha 12 Pathway |
| 2.7 | 5.4 | ST STAT3 PATHWAY | STAT3 Pathway |
| 2.7 | 78.1 | PID BMP PATHWAY | BMP receptor signaling |
| 2.6 | 57.5 | PID BCR 5PATHWAY | BCR signaling pathway |
| 2.6 | 31.1 | PID TRAIL PATHWAY | TRAIL signaling pathway |
| 2.6 | 18.1 | PID NEPHRIN NEPH1 PATHWAY | Nephrin/Neph1 signaling in the kidney podocyte |
| 2.6 | 94.6 | PID MET PATHWAY | Signaling events mediated by Hepatocyte Growth Factor Receptor (c-Met) |
| 2.5 | 10.1 | PID S1P S1P2 PATHWAY | S1P2 pathway |
| 2.5 | 19.8 | PID ERBB4 PATHWAY | ErbB4 signaling events |
| 2.4 | 57.9 | PID LYSOPHOSPHOLIPID PATHWAY | LPA receptor mediated events |
| 2.4 | 19.3 | SA B CELL RECEPTOR COMPLEXES | Antigen binding to B cell receptors activates protein tyrosine kinases, such as the Src family, which ultimate activate MAP kinases. |
| 2.4 | 49.8 | PID FCER1 PATHWAY | Fc-epsilon receptor I signaling in mast cells |
| 2.3 | 2.3 | PID TCR JNK PATHWAY | JNK signaling in the CD4+ TCR pathway |
| 2.3 | 4.6 | PID IL8 CXCR1 PATHWAY | IL8- and CXCR1-mediated signaling events |
| 2.3 | 32.5 | PID IL2 STAT5 PATHWAY | IL2 signaling events mediated by STAT5 |
| 2.3 | 29.9 | PID GMCSF PATHWAY | GMCSF-mediated signaling events |
| 2.3 | 13.5 | PID ECADHERIN KERATINOCYTE PATHWAY | E-cadherin signaling in keratinocytes |
| 2.2 | 30.4 | PID A6B1 A6B4 INTEGRIN PATHWAY | a6b1 and a6b4 Integrin signaling |
| 2.1 | 314.7 | NABA ECM AFFILIATED | Genes encoding proteins affiliated structurally or functionally to extracellular matrix proteins |
| 2.0 | 4.1 | PID EPO PATHWAY | EPO signaling pathway |
| 2.0 | 93.2 | PID IL4 2PATHWAY | IL4-mediated signaling events |
| 1.9 | 114.9 | PID PDGFRB PATHWAY | PDGFR-beta signaling pathway |
| 1.9 | 34.5 | PID BETA CATENIN DEG PATHWAY | Degradation of beta catenin |
| 1.9 | 13.4 | PID IFNG PATHWAY | IFN-gamma pathway |
| 1.9 | 1.9 | PID EPHA2 FWD PATHWAY | EPHA2 forward signaling |
| 1.9 | 33.9 | PID AMB2 NEUTROPHILS PATHWAY | amb2 Integrin signaling |
| 1.8 | 33.2 | PID TOLL ENDOGENOUS PATHWAY | Endogenous TLR signaling |
| 1.8 | 91.2 | PID RHOA REG PATHWAY | Regulation of RhoA activity |
| 1.8 | 24.8 | PID SYNDECAN 2 PATHWAY | Syndecan-2-mediated signaling events |
| 1.7 | 5.2 | PID INTEGRIN1 PATHWAY | Beta1 integrin cell surface interactions |
| 1.7 | 8.6 | PID THROMBIN PAR1 PATHWAY | PAR1-mediated thrombin signaling events |
| 1.7 | 68.3 | PID AR TF PATHWAY | Regulation of Androgen receptor activity |
| 1.6 | 19.4 | SA CASPASE CASCADE | Apoptosis is mediated by caspases, cysteine proteases arranged in a proteolytic cascade. |
| 1.6 | 12.9 | PID S1P S1P4 PATHWAY | S1P4 pathway |
| 1.5 | 10.8 | PID ECADHERIN NASCENT AJ PATHWAY | E-cadherin signaling in the nascent adherens junction |
| 1.5 | 12.4 | PID P38 MK2 PATHWAY | p38 signaling mediated by MAPKAP kinases |
| 1.5 | 12.4 | PID IL2 PI3K PATHWAY | IL2 signaling events mediated by PI3K |
| 1.5 | 21.9 | PID IL1 PATHWAY | IL1-mediated signaling events |
| 1.4 | 27.4 | ST WNT CA2 CYCLIC GMP PATHWAY | Wnt/Ca2+/cyclic GMP signaling. |
| 1.4 | 28.6 | PID TAP63 PATHWAY | Validated transcriptional targets of TAp63 isoforms |
| 1.4 | 15.6 | SA REG CASCADE OF CYCLIN EXPR | Expression of cyclins regulates progression through the cell cycle by activating cyclin-dependent kinases. |
| 1.4 | 8.4 | PID LPA4 PATHWAY | LPA4-mediated signaling events |
| 1.4 | 17.8 | PID CD8 TCR DOWNSTREAM PATHWAY | Downstream signaling in naïve CD8+ T cells |
| 1.3 | 9.3 | PID CXCR3 PATHWAY | CXCR3-mediated signaling events |
| 1.3 | 45.7 | PID P38 ALPHA BETA DOWNSTREAM PATHWAY | Signaling mediated by p38-alpha and p38-beta |
| 1.3 | 20.6 | PID PTP1B PATHWAY | Signaling events mediated by PTP1B |
| 1.2 | 8.7 | PID CD40 PATHWAY | CD40/CD40L signaling |
| 1.2 | 30.7 | PID ARF6 TRAFFICKING PATHWAY | Arf6 trafficking events |
| 1.2 | 21.0 | PID UPA UPAR PATHWAY | Urokinase-type plasminogen activator (uPA) and uPAR-mediated signaling |
| 1.2 | 1.2 | ST INTERFERON GAMMA PATHWAY | Interferon gamma pathway. |
| 1.1 | 13.4 | PID RET PATHWAY | Signaling events regulated by Ret tyrosine kinase |
| 1.1 | 18.8 | PID ERBB1 DOWNSTREAM PATHWAY | ErbB1 downstream signaling |
| 1.1 | 16.1 | PID RETINOIC ACID PATHWAY | Retinoic acid receptors-mediated signaling |
| 1.0 | 9.4 | PID VEGFR1 PATHWAY | VEGFR1 specific signals |
| 1.0 | 13.5 | PID IL6 7 PATHWAY | IL6-mediated signaling events |
| 1.0 | 103.8 | PID P53 DOWNSTREAM PATHWAY | Direct p53 effectors |
| 1.0 | 12.9 | PID FGF PATHWAY | FGF signaling pathway |
| 1.0 | 13.8 | PID FOXM1 PATHWAY | FOXM1 transcription factor network |
| 1.0 | 4.9 | PID HDAC CLASSII PATHWAY | Signaling events mediated by HDAC Class II |
| 1.0 | 7.7 | PID HIV NEF PATHWAY | HIV-1 Nef: Negative effector of Fas and TNF-alpha |
| 0.9 | 10.2 | PID GLYPICAN 1PATHWAY | Glypican 1 network |
| 0.9 | 12.8 | PID PI3K PLC TRK PATHWAY | Trk receptor signaling mediated by PI3K and PLC-gamma |
| 0.9 | 46.6 | PID NOTCH PATHWAY | Notch signaling pathway |
| 0.9 | 39.3 | PID AURORA B PATHWAY | Aurora B signaling |
| 0.9 | 10.8 | PID ENDOTHELIN PATHWAY | Endothelins |
| 0.9 | 2.7 | PID EPHRINB REV PATHWAY | Ephrin B reverse signaling |
| 0.9 | 7.0 | PID TCR PATHWAY | TCR signaling in naïve CD4+ T cells |
| 0.9 | 14.6 | PID ARF 3PATHWAY | Arf1 pathway |
| 0.8 | 5.1 | ST G ALPHA S PATHWAY | G alpha s Pathway |
| 0.8 | 9.6 | PID P38 MKK3 6PATHWAY | p38 MAPK signaling pathway |
| 0.8 | 12.2 | PID CDC42 REG PATHWAY | Regulation of CDC42 activity |
| 0.7 | 8.2 | PID CXCR4 PATHWAY | CXCR4-mediated signaling events |
| 0.7 | 5.7 | PID PRL SIGNALING EVENTS PATHWAY | Signaling events mediated by PRL |
| 0.7 | 0.7 | PID NFKAPPAB ATYPICAL PATHWAY | Atypical NF-kappaB pathway |
| 0.7 | 8.7 | PID INTEGRIN A9B1 PATHWAY | Alpha9 beta1 integrin signaling events |
| 0.7 | 5.3 | PID TXA2PATHWAY | Thromboxane A2 receptor signaling |
| 0.7 | 22.5 | PID MYC REPRESS PATHWAY | Validated targets of C-MYC transcriptional repression |
| 0.6 | 32.4 | PID HDAC CLASSI PATHWAY | Signaling events mediated by HDAC Class I |
| 0.6 | 16.2 | PID NFAT TFPATHWAY | Calcineurin-regulated NFAT-dependent transcription in lymphocytes |
| 0.6 | 158.6 | NABA SECRETED FACTORS | Genes encoding secreted soluble factors |
| 0.6 | 15.2 | PID ILK PATHWAY | Integrin-linked kinase signaling |
| 0.5 | 1.6 | PID IL2 1PATHWAY | IL2-mediated signaling events |
| 0.5 | 15.4 | PID TELOMERASE PATHWAY | Regulation of Telomerase |
| 0.5 | 2.6 | PID S1P META PATHWAY | Sphingosine 1-phosphate (S1P) pathway |
| 0.5 | 6.5 | PID REG GR PATHWAY | Glucocorticoid receptor regulatory network |
| 0.5 | 15.0 | PID PLK1 PATHWAY | PLK1 signaling events |
| 0.4 | 5.8 | PID RB 1PATHWAY | Regulation of retinoblastoma protein |
| 0.4 | 5.8 | ST ERK1 ERK2 MAPK PATHWAY | ERK1/ERK2 MAPK Pathway |
| 0.4 | 13.7 | PID E2F PATHWAY | E2F transcription factor network |
| 0.4 | 1.7 | PID SYNDECAN 4 PATHWAY | Syndecan-4-mediated signaling events |
| 0.4 | 4.0 | PID IL12 2PATHWAY | IL12-mediated signaling events |
| 0.4 | 12.6 | PID CMYB PATHWAY | C-MYB transcription factor network |
| 0.4 | 6.4 | PID RXR VDR PATHWAY | RXR and RAR heterodimerization with other nuclear receptor |
| 0.3 | 2.5 | PID WNT CANONICAL PATHWAY | Canonical Wnt signaling pathway |
| 0.3 | 0.6 | PID FAS PATHWAY | FAS (CD95) signaling pathway |
| 0.2 | 9.2 | PID FANCONI PATHWAY | Fanconi anemia pathway |
| 0.2 | 0.4 | SA G2 AND M PHASES | Cdc25 activates the cdc2/cyclin B complex to induce the G2/M transition. |
| 0.2 | 2.0 | PID NETRIN PATHWAY | Netrin-mediated signaling events |
| 0.2 | 3.2 | ST WNT BETA CATENIN PATHWAY | Wnt/beta-catenin Pathway |
| 0.2 | 1.9 | ST JNK MAPK PATHWAY | JNK MAPK Pathway |
| 0.2 | 1.9 | PID FRA PATHWAY | Validated transcriptional targets of AP1 family members Fra1 and Fra2 |
| 0.2 | 1.9 | PID REELIN PATHWAY | Reelin signaling pathway |
| 0.2 | 1.5 | PID DNA PK PATHWAY | DNA-PK pathway in nonhomologous end joining |
| 0.1 | 1.1 | PID WNT NONCANONICAL PATHWAY | Noncanonical Wnt signaling pathway |
| 0.1 | 1.1 | SIG INSULIN RECEPTOR PATHWAY IN CARDIAC MYOCYTES | Genes related to the insulin receptor pathway |
| 0.1 | 1.2 | PID ATM PATHWAY | ATM pathway |
| 0.1 | 2.9 | PID HIF2PATHWAY | HIF-2-alpha transcription factor network |
| 0.1 | 0.2 | PID IL27 PATHWAY | IL27-mediated signaling events |
| 0.1 | 1.0 | PID ALPHA SYNUCLEIN PATHWAY | Alpha-synuclein signaling |
| 0.1 | 0.4 | PID ERBB1 INTERNALIZATION PATHWAY | Internalization of ErbB1 |
| 0.1 | 0.6 | PID RAC1 PATHWAY | RAC1 signaling pathway |
| 0.1 | 0.2 | PID NECTIN PATHWAY | Nectin adhesion pathway |
Gene overrepresentation in curated gene sets: REACTOME pathways category:
| Log-likelihood per target | Total log-likelihood | Term | Description |
|---|---|---|---|
| 34.0 | 475.6 | REACTOME APOPTOTIC CLEAVAGE OF CELL ADHESION PROTEINS | Genes involved in Apoptotic cleavage of cell adhesion proteins |
| 29.0 | 956.5 | REACTOME TIGHT JUNCTION INTERACTIONS | Genes involved in Tight junction interactions |
| 24.1 | 192.7 | REACTOME NEF MEDIATED DOWNREGULATION OF MHC CLASS I COMPLEX CELL SURFACE EXPRESSION | Genes involved in Nef mediated downregulation of MHC class I complex cell surface expression |
| 19.4 | 194.4 | REACTOME TRANSPORT OF ORGANIC ANIONS | Genes involved in Transport of organic anions |
| 11.0 | 131.7 | REACTOME SYNTHESIS OF BILE ACIDS AND BILE SALTS VIA 24 HYDROXYCHOLESTEROL | Genes involved in Synthesis of bile acids and bile salts via 24-hydroxycholesterol |
| 8.3 | 132.3 | REACTOME SIGNAL REGULATORY PROTEIN SIRP FAMILY INTERACTIONS | Genes involved in Signal regulatory protein (SIRP) family interactions |
| 8.0 | 64.0 | REACTOME TRANSLOCATION OF ZAP 70 TO IMMUNOLOGICAL SYNAPSE | Genes involved in Translocation of ZAP-70 to Immunological synapse |
| 7.8 | 31.1 | REACTOME BETA DEFENSINS | Genes involved in Beta defensins |
| 7.1 | 64.3 | REACTOME REGULATION OF INSULIN SECRETION BY GLUCAGON LIKE PEPTIDE1 | Genes involved in Regulation of Insulin Secretion by Glucagon-like Peptide-1 |
| 7.0 | 97.6 | REACTOME TGF BETA RECEPTOR SIGNALING IN EMT EPITHELIAL TO MESENCHYMAL TRANSITION | Genes involved in TGF-beta receptor signaling in EMT (epithelial to mesenchymal transition) |
| 6.9 | 13.8 | REACTOME PHOSPHORYLATION OF CD3 AND TCR ZETA CHAINS | Genes involved in Phosphorylation of CD3 and TCR zeta chains |
| 6.4 | 64.3 | REACTOME DOWNREGULATION OF ERBB2 ERBB3 SIGNALING | Genes involved in Downregulation of ERBB2:ERBB3 signaling |
| 6.4 | 12.7 | REACTOME IL 7 SIGNALING | Genes involved in Interleukin-7 signaling |
| 6.2 | 18.6 | REACTOME PECAM1 INTERACTIONS | Genes involved in PECAM1 interactions |
| 6.1 | 84.9 | REACTOME ADVANCED GLYCOSYLATION ENDPRODUCT RECEPTOR SIGNALING | Genes involved in Advanced glycosylation endproduct receptor signaling |
| 6.0 | 48.1 | REACTOME REGULATION OF SIGNALING BY CBL | Genes involved in Regulation of signaling by CBL |
| 5.7 | 211.8 | REACTOME GPVI MEDIATED ACTIVATION CASCADE | Genes involved in GPVI-mediated activation cascade |
| 5.7 | 51.2 | REACTOME REGULATION OF KIT SIGNALING | Genes involved in Regulation of KIT signaling |
| 5.1 | 56.1 | REACTOME ORGANIC CATION ANION ZWITTERION TRANSPORT | Genes involved in Organic cation/anion/zwitterion transport |
| 5.0 | 90.8 | REACTOME INFLAMMASOMES | Genes involved in Inflammasomes |
| 4.5 | 514.2 | REACTOME TRANSPORT OF INORGANIC CATIONS ANIONS AND AMINO ACIDS OLIGOPEPTIDES | Genes involved in Transport of inorganic cations/anions and amino acids/oligopeptides |
| 4.4 | 247.7 | REACTOME INTERFERON ALPHA BETA SIGNALING | Genes involved in Interferon alpha/beta signaling |
| 4.3 | 82.0 | REACTOME SIGNALING BY HIPPO | Genes involved in Signaling by Hippo |
| 4.2 | 173.7 | REACTOME IMMUNOREGULATORY INTERACTIONS BETWEEN A LYMPHOID AND A NON LYMPHOID CELL | Genes involved in Immunoregulatory interactions between a Lymphoid and a non-Lymphoid cell |
| 4.2 | 66.9 | REACTOME CHYLOMICRON MEDIATED LIPID TRANSPORT | Genes involved in Chylomicron-mediated lipid transport |
| 4.1 | 77.4 | REACTOME ABCA TRANSPORTERS IN LIPID HOMEOSTASIS | Genes involved in ABCA transporters in lipid homeostasis |
| 4.0 | 72.2 | REACTOME GAP JUNCTION ASSEMBLY | Genes involved in Gap junction assembly |
| 4.0 | 35.7 | REACTOME REGULATION OF INSULIN SECRETION BY ACETYLCHOLINE | Genes involved in Regulation of Insulin Secretion by Acetylcholine |
| 3.9 | 39.2 | REACTOME GAMMA CARBOXYLATION TRANSPORT AND AMINO TERMINAL CLEAVAGE OF PROTEINS | Genes involved in Gamma-carboxylation, transport, and amino-terminal cleavage of proteins |
| 3.9 | 50.9 | REACTOME GENERATION OF SECOND MESSENGER MOLECULES | Genes involved in Generation of second messenger molecules |
| 3.9 | 77.5 | REACTOME NEPHRIN INTERACTIONS | Genes involved in Nephrin interactions |
| 3.8 | 180.3 | REACTOME CHEMOKINE RECEPTORS BIND CHEMOKINES | Genes involved in Chemokine receptors bind chemokines |
| 3.7 | 67.3 | REACTOME LYSOSOME VESICLE BIOGENESIS | Genes involved in Lysosome Vesicle Biogenesis |
| 3.7 | 33.4 | REACTOME RAP1 SIGNALLING | Genes involved in Rap1 signalling |
| 3.7 | 233.0 | REACTOME INTEGRIN CELL SURFACE INTERACTIONS | Genes involved in Integrin cell surface interactions |
| 3.7 | 55.3 | REACTOME SYNTHESIS SECRETION AND INACTIVATION OF GIP | Genes involved in Synthesis, Secretion, and Inactivation of Glucose-dependent Insulinotropic Polypeptide (GIP) |
| 3.6 | 21.5 | REACTOME ABACAVIR TRANSPORT AND METABOLISM | Genes involved in Abacavir transport and metabolism |
| 3.6 | 28.4 | REACTOME PROSTANOID LIGAND RECEPTORS | Genes involved in Prostanoid ligand receptors |
| 3.4 | 16.8 | REACTOME GAP JUNCTION DEGRADATION | Genes involved in Gap junction degradation |
| 3.2 | 51.6 | REACTOME IONOTROPIC ACTIVITY OF KAINATE RECEPTORS | Genes involved in Ionotropic activity of Kainate Receptors |
| 3.1 | 166.7 | REACTOME REGULATION OF WATER BALANCE BY RENAL AQUAPORINS | Genes involved in Regulation of Water Balance by Renal Aquaporins |
| 3.1 | 31.4 | REACTOME IRAK1 RECRUITS IKK COMPLEX | Genes involved in IRAK1 recruits IKK complex |
| 3.1 | 34.1 | REACTOME SYNTHESIS OF PIPS AT THE LATE ENDOSOME MEMBRANE | Genes involved in Synthesis of PIPs at the late endosome membrane |
| 3.0 | 155.3 | REACTOME G ALPHA1213 SIGNALLING EVENTS | Genes involved in G alpha (12/13) signalling events |
| 3.0 | 109.5 | REACTOME SPHINGOLIPID DE NOVO BIOSYNTHESIS | Genes involved in Sphingolipid de novo biosynthesis |
| 3.0 | 36.2 | REACTOME REGULATION OF COMPLEMENT CASCADE | Genes involved in Regulation of Complement cascade |
| 3.0 | 152.4 | REACTOME O LINKED GLYCOSYLATION OF MUCINS | Genes involved in O-linked glycosylation of mucins |
| 3.0 | 17.8 | REACTOME THROMBIN SIGNALLING THROUGH PROTEINASE ACTIVATED RECEPTORS PARS | Genes involved in Thrombin signalling through proteinase activated receptors (PARs) |
| 2.9 | 44.1 | REACTOME EXTRINSIC PATHWAY FOR APOPTOSIS | Genes involved in Extrinsic Pathway for Apoptosis |
| 2.9 | 102.2 | REACTOME GOLGI ASSOCIATED VESICLE BIOGENESIS | Genes involved in Golgi Associated Vesicle Biogenesis |
| 2.9 | 2.9 | REACTOME DESTABILIZATION OF MRNA BY BRF1 | Genes involved in Destabilization of mRNA by Butyrate Response Factor 1 (BRF1) |
| 2.9 | 40.3 | REACTOME BILE SALT AND ORGANIC ANION SLC TRANSPORTERS | Genes involved in Bile salt and organic anion SLC transporters |
| 2.9 | 17.2 | REACTOME RECEPTOR LIGAND BINDING INITIATES THE SECOND PROTEOLYTIC CLEAVAGE OF NOTCH RECEPTOR | Genes involved in Receptor-ligand binding initiates the second proteolytic cleavage of Notch receptor |
| 2.8 | 8.4 | REACTOME ADENYLATE CYCLASE ACTIVATING PATHWAY | Genes involved in Adenylate cyclase activating pathway |
| 2.8 | 78.4 | REACTOME TRANSFERRIN ENDOCYTOSIS AND RECYCLING | Genes involved in Transferrin endocytosis and recycling |
| 2.8 | 47.0 | REACTOME PRE NOTCH PROCESSING IN GOLGI | Genes involved in Pre-NOTCH Processing in Golgi |
| 2.7 | 16.0 | REACTOME ELEVATION OF CYTOSOLIC CA2 LEVELS | Genes involved in Elevation of cytosolic Ca2+ levels |
| 2.6 | 5.3 | REACTOME RNA POL I PROMOTER OPENING | Genes involved in RNA Polymerase I Promoter Opening |
| 2.6 | 13.0 | REACTOME IL 6 SIGNALING | Genes involved in Interleukin-6 signaling |
| 2.6 | 160.1 | REACTOME METABOLISM OF VITAMINS AND COFACTORS | Genes involved in Metabolism of vitamins and cofactors |
| 2.5 | 70.8 | REACTOME SULFUR AMINO ACID METABOLISM | Genes involved in Sulfur amino acid metabolism |
| 2.5 | 10.1 | REACTOME SYNTHESIS OF PIPS AT THE EARLY ENDOSOME MEMBRANE | Genes involved in Synthesis of PIPs at the early endosome membrane |
| 2.5 | 236.1 | REACTOME SIGNALING BY RHO GTPASES | Genes involved in Signaling by Rho GTPases |
| 2.5 | 46.7 | REACTOME G ALPHA Z SIGNALLING EVENTS | Genes involved in G alpha (z) signalling events |
| 2.4 | 26.3 | REACTOME UNWINDING OF DNA | Genes involved in Unwinding of DNA |
| 2.4 | 4.7 | REACTOME GLUCAGON SIGNALING IN METABOLIC REGULATION | Genes involved in Glucagon signaling in metabolic regulation |
| 2.4 | 9.4 | REACTOME ACTIVATION OF NF KAPPAB IN B CELLS | Genes involved in Activation of NF-kappaB in B Cells |
| 2.3 | 51.7 | REACTOME FATTY ACYL COA BIOSYNTHESIS | Genes involved in Fatty Acyl-CoA Biosynthesis |
| 2.3 | 11.7 | REACTOME LATENT INFECTION OF HOMO SAPIENS WITH MYCOBACTERIUM TUBERCULOSIS | Genes involved in Latent infection of Homo sapiens with Mycobacterium tuberculosis |
| 2.3 | 30.2 | REACTOME CYTOSOLIC SULFONATION OF SMALL MOLECULES | Genes involved in Cytosolic sulfonation of small molecules |
| 2.3 | 9.2 | REACTOME IRAK2 MEDIATED ACTIVATION OF TAK1 COMPLEX UPON TLR7 8 OR 9 STIMULATION | Genes involved in IRAK2 mediated activation of TAK1 complex upon TLR7/8 or 9 stimulation |
| 2.3 | 36.6 | REACTOME ACYL CHAIN REMODELLING OF PG | Genes involved in Acyl chain remodelling of PG |
| 2.3 | 20.4 | REACTOME DCC MEDIATED ATTRACTIVE SIGNALING | Genes involved in DCC mediated attractive signaling |
| 2.2 | 11.0 | REACTOME CD28 DEPENDENT VAV1 PATHWAY | Genes involved in CD28 dependent Vav1 pathway |
| 2.1 | 17.0 | REACTOME HS GAG DEGRADATION | Genes involved in HS-GAG degradation |
| 2.1 | 8.3 | REACTOME ACYL CHAIN REMODELLING OF PS | Genes involved in Acyl chain remodelling of PS |
| 2.0 | 20.5 | REACTOME TCR SIGNALING | Genes involved in TCR signaling |
| 2.0 | 20.4 | REACTOME DOWNSTREAM SIGNAL TRANSDUCTION | Genes involved in Downstream signal transduction |
| 2.0 | 63.3 | REACTOME REGULATION OF BETA CELL DEVELOPMENT | Genes involved in Regulation of beta-cell development |
| 2.0 | 27.6 | REACTOME SEMA4D INDUCED CELL MIGRATION AND GROWTH CONE COLLAPSE | Genes involved in Sema4D induced cell migration and growth-cone collapse |
| 2.0 | 45.4 | REACTOME CHOLESTEROL BIOSYNTHESIS | Genes involved in Cholesterol biosynthesis |
| 1.9 | 29.0 | REACTOME OTHER SEMAPHORIN INTERACTIONS | Genes involved in Other semaphorin interactions |
| 1.9 | 28.3 | REACTOME DARPP 32 EVENTS | Genes involved in DARPP-32 events |
| 1.9 | 22.4 | REACTOME N GLYCAN ANTENNAE ELONGATION | Genes involved in N-Glycan antennae elongation |
| 1.9 | 14.8 | REACTOME ACTIVATION OF RAC | Genes involved in Activation of Rac |
| 1.8 | 54.8 | REACTOME COSTIMULATION BY THE CD28 FAMILY | Genes involved in Costimulation by the CD28 family |
| 1.8 | 40.0 | REACTOME CLASS C 3 METABOTROPIC GLUTAMATE PHEROMONE RECEPTORS | Genes involved in Class C/3 (Metabotropic glutamate/pheromone receptors) |
| 1.8 | 51.8 | REACTOME METAL ION SLC TRANSPORTERS | Genes involved in Metal ion SLC transporters |
| 1.8 | 10.7 | REACTOME DAG AND IP3 SIGNALING | Genes involved in DAG and IP3 signaling |
| 1.8 | 23.2 | REACTOME ANTIGEN ACTIVATES B CELL RECEPTOR LEADING TO GENERATION OF SECOND MESSENGERS | Genes involved in Antigen Activates B Cell Receptor Leading to Generation of Second Messengers |
| 1.7 | 45.2 | REACTOME IL 3 5 AND GM CSF SIGNALING | Genes involved in Interleukin-3, 5 and GM-CSF signaling |
| 1.7 | 20.6 | REACTOME ROLE OF DCC IN REGULATING APOPTOSIS | Genes involved in Role of DCC in regulating apoptosis |
| 1.7 | 22.0 | REACTOME SYNTHESIS OF SUBSTRATES IN N GLYCAN BIOSYTHESIS | Genes involved in Synthesis of substrates in N-glycan biosythesis |
| 1.7 | 35.1 | REACTOME SIGNALING BY NODAL | Genes involved in Signaling by NODAL |
| 1.7 | 10.0 | REACTOME TETRAHYDROBIOPTERIN BH4 SYNTHESIS RECYCLING SALVAGE AND REGULATION | Genes involved in Tetrahydrobiopterin (BH4) synthesis, recycling, salvage and regulation |
| 1.6 | 72.5 | REACTOME TRANSPORT OF GLUCOSE AND OTHER SUGARS BILE SALTS AND ORGANIC ACIDS METAL IONS AND AMINE COMPOUNDS | Genes involved in Transport of glucose and other sugars, bile salts and organic acids, metal ions and amine compounds |
| 1.6 | 16.3 | REACTOME CDC6 ASSOCIATION WITH THE ORC ORIGIN COMPLEX | Genes involved in CDC6 association with the ORC:origin complex |
| 1.6 | 3.2 | REACTOME REGULATION OF INSULIN SECRETION | Genes involved in Regulation of Insulin Secretion |
| 1.6 | 14.6 | REACTOME APOPTOSIS INDUCED DNA FRAGMENTATION | Genes involved in Apoptosis induced DNA fragmentation |
| 1.6 | 45.4 | REACTOME POST TRANSLATIONAL MODIFICATION SYNTHESIS OF GPI ANCHORED PROTEINS | Genes involved in Post-translational modification: synthesis of GPI-anchored proteins |
| 1.6 | 12.9 | REACTOME ETHANOL OXIDATION | Genes involved in Ethanol oxidation |
| 1.6 | 47.2 | REACTOME KINESINS | Genes involved in Kinesins |
| 1.5 | 29.4 | REACTOME SYNTHESIS AND INTERCONVERSION OF NUCLEOTIDE DI AND TRIPHOSPHATES | Genes involved in Synthesis and interconversion of nucleotide di- and triphosphates |
| 1.5 | 7.7 | REACTOME PLATELET SENSITIZATION BY LDL | Genes involved in Platelet sensitization by LDL |
| 1.5 | 10.6 | REACTOME NOTCH HLH TRANSCRIPTION PATHWAY | Genes involved in Notch-HLH transcription pathway |
| 1.5 | 15.0 | REACTOME PRE NOTCH TRANSCRIPTION AND TRANSLATION | Genes involved in Pre-NOTCH Transcription and Translation |
| 1.5 | 55.3 | REACTOME SIGNALING BY ERBB2 | Genes involved in Signaling by ERBB2 |
| 1.5 | 26.9 | REACTOME G1 S SPECIFIC TRANSCRIPTION | Genes involved in G1/S-Specific Transcription |
| 1.5 | 32.4 | REACTOME CGMP EFFECTS | Genes involved in cGMP effects |
| 1.4 | 2.8 | REACTOME PLATELET AGGREGATION PLUG FORMATION | Genes involved in Platelet Aggregation (Plug Formation) |
| 1.4 | 58.8 | REACTOME ION TRANSPORT BY P TYPE ATPASES | Genes involved in Ion transport by P-type ATPases |
| 1.3 | 11.9 | REACTOME G2 M DNA DAMAGE CHECKPOINT | Genes involved in G2/M DNA damage checkpoint |
| 1.3 | 36.0 | REACTOME HS GAG BIOSYNTHESIS | Genes involved in HS-GAG biosynthesis |
| 1.3 | 91.0 | REACTOME CLASS B 2 SECRETIN FAMILY RECEPTORS | Genes involved in Class B/2 (Secretin family receptors) |
| 1.2 | 11.1 | REACTOME BASIGIN INTERACTIONS | Genes involved in Basigin interactions |
| 1.2 | 18.5 | REACTOME ACTIVATION OF CHAPERONES BY ATF6 ALPHA | Genes involved in Activation of Chaperones by ATF6-alpha |
| 1.2 | 40.2 | REACTOME INTERACTIONS OF VPR WITH HOST CELLULAR PROTEINS | Genes involved in Interactions of Vpr with host cellular proteins |
| 1.2 | 11.9 | REACTOME HYALURONAN UPTAKE AND DEGRADATION | Genes involved in Hyaluronan uptake and degradation |
| 1.2 | 12.8 | REACTOME METABOLISM OF POLYAMINES | Genes involved in Metabolism of polyamines |
| 1.2 | 21.9 | REACTOME IL1 SIGNALING | Genes involved in Interleukin-1 signaling |
| 1.2 | 6.9 | REACTOME SEMA3A PAK DEPENDENT AXON REPULSION | Genes involved in Sema3A PAK dependent Axon repulsion |
| 1.1 | 21.7 | REACTOME ACTIVATED NOTCH1 TRANSMITS SIGNAL TO THE NUCLEUS | Genes involved in Activated NOTCH1 Transmits Signal to the Nucleus |
| 1.1 | 10.2 | REACTOME AMYLOIDS | Genes involved in Amyloids |
| 1.1 | 20.6 | REACTOME DESTABILIZATION OF MRNA BY TRISTETRAPROLIN TTP | Genes involved in Destabilization of mRNA by Tristetraprolin (TTP) |
| 1.1 | 3.2 | REACTOME CROSS PRESENTATION OF SOLUBLE EXOGENOUS ANTIGENS ENDOSOMES | Genes involved in Cross-presentation of soluble exogenous antigens (endosomes) |
| 1.1 | 24.3 | REACTOME NEGATIVE REGULATORS OF RIG I MDA5 SIGNALING | Genes involved in Negative regulators of RIG-I/MDA5 signaling |
| 1.0 | 6.1 | REACTOME E2F MEDIATED REGULATION OF DNA REPLICATION | Genes involved in E2F mediated regulation of DNA replication |
| 1.0 | 9.2 | REACTOME TRYPTOPHAN CATABOLISM | Genes involved in Tryptophan catabolism |
| 1.0 | 5.1 | REACTOME NEF MEDIATES DOWN MODULATION OF CELL SURFACE RECEPTORS BY RECRUITING THEM TO CLATHRIN ADAPTERS | Genes involved in Nef-mediates down modulation of cell surface receptors by recruiting them to clathrin adapters |
| 1.0 | 55.7 | REACTOME PHASE II CONJUGATION | Genes involved in Phase II conjugation |
| 1.0 | 8.1 | REACTOME CALNEXIN CALRETICULIN CYCLE | Genes involved in Calnexin/calreticulin cycle |
| 1.0 | 3.0 | REACTOME DESTABILIZATION OF MRNA BY KSRP | Genes involved in Destabilization of mRNA by KSRP |
| 1.0 | 6.8 | REACTOME ACTIVATION OF BH3 ONLY PROTEINS | Genes involved in Activation of BH3-only proteins |
| 1.0 | 3.8 | REACTOME ANTIGEN PRESENTATION FOLDING ASSEMBLY AND PEPTIDE LOADING OF CLASS I MHC | Genes involved in Antigen Presentation: Folding, assembly and peptide loading of class I MHC |
| 0.9 | 37.7 | REACTOME MHC CLASS II ANTIGEN PRESENTATION | Genes involved in MHC class II antigen presentation |
| 0.9 | 23.5 | REACTOME EXTENSION OF TELOMERES | Genes involved in Extension of Telomeres |
| 0.9 | 42.4 | REACTOME MYD88 MAL CASCADE INITIATED ON PLASMA MEMBRANE | Genes involved in MyD88:Mal cascade initiated on plasma membrane |
| 0.9 | 3.7 | REACTOME ACTIVATION OF THE PRE REPLICATIVE COMPLEX | Genes involved in Activation of the pre-replicative complex |
| 0.9 | 3.6 | REACTOME DEFENSINS | Genes involved in Defensins |
| 0.9 | 6.9 | REACTOME REGULATION OF MRNA STABILITY BY PROTEINS THAT BIND AU RICH ELEMENTS | Genes involved in Regulation of mRNA Stability by Proteins that Bind AU-rich Elements |
| 0.8 | 5.1 | REACTOME IRON UPTAKE AND TRANSPORT | Genes involved in Iron uptake and transport |
| 0.8 | 48.1 | REACTOME FACTORS INVOLVED IN MEGAKARYOCYTE DEVELOPMENT AND PLATELET PRODUCTION | Genes involved in Factors involved in megakaryocyte development and platelet production |
| 0.8 | 9.8 | REACTOME GABA B RECEPTOR ACTIVATION | Genes involved in GABA B receptor activation |
| 0.8 | 8.1 | REACTOME INTRINSIC PATHWAY FOR APOPTOSIS | Genes involved in Intrinsic Pathway for Apoptosis |
| 0.8 | 16.9 | REACTOME PROCESSING OF INTRONLESS PRE MRNAS | Genes involved in Processing of Intronless Pre-mRNAs |
| 0.8 | 2.4 | REACTOME SPRY REGULATION OF FGF SIGNALING | Genes involved in Spry regulation of FGF signaling |
| 0.8 | 13.9 | REACTOME PROTEOLYTIC CLEAVAGE OF SNARE COMPLEX PROTEINS | Genes involved in Proteolytic cleavage of SNARE complex proteins |
| 0.7 | 18.0 | REACTOME PYRIMIDINE METABOLISM | Genes involved in Pyrimidine metabolism |
| 0.7 | 81.8 | REACTOME G ALPHA I SIGNALLING EVENTS | Genes involved in G alpha (i) signalling events |
| 0.7 | 8.2 | REACTOME GLUCOSE TRANSPORT | Genes involved in Glucose transport |
| 0.7 | 8.7 | REACTOME TANDEM PORE DOMAIN POTASSIUM CHANNELS | Genes involved in Tandem pore domain potassium channels |
| 0.7 | 2.0 | REACTOME TRAF6 MEDIATED INDUCTION OF NFKB AND MAP KINASES UPON TLR7 8 OR 9 ACTIVATION | Genes involved in TRAF6 mediated induction of NFkB and MAP kinases upon TLR7/8 or 9 activation |
| 0.6 | 7.8 | REACTOME CASPASE MEDIATED CLEAVAGE OF CYTOSKELETAL PROTEINS | Genes involved in Caspase-mediated cleavage of cytoskeletal proteins |
| 0.6 | 1.9 | REACTOME P38MAPK EVENTS | Genes involved in p38MAPK events |
| 0.6 | 2.6 | REACTOME TRAF6 MEDIATED INDUCTION OF TAK1 COMPLEX | Genes involved in TRAF6 mediated induction of TAK1 complex |
| 0.6 | 3.8 | REACTOME REGULATION OF IFNG SIGNALING | Genes involved in Regulation of IFNG signaling |
| 0.6 | 4.4 | REACTOME ARMS MEDIATED ACTIVATION | Genes involved in ARMS-mediated activation |
| 0.6 | 5.3 | REACTOME SEROTONIN RECEPTORS | Genes involved in Serotonin receptors |
| 0.6 | 4.6 | REACTOME PERK REGULATED GENE EXPRESSION | Genes involved in PERK regulated gene expression |
| 0.6 | 2.3 | REACTOME TRAF6 MEDIATED NFKB ACTIVATION | Genes involved in TRAF6 mediated NF-kB activation |
| 0.5 | 21.9 | REACTOME MEIOTIC RECOMBINATION | Genes involved in Meiotic Recombination |
| 0.5 | 3.7 | REACTOME DOWNREGULATION OF SMAD2 3 SMAD4 TRANSCRIPTIONAL ACTIVITY | Genes involved in Downregulation of SMAD2/3:SMAD4 transcriptional activity |
| 0.5 | 7.4 | REACTOME SIGNALING BY ROBO RECEPTOR | Genes involved in Signaling by Robo receptor |
| 0.5 | 2.0 | REACTOME CTNNB1 PHOSPHORYLATION CASCADE | Genes involved in Beta-catenin phosphorylation cascade |
| 0.5 | 8.4 | REACTOME EFFECTS OF PIP2 HYDROLYSIS | Genes involved in Effects of PIP2 hydrolysis |
| 0.5 | 2.3 | REACTOME N GLYCAN ANTENNAE ELONGATION IN THE MEDIAL TRANS GOLGI | Genes involved in N-glycan antennae elongation in the medial/trans-Golgi |
| 0.5 | 2.7 | REACTOME SYNTHESIS OF BILE ACIDS AND BILE SALTS VIA 7ALPHA HYDROXYCHOLESTEROL | Genes involved in Synthesis of bile acids and bile salts via 7alpha-hydroxycholesterol |
| 0.4 | 9.9 | REACTOME TRANSPORT OF VITAMINS NUCLEOSIDES AND RELATED MOLECULES | Genes involved in Transport of vitamins, nucleosides, and related molecules |
| 0.4 | 2.2 | REACTOME CELL DEATH SIGNALLING VIA NRAGE NRIF AND NADE | Genes involved in Cell death signalling via NRAGE, NRIF and NADE |
| 0.4 | 14.4 | REACTOME NOTCH1 INTRACELLULAR DOMAIN REGULATES TRANSCRIPTION | Genes involved in NOTCH1 Intracellular Domain Regulates Transcription |
| 0.4 | 2.3 | REACTOME PURINE CATABOLISM | Genes involved in Purine catabolism |
| 0.4 | 4.4 | REACTOME NONSENSE MEDIATED DECAY ENHANCED BY THE EXON JUNCTION COMPLEX | Genes involved in Nonsense Mediated Decay Enhanced by the Exon Junction Complex |
| 0.4 | 7.5 | REACTOME ENDOSOMAL SORTING COMPLEX REQUIRED FOR TRANSPORT ESCRT | Genes involved in Endosomal Sorting Complex Required For Transport (ESCRT) |
| 0.3 | 8.2 | REACTOME FORMATION OF FIBRIN CLOT CLOTTING CASCADE | Genes involved in Formation of Fibrin Clot (Clotting Cascade) |
| 0.3 | 2.4 | REACTOME HOMOLOGOUS RECOMBINATION REPAIR OF REPLICATION INDEPENDENT DOUBLE STRAND BREAKS | Genes involved in Homologous recombination repair of replication-independent double-strand breaks |
| 0.3 | 7.7 | REACTOME ASSOCIATION OF TRIC CCT WITH TARGET PROTEINS DURING BIOSYNTHESIS | Genes involved in Association of TriC/CCT with target proteins during biosynthesis |
| 0.3 | 5.7 | REACTOME LIPID DIGESTION MOBILIZATION AND TRANSPORT | Genes involved in Lipid digestion, mobilization, and transport |
| 0.2 | 2.7 | REACTOME STEROID HORMONES | Genes involved in Steroid hormones |
| 0.2 | 4.4 | REACTOME SIGNALING BY BMP | Genes involved in Signaling by BMP |
| 0.2 | 1.2 | REACTOME REGULATORY RNA PATHWAYS | Genes involved in Regulatory RNA pathways |
| 0.2 | 1.1 | REACTOME SIGNALING BY EGFR IN CANCER | Genes involved in Signaling by EGFR in Cancer |
| 0.2 | 0.9 | REACTOME NITRIC OXIDE STIMULATES GUANYLATE CYCLASE | Genes involved in Nitric oxide stimulates guanylate cyclase |
| 0.2 | 0.5 | REACTOME HORMONE LIGAND BINDING RECEPTORS | Genes involved in Hormone ligand-binding receptors |
| 0.1 | 1.6 | REACTOME COPI MEDIATED TRANSPORT | Genes involved in COPI Mediated Transport |
| 0.1 | 1.6 | REACTOME TRANSPORT TO THE GOLGI AND SUBSEQUENT MODIFICATION | Genes involved in Transport to the Golgi and subsequent modification |
| 0.1 | 0.9 | REACTOME FORMATION OF TUBULIN FOLDING INTERMEDIATES BY CCT TRIC | Genes involved in Formation of tubulin folding intermediates by CCT/TriC |
| 0.1 | 0.1 | REACTOME RETROGRADE NEUROTROPHIN SIGNALLING | Genes involved in Retrograde neurotrophin signalling |
| 0.1 | 2.8 | REACTOME METABOLISM OF NON CODING RNA | Genes involved in Metabolism of non-coding RNA |
| 0.1 | 1.0 | REACTOME TOLL RECEPTOR CASCADES | Genes involved in Toll Receptor Cascades |
| 0.1 | 0.9 | REACTOME VEGF LIGAND RECEPTOR INTERACTIONS | Genes involved in VEGF ligand-receptor interactions |
| 0.1 | 1.5 | REACTOME APC CDC20 MEDIATED DEGRADATION OF NEK2A | Genes involved in APC-Cdc20 mediated degradation of Nek2A |
| 0.1 | 0.4 | REACTOME POST CHAPERONIN TUBULIN FOLDING PATHWAY | Genes involved in Post-chaperonin tubulin folding pathway |
| 0.1 | 0.3 | REACTOME HOST INTERACTIONS OF HIV FACTORS | Genes involved in Host Interactions of HIV factors |
| 0.1 | 0.7 | REACTOME SMAD2 SMAD3 SMAD4 HETEROTRIMER REGULATES TRANSCRIPTION | Genes involved in SMAD2/SMAD3:SMAD4 heterotrimer regulates transcription |
| 0.1 | 0.7 | REACTOME APOPTOTIC CLEAVAGE OF CELLULAR PROTEINS | Genes involved in Apoptotic cleavage of cellular proteins |
| 0.0 | 0.1 | REACTOME G ALPHA Q SIGNALLING EVENTS | Genes involved in G alpha (q) signalling events |