Project
GSE53960: rat RNA-Seq transcriptomic Bodymap
Navigation
Downloads
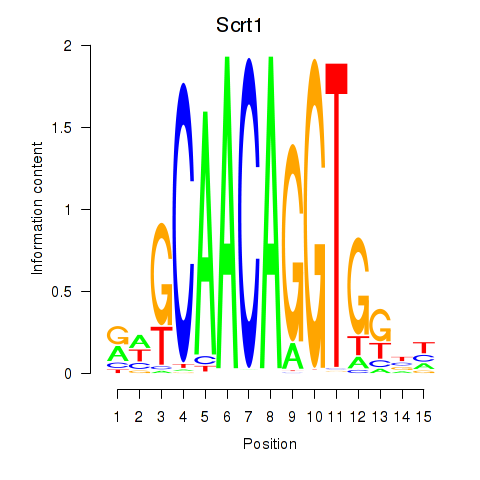
Results for Scrt1
Z-value: 1.35
Motif logo
Transcription factors associated with Scrt1
| Gene Symbol | Gene ID | Gene Info |
|---|---|---|
|
Scrt1
|
ENSRNOG00000025594 | scratch family transcriptional repressor 1 |
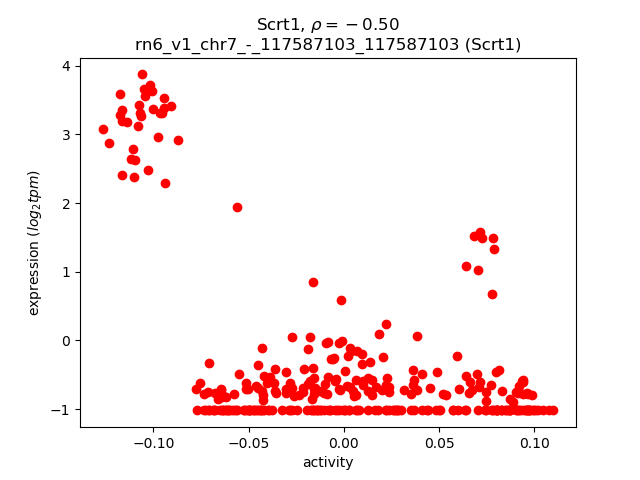
Activity-expression correlation:
| Gene | Promoter | Pearson corr. coef. | P-value | Plot |
|---|---|---|---|---|
| Scrt1 | rn6_v1_chr7_-_117587103_117587103 | -0.50 | 1.8e-21 | Click! |
Activity profile of Scrt1 motif
Sorted Z-values of Scrt1 motif
| Promoter | Log-likelihood | Transcript | Gene | Gene Info |
|---|---|---|---|---|
| chr4_-_123557501 | 63.51 |
ENSRNOT00000075042
ENSRNOT00000085966 |
Aldh1l1
|
aldehyde dehydrogenase 1 family, member L1 |
| chr2_+_60337667 | 60.76 |
ENSRNOT00000024035
|
Agxt2
|
alanine-glyoxylate aminotransferase 2 |
| chr1_+_213511874 | 57.88 |
ENSRNOT00000078080
ENSRNOT00000016883 |
Cyp2e1
|
cytochrome P450, family 2, subfamily e, polypeptide 1 |
| chr6_-_127630734 | 57.51 |
ENSRNOT00000089931
|
Serpina1
|
serpin family A member 1 |
| chr19_+_52077501 | 54.48 |
ENSRNOT00000079240
|
Osgin1
|
oxidative stress induced growth inhibitor 1 |
| chr19_+_37052556 | 50.88 |
ENSRNOT00000019072
|
Ces2h
|
carboxylesterase 2H |
| chr3_-_14112851 | 50.40 |
ENSRNOT00000092736
|
C5
|
complement C5 |
| chr10_+_71159869 | 43.61 |
ENSRNOT00000075977
ENSRNOT00000047427 |
Hnf1b
|
HNF1 homeobox B |
| chr1_-_189199376 | 40.53 |
ENSRNOT00000021027
|
Umod
|
uromodulin |
| chr13_-_99287887 | 38.79 |
ENSRNOT00000004780
|
Ephx1
|
epoxide hydrolase 1 |
| chr3_+_159936856 | 38.29 |
ENSRNOT00000078703
|
Hnf4a
|
hepatocyte nuclear factor 4, alpha |
| chr2_-_195935878 | 35.11 |
ENSRNOT00000028440
|
Cgn
|
cingulin |
| chr7_-_11186130 | 35.08 |
ENSRNOT00000075038
|
Smim24
|
small integral membrane protein 24 |
| chr11_-_67037115 | 34.15 |
ENSRNOT00000003137
|
Ildr1
|
immunoglobulin-like domain containing receptor 1 |
| chr6_+_128050250 | 32.95 |
ENSRNOT00000077517
ENSRNOT00000013961 |
LOC500712
|
Ab1-233 |
| chr14_+_22517774 | 32.85 |
ENSRNOT00000047655
|
Ugt2b37
|
UDP-glucuronosyltransferase 2 family, member 37 |
| chr7_+_14891001 | 30.72 |
ENSRNOT00000041034
|
Cyp4f4
|
cytochrome P450, family 4, subfamily f, polypeptide 4 |
| chr4_-_176231344 | 30.48 |
ENSRNOT00000049154
|
Slco1a1
|
solute carrier organic anion transporter family, member 1a1 |
| chr8_-_130550388 | 29.86 |
ENSRNOT00000026355
|
Cyp8b1
|
cytochrome P450, family 8, subfamily b, polypeptide 1 |
| chr7_+_94130852 | 28.95 |
ENSRNOT00000011485
|
Mal2
|
mal, T-cell differentiation protein 2 |
| chr2_-_238468435 | 28.89 |
ENSRNOT00000055537
|
LOC102556447
|
rho guanine nucleotide exchange factor 38-like |
| chr1_-_89399039 | 28.76 |
ENSRNOT00000028585
ENSRNOT00000044678 |
Lsr
|
lipolysis stimulated lipoprotein receptor |
| chr19_+_487723 | 28.58 |
ENSRNOT00000061734
|
Ces2j
|
carboxylesterase 2J |
| chr2_+_181987217 | 28.13 |
ENSRNOT00000034521
|
Fgg
|
fibrinogen gamma chain |
| chr1_+_216677373 | 27.45 |
ENSRNOT00000027925
|
Slc22a18
|
solute carrier family 22, member 18 |
| chr2_+_227455722 | 27.41 |
ENSRNOT00000064809
|
Sec24d
|
SEC24 homolog D, COPII coat complex component |
| chr1_+_88955440 | 27.12 |
ENSRNOT00000091101
|
Prodh2
|
proline dehydrogenase 2 |
| chr4_+_153876149 | 26.43 |
ENSRNOT00000018083
|
Slc6a13
|
solute carrier family 6 member 13 |
| chr11_+_62584959 | 26.24 |
ENSRNOT00000071065
|
Gramd1c
|
GRAM domain containing 1C |
| chr3_-_1549189 | 26.16 |
ENSRNOT00000086447
|
Pax8
|
paired box 8 |
| chr6_-_127534247 | 26.00 |
ENSRNOT00000012500
|
Serpina6
|
serpin family A member 6 |
| chr1_+_88955135 | 25.88 |
ENSRNOT00000083550
|
Prodh2
|
proline dehydrogenase 2 |
| chr4_-_167552973 | 25.87 |
ENSRNOT00000007806
|
Kap
|
kidney androgen regulated protein |
| chr3_-_101474890 | 25.71 |
ENSRNOT00000091869
|
Bbox1
|
gamma-butyrobetaine hydroxylase 1 |
| chr7_-_101140308 | 25.29 |
ENSRNOT00000006279
|
Fam84b
|
family with sequence similarity 84, member B |
| chr2_-_238369692 | 24.16 |
ENSRNOT00000041583
|
Arhgef38
|
Rho guanine nucleotide exchange factor 38 |
| chr16_+_6970342 | 24.02 |
ENSRNOT00000061294
ENSRNOT00000048344 |
Itih4
|
inter-alpha-trypsin inhibitor heavy chain family, member 4 |
| chr1_-_54748763 | 23.90 |
ENSRNOT00000074549
|
LOC100911027
|
protein MAL2-like |
| chr8_-_32280869 | 23.73 |
ENSRNOT00000009139
|
St14
|
suppression of tumorigenicity 14 |
| chr10_+_62981297 | 23.48 |
ENSRNOT00000031618
|
Efcab5
|
EF-hand calcium binding domain 5 |
| chr12_-_22194287 | 23.15 |
ENSRNOT00000082895
ENSRNOT00000001905 |
Tfr2
|
transferrin receptor 2 |
| chr1_+_277689729 | 22.36 |
ENSRNOT00000051834
|
Vwa2
|
von Willebrand factor A domain containing 2 |
| chr2_-_93641497 | 22.19 |
ENSRNOT00000013720
|
Chmp4c
|
charged multivesicular body protein 4C |
| chr2_-_30577218 | 22.15 |
ENSRNOT00000024674
|
Ocln
|
occludin |
| chr1_+_242959488 | 21.93 |
ENSRNOT00000015668
|
Dock8
|
dedicator of cytokinesis 8 |
| chr16_-_19942343 | 21.67 |
ENSRNOT00000087162
ENSRNOT00000091906 |
Bst2
|
bone marrow stromal cell antigen 2 |
| chr7_-_116425003 | 21.47 |
ENSRNOT00000076694
|
Ly6i
|
lymphocyte antigen 6 complex, locus I |
| chr11_+_74057361 | 21.24 |
ENSRNOT00000048746
|
Cpn2
|
carboxypeptidase N subunit 2 |
| chr5_-_169331163 | 20.89 |
ENSRNOT00000042301
|
Espn
|
espin |
| chr17_+_76079720 | 20.77 |
ENSRNOT00000073933
|
Proser2
|
proline and serine rich 2 |
| chr6_-_50846965 | 20.64 |
ENSRNOT00000087300
|
Slc26a4
|
solute carrier family 26 member 4 |
| chr2_-_186333805 | 20.25 |
ENSRNOT00000022150
|
Cd1d1
|
CD1d1 molecule |
| chr5_-_119564846 | 20.14 |
ENSRNOT00000012977
|
Cyp2j4
|
cytochrome P450, family 2, subfamily j, polypeptide 4 |
| chr1_+_219764001 | 20.14 |
ENSRNOT00000082388
|
Pc
|
pyruvate carboxylase |
| chr7_-_143016040 | 19.86 |
ENSRNOT00000029697
|
Krt80
|
keratin 80 |
| chr1_-_199395363 | 19.75 |
ENSRNOT00000090368
ENSRNOT00000026587 |
Prss36
|
protease, serine, 36 |
| chr1_-_89369960 | 19.42 |
ENSRNOT00000028545
|
Hamp
|
hepcidin antimicrobial peptide |
| chr3_-_23066658 | 19.33 |
ENSRNOT00000018751
|
Nr6a1
|
nuclear receptor subfamily 6, group A, member 1 |
| chr20_+_13670066 | 18.36 |
ENSRNOT00000031400
|
LOC103694874
|
stromelysin-3 |
| chr19_-_38120578 | 18.21 |
ENSRNOT00000026873
|
Esrp2
|
epithelial splicing regulatory protein 2 |
| chr5_-_75005567 | 17.60 |
ENSRNOT00000016068
|
LOC685849
|
hypothetical protein LOC685849 |
| chr7_-_3386522 | 17.16 |
ENSRNOT00000010760
|
Mettl7b
|
methyltransferase like 7B |
| chr10_+_43633035 | 16.97 |
ENSRNOT00000077764
|
Igtp
|
interferon gamma induced GTPase |
| chr2_-_53140637 | 16.84 |
ENSRNOT00000060492
|
Ccdc152
|
coiled-coil domain containing 152 |
| chr9_+_88357556 | 16.84 |
ENSRNOT00000020669
|
Col4a3
|
collagen type IV alpha 3 chain |
| chr2_+_196487656 | 16.68 |
ENSRNOT00000028699
ENSRNOT00000080324 |
Cers2
|
ceramide synthase 2 |
| chr1_-_253185533 | 16.30 |
ENSRNOT00000067822
|
Pank1
|
pantothenate kinase 1 |
| chr17_+_76079907 | 16.29 |
ENSRNOT00000092710
|
Proser2
|
proline and serine rich 2 |
| chr16_+_74531564 | 16.20 |
ENSRNOT00000078971
|
Slc25a15
|
solute carrier family 25 member 15 |
| chr2_+_93669765 | 16.19 |
ENSRNOT00000045438
|
Slc10a5
|
solute carrier family 10, member 5 |
| chr1_-_82120902 | 16.18 |
ENSRNOT00000027684
|
Erf
|
Ets2 repressor factor |
| chr3_-_113405829 | 15.97 |
ENSRNOT00000036823
|
Ell3
|
elongation factor for RNA polymerase II 3 |
| chr6_+_115170865 | 15.75 |
ENSRNOT00000005671
|
Tshr
|
thyroid stimulating hormone receptor |
| chr18_-_11858744 | 15.67 |
ENSRNOT00000061417
ENSRNOT00000082891 |
Dsc2
|
desmocollin 2 |
| chr7_+_59349745 | 15.55 |
ENSRNOT00000085334
|
Ptprb
|
protein tyrosine phosphatase, receptor type, B |
| chr13_+_89826254 | 15.35 |
ENSRNOT00000006141
|
F11r
|
F11 receptor |
| chr17_+_57075218 | 15.17 |
ENSRNOT00000089536
|
Crem
|
cAMP responsive element modulator |
| chr13_-_83457888 | 14.30 |
ENSRNOT00000076289
ENSRNOT00000004065 |
Sft2d2
|
SFT2 domain containing 2 |
| chr7_+_143754892 | 14.26 |
ENSRNOT00000085896
|
Soat2
|
sterol O-acyltransferase 2 |
| chr8_+_52729003 | 14.26 |
ENSRNOT00000081738
|
Nxpe4
|
neurexophilin and PC-esterase domain family, member 4 |
| chr10_+_103713045 | 14.10 |
ENSRNOT00000004351
|
Slc9a3r1
|
SLC9A3 regulator 1 |
| chr20_+_20519031 | 14.07 |
ENSRNOT00000000780
|
AABR07044783.1
|
|
| chr3_+_114900343 | 13.60 |
ENSRNOT00000068129
|
Sqrdl
|
sulfide quinone reductase-like (yeast) |
| chr7_+_130296897 | 13.56 |
ENSRNOT00000044854
|
Adm2
|
adrenomedullin 2 |
| chr20_+_55594676 | 13.38 |
ENSRNOT00000057010
|
Sim1
|
single-minded family bHLH transcription factor 1 |
| chr10_-_90415070 | 13.37 |
ENSRNOT00000055179
|
Itga2b
|
integrin subunit alpha 2b |
| chr1_+_213766758 | 13.18 |
ENSRNOT00000005645
|
Ifitm1
|
interferon induced transmembrane protein 1 |
| chr8_+_117068582 | 13.12 |
ENSRNOT00000073559
|
Amt
|
aminomethyltransferase |
| chr1_+_56242346 | 13.04 |
ENSRNOT00000019317
|
Smoc2
|
SPARC related modular calcium binding 2 |
| chr1_+_101265272 | 12.97 |
ENSRNOT00000051280
|
RGD1562492
|
similar to Orphan sodium- and chloride-dependent neurotransmitter transporter NTT5 (Solute carrier family 6 member 16) |
| chr9_-_110225486 | 12.63 |
ENSRNOT00000045096
|
Efna5
|
ephrin A5 |
| chr7_-_117068332 | 12.44 |
ENSRNOT00000082433
|
Fam83h
|
family with sequence similarity 83, member H |
| chrX_-_23649466 | 12.42 |
ENSRNOT00000059431
|
Shroom2
|
shroom family member 2 |
| chr10_-_47666921 | 12.34 |
ENSRNOT00000086579
|
Slc47a1
|
solute carrier family 47 member 1 |
| chr10_-_48860902 | 12.21 |
ENSRNOT00000004127
|
Cenpv
|
centromere protein V |
| chr16_-_71125316 | 12.12 |
ENSRNOT00000020900
|
Plpp5
|
phospholipid phosphatase 5 |
| chr13_+_103396314 | 12.01 |
ENSRNOT00000049499
|
Slc30a10
|
solute carrier family 30, member 10 |
| chr10_-_89374516 | 11.99 |
ENSRNOT00000028084
|
Vat1
|
vesicle amine transport 1 |
| chr1_-_20155960 | 11.88 |
ENSRNOT00000061389
|
Samd3
|
sterile alpha motif domain containing 3 |
| chr7_-_143793774 | 11.69 |
ENSRNOT00000079678
|
Csad
|
cysteine sulfinic acid decarboxylase |
| chrX_+_16337102 | 11.38 |
ENSRNOT00000003954
|
Ccnb3
|
cyclin B3 |
| chr2_+_60169517 | 11.23 |
ENSRNOT00000080974
|
Prlr
|
prolactin receptor |
| chr9_-_19372673 | 11.19 |
ENSRNOT00000073667
ENSRNOT00000079517 |
Clic5
|
chloride intracellular channel 5 |
| chr8_+_70712513 | 11.14 |
ENSRNOT00000079548
|
Parp16
|
poly (ADP-ribose) polymerase family, member 16 |
| chr1_-_73660593 | 10.88 |
ENSRNOT00000038802
|
Lilra5
|
leukocyte immunoglobulin-like receptor, subfamily A (with TM domain), member 5 |
| chr16_-_82099991 | 10.83 |
ENSRNOT00000089447
|
Atp11a
|
ATPase phospholipid transporting 11A |
| chr4_+_114760879 | 10.71 |
ENSRNOT00000090713
|
AC117925.2
|
|
| chr10_+_84966989 | 10.63 |
ENSRNOT00000013580
|
Scrn2
|
secernin 2 |
| chr1_+_282567674 | 10.59 |
ENSRNOT00000090543
|
Ces2i
|
carboxylesterase 2I |
| chr8_-_114617466 | 10.57 |
ENSRNOT00000082992
ENSRNOT00000038160 |
Col6a5
|
collagen type VI alpha 5 chain |
| chr11_-_88972176 | 10.53 |
ENSRNOT00000002498
|
Pkp2
|
plakophilin 2 |
| chr2_+_187162017 | 10.51 |
ENSRNOT00000080693
|
Insrr
|
insulin receptor-related receptor |
| chr18_-_55992885 | 10.46 |
ENSRNOT00000025881
|
Ndst1
|
N-deacetylase and N-sulfotransferase 1 |
| chr7_+_141953794 | 10.32 |
ENSRNOT00000041938
|
Tmprss12
|
transmembrane protease, serine 12 |
| chr11_+_61661724 | 10.29 |
ENSRNOT00000079423
|
Zdhhc23
|
zinc finger, DHHC-type containing 23 |
| chr10_+_36098051 | 10.21 |
ENSRNOT00000083971
|
Adamts2
|
ADAM metallopeptidase with thrombospondin type 1 motif, 2 |
| chr10_+_88979383 | 10.04 |
ENSRNOT00000052157
|
Naglu
|
N-acetyl-alpha-glucosaminidase |
| chr1_+_217349493 | 9.94 |
ENSRNOT00000092278
ENSRNOT00000092579 |
Shank2
|
SH3 and multiple ankyrin repeat domains 2 |
| chrX_-_107762590 | 9.89 |
ENSRNOT00000072739
|
Esx1
|
ESX homeobox 1 |
| chr12_-_41497610 | 9.79 |
ENSRNOT00000001860
|
Iqcd
|
IQ motif containing D |
| chr15_+_108526014 | 9.69 |
ENSRNOT00000017211
|
Tm9sf2
|
transmembrane 9 superfamily member 2 |
| chr2_-_188412329 | 9.60 |
ENSRNOT00000033917
ENSRNOT00000080185 |
Fdps
|
farnesyl diphosphate synthase |
| chr2_-_188413219 | 9.50 |
ENSRNOT00000065065
|
Fdps
|
farnesyl diphosphate synthase |
| chr10_-_14443010 | 9.44 |
ENSRNOT00000022142
|
Tmem204
|
transmembrane protein 204 |
| chr17_-_70234103 | 9.37 |
ENSRNOT00000024200
|
Asb13
|
ankyrin repeat and SOCS box-containing 13 |
| chr8_+_62341613 | 9.36 |
ENSRNOT00000066923
|
Scamp2
|
secretory carrier membrane protein 2 |
| chr9_-_71445739 | 9.34 |
ENSRNOT00000019698
|
Fzd5
|
frizzled class receptor 5 |
| chr5_-_59149625 | 9.23 |
ENSRNOT00000040641
ENSRNOT00000084216 |
Spag8
|
sperm associated antigen 8 |
| chr7_+_117643206 | 9.18 |
ENSRNOT00000077588
|
Adck5
|
aarF domain containing kinase 5 |
| chr5_-_122746839 | 9.13 |
ENSRNOT00000032126
|
Slc35d1
|
solute carrier family 35 member D1 |
| chr1_+_11963836 | 8.98 |
ENSRNOT00000074325
|
AABR07000398.1
|
|
| chr5_+_28850950 | 8.71 |
ENSRNOT00000009759
|
Tmem64
|
transmembrane protein 64 |
| chr15_-_5486590 | 8.70 |
ENSRNOT00000040447
|
AABR07016950.1
|
|
| chr10_-_14022452 | 8.62 |
ENSRNOT00000016554
|
Npw
|
neuropeptide W |
| chr4_+_117780533 | 8.56 |
ENSRNOT00000021211
|
Tprkb
|
Tp53rk binding protein |
| chr2_-_188689392 | 8.52 |
ENSRNOT00000027986
|
Dcst1
|
DC-STAMP domain containing 1 |
| chr6_+_12362813 | 8.52 |
ENSRNOT00000022370
|
Ston1
|
stonin 1 |
| chr19_-_44101365 | 8.49 |
ENSRNOT00000082182
|
Tmem170a
|
transmembrane protein 170A |
| chr13_+_48644604 | 8.49 |
ENSRNOT00000084259
ENSRNOT00000073669 |
Rab29
|
RAB29, member RAS oncogene family |
| chr17_+_57074525 | 8.48 |
ENSRNOT00000020012
ENSRNOT00000074146 |
Crem
|
cAMP responsive element modulator |
| chr12_+_48101673 | 8.46 |
ENSRNOT00000065060
|
Foxn4
|
forkhead box N4 |
| chr13_-_90832138 | 8.45 |
ENSRNOT00000010930
|
Igsf9
|
immunoglobulin superfamily, member 9 |
| chr1_+_56288832 | 8.44 |
ENSRNOT00000079718
|
Smoc2
|
SPARC related modular calcium binding 2 |
| chr1_+_100086520 | 8.28 |
ENSRNOT00000025723
|
Klk1
|
kallikrein 1 |
| chr4_-_132740938 | 8.10 |
ENSRNOT00000007185
|
Rybp
|
RING1 and YY1 binding protein |
| chr3_-_8659102 | 7.97 |
ENSRNOT00000050908
|
Zdhhc12
|
zinc finger, DHHC-type containing 12 |
| chr8_-_22874637 | 7.96 |
ENSRNOT00000064551
ENSRNOT00000090424 |
Dock6
|
dedicator of cytokinesis 6 |
| chr2_+_187697523 | 7.93 |
ENSRNOT00000026153
|
Glmp
|
glycosylated lysosomal membrane protein |
| chr12_-_45801842 | 7.86 |
ENSRNOT00000078837
|
AABR07036513.1
|
|
| chr1_+_78820262 | 7.72 |
ENSRNOT00000022441
|
Gng8
|
G protein subunit gamma 8 |
| chr12_+_46042413 | 7.70 |
ENSRNOT00000046882
|
Ccdc60
|
coiled-coil domain containing 60 |
| chr1_+_219243447 | 7.50 |
ENSRNOT00000024129
|
Tbx10
|
T-box 10 |
| chr9_+_100511610 | 7.49 |
ENSRNOT00000033233
|
Ano7
|
anoctamin 7 |
| chr10_+_109904259 | 7.45 |
ENSRNOT00000073886
|
Rac3
|
ras-related C3 botulinum toxin substrate 3 (rho family, small GTP binding protein Rac3) |
| chr19_-_41161765 | 7.42 |
ENSRNOT00000023117
|
Hydin
|
Hydin, axonemal central pair apparatus protein |
| chr2_+_208749996 | 7.34 |
ENSRNOT00000086321
|
Chia
|
chitinase, acidic |
| chr18_+_24540659 | 7.33 |
ENSRNOT00000061074
|
Ammecr1l
|
AMMECR1 like |
| chr2_-_29121104 | 7.33 |
ENSRNOT00000020543
|
Tnpo1
|
transportin 1 |
| chr5_+_28480023 | 7.28 |
ENSRNOT00000075067
ENSRNOT00000093754 |
LOC100912373
|
uncharacterized LOC100912373 |
| chr4_-_55527092 | 7.27 |
ENSRNOT00000087407
ENSRNOT00000010223 |
Zfp800
|
zinc finger protein 800 |
| chr7_+_129812789 | 7.19 |
ENSRNOT00000006357
|
Creld2
|
cysteine-rich with EGF-like domains 2 |
| chr17_-_4454701 | 7.11 |
ENSRNOT00000080750
ENSRNOT00000066950 |
Dapk1
|
death associated protein kinase 1 |
| chr6_+_22167919 | 6.99 |
ENSRNOT00000007655
|
Nlrc4
|
NLR family, CARD domain containing 4 |
| chr1_+_221644867 | 6.97 |
ENSRNOT00000054830
|
Ehd1
|
EH-domain containing 1 |
| chr9_+_24095751 | 6.92 |
ENSRNOT00000018177
|
Pgk2
|
phosphoglycerate kinase 2 |
| chr3_-_48604097 | 6.90 |
ENSRNOT00000009620
|
Ifih1
|
interferon induced with helicase C domain 1 |
| chr2_-_198439454 | 6.80 |
ENSRNOT00000028780
|
Fcgr1a
|
Fc fragment of IgG receptor Ia |
| chr1_-_198267093 | 6.76 |
ENSRNOT00000047477
|
RGD1563217
|
similar to RIKEN cDNA 4930451I11 |
| chr1_+_177569618 | 6.75 |
ENSRNOT00000090042
|
Tead1
|
TEA domain transcription factor 1 |
| chr7_+_11295892 | 6.61 |
ENSRNOT00000089004
|
Tjp3
|
tight junction protein 3 |
| chr9_-_14724093 | 6.48 |
ENSRNOT00000018500
|
Trem3
|
triggering receptor expressed on myeloid cells 3 |
| chr19_-_10976396 | 6.46 |
ENSRNOT00000073239
|
Nlrc5
|
NLR family, CARD domain containing 5 |
| chr5_-_33574596 | 6.45 |
ENSRNOT00000008281
|
Cpne3
|
copine 3 |
| chr2_+_208750356 | 6.42 |
ENSRNOT00000041562
|
Chia
|
chitinase, acidic |
| chr17_-_45727146 | 6.42 |
ENSRNOT00000083706
|
LOC100912958
|
olfactory receptor 2W1-like |
| chr14_+_81819415 | 6.39 |
ENSRNOT00000018515
ENSRNOT00000075863 ENSRNOT00000077060 |
Mxd4
|
Max dimerization protein 4 |
| chr10_+_87788458 | 6.14 |
ENSRNOT00000042020
|
LOC100910814
|
keratin-associated protein 9-1-like |
| chr3_-_177205836 | 6.12 |
ENSRNOT00000034209
|
Lkaaear1
|
LKAAEAR motif containing 1 |
| chr1_-_167911961 | 6.03 |
ENSRNOT00000025097
|
Olr59
|
olfactory receptor 59 |
| chr9_+_41045363 | 5.96 |
ENSRNOT00000066284
|
Cfc1
|
cripto, FRL-1, cryptic family 1 |
| chr10_+_36589181 | 5.83 |
ENSRNOT00000045596
|
Zfp354a
|
zinc finger protein 354A |
| chr6_+_34094306 | 5.80 |
ENSRNOT00000051970
|
Wdr35
|
WD repeat domain 35 |
| chr1_+_154377447 | 5.79 |
ENSRNOT00000084268
ENSRNOT00000092086 ENSRNOT00000091470 ENSRNOT00000025415 |
Picalm
|
phosphatidylinositol binding clathrin assembly protein |
| chr8_+_4440876 | 5.72 |
ENSRNOT00000049325
ENSRNOT00000076529 ENSRNOT00000076748 |
Pdgfd
|
platelet derived growth factor D |
| chr1_+_205842489 | 5.69 |
ENSRNOT00000081610
|
Fank1
|
fibronectin type 3 and ankyrin repeat domains 1 |
| chrX_-_104814145 | 5.68 |
ENSRNOT00000004909
|
Sytl4
|
synaptotagmin-like 4 |
| chr1_-_213534641 | 5.66 |
ENSRNOT00000033074
|
Syce1
|
synaptonemal complex central element protein 1 |
| chr1_+_276659542 | 5.64 |
ENSRNOT00000019681
|
Tcf7l2
|
transcription factor 7 like 2 |
| chr2_+_113696154 | 5.63 |
ENSRNOT00000039308
ENSRNOT00000091545 |
Pld1
|
phospholipase D1 |
| chr7_+_137155481 | 5.61 |
ENSRNOT00000089895
|
Ano6
|
anoctamin 6 |
| chrX_-_152237347 | 5.59 |
ENSRNOT00000087138
ENSRNOT00000077750 |
Gabre
|
gamma-aminobutyric acid type A receptor epsilon subunit |
| chr2_-_197814808 | 5.58 |
ENSRNOT00000074156
|
Adamtsl4
|
ADAMTS-like 4 |
| chr3_-_123179644 | 5.54 |
ENSRNOT00000028835
|
Lzts3
|
leucine zipper tumor suppressor family member 3 |
| chr10_+_55478298 | 5.48 |
ENSRNOT00000038454
|
Rnf222
|
ring finger protein 222 |
| chr2_-_25190495 | 5.43 |
ENSRNOT00000024202
|
S100z
|
S100 calcium binding protein Z |
| chr18_-_24693481 | 5.38 |
ENSRNOT00000021708
|
Sft2d3
|
SFT2 domain containing 3 |
| chr5_-_126221916 | 5.33 |
ENSRNOT00000052130
|
Lexm
|
lymphocyte expansion molecule |
| chr10_+_87782376 | 5.32 |
ENSRNOT00000017415
|
LOC680396
|
hypothetical protein LOC680396 |
| chr5_-_152458023 | 5.30 |
ENSRNOT00000031225
|
Cnksr1
|
connector enhancer of kinase suppressor of Ras 1 |
| chr12_+_22153983 | 5.23 |
ENSRNOT00000080775
ENSRNOT00000001894 |
Pcolce
|
procollagen C-endopeptidase enhancer |
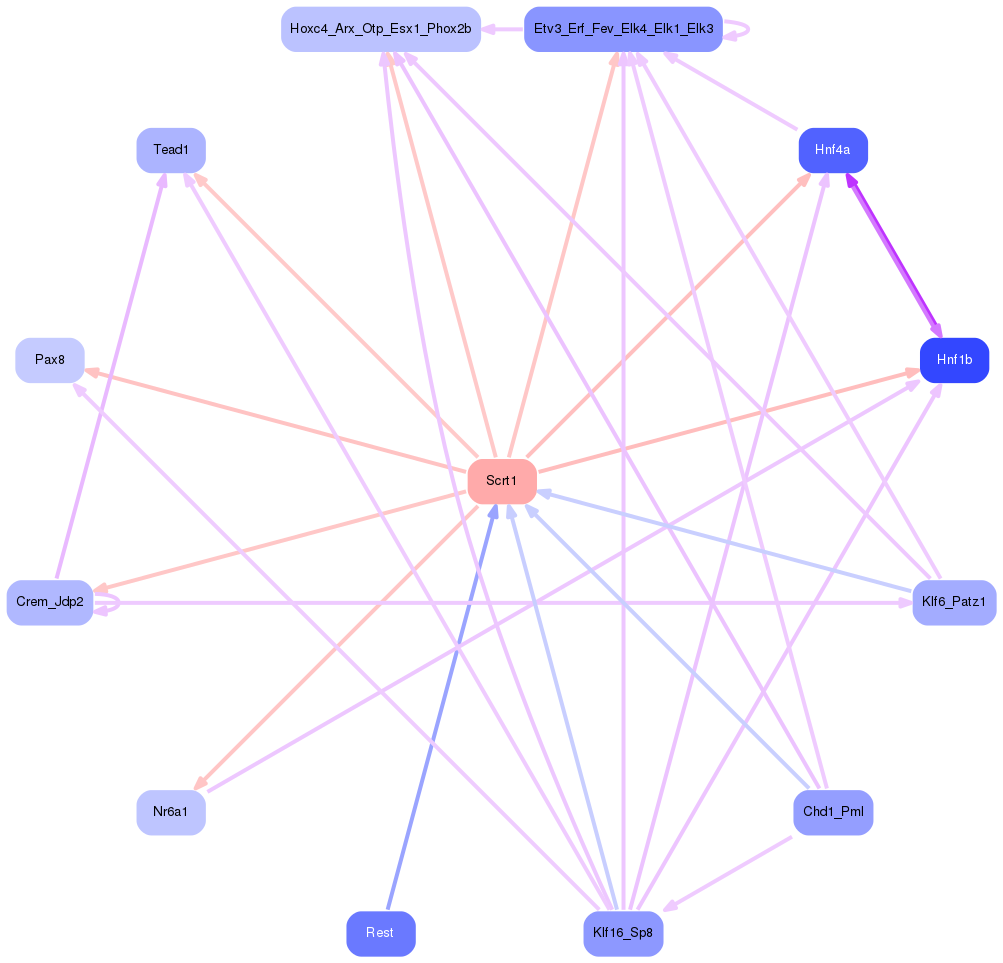
Network of associatons between targets according to the STRING database.

First level regulatory network of Scrt1
Gene Ontology Analysis
Gene overrepresentation in biological process category:
| Log-likelihood per target | Total log-likelihood | Term | Description |
|---|---|---|---|
| 21.2 | 63.5 | GO:0009397 | folic acid-containing compound catabolic process(GO:0009397) pteridine-containing compound catabolic process(GO:0042560) |
| 20.3 | 60.8 | GO:0019265 | glycine biosynthetic process, by transamination of glyoxylate(GO:0019265) |
| 19.2 | 57.5 | GO:0033986 | response to methanol(GO:0033986) |
| 17.7 | 53.0 | GO:0010133 | proline catabolic process to glutamate(GO:0010133) |
| 14.5 | 43.6 | GO:0061215 | mesonephros morphogenesis(GO:0061206) mesonephric nephron development(GO:0061215) mesonephric nephron morphogenesis(GO:0061228) mesenchymal stem cell maintenance involved in mesonephric nephron morphogenesis(GO:0061235) regulation of mesenchymal cell apoptotic process involved in mesonephric nephron morphogenesis(GO:0061295) negative regulation of mesenchymal cell apoptotic process involved in mesonephric nephron morphogenesis(GO:0061296) mesenchymal cell apoptotic process involved in mesonephric nephron morphogenesis(GO:1901146) |
| 11.6 | 57.9 | GO:0016098 | monoterpenoid metabolic process(GO:0016098) |
| 10.1 | 40.5 | GO:0072021 | ascending thin limb development(GO:0072021) metanephric ascending thin limb development(GO:0072218) |
| 9.6 | 38.3 | GO:0042977 | regulation of activation of JAK2 kinase activity(GO:0010534) activation of JAK2 kinase activity(GO:0042977) negative regulation of activation of JAK2 kinase activity(GO:1902569) |
| 8.7 | 26.2 | GO:0070460 | thyroid-stimulating hormone secretion(GO:0070460) regulation of thyroid-stimulating hormone secretion(GO:2000612) |
| 8.4 | 50.4 | GO:0010760 | negative regulation of macrophage chemotaxis(GO:0010760) |
| 7.5 | 22.4 | GO:0007161 | calcium-independent cell-matrix adhesion(GO:0007161) |
| 7.2 | 21.7 | GO:1901252 | negative regulation of dendritic cell cytokine production(GO:0002731) regulation of intracellular transport of viral material(GO:1901252) |
| 6.7 | 20.2 | GO:0048007 | antigen processing and presentation of lipid antigen via MHC class Ib(GO:0048003) antigen processing and presentation, exogenous lipid antigen via MHC class Ib(GO:0048007) |
| 5.9 | 23.7 | GO:0060671 | epithelial cell differentiation involved in embryonic placenta development(GO:0060671) epithelial cell morphogenesis involved in placental branching(GO:0060672) |
| 5.9 | 52.8 | GO:0001766 | membrane raft polarization(GO:0001766) membrane raft distribution(GO:0031580) |
| 5.8 | 23.1 | GO:0097460 | ferrous iron import into cell(GO:0097460) ferrous iron import across plasma membrane(GO:0098707) |
| 5.6 | 16.7 | GO:1903976 | negative regulation of glial cell migration(GO:1903976) |
| 5.5 | 22.2 | GO:0090611 | ubiquitin-independent protein catabolic process via the multivesicular body sorting pathway(GO:0090611) |
| 5.2 | 15.7 | GO:1905225 | response to thyrotropin-releasing hormone(GO:1905225) |
| 5.0 | 20.1 | GO:0019074 | viral genome packaging(GO:0019072) viral RNA genome packaging(GO:0019074) |
| 4.9 | 19.4 | GO:1903413 | regulation of iron ion transmembrane transport(GO:0034759) negative regulation of iron ion transmembrane transport(GO:0034760) cellular response to bile acid(GO:1903413) |
| 4.7 | 14.1 | GO:0034635 | glutathione transport(GO:0034635) tripeptide transport(GO:0042939) |
| 4.3 | 25.7 | GO:0045329 | carnitine biosynthetic process(GO:0045329) |
| 4.0 | 12.0 | GO:0071579 | regulation of zinc ion transport(GO:0071579) |
| 3.9 | 11.7 | GO:0042412 | taurine biosynthetic process(GO:0042412) |
| 3.8 | 19.1 | GO:0033383 | geranyl diphosphate metabolic process(GO:0033383) geranyl diphosphate biosynthetic process(GO:0033384) |
| 3.5 | 10.5 | GO:0071469 | cellular response to alkaline pH(GO:0071469) |
| 3.3 | 13.1 | GO:0006546 | glycine catabolic process(GO:0006546) glycine decarboxylation via glycine cleavage system(GO:0019464) |
| 3.3 | 26.2 | GO:0086073 | bundle of His cell-Purkinje myocyte adhesion involved in cell communication(GO:0086073) |
| 3.2 | 16.2 | GO:0000066 | mitochondrial ornithine transport(GO:0000066) |
| 3.2 | 38.8 | GO:0034312 | diol biosynthetic process(GO:0034312) |
| 3.1 | 9.3 | GO:0060061 | Spemann organizer formation(GO:0060061) |
| 3.0 | 9.1 | GO:0090481 | pyrimidine nucleotide-sugar transmembrane transport(GO:0090481) |
| 3.0 | 20.9 | GO:0030046 | parallel actin filament bundle assembly(GO:0030046) |
| 2.9 | 8.7 | GO:0044339 | canonical Wnt signaling pathway involved in osteoblast differentiation(GO:0044339) |
| 2.8 | 5.6 | GO:2001226 | negative regulation of chloride transport(GO:2001226) |
| 2.8 | 11.1 | GO:0070213 | protein auto-ADP-ribosylation(GO:0070213) |
| 2.8 | 13.8 | GO:0006032 | chitin metabolic process(GO:0006030) chitin catabolic process(GO:0006032) |
| 2.6 | 13.1 | GO:0061589 | calcium activated phosphatidylserine scrambling(GO:0061589) |
| 2.6 | 10.5 | GO:0030210 | heparin biosynthetic process(GO:0030210) |
| 2.4 | 12.2 | GO:0031508 | pericentric heterochromatin assembly(GO:0031508) |
| 2.3 | 28.1 | GO:0072378 | blood coagulation, fibrin clot formation(GO:0072378) |
| 2.3 | 20.6 | GO:0015705 | iodide transport(GO:0015705) |
| 2.3 | 6.8 | GO:0001788 | antibody-dependent cellular cytotoxicity(GO:0001788) |
| 2.2 | 22.1 | GO:0070673 | response to interleukin-18(GO:0070673) |
| 2.0 | 6.0 | GO:1900135 | positive regulation of renin secretion into blood stream(GO:1900135) |
| 2.0 | 12.0 | GO:0010637 | negative regulation of mitochondrial fusion(GO:0010637) |
| 2.0 | 16.0 | GO:0042795 | snRNA transcription from RNA polymerase II promoter(GO:0042795) |
| 1.9 | 5.8 | GO:1902963 | regulation of aspartic-type endopeptidase activity involved in amyloid precursor protein catabolic process(GO:1902959) positive regulation of aspartic-type endopeptidase activity involved in amyloid precursor protein catabolic process(GO:1902961) regulation of metalloendopeptidase activity involved in amyloid precursor protein catabolic process(GO:1902962) negative regulation of metalloendopeptidase activity involved in amyloid precursor protein catabolic process(GO:1902963) regulation of aspartic-type peptidase activity(GO:1905245) positive regulation of aspartic-type peptidase activity(GO:1905247) |
| 1.9 | 5.7 | GO:2000437 | regulation of monocyte extravasation(GO:2000437) |
| 1.9 | 5.6 | GO:0010909 | regulation of heparan sulfate proteoglycan biosynthetic process(GO:0010908) positive regulation of heparan sulfate proteoglycan biosynthetic process(GO:0010909) |
| 1.9 | 7.4 | GO:1904158 | axonemal central apparatus assembly(GO:1904158) |
| 1.8 | 3.7 | GO:0040038 | polar body extrusion after meiotic divisions(GO:0040038) |
| 1.8 | 16.2 | GO:0010668 | ectodermal cell differentiation(GO:0010668) |
| 1.7 | 39.8 | GO:0006855 | drug transmembrane transport(GO:0006855) |
| 1.7 | 28.8 | GO:0060856 | establishment of blood-brain barrier(GO:0060856) |
| 1.6 | 6.5 | GO:0070945 | neutrophil mediated killing of gram-negative bacterium(GO:0070945) |
| 1.6 | 6.5 | GO:0060332 | positive regulation of response to interferon-gamma(GO:0060332) positive regulation of interferon-gamma-mediated signaling pathway(GO:0060335) |
| 1.6 | 6.5 | GO:0038128 | ERBB2 signaling pathway(GO:0038128) |
| 1.6 | 14.3 | GO:0034379 | very-low-density lipoprotein particle assembly(GO:0034379) |
| 1.5 | 6.0 | GO:0060460 | left lung morphogenesis(GO:0060460) |
| 1.4 | 29.1 | GO:0035634 | response to stilbenoid(GO:0035634) |
| 1.3 | 16.8 | GO:0032836 | glomerular basement membrane development(GO:0032836) |
| 1.3 | 7.6 | GO:0072386 | plus-end-directed vesicle transport along microtubule(GO:0072383) plus-end-directed organelle transport along microtubule(GO:0072386) |
| 1.3 | 20.1 | GO:0043651 | linoleic acid metabolic process(GO:0043651) |
| 1.2 | 11.2 | GO:0038161 | prolactin signaling pathway(GO:0038161) |
| 1.2 | 3.5 | GO:0060488 | orthogonal dichotomous subdivision of terminal units involved in lung branching morphogenesis(GO:0060488) planar dichotomous subdivision of terminal units involved in lung branching morphogenesis(GO:0060489) lateral sprouting involved in lung morphogenesis(GO:0060490) |
| 1.1 | 3.3 | GO:0042489 | negative regulation of odontogenesis of dentin-containing tooth(GO:0042489) |
| 1.1 | 4.3 | GO:0070370 | cellular heat acclimation(GO:0070370) |
| 1.0 | 7.3 | GO:0006610 | ribosomal protein import into nucleus(GO:0006610) |
| 1.0 | 11.1 | GO:0050862 | positive regulation of T cell receptor signaling pathway(GO:0050862) |
| 1.0 | 7.0 | GO:0070269 | pyroptosis(GO:0070269) |
| 1.0 | 21.9 | GO:0036336 | dendritic cell migration(GO:0036336) |
| 1.0 | 7.0 | GO:0010886 | positive regulation of cholesterol storage(GO:0010886) |
| 1.0 | 6.9 | GO:0039530 | MDA-5 signaling pathway(GO:0039530) |
| 1.0 | 12.6 | GO:1904321 | response to forskolin(GO:1904321) cellular response to forskolin(GO:1904322) |
| 0.9 | 11.2 | GO:0002024 | diet induced thermogenesis(GO:0002024) |
| 0.9 | 2.7 | GO:0098758 | response to interleukin-8(GO:0098758) cellular response to interleukin-8(GO:0098759) |
| 0.9 | 16.3 | GO:0015937 | coenzyme A biosynthetic process(GO:0015937) |
| 0.9 | 12.4 | GO:0045217 | cell-cell junction maintenance(GO:0045217) |
| 0.9 | 26.4 | GO:0015812 | gamma-aminobutyric acid transport(GO:0015812) |
| 0.9 | 4.3 | GO:0060014 | granulosa cell differentiation(GO:0060014) |
| 0.9 | 15.4 | GO:0090557 | establishment of endothelial intestinal barrier(GO:0090557) |
| 0.9 | 2.6 | GO:0032053 | ciliary basal body organization(GO:0032053) positive regulation of protein localization to cilium(GO:1903566) |
| 0.8 | 8.5 | GO:0035881 | amacrine cell differentiation(GO:0035881) |
| 0.8 | 10.0 | GO:0046548 | retinal rod cell development(GO:0046548) |
| 0.8 | 16.2 | GO:0015721 | bile acid and bile salt transport(GO:0015721) |
| 0.8 | 24.0 | GO:0030212 | hyaluronan metabolic process(GO:0030212) |
| 0.8 | 18.4 | GO:0030574 | collagen catabolic process(GO:0030574) |
| 0.8 | 9.9 | GO:0098880 | maintenance of postsynaptic specialization structure(GO:0098880) maintenance of postsynaptic density structure(GO:0099562) |
| 0.8 | 3.8 | GO:0015755 | fructose transport(GO:0015755) cellular response to fructose stimulus(GO:0071332) |
| 0.8 | 5.3 | GO:0035740 | CD8-positive, alpha-beta T cell proliferation(GO:0035740) |
| 0.7 | 7.5 | GO:0021894 | cerebral cortex GABAergic interneuron development(GO:0021894) |
| 0.7 | 5.1 | GO:0048096 | chromatin-mediated maintenance of transcription(GO:0048096) |
| 0.7 | 3.3 | GO:0032020 | ISG15-protein conjugation(GO:0032020) |
| 0.7 | 4.0 | GO:0015860 | purine nucleoside transmembrane transport(GO:0015860) |
| 0.6 | 5.8 | GO:0007000 | nucleolus organization(GO:0007000) |
| 0.6 | 10.8 | GO:0045332 | phospholipid translocation(GO:0045332) |
| 0.6 | 13.2 | GO:0046597 | negative regulation of viral entry into host cell(GO:0046597) |
| 0.6 | 5.6 | GO:0032534 | regulation of microvillus assembly(GO:0032534) |
| 0.6 | 20.9 | GO:0018345 | protein palmitoylation(GO:0018345) |
| 0.6 | 18.2 | GO:0060445 | branching involved in salivary gland morphogenesis(GO:0060445) |
| 0.6 | 8.5 | GO:0051292 | nuclear pore complex assembly(GO:0051292) |
| 0.6 | 3.6 | GO:0033031 | positive regulation of neutrophil apoptotic process(GO:0033031) |
| 0.6 | 2.9 | GO:0000706 | meiotic DNA double-strand break processing(GO:0000706) |
| 0.6 | 1.7 | GO:0019303 | D-ribose catabolic process(GO:0019303) |
| 0.6 | 5.8 | GO:0035721 | intraciliary retrograde transport(GO:0035721) |
| 0.6 | 35.1 | GO:0003382 | epithelial cell morphogenesis(GO:0003382) |
| 0.5 | 1.6 | GO:0032258 | CVT pathway(GO:0032258) |
| 0.5 | 8.1 | GO:0035518 | histone H2A monoubiquitination(GO:0035518) |
| 0.5 | 7.3 | GO:0016973 | poly(A)+ mRNA export from nucleus(GO:0016973) |
| 0.5 | 2.6 | GO:1990564 | protein polyufmylation(GO:1990564) protein K69-linked ufmylation(GO:1990592) |
| 0.5 | 7.1 | GO:0071447 | cellular response to hydroperoxide(GO:0071447) |
| 0.5 | 17.0 | GO:0035458 | cellular response to interferon-beta(GO:0035458) |
| 0.5 | 5.5 | GO:0033234 | negative regulation of protein sumoylation(GO:0033234) |
| 0.5 | 23.7 | GO:0006687 | glycosphingolipid metabolic process(GO:0006687) |
| 0.5 | 1.4 | GO:0032747 | positive regulation of interleukin-23 production(GO:0032747) |
| 0.5 | 6.7 | GO:1902459 | positive regulation of stem cell population maintenance(GO:1902459) |
| 0.4 | 2.7 | GO:0017196 | N-terminal peptidyl-methionine acetylation(GO:0017196) |
| 0.4 | 1.3 | GO:1902167 | positive regulation of intrinsic apoptotic signaling pathway in response to DNA damage by p53 class mediator(GO:1902167) |
| 0.4 | 2.2 | GO:0071955 | recycling endosome to Golgi transport(GO:0071955) |
| 0.4 | 1.3 | GO:1904618 | transitional stage B cell differentiation(GO:0002332) transitional one stage B cell differentiation(GO:0002333) glomerular visceral epithelial cell apoptotic process(GO:1903210) positive regulation of actin filament binding(GO:1904531) positive regulation of actin binding(GO:1904618) |
| 0.4 | 9.9 | GO:0060713 | labyrinthine layer morphogenesis(GO:0060713) |
| 0.4 | 7.3 | GO:0045947 | negative regulation of translational initiation(GO:0045947) |
| 0.4 | 4.2 | GO:0044821 | telomere tethering at nuclear periphery(GO:0034398) meiotic telomere tethering at nuclear periphery(GO:0044821) meiotic attachment of telomere to nuclear envelope(GO:0070197) chromosome attachment to the nuclear envelope(GO:0097240) |
| 0.4 | 1.5 | GO:0034421 | post-translational protein acetylation(GO:0034421) |
| 0.3 | 8.9 | GO:0001945 | lymph vessel development(GO:0001945) |
| 0.3 | 34.2 | GO:0090277 | positive regulation of peptide hormone secretion(GO:0090277) |
| 0.3 | 4.8 | GO:2000188 | regulation of cholesterol homeostasis(GO:2000188) |
| 0.3 | 5.0 | GO:0032780 | negative regulation of ATPase activity(GO:0032780) |
| 0.3 | 2.5 | GO:0090214 | spongiotrophoblast layer developmental growth(GO:0090214) |
| 0.3 | 4.7 | GO:0006851 | mitochondrial calcium ion transport(GO:0006851) |
| 0.3 | 8.3 | GO:0002675 | positive regulation of acute inflammatory response(GO:0002675) |
| 0.3 | 12.9 | GO:0044380 | protein localization to cytoskeleton(GO:0044380) |
| 0.3 | 26.7 | GO:0007229 | integrin-mediated signaling pathway(GO:0007229) |
| 0.3 | 2.8 | GO:0003334 | keratinocyte development(GO:0003334) |
| 0.2 | 4.2 | GO:0006662 | glycerol ether metabolic process(GO:0006662) |
| 0.2 | 2.2 | GO:0000270 | peptidoglycan metabolic process(GO:0000270) peptidoglycan catabolic process(GO:0009253) |
| 0.2 | 3.9 | GO:0001921 | positive regulation of receptor recycling(GO:0001921) |
| 0.2 | 1.4 | GO:0048050 | post-embryonic eye morphogenesis(GO:0048050) |
| 0.2 | 1.2 | GO:0031642 | negative regulation of myelination(GO:0031642) |
| 0.2 | 0.5 | GO:1900063 | regulation of peroxisome organization(GO:1900063) |
| 0.2 | 3.6 | GO:0019236 | response to pheromone(GO:0019236) |
| 0.2 | 2.8 | GO:0070234 | positive regulation of T cell apoptotic process(GO:0070234) |
| 0.2 | 1.9 | GO:0035879 | plasma membrane lactate transport(GO:0035879) |
| 0.2 | 0.6 | GO:0072344 | rescue of stalled ribosome(GO:0072344) |
| 0.2 | 10.8 | GO:0000079 | regulation of cyclin-dependent protein serine/threonine kinase activity(GO:0000079) |
| 0.2 | 32.8 | GO:0030308 | negative regulation of cell growth(GO:0030308) |
| 0.2 | 2.8 | GO:0060337 | type I interferon signaling pathway(GO:0060337) cellular response to type I interferon(GO:0071357) |
| 0.2 | 5.7 | GO:0070193 | synaptonemal complex assembly(GO:0007130) synaptonemal complex organization(GO:0070193) |
| 0.2 | 0.5 | GO:0060011 | Sertoli cell proliferation(GO:0060011) |
| 0.2 | 16.8 | GO:0006888 | ER to Golgi vesicle-mediated transport(GO:0006888) |
| 0.2 | 1.6 | GO:1990403 | embryonic brain development(GO:1990403) |
| 0.2 | 0.2 | GO:2000049 | positive regulation of cell-cell adhesion mediated by cadherin(GO:2000049) |
| 0.1 | 13.4 | GO:0072164 | ureteric bud development(GO:0001657) mesonephric epithelium development(GO:0072163) mesonephric tubule development(GO:0072164) |
| 0.1 | 0.9 | GO:0002943 | tRNA dihydrouridine synthesis(GO:0002943) |
| 0.1 | 4.6 | GO:0006506 | GPI anchor biosynthetic process(GO:0006506) |
| 0.1 | 30.3 | GO:0010951 | negative regulation of endopeptidase activity(GO:0010951) |
| 0.1 | 0.6 | GO:0046600 | negative regulation of centriole replication(GO:0046600) |
| 0.1 | 3.7 | GO:0045070 | positive regulation of viral genome replication(GO:0045070) |
| 0.1 | 5.7 | GO:0046676 | negative regulation of insulin secretion(GO:0046676) |
| 0.1 | 2.4 | GO:0048240 | sperm capacitation(GO:0048240) |
| 0.1 | 4.9 | GO:0045600 | positive regulation of fat cell differentiation(GO:0045600) |
| 0.1 | 5.9 | GO:0032092 | positive regulation of protein binding(GO:0032092) |
| 0.1 | 0.6 | GO:2000074 | regulation of type B pancreatic cell development(GO:2000074) negative regulation of glucocorticoid receptor signaling pathway(GO:2000323) |
| 0.1 | 0.5 | GO:0071034 | CUT catabolic process(GO:0071034) CUT metabolic process(GO:0071043) |
| 0.1 | 1.3 | GO:0030194 | positive regulation of blood coagulation(GO:0030194) positive regulation of hemostasis(GO:1900048) |
| 0.1 | 1.4 | GO:1902042 | negative regulation of extrinsic apoptotic signaling pathway via death domain receptors(GO:1902042) |
| 0.1 | 11.4 | GO:0007156 | homophilic cell adhesion via plasma membrane adhesion molecules(GO:0007156) |
| 0.1 | 1.0 | GO:0006120 | mitochondrial electron transport, NADH to ubiquinone(GO:0006120) |
| 0.1 | 1.1 | GO:0035329 | hippo signaling(GO:0035329) |
| 0.1 | 5.9 | GO:0010811 | positive regulation of cell-substrate adhesion(GO:0010811) |
| 0.1 | 4.2 | GO:0071300 | cellular response to retinoic acid(GO:0071300) |
| 0.1 | 2.5 | GO:0070286 | axonemal dynein complex assembly(GO:0070286) |
| 0.1 | 3.4 | GO:0030520 | intracellular estrogen receptor signaling pathway(GO:0030520) |
| 0.1 | 2.3 | GO:0048635 | negative regulation of muscle organ development(GO:0048635) |
| 0.1 | 1.6 | GO:0046513 | ceramide biosynthetic process(GO:0046513) |
| 0.1 | 3.2 | GO:0032755 | positive regulation of interleukin-6 production(GO:0032755) |
| 0.1 | 5.5 | GO:0008033 | tRNA processing(GO:0008033) |
| 0.1 | 0.5 | GO:0051560 | mitochondrial calcium ion homeostasis(GO:0051560) |
| 0.1 | 1.2 | GO:0042462 | eye photoreceptor cell development(GO:0042462) |
| 0.1 | 4.2 | GO:2000045 | regulation of G1/S transition of mitotic cell cycle(GO:2000045) |
| 0.0 | 0.1 | GO:2000768 | glomerular parietal epithelial cell differentiation(GO:0072139) positive regulation of nephron tubule epithelial cell differentiation(GO:2000768) |
| 0.0 | 1.9 | GO:0042107 | cytokine metabolic process(GO:0042107) |
| 0.0 | 7.3 | GO:0032259 | methylation(GO:0032259) |
| 0.0 | 2.1 | GO:0007586 | digestion(GO:0007586) |
| 0.0 | 1.1 | GO:0001541 | ovarian follicle development(GO:0001541) |
| 0.0 | 0.6 | GO:0000082 | G1/S transition of mitotic cell cycle(GO:0000082) |
Gene overrepresentation in cellular component category:
| Log-likelihood per target | Total log-likelihood | Term | Description |
|---|---|---|---|
| 12.6 | 62.9 | GO:0061689 | tricellular tight junction(GO:0061689) |
| 7.2 | 50.4 | GO:0005579 | membrane attack complex(GO:0005579) |
| 3.9 | 23.1 | GO:1990712 | HFE-transferrin receptor complex(GO:1990712) |
| 3.5 | 28.1 | GO:0005577 | fibrinogen complex(GO:0005577) |
| 3.2 | 22.2 | GO:0090543 | Flemming body(GO:0090543) |
| 2.5 | 35.0 | GO:0032426 | stereocilium tip(GO:0032426) |
| 2.3 | 7.0 | GO:0031095 | platelet dense tubular network membrane(GO:0031095) |
| 2.2 | 6.7 | GO:0071148 | TEAD-1-YAP complex(GO:0071148) |
| 2.1 | 16.8 | GO:0098645 | collagen type IV trimer(GO:0005587) network-forming collagen trimer(GO:0098642) collagen network(GO:0098645) |
| 2.0 | 27.4 | GO:0030127 | COPII vesicle coat(GO:0030127) |
| 1.9 | 19.4 | GO:0045179 | apical cortex(GO:0045179) |
| 1.9 | 5.6 | GO:1990907 | beta-catenin-TCF complex(GO:1990907) |
| 1.8 | 38.8 | GO:0030057 | desmosome(GO:0030057) |
| 1.7 | 8.5 | GO:0020003 | symbiont-containing vacuole(GO:0020003) |
| 1.5 | 7.4 | GO:1990716 | axonemal central apparatus(GO:1990716) |
| 1.4 | 7.0 | GO:0072557 | IPAF inflammasome complex(GO:0072557) |
| 1.4 | 27.1 | GO:0005614 | interstitial matrix(GO:0005614) |
| 1.1 | 11.5 | GO:0036056 | filtration diaphragm(GO:0036056) slit diaphragm(GO:0036057) |
| 1.0 | 22.1 | GO:0016327 | apicolateral plasma membrane(GO:0016327) |
| 0.9 | 50.6 | GO:0060170 | ciliary membrane(GO:0060170) |
| 0.8 | 5.8 | GO:0030991 | intraciliary transport particle A(GO:0030991) |
| 0.7 | 12.6 | GO:0031362 | anchored component of external side of plasma membrane(GO:0031362) |
| 0.7 | 8.6 | GO:0000801 | central element(GO:0000801) |
| 0.6 | 11.1 | GO:0071782 | endoplasmic reticulum tubular network(GO:0071782) |
| 0.5 | 7.6 | GO:0005832 | chaperonin-containing T-complex(GO:0005832) |
| 0.5 | 1.6 | GO:0034271 | phosphatidylinositol 3-kinase complex, class III, type I(GO:0034271) phosphatidylinositol 3-kinase complex, class III, type II(GO:0034272) |
| 0.5 | 35.1 | GO:0016459 | myosin complex(GO:0016459) |
| 0.5 | 5.8 | GO:0097418 | neurofibrillary tangle(GO:0097418) |
| 0.5 | 3.7 | GO:0071203 | WASH complex(GO:0071203) |
| 0.5 | 3.2 | GO:0036128 | CatSper complex(GO:0036128) |
| 0.4 | 61.8 | GO:0031227 | intrinsic component of endoplasmic reticulum membrane(GO:0031227) |
| 0.4 | 51.8 | GO:0072562 | blood microparticle(GO:0072562) |
| 0.4 | 23.6 | GO:0034707 | chloride channel complex(GO:0034707) |
| 0.4 | 4.2 | GO:0070187 | telosome(GO:0070187) |
| 0.4 | 5.7 | GO:0035253 | ciliary rootlet(GO:0035253) |
| 0.4 | 12.2 | GO:0051233 | spindle midzone(GO:0051233) |
| 0.4 | 21.1 | GO:0008023 | transcription elongation factor complex(GO:0008023) |
| 0.4 | 2.6 | GO:0060205 | cytoplasmic membrane-bounded vesicle lumen(GO:0060205) |
| 0.3 | 9.4 | GO:0032588 | trans-Golgi network membrane(GO:0032588) |
| 0.3 | 2.7 | GO:0042629 | mast cell granule(GO:0042629) |
| 0.3 | 4.7 | GO:0030061 | mitochondrial crista(GO:0030061) |
| 0.3 | 24.0 | GO:0031225 | anchored component of membrane(GO:0031225) |
| 0.3 | 16.2 | GO:0031519 | PcG protein complex(GO:0031519) |
| 0.3 | 93.6 | GO:0005759 | mitochondrial matrix(GO:0005759) |
| 0.3 | 20.0 | GO:0045095 | keratin filament(GO:0045095) |
| 0.3 | 8.5 | GO:0060077 | inhibitory synapse(GO:0060077) |
| 0.3 | 30.2 | GO:0055037 | recycling endosome(GO:0055037) |
| 0.3 | 18.3 | GO:0005811 | lipid particle(GO:0005811) |
| 0.3 | 34.1 | GO:0005903 | brush border(GO:0005903) |
| 0.2 | 28.4 | GO:0005923 | bicellular tight junction(GO:0005923) |
| 0.2 | 84.3 | GO:0005667 | transcription factor complex(GO:0005667) |
| 0.2 | 5.5 | GO:0000152 | nuclear ubiquitin ligase complex(GO:0000152) |
| 0.2 | 3.7 | GO:0043296 | apical junction complex(GO:0043296) |
| 0.2 | 15.4 | GO:0005604 | basement membrane(GO:0005604) |
| 0.2 | 1.4 | GO:0031143 | pseudopodium(GO:0031143) |
| 0.1 | 19.3 | GO:0016324 | apical plasma membrane(GO:0016324) |
| 0.1 | 50.8 | GO:0005743 | mitochondrial inner membrane(GO:0005743) |
| 0.1 | 21.7 | GO:0019897 | extrinsic component of plasma membrane(GO:0019897) |
| 0.1 | 0.5 | GO:0097136 | Bcl-2 family protein complex(GO:0097136) |
| 0.1 | 1.6 | GO:0071564 | npBAF complex(GO:0071564) |
| 0.1 | 5.0 | GO:0005913 | cell-cell adherens junction(GO:0005913) |
| 0.1 | 183.2 | GO:0005783 | endoplasmic reticulum(GO:0005783) |
| 0.1 | 9.8 | GO:0005741 | mitochondrial outer membrane(GO:0005741) |
| 0.1 | 1.3 | GO:0005771 | multivesicular body(GO:0005771) |
| 0.1 | 2.8 | GO:0005689 | U12-type spliceosomal complex(GO:0005689) |
| 0.1 | 8.3 | GO:0001669 | acrosomal vesicle(GO:0001669) |
| 0.1 | 12.6 | GO:0005578 | proteinaceous extracellular matrix(GO:0005578) |
| 0.1 | 0.6 | GO:0097431 | mitotic spindle pole(GO:0097431) |
| 0.1 | 17.6 | GO:0016607 | nuclear speck(GO:0016607) |
| 0.1 | 5.3 | GO:0005938 | cell cortex(GO:0005938) |
| 0.1 | 10.4 | GO:0031252 | cell leading edge(GO:0031252) |
| 0.0 | 1.2 | GO:0034451 | centriolar satellite(GO:0034451) |
| 0.0 | 72.3 | GO:0070062 | extracellular exosome(GO:0070062) |
| 0.0 | 2.4 | GO:0098852 | lysosomal membrane(GO:0005765) lytic vacuole membrane(GO:0098852) |
| 0.0 | 2.7 | GO:0036464 | cytoplasmic ribonucleoprotein granule(GO:0036464) |
| 0.0 | 13.7 | GO:0005576 | extracellular region(GO:0005576) |
Gene overrepresentation in molecular function category:
| Log-likelihood per target | Total log-likelihood | Term | Description |
|---|---|---|---|
| 17.7 | 53.0 | GO:0004657 | proline dehydrogenase activity(GO:0004657) |
| 16.8 | 50.4 | GO:0031714 | C5a anaphylatoxin chemotactic receptor binding(GO:0031714) |
| 12.2 | 60.8 | GO:0008453 | alanine-glyoxylate transaminase activity(GO:0008453) |
| 11.4 | 34.2 | GO:0070506 | high-density lipoprotein particle receptor activity(GO:0070506) |
| 7.9 | 63.5 | GO:0016742 | hydroxymethyl-, formyl- and related transferase activity(GO:0016742) |
| 7.8 | 38.8 | GO:0004301 | epoxide hydrolase activity(GO:0004301) |
| 6.7 | 20.1 | GO:0008405 | arachidonic acid 11,12-epoxygenase activity(GO:0008405) |
| 6.7 | 20.1 | GO:0004736 | pyruvate carboxylase activity(GO:0004736) |
| 5.2 | 20.6 | GO:0015111 | iodide transmembrane transporter activity(GO:0015111) |
| 4.4 | 26.4 | GO:0005332 | gamma-aminobutyric acid:sodium symporter activity(GO:0005332) |
| 4.1 | 16.3 | GO:0004594 | pantothenate kinase activity(GO:0004594) |
| 3.9 | 47.3 | GO:0019864 | IgG binding(GO:0019864) |
| 3.8 | 19.1 | GO:0004161 | dimethylallyltranstransferase activity(GO:0004161) geranyltranstransferase activity(GO:0004337) |
| 3.7 | 11.2 | GO:0004925 | prolactin receptor activity(GO:0004925) |
| 3.5 | 14.1 | GO:0045159 | myosin II binding(GO:0045159) |
| 3.4 | 20.2 | GO:0071723 | beta-2-microglobulin binding(GO:0030881) lipopeptide binding(GO:0071723) |
| 3.2 | 38.3 | GO:0016290 | palmitoyl-CoA hydrolase activity(GO:0016290) |
| 2.9 | 57.9 | GO:0010181 | FMN binding(GO:0010181) |
| 2.7 | 16.2 | GO:0008508 | bile acid:sodium symporter activity(GO:0008508) |
| 2.5 | 12.4 | GO:1990254 | keratin filament binding(GO:1990254) |
| 2.3 | 23.1 | GO:0039706 | co-receptor binding(GO:0039706) |
| 2.3 | 6.9 | GO:0004618 | phosphoglycerate kinase activity(GO:0004618) |
| 2.3 | 13.8 | GO:0004568 | chitinase activity(GO:0004568) |
| 2.3 | 9.1 | GO:0015165 | pyrimidine nucleotide-sugar transmembrane transporter activity(GO:0015165) |
| 2.2 | 13.4 | GO:0070051 | fibrinogen binding(GO:0070051) |
| 2.2 | 25.9 | GO:0019911 | structural constituent of myelin sheath(GO:0019911) |
| 2.1 | 16.7 | GO:0050291 | sphingosine N-acyltransferase activity(GO:0050291) |
| 2.0 | 16.2 | GO:0000064 | L-ornithine transmembrane transporter activity(GO:0000064) |
| 1.8 | 21.7 | GO:0008191 | metalloendopeptidase inhibitor activity(GO:0008191) |
| 1.7 | 10.5 | GO:0015016 | [heparan sulfate]-glucosamine N-sulfotransferase activity(GO:0015016) |
| 1.7 | 39.8 | GO:0015238 | drug transmembrane transporter activity(GO:0015238) |
| 1.6 | 4.8 | GO:0008142 | oxysterol binding(GO:0008142) |
| 1.6 | 12.6 | GO:0005169 | neurotrophin TRKB receptor binding(GO:0005169) |
| 1.1 | 15.7 | GO:0016500 | protein-hormone receptor activity(GO:0016500) |
| 1.1 | 32.9 | GO:0015020 | glucuronosyltransferase activity(GO:0015020) |
| 1.1 | 4.2 | GO:0033743 | peptide-methionine (R)-S-oxide reductase activity(GO:0033743) |
| 1.1 | 10.5 | GO:0019215 | intermediate filament binding(GO:0019215) |
| 0.9 | 5.6 | GO:0070290 | N-acylphosphatidylethanolamine-specific phospholipase D activity(GO:0070290) |
| 0.9 | 2.7 | GO:0004918 | interleukin-8 receptor activity(GO:0004918) |
| 0.9 | 12.8 | GO:0016805 | dipeptidase activity(GO:0016805) |
| 0.9 | 105.5 | GO:0004867 | serine-type endopeptidase inhibitor activity(GO:0004867) |
| 0.9 | 3.6 | GO:0019862 | IgA binding(GO:0019862) |
| 0.8 | 9.9 | GO:0098879 | structural constituent of postsynaptic specialization(GO:0098879) structural constituent of postsynaptic density(GO:0098919) |
| 0.8 | 10.5 | GO:0043560 | insulin receptor substrate binding(GO:0043560) |
| 0.7 | 30.7 | GO:0070330 | aromatase activity(GO:0070330) |
| 0.7 | 6.0 | GO:0070697 | activin receptor binding(GO:0070697) |
| 0.7 | 5.6 | GO:0022851 | GABA-gated chloride ion channel activity(GO:0022851) |
| 0.7 | 4.7 | GO:0005432 | calcium:sodium antiporter activity(GO:0005432) |
| 0.6 | 14.3 | GO:0000062 | fatty-acyl-CoA binding(GO:0000062) |
| 0.6 | 5.8 | GO:0032050 | clathrin heavy chain binding(GO:0032050) |
| 0.6 | 20.9 | GO:0019707 | protein-cysteine S-palmitoyltransferase activity(GO:0019706) protein-cysteine S-acyltransferase activity(GO:0019707) |
| 0.6 | 13.0 | GO:0005328 | neurotransmitter:sodium symporter activity(GO:0005328) |
| 0.6 | 7.3 | GO:0008190 | eukaryotic initiation factor 4E binding(GO:0008190) |
| 0.6 | 10.8 | GO:0004012 | phospholipid-translocating ATPase activity(GO:0004012) |
| 0.6 | 28.8 | GO:0005504 | fatty acid binding(GO:0005504) |
| 0.6 | 1.7 | GO:0044715 | 8-oxo-dGDP phosphatase activity(GO:0044715) |
| 0.6 | 5.6 | GO:0070016 | armadillo repeat domain binding(GO:0070016) |
| 0.5 | 1.6 | GO:0042284 | sphingolipid delta-4 desaturase activity(GO:0042284) |
| 0.5 | 25.7 | GO:0016706 | oxidoreductase activity, acting on paired donors, with incorporation or reduction of molecular oxygen, 2-oxoglutarate as one donor, and incorporation of one atom each of oxygen into both donors(GO:0016706) |
| 0.5 | 3.9 | GO:0031702 | type 1 angiotensin receptor binding(GO:0031702) |
| 0.5 | 11.1 | GO:0003950 | NAD+ ADP-ribosyltransferase activity(GO:0003950) |
| 0.5 | 8.2 | GO:0042813 | Wnt-activated receptor activity(GO:0042813) |
| 0.4 | 2.2 | GO:0008745 | N-acetylmuramoyl-L-alanine amidase activity(GO:0008745) |
| 0.4 | 24.4 | GO:0035326 | enhancer binding(GO:0035326) |
| 0.4 | 12.0 | GO:0005385 | zinc ion transmembrane transporter activity(GO:0005385) |
| 0.4 | 13.5 | GO:0098632 | protein binding involved in cell-cell adhesion(GO:0098632) |
| 0.4 | 5.7 | GO:0042043 | neurexin family protein binding(GO:0042043) |
| 0.4 | 60.8 | GO:0008083 | growth factor activity(GO:0008083) |
| 0.4 | 1.2 | GO:0043812 | phosphatidylinositol-4-phosphate phosphatase activity(GO:0043812) |
| 0.4 | 32.1 | GO:0000979 | RNA polymerase II core promoter sequence-specific DNA binding(GO:0000979) |
| 0.4 | 6.7 | GO:0001134 | transcription factor activity, transcription factor recruiting(GO:0001134) |
| 0.4 | 24.7 | GO:0001046 | core promoter sequence-specific DNA binding(GO:0001046) |
| 0.4 | 4.0 | GO:0005346 | adenine nucleotide transmembrane transporter activity(GO:0000295) purine ribonucleotide transmembrane transporter activity(GO:0005346) |
| 0.3 | 36.5 | GO:0003705 | transcription factor activity, RNA polymerase II distal enhancer sequence-specific binding(GO:0003705) |
| 0.3 | 1.3 | GO:0000293 | ferric-chelate reductase activity(GO:0000293) |
| 0.3 | 5.6 | GO:0005247 | voltage-gated chloride channel activity(GO:0005247) |
| 0.3 | 40.3 | GO:0004222 | metalloendopeptidase activity(GO:0004222) |
| 0.3 | 4.6 | GO:0008395 | steroid hydroxylase activity(GO:0008395) |
| 0.3 | 50.1 | GO:0052689 | carboxylic ester hydrolase activity(GO:0052689) |
| 0.3 | 8.5 | GO:0070840 | dynein complex binding(GO:0070840) |
| 0.3 | 7.0 | GO:0043027 | cysteine-type endopeptidase inhibitor activity involved in apoptotic process(GO:0043027) |
| 0.3 | 3.3 | GO:0008641 | small protein activating enzyme activity(GO:0008641) |
| 0.3 | 19.4 | GO:0005507 | copper ion binding(GO:0005507) |
| 0.3 | 16.8 | GO:0005201 | extracellular matrix structural constituent(GO:0005201) |
| 0.3 | 38.3 | GO:0003774 | motor activity(GO:0003774) |
| 0.3 | 11.7 | GO:0016831 | carboxy-lyase activity(GO:0016831) |
| 0.3 | 1.3 | GO:0070097 | delta-catenin binding(GO:0070097) |
| 0.3 | 7.6 | GO:0044183 | protein binding involved in protein folding(GO:0044183) |
| 0.2 | 23.2 | GO:0005089 | Rho guanyl-nucleotide exchange factor activity(GO:0005089) |
| 0.2 | 1.9 | GO:0015129 | lactate transmembrane transporter activity(GO:0015129) |
| 0.2 | 5.1 | GO:0000993 | RNA polymerase II core binding(GO:0000993) |
| 0.2 | 7.3 | GO:0008139 | nuclear localization sequence binding(GO:0008139) |
| 0.2 | 2.6 | GO:0004000 | adenosine deaminase activity(GO:0004000) |
| 0.2 | 7.9 | GO:0004879 | RNA polymerase II transcription factor activity, ligand-activated sequence-specific DNA binding(GO:0004879) transcription factor activity, direct ligand regulated sequence-specific DNA binding(GO:0098531) |
| 0.2 | 23.2 | GO:0008201 | heparin binding(GO:0008201) |
| 0.2 | 2.7 | GO:0004596 | peptide alpha-N-acetyltransferase activity(GO:0004596) |
| 0.2 | 1.9 | GO:0042056 | chemoattractant activity(GO:0042056) |
| 0.2 | 21.6 | GO:0030674 | protein binding, bridging(GO:0030674) |
| 0.2 | 26.7 | GO:0005085 | guanyl-nucleotide exchange factor activity(GO:0005085) |
| 0.2 | 36.8 | GO:0004252 | serine-type endopeptidase activity(GO:0004252) |
| 0.2 | 12.4 | GO:0008013 | beta-catenin binding(GO:0008013) |
| 0.2 | 3.3 | GO:0005031 | tumor necrosis factor-activated receptor activity(GO:0005031) death receptor activity(GO:0005035) |
| 0.2 | 4.9 | GO:0017075 | syntaxin-1 binding(GO:0017075) |
| 0.2 | 3.7 | GO:0043014 | alpha-tubulin binding(GO:0043014) |
| 0.2 | 0.8 | GO:0030280 | structural constituent of epidermis(GO:0030280) |
| 0.2 | 6.5 | GO:0030971 | receptor tyrosine kinase binding(GO:0030971) |
| 0.1 | 0.9 | GO:0017150 | tRNA dihydrouridine synthase activity(GO:0017150) |
| 0.1 | 5.0 | GO:0004869 | cysteine-type endopeptidase inhibitor activity(GO:0004869) |
| 0.1 | 6.9 | GO:0003727 | single-stranded RNA binding(GO:0003727) |
| 0.1 | 3.8 | GO:0005355 | glucose transmembrane transporter activity(GO:0005355) |
| 0.1 | 25.6 | GO:0044822 | mRNA binding(GO:0003729) poly(A) RNA binding(GO:0044822) |
| 0.1 | 3.2 | GO:0004707 | MAP kinase activity(GO:0004707) |
| 0.1 | 9.1 | GO:0008565 | protein transporter activity(GO:0008565) |
| 0.1 | 1.2 | GO:0005237 | inhibitory extracellular ligand-gated ion channel activity(GO:0005237) |
| 0.1 | 0.6 | GO:0017176 | phosphatidylinositol N-acetylglucosaminyltransferase activity(GO:0017176) |
| 0.1 | 17.4 | GO:0008168 | methyltransferase activity(GO:0008168) |
| 0.1 | 5.1 | GO:0004715 | non-membrane spanning protein tyrosine kinase activity(GO:0004715) |
| 0.1 | 3.4 | GO:0001047 | core promoter binding(GO:0001047) |
| 0.1 | 12.2 | GO:0008514 | organic anion transmembrane transporter activity(GO:0008514) |
| 0.1 | 1.4 | GO:0031434 | mitogen-activated protein kinase kinase binding(GO:0031434) |
| 0.1 | 0.5 | GO:0050700 | CARD domain binding(GO:0050700) |
| 0.1 | 1.2 | GO:0070063 | RNA polymerase binding(GO:0070063) |
| 0.1 | 1.9 | GO:0019213 | deacetylase activity(GO:0019213) |
| 0.1 | 1.8 | GO:0000049 | tRNA binding(GO:0000049) |
| 0.0 | 0.5 | GO:0051400 | BH domain binding(GO:0051400) |
| 0.0 | 5.9 | GO:0005179 | hormone activity(GO:0005179) |
| 0.0 | 3.5 | GO:0020037 | heme binding(GO:0020037) |
| 0.0 | 0.5 | GO:0001594 | trace-amine receptor activity(GO:0001594) |
| 0.0 | 10.8 | GO:0016491 | oxidoreductase activity(GO:0016491) |
| 0.0 | 1.6 | GO:0017137 | Rab GTPase binding(GO:0017137) |
Gene overrepresentation in curated gene sets: canonical pathways category:
| Log-likelihood per target | Total log-likelihood | Term | Description |
|---|---|---|---|
| 1.4 | 73.7 | PID INTEGRIN3 PATHWAY | Beta3 integrin cell surface interactions |
| 1.4 | 2.7 | PID IL8 CXCR1 PATHWAY | IL8- and CXCR1-mediated signaling events |
| 1.3 | 74.1 | PID HNF3B PATHWAY | FOXA2 and FOXA3 transcription factor networks |
| 1.2 | 57.5 | PID HNF3A PATHWAY | FOXA1 transcription factor network |
| 1.0 | 26.4 | ST WNT CA2 CYCLIC GMP PATHWAY | Wnt/Ca2+/cyclic GMP signaling. |
| 0.5 | 30.7 | PID ARF6 TRAFFICKING PATHWAY | Arf6 trafficking events |
| 0.5 | 17.7 | PID TCR CALCIUM PATHWAY | Calcium signaling in the CD4+ TCR pathway |
| 0.5 | 109.4 | NABA ECM REGULATORS | Genes encoding enzymes and their regulators involved in the remodeling of the extracellular matrix |
| 0.4 | 9.3 | PID WNT CANONICAL PATHWAY | Canonical Wnt signaling pathway |
| 0.3 | 5.7 | PID UPA UPAR PATHWAY | Urokinase-type plasminogen activator (uPA) and uPAR-mediated signaling |
| 0.3 | 22.1 | PID TGFBR PATHWAY | TGF-beta receptor signaling |
| 0.3 | 12.6 | PID EPHA FWDPATHWAY | EPHA forward signaling |
| 0.3 | 8.6 | PID CDC42 REG PATHWAY | Regulation of CDC42 activity |
| 0.3 | 11.2 | PID PTP1B PATHWAY | Signaling events mediated by PTP1B |
| 0.3 | 10.6 | NABA BASEMENT MEMBRANES | Genes encoding structural components of basement membranes |
| 0.3 | 7.1 | PID NETRIN PATHWAY | Netrin-mediated signaling events |
| 0.3 | 5.3 | PID IL3 PATHWAY | IL3-mediated signaling events |
| 0.3 | 44.3 | NABA ECM GLYCOPROTEINS | Genes encoding structural ECM glycoproteins |
| 0.2 | 2.8 | ST TYPE I INTERFERON PATHWAY | Type I Interferon (alpha/beta IFN) Pathway |
| 0.2 | 20.7 | PID PDGFRB PATHWAY | PDGFR-beta signaling pathway |
| 0.2 | 5.1 | PID KIT PATHWAY | Signaling events mediated by Stem cell factor receptor (c-Kit) |
| 0.1 | 3.2 | SIG CD40PATHWAYMAP | Genes related to CD40 signaling |
| 0.1 | 8.1 | PID E2F PATHWAY | E2F transcription factor network |
| 0.1 | 3.7 | PID RHOA PATHWAY | RhoA signaling pathway |
| 0.1 | 8.9 | PID P53 DOWNSTREAM PATHWAY | Direct p53 effectors |
| 0.1 | 3.4 | PID TELOMERASE PATHWAY | Regulation of Telomerase |
| 0.1 | 2.6 | PID P73PATHWAY | p73 transcription factor network |
| 0.1 | 3.1 | PID IL4 2PATHWAY | IL4-mediated signaling events |
| 0.1 | 3.4 | PID ERA GENOMIC PATHWAY | Validated nuclear estrogen receptor alpha network |
| 0.0 | 2.0 | PID MYC REPRESS PATHWAY | Validated targets of C-MYC transcriptional repression |
| 0.0 | 0.6 | PID CIRCADIAN PATHWAY | Circadian rhythm pathway |
Gene overrepresentation in curated gene sets: REACTOME pathways category:
| Log-likelihood per target | Total log-likelihood | Term | Description |
|---|---|---|---|
| 19.3 | 57.9 | REACTOME XENOBIOTICS | Genes involved in Xenobiotics |
| 4.7 | 60.8 | REACTOME PYRIMIDINE CATABOLISM | Genes involved in Pyrimidine catabolism |
| 2.5 | 27.5 | REACTOME ORGANIC CATION ANION ZWITTERION TRANSPORT | Genes involved in Organic cation/anion/zwitterion transport |
| 2.5 | 29.9 | REACTOME SYNTHESIS OF BILE ACIDS AND BILE SALTS VIA 24 HYDROXYCHOLESTEROL | Genes involved in Synthesis of bile acids and bile salts via 24-hydroxycholesterol |
| 2.5 | 47.2 | REACTOME TGF BETA RECEPTOR SIGNALING IN EMT EPITHELIAL TO MESENCHYMAL TRANSITION | Genes involved in TGF-beta receptor signaling in EMT (epithelial to mesenchymal transition) |
| 2.3 | 41.5 | REACTOME P130CAS LINKAGE TO MAPK SIGNALING FOR INTEGRINS | Genes involved in p130Cas linkage to MAPK signaling for integrins |
| 2.1 | 81.9 | REACTOME REGULATION OF BETA CELL DEVELOPMENT | Genes involved in Regulation of beta-cell development |
| 1.6 | 22.1 | REACTOME APOPTOTIC CLEAVAGE OF CELL ADHESION PROTEINS | Genes involved in Apoptotic cleavage of cell adhesion proteins |
| 1.5 | 27.4 | REACTOME ANTIGEN PRESENTATION FOLDING ASSEMBLY AND PEPTIDE LOADING OF CLASS I MHC | Genes involved in Antigen Presentation: Folding, assembly and peptide loading of class I MHC |
| 1.4 | 50.4 | REACTOME COMPLEMENT CASCADE | Genes involved in Complement cascade |
| 1.4 | 15.7 | REACTOME HORMONE LIGAND BINDING RECEPTORS | Genes involved in Hormone ligand-binding receptors |
| 1.3 | 16.3 | REACTOME VITAMIN B5 PANTOTHENATE METABOLISM | Genes involved in Vitamin B5 (pantothenate) metabolism |
| 1.0 | 14.3 | REACTOME BILE SALT AND ORGANIC ANION SLC TRANSPORTERS | Genes involved in Bile salt and organic anion SLC transporters |
| 0.9 | 19.8 | REACTOME ENDOSOMAL SORTING COMPLEX REQUIRED FOR TRANSPORT ESCRT | Genes involved in Endosomal Sorting Complex Required For Transport (ESCRT) |
| 0.8 | 19.1 | REACTOME CHOLESTEROL BIOSYNTHESIS | Genes involved in Cholesterol biosynthesis |
| 0.7 | 7.4 | REACTOME NFKB ACTIVATION THROUGH FADD RIP1 PATHWAY MEDIATED BY CASPASE 8 AND10 | Genes involved in NF-kB activation through FADD/RIP-1 pathway mediated by caspase-8 and -10 |
| 0.6 | 18.0 | REACTOME SULFUR AMINO ACID METABOLISM | Genes involved in Sulfur amino acid metabolism |
| 0.5 | 7.1 | REACTOME ROLE OF DCC IN REGULATING APOPTOSIS | Genes involved in Role of DCC in regulating apoptosis |
| 0.5 | 32.3 | REACTOME COLLAGEN FORMATION | Genes involved in Collagen formation |
| 0.5 | 11.2 | REACTOME PROLACTIN RECEPTOR SIGNALING | Genes involved in Prolactin receptor signaling |
| 0.5 | 18.3 | REACTOME SPHINGOLIPID DE NOVO BIOSYNTHESIS | Genes involved in Sphingolipid de novo biosynthesis |
| 0.5 | 9.1 | REACTOME GLUCURONIDATION | Genes involved in Glucuronidation |
| 0.4 | 5.3 | REACTOME CIRCADIAN REPRESSION OF EXPRESSION BY REV ERBA | Genes involved in Circadian Repression of Expression by REV-ERBA |
| 0.4 | 7.0 | REACTOME INFLAMMASOMES | Genes involved in Inflammasomes |
| 0.4 | 10.5 | REACTOME HS GAG BIOSYNTHESIS | Genes involved in HS-GAG biosynthesis |
| 0.3 | 9.8 | REACTOME NEGATIVE REGULATORS OF RIG I MDA5 SIGNALING | Genes involved in Negative regulators of RIG-I/MDA5 signaling |
| 0.3 | 5.7 | REACTOME SIGNALING BY PDGF | Genes involved in Signaling by PDGF |
| 0.3 | 41.3 | REACTOME FACTORS INVOLVED IN MEGAKARYOCYTE DEVELOPMENT AND PLATELET PRODUCTION | Genes involved in Factors involved in megakaryocyte development and platelet production |
| 0.3 | 16.0 | REACTOME INTERFERON ALPHA BETA SIGNALING | Genes involved in Interferon alpha/beta signaling |
| 0.3 | 3.2 | REACTOME DSCAM INTERACTIONS | Genes involved in DSCAM interactions |
| 0.3 | 7.7 | REACTOME INHIBITION OF VOLTAGE GATED CA2 CHANNELS VIA GBETA GAMMA SUBUNITS | Genes involved in Inhibition of voltage gated Ca2+ channels via Gbeta/gamma subunits |
| 0.3 | 3.8 | REACTOME FACILITATIVE NA INDEPENDENT GLUCOSE TRANSPORTERS | Genes involved in Facilitative Na+-independent glucose transporters |
| 0.3 | 5.1 | REACTOME DESTABILIZATION OF MRNA BY TRISTETRAPROLIN TTP | Genes involved in Destabilization of mRNA by Tristetraprolin (TTP) |
| 0.2 | 6.7 | REACTOME YAP1 AND WWTR1 TAZ STIMULATED GENE EXPRESSION | Genes involved in YAP1- and WWTR1 (TAZ)-stimulated gene expression |
| 0.2 | 10.8 | REACTOME ION TRANSPORT BY P TYPE ATPASES | Genes involved in Ion transport by P-type ATPases |
| 0.2 | 6.8 | REACTOME INTERFERON GAMMA SIGNALING | Genes involved in Interferon gamma signaling |
| 0.2 | 37.2 | REACTOME METABOLISM OF AMINO ACIDS AND DERIVATIVES | Genes involved in Metabolism of amino acids and derivatives |
| 0.2 | 5.6 | REACTOME SYNTHESIS OF PA | Genes involved in Synthesis of PA |
| 0.1 | 1.4 | REACTOME RAF MAP KINASE CASCADE | Genes involved in RAF/MAP kinase cascade |
| 0.1 | 2.2 | REACTOME SYNTHESIS OF GLYCOSYLPHOSPHATIDYLINOSITOL GPI | Genes involved in Synthesis of glycosylphosphatidylinositol (GPI) |
| 0.1 | 8.7 | REACTOME CLASS B 2 SECRETIN FAMILY RECEPTORS | Genes involved in Class B/2 (Secretin family receptors) |
| 0.1 | 4.3 | REACTOME DEPOSITION OF NEW CENPA CONTAINING NUCLEOSOMES AT THE CENTROMERE | Genes involved in Deposition of New CENPA-containing Nucleosomes at the Centromere |
| 0.1 | 5.7 | REACTOME GOLGI ASSOCIATED VESICLE BIOGENESIS | Genes involved in Golgi Associated Vesicle Biogenesis |
| 0.1 | 3.5 | REACTOME GLUCONEOGENESIS | Genes involved in Gluconeogenesis |
| 0.1 | 5.1 | REACTOME SIGNALING BY SCF KIT | Genes involved in Signaling by SCF-KIT |
| 0.1 | 1.2 | REACTOME SYNTHESIS OF PIPS AT THE GOLGI MEMBRANE | Genes involved in Synthesis of PIPs at the Golgi membrane |
| 0.1 | 1.1 | REACTOME SIGNALING BY HIPPO | Genes involved in Signaling by Hippo |
| 0.0 | 1.3 | REACTOME TRANSFERRIN ENDOCYTOSIS AND RECYCLING | Genes involved in Transferrin endocytosis and recycling |
| 0.0 | 1.2 | REACTOME ION CHANNEL TRANSPORT | Genes involved in Ion channel transport |
| 0.0 | 2.4 | REACTOME TRANSPORT OF INORGANIC CATIONS ANIONS AND AMINO ACIDS OLIGOPEPTIDES | Genes involved in Transport of inorganic cations/anions and amino acids/oligopeptides |
| 0.0 | 0.9 | REACTOME NUCLEAR RECEPTOR TRANSCRIPTION PATHWAY | Genes involved in Nuclear Receptor transcription pathway |
| 0.0 | 1.7 | REACTOME ANTIGEN PROCESSING UBIQUITINATION PROTEASOME DEGRADATION | Genes involved in Antigen processing: Ubiquitination & Proteasome degradation |