Project
GSE53960: rat RNA-Seq transcriptomic Bodymap
Navigation
Downloads
Results for Rfx3_Rfx1_Rfx4
Z-value: 5.86
Motif logo
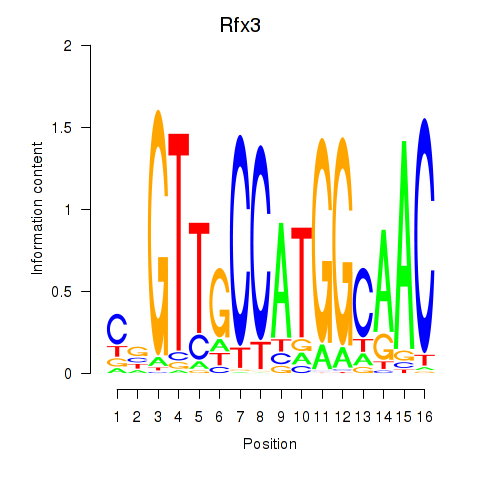
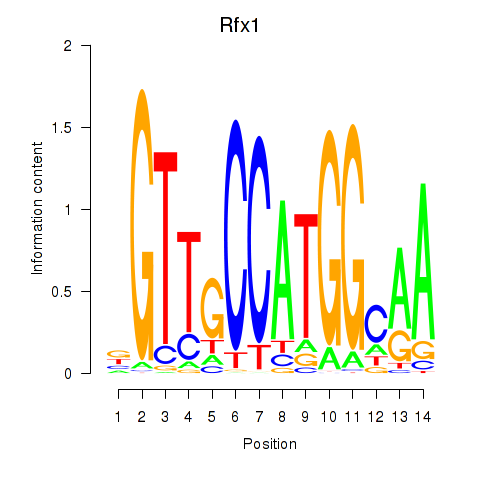
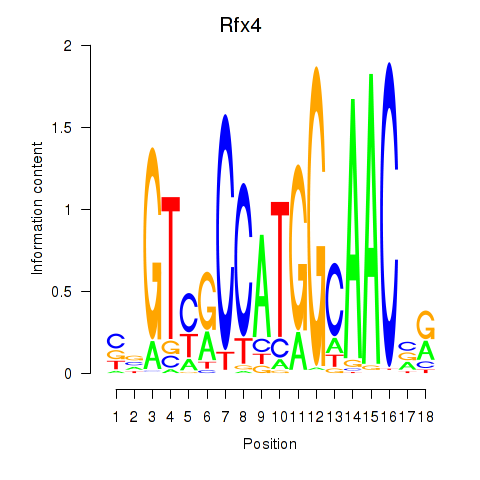
Transcription factors associated with Rfx3_Rfx1_Rfx4
| Gene Symbol | Gene ID | Gene Info |
|---|---|---|
|
Rfx3
|
ENSRNOG00000014486 | regulatory factor X3 |
|
Rfx1
|
ENSRNOG00000006049 | regulatory factor X1 |
|
Rfx4
|
ENSRNOG00000051536 | regulatory factor X4 |
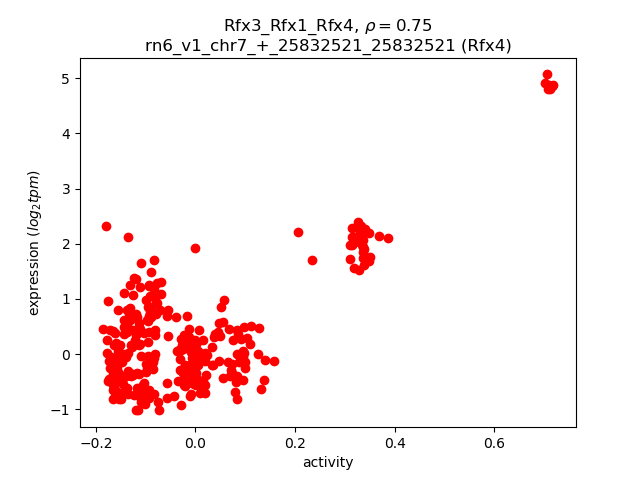
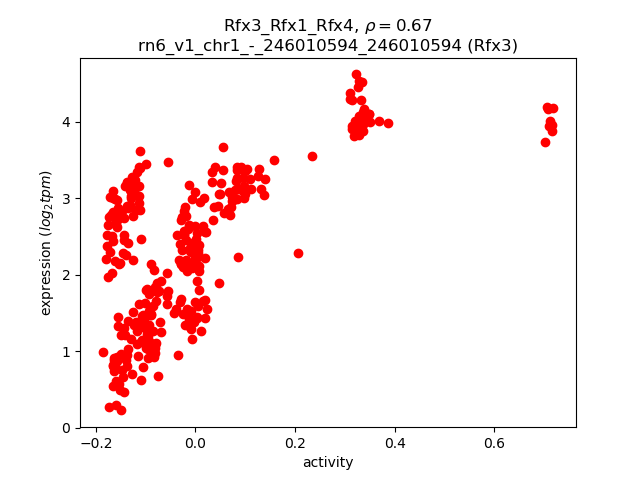
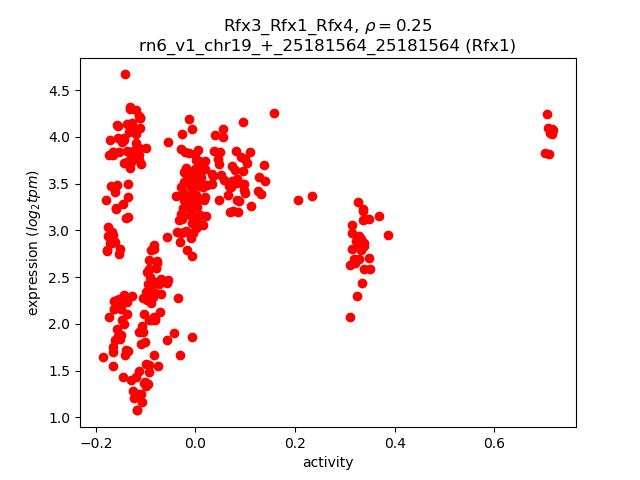
Activity-expression correlation:
| Gene | Promoter | Pearson corr. coef. | P-value | Plot |
|---|---|---|---|---|
| Rfx4 | rn6_v1_chr7_+_25832521_25832521 | 0.75 | 1.9e-58 | Click! |
| Rfx3 | rn6_v1_chr1_-_246010594_246010594 | 0.67 | 7.4e-43 | Click! |
| Rfx1 | rn6_v1_chr19_+_25181564_25181564 | 0.25 | 8.1e-06 | Click! |
Activity profile of Rfx3_Rfx1_Rfx4 motif
Sorted Z-values of Rfx3_Rfx1_Rfx4 motif
| Promoter | Log-likelihood | Transcript | Gene | Gene Info |
|---|---|---|---|---|
| chr5_-_138462864 | 333.08 |
ENSRNOT00000011325
|
Ccdc30
|
coiled-coil domain containing 30 |
| chr8_-_65587427 | 281.31 |
ENSRNOT00000016491
|
Lrrc49
|
leucine rich repeat containing 49 |
| chr7_+_139762614 | 276.46 |
ENSRNOT00000031157
|
Ccdc184
|
coiled-coil domain containing 184 |
| chr8_-_65587658 | 250.71 |
ENSRNOT00000091982
|
Lrrc49
|
leucine rich repeat containing 49 |
| chr3_+_113251778 | 242.69 |
ENSRNOT00000083005
|
Map1a
|
microtubule-associated protein 1A |
| chr20_-_44220702 | 236.11 |
ENSRNOT00000036853
|
Fam229b
|
family with sequence similarity 229, member B |
| chr20_-_14573519 | 226.60 |
ENSRNOT00000001772
|
Rab36
|
RAB36, member RAS oncogene family |
| chr16_+_2379480 | 218.40 |
ENSRNOT00000079215
|
Dnah12
|
dynein, axonemal, heavy chain 12 |
| chr19_+_56010085 | 213.81 |
ENSRNOT00000058216
|
Spata33
|
spermatogenesis associated 33 |
| chr5_+_140870140 | 212.21 |
ENSRNOT00000074347
|
Hpcal4
|
hippocalcin-like 4 |
| chr2_-_89310946 | 206.96 |
ENSRNOT00000015195
|
Ralyl
|
RALY RNA binding protein-like |
| chr2_-_195712461 | 204.28 |
ENSRNOT00000056449
|
Riiad1
|
regulatory subunit of type II PKA R-subunit (RIIa) domain containing 1 |
| chrX_-_15428518 | 202.29 |
ENSRNOT00000075774
|
LOC108348172
|
proSAAS |
| chr13_-_90710148 | 196.36 |
ENSRNOT00000010113
ENSRNOT00000080638 |
Kcnj9
|
potassium voltage-gated channel subfamily J member 9 |
| chr2_-_144467912 | 195.41 |
ENSRNOT00000040002
|
Ccna1
|
cyclin A1 |
| chr15_-_104168564 | 195.31 |
ENSRNOT00000093385
ENSRNOT00000038596 |
Dzip1
|
DAZ interacting zinc finger protein 1 |
| chr5_+_169519212 | 194.62 |
ENSRNOT00000024732
|
Chd5
|
chromodomain helicase DNA binding protein 5 |
| chr11_+_88424414 | 194.14 |
ENSRNOT00000022328
|
Spag6l
|
sperm associated antigen 6-like |
| chr1_-_266074181 | 190.23 |
ENSRNOT00000026378
|
Psd
|
pleckstrin and Sec7 domain containing |
| chr1_+_212230259 | 187.61 |
ENSRNOT00000034426
|
Kndc1
|
kinase non-catalytic C-lobe domain containing 1 |
| chr10_-_47725172 | 187.36 |
ENSRNOT00000003228
|
Rnf112
|
ring finger protein 112 |
| chr10_-_58924137 | 187.10 |
ENSRNOT00000066740
|
Tekt1
|
tektin 1 |
| chr13_+_70157522 | 181.07 |
ENSRNOT00000036906
|
Apobec4
|
apolipoprotein B mRNA editing enzyme catalytic polypeptide like 4 |
| chr1_+_78876205 | 180.08 |
ENSRNOT00000022610
|
Pnmal2
|
paraneoplastic Ma antigen family-like 2 |
| chr15_+_40665041 | 179.56 |
ENSRNOT00000018300
|
Amer2
|
APC membrane recruitment protein 2 |
| chr10_+_64174931 | 174.69 |
ENSRNOT00000035948
|
RGD1565611
|
RGD1565611 |
| chr1_-_226501920 | 173.51 |
ENSRNOT00000050716
|
Lrrc10b
|
leucine rich repeat containing 10B |
| chrX_-_15327684 | 172.40 |
ENSRNOT00000009794
|
Pcsk1n
|
proprotein convertase subtilisin/kexin type 1 inhibitor |
| chr20_+_41100071 | 171.94 |
ENSRNOT00000000658
|
Tspyl4
|
TSPY-like 4 |
| chr5_-_147148291 | 168.53 |
ENSRNOT00000085151
|
Azin2
|
antizyme inhibitor 2 |
| chr18_+_56193978 | 167.52 |
ENSRNOT00000041533
ENSRNOT00000080177 |
Camk2a
|
calcium/calmodulin-dependent protein kinase II alpha |
| chr10_-_47724499 | 163.07 |
ENSRNOT00000085011
|
Rnf112
|
ring finger protein 112 |
| chr1_+_220335254 | 162.89 |
ENSRNOT00000072261
|
Rin1
|
Ras and Rab interactor 1 |
| chr3_-_71295575 | 162.34 |
ENSRNOT00000040303
ENSRNOT00000083015 |
Zswim2
|
zinc finger, SWIM-type containing 2 |
| chr2_-_211322719 | 160.73 |
ENSRNOT00000027493
|
RGD1310209
|
similar to KIAA1324 protein |
| chr1_-_145931583 | 156.42 |
ENSRNOT00000016433
|
Cfap161
|
cilia and flagella associated protein 161 |
| chr17_-_42226377 | 155.62 |
ENSRNOT00000024536
|
RGD1307443
|
similar to mKIAA0319 protein |
| chr12_+_24803686 | 154.75 |
ENSRNOT00000033499
|
Wbscr28
|
Williams-Beuren syndrome chromosome region 28 |
| chr1_-_212549477 | 154.71 |
ENSRNOT00000024765
|
Caly
|
calcyon neuron-specific vesicular protein |
| chr16_-_21338771 | 152.61 |
ENSRNOT00000014265
|
Pbx4
|
PBX homeobox 4 |
| chr1_+_265298868 | 148.07 |
ENSRNOT00000023278
|
Dpcd
|
deleted in primary ciliary dyskinesia |
| chr1_+_188571953 | 147.45 |
ENSRNOT00000055096
|
Iqck
|
IQ motif containing K |
| chr1_+_220428481 | 144.62 |
ENSRNOT00000027335
|
LOC108348044
|
ras and Rab interactor 1 |
| chr11_+_64975594 | 144.48 |
ENSRNOT00000040773
|
Maats1
|
MYCBP associated and testis expressed 1 |
| chr8_-_13290773 | 144.46 |
ENSRNOT00000012217
|
RGD1561795
|
similar to RIKEN cDNA 1700012B09 |
| chr14_+_17531398 | 143.83 |
ENSRNOT00000050038
|
Cdkl2
|
cyclin dependent kinase like 2 |
| chr5_+_156026911 | 142.85 |
ENSRNOT00000046802
|
Rap1gap
|
Rap1 GTPase-activating protein |
| chr7_+_142397371 | 142.23 |
ENSRNOT00000040890
ENSRNOT00000065379 |
Slc4a8
|
solute carrier family 4 member 8 |
| chr13_-_105684374 | 141.66 |
ENSRNOT00000073142
|
Spata17
|
spermatogenesis associated 17 |
| chr1_-_212548730 | 141.30 |
ENSRNOT00000089729
|
Caly
|
calcyon neuron-specific vesicular protein |
| chr8_-_130475320 | 141.11 |
ENSRNOT00000075439
|
Ccdc13
|
coiled-coil domain containing 13 |
| chr12_-_22811058 | 140.10 |
ENSRNOT00000046412
|
Ift22
|
intraflagellar transport 22 |
| chr12_+_2534212 | 138.91 |
ENSRNOT00000001399
|
Ctxn1
|
cortexin 1 |
| chr8_-_25829569 | 138.87 |
ENSRNOT00000071884
|
Dpy19l2
|
dpy-19 like 2 |
| chr1_+_201337416 | 138.75 |
ENSRNOT00000067742
|
Btbd16
|
BTB domain containing 16 |
| chr12_+_17614632 | 138.49 |
ENSRNOT00000031896
|
Prkar1b
|
protein kinase cAMP-dependent type 1 regulatory subunit beta |
| chr6_+_2969333 | 138.29 |
ENSRNOT00000047356
|
Morn2
|
MORN repeat containing 2 |
| chr17_-_88095729 | 136.96 |
ENSRNOT00000025140
|
Enkur
|
enkurin, TRPC channel interacting protein |
| chr3_-_102151489 | 136.12 |
ENSRNOT00000006349
|
Ano3
|
anoctamin 3 |
| chr5_-_143062226 | 136.09 |
ENSRNOT00000029388
|
Dnali1
|
dynein, axonemal, light intermediate chain 1 |
| chr1_+_78893271 | 135.80 |
ENSRNOT00000029825
|
Pnmal1
|
paraneoplastic Ma antigen family-like 1 |
| chr9_+_88964525 | 134.61 |
ENSRNOT00000068236
|
Daw1
|
dynein assembly factor with WD repeats 1 |
| chr10_+_38919167 | 133.50 |
ENSRNOT00000077569
|
Kif3a
|
kinesin family member 3a |
| chr7_-_120744602 | 133.41 |
ENSRNOT00000018564
|
Kcnj4
|
potassium voltage-gated channel subfamily J member 4 |
| chr10_-_54512169 | 133.16 |
ENSRNOT00000005066
|
Cfap52
|
cilia and flagella associated protein 52 |
| chr10_-_103340922 | 132.75 |
ENSRNOT00000004191
|
Btbd17
|
BTB domain containing 17 |
| chr10_+_38918748 | 131.25 |
ENSRNOT00000009999
|
Kif3a
|
kinesin family member 3a |
| chr4_-_157304653 | 129.72 |
ENSRNOT00000051613
|
Lrrc23
|
leucine rich repeat containing 23 |
| chr5_-_160555083 | 128.08 |
ENSRNOT00000018953
|
Fhad1
|
forkhead associated phosphopeptide binding domain 1 |
| chr16_-_39970532 | 127.36 |
ENSRNOT00000071331
|
Spata4
|
spermatogenesis associated 4 |
| chr14_-_43584343 | 124.80 |
ENSRNOT00000039835
|
Nsun7
|
NOP2/Sun RNA methyltransferase family member 7 |
| chr8_-_55491152 | 124.71 |
ENSRNOT00000014965
|
LOC100359479
|
rCG58364-like |
| chr18_-_38088457 | 122.93 |
ENSRNOT00000077814
|
Jakmip2
|
janus kinase and microtubule interacting protein 2 |
| chr5_-_59165160 | 122.61 |
ENSRNOT00000029035
|
Fam221b
|
family with sequence similarity 221, member B |
| chr9_-_65693822 | 122.51 |
ENSRNOT00000038431
|
Als2cr12
|
amyotrophic lateral sclerosis 2 chromosome region, candidate 12 |
| chrX_+_122808605 | 120.80 |
ENSRNOT00000017567
|
Zcchc12
|
zinc finger CCHC-type containing 12 |
| chr11_-_90234286 | 120.73 |
ENSRNOT00000071986
|
Efcab1
|
EF hand calcium binding domain 1 |
| chr9_-_17114177 | 119.44 |
ENSRNOT00000061185
|
Lrrc73
|
leucine rich repeat containing 73 |
| chr1_+_196737627 | 119.38 |
ENSRNOT00000066652
|
LOC100271845
|
hypothetical protein LOC100271845 |
| chr6_-_108076186 | 118.85 |
ENSRNOT00000014814
|
Fam161b
|
family with sequence similarity 161, member B |
| chr8_+_116302513 | 118.42 |
ENSRNOT00000039258
|
Zmynd10
|
zinc finger, MYND-type containing 10 |
| chr19_-_10380809 | 117.54 |
ENSRNOT00000031064
|
Drc7
|
dynein regulatory complex subunit 7 |
| chr4_+_2053712 | 117.19 |
ENSRNOT00000045086
|
Rnf32
|
ring finger protein 32 |
| chr3_+_7279340 | 116.51 |
ENSRNOT00000017029
|
Ak8
|
adenylate kinase 8 |
| chr14_+_8080275 | 115.16 |
ENSRNOT00000065965
ENSRNOT00000092542 |
Mapk10
|
mitogen activated protein kinase 10 |
| chr9_+_27068443 | 114.54 |
ENSRNOT00000017393
|
Efhc1
|
EF-hand domain containing 1 |
| chr9_+_20241062 | 112.47 |
ENSRNOT00000071593
|
LOC100911585
|
leucine-rich repeat-containing protein 23-like |
| chr7_-_129970550 | 110.88 |
ENSRNOT00000055879
|
Mlc1
|
megalencephalic leukoencephalopathy with subcortical cysts 1 |
| chr5_+_131719922 | 109.78 |
ENSRNOT00000010524
|
Spata6
|
spermatogenesis associated 6 |
| chr5_+_144067416 | 109.52 |
ENSRNOT00000037246
|
Oscp1
|
organic solute carrier partner 1 |
| chr9_-_13311924 | 108.83 |
ENSRNOT00000015584
|
Kif6
|
kinesin family member 6 |
| chr13_+_90909486 | 108.63 |
ENSRNOT00000011450
|
Cfap45
|
cilia and flagella associated protein 45 |
| chr3_+_15379109 | 107.05 |
ENSRNOT00000036495
|
Morn5
|
MORN repeat containing 5 |
| chr4_+_114854458 | 105.91 |
ENSRNOT00000013312
|
LOC500227
|
hypothetical gene supported by BC079424 |
| chr2_-_231521052 | 105.44 |
ENSRNOT00000089534
ENSRNOT00000080470 ENSRNOT00000084756 |
Ank2
|
ankyrin 2 |
| chr6_+_7900972 | 104.41 |
ENSRNOT00000006953
ENSRNOT00000068030 |
Dync2li1
|
dynein cytoplasmic 2 light intermediate chain 1 |
| chr13_+_82574966 | 104.40 |
ENSRNOT00000003844
|
Ccdc181
|
coiled-coil domain containing 181 |
| chr7_-_54855557 | 104.38 |
ENSRNOT00000039475
|
Glipr1l1
|
GLI pathogenesis-related 1 like 1 |
| chr5_-_59149625 | 104.36 |
ENSRNOT00000040641
ENSRNOT00000084216 |
Spag8
|
sperm associated antigen 8 |
| chr1_-_220165678 | 104.06 |
ENSRNOT00000026915
|
Bbs1
|
Bardet-Biedl syndrome 1 |
| chr7_+_94375020 | 102.68 |
ENSRNOT00000011904
|
Nov
|
nephroblastoma overexpressed |
| chr12_+_14092541 | 101.03 |
ENSRNOT00000033998
|
Radil
|
Rap associating with DIL domain |
| chr10_+_54126486 | 100.67 |
ENSRNOT00000078820
|
Gas7
|
growth arrest specific 7 |
| chr6_+_2886764 | 100.56 |
ENSRNOT00000023114
|
Ttc39d
|
tetratricopeptide repeat domain 39D |
| chr8_+_90343154 | 100.14 |
ENSRNOT00000068482
|
Irak1bp1
|
interleukin-1 receptor-associated kinase 1 binding protein 1 |
| chr10_-_56154548 | 99.66 |
ENSRNOT00000090809
|
Dnah2
|
dynein, axonemal, heavy chain 2 |
| chr11_-_64421248 | 98.38 |
ENSRNOT00000066997
|
Igsf11
|
immunoglobulin superfamily, member 11 |
| chr1_-_52354175 | 98.35 |
ENSRNOT00000015010
|
MGC94891
|
hypothetical protein LOC681210 |
| chr7_-_74901997 | 97.86 |
ENSRNOT00000039378
|
Rgs22
|
regulator of G-protein signaling 22 |
| chr8_-_6235967 | 97.73 |
ENSRNOT00000068290
|
LOC654482
|
hypothetical protein LOC654482 |
| chr17_+_6701315 | 97.71 |
ENSRNOT00000026054
ENSRNOT00000080683 |
Kif27
|
kinesin family member 27 |
| chr4_+_138269142 | 97.57 |
ENSRNOT00000007788
|
Cntn4
|
contactin 4 |
| chr7_-_144837583 | 96.83 |
ENSRNOT00000055289
|
Cbx5
|
chromobox 5 |
| chr5_-_136706936 | 96.74 |
ENSRNOT00000081925
ENSRNOT00000068130 |
Ccdc24
|
coiled-coil domain containing 24 |
| chr3_+_129501105 | 96.67 |
ENSRNOT00000007893
|
Ankef1
|
ankyrin repeat and EF-hand domain containing 1 |
| chr1_-_199037267 | 95.76 |
ENSRNOT00000078779
|
Ccdc189
|
coiled-coil domain containing 189 |
| chr4_+_66090681 | 95.72 |
ENSRNOT00000078066
|
Ttc26
|
tetratricopeptide repeat domain 26 |
| chr5_-_157165767 | 94.36 |
ENSRNOT00000000167
|
Ubxn10
|
UBX domain protein 10 |
| chr12_+_7454884 | 93.04 |
ENSRNOT00000077328
|
LOC100910196
|
katanin p60 ATPase-containing subunit A-like 1-like |
| chr18_-_73360373 | 92.77 |
ENSRNOT00000048702
|
Katnal2
|
katanin catalytic subunit A1 like 2 |
| chr1_+_84070983 | 91.47 |
ENSRNOT00000090478
|
Numbl
|
NUMB-like, endocytic adaptor protein |
| chr9_+_76913639 | 91.04 |
ENSRNOT00000089203
|
AABR07068007.2
|
|
| chr8_+_55050284 | 91.03 |
ENSRNOT00000013242
|
Pih1d2
|
PIH1 domain containing 2 |
| chr10_+_37458452 | 90.47 |
ENSRNOT00000079411
|
Cdkl3
|
cyclin-dependent kinase-like 3 |
| chr14_+_8080565 | 90.46 |
ENSRNOT00000092395
|
Mapk10
|
mitogen activated protein kinase 10 |
| chr14_-_82055290 | 89.83 |
ENSRNOT00000058062
|
RGD1560394
|
RGD1560394 |
| chr20_+_4369178 | 89.50 |
ENSRNOT00000088079
|
Agpat1
|
1-acylglycerol-3-phosphate O-acyltransferase 1 |
| chr1_+_211543751 | 89.43 |
ENSRNOT00000049631
|
Lrrc27
|
leucine rich repeat containing 27 |
| chr10_+_55653946 | 88.22 |
ENSRNOT00000008787
|
Tmem107
|
transmembrane protein 107 |
| chr4_+_62299044 | 86.65 |
ENSRNOT00000032077
|
Agbl3
|
ATP/GTP binding protein-like 3 |
| chr4_-_135069970 | 84.96 |
ENSRNOT00000008221
|
Cntn3
|
contactin 3 |
| chr1_-_247088012 | 84.56 |
ENSRNOT00000020464
|
Spata6l
|
spermatogenesis associated 6-like |
| chr14_-_113644779 | 82.73 |
ENSRNOT00000005306
|
Cfap36
|
cilia and flagella associated protein 36 |
| chrX_+_105134498 | 82.66 |
ENSRNOT00000002058
|
Tmem35
|
transmembrane protein 35 |
| chr6_-_107633012 | 82.63 |
ENSRNOT00000014018
|
Pnma1
|
paraneoplastic Ma antigen 1 |
| chr8_-_5429581 | 82.58 |
ENSRNOT00000044174
|
Dync2h1
|
dynein cytoplasmic 2 heavy chain 1 |
| chr20_-_14620019 | 82.36 |
ENSRNOT00000001779
|
Gnaz
|
G protein subunit alpha z |
| chr3_-_62803373 | 81.99 |
ENSRNOT00000013565
|
Ttc30a1
|
tetratricopeptide repeat domain 30A1 |
| chr2_-_208623314 | 81.69 |
ENSRNOT00000022731
|
Pifo
|
primary cilia formation |
| chr12_+_16030788 | 81.45 |
ENSRNOT00000051565
|
Iqce
|
IQ motif containing E |
| chr7_+_12433933 | 80.93 |
ENSRNOT00000060690
|
Cbarp
|
CACN beta subunit associated regulatory protein |
| chrX_-_16306078 | 80.93 |
ENSRNOT00000003939
|
Akap4
|
A-kinase anchoring protein 4 |
| chr19_-_10653800 | 79.11 |
ENSRNOT00000022128
|
Cx3cl1
|
C-X3-C motif chemokine ligand 1 |
| chr1_+_203971152 | 78.93 |
ENSRNOT00000075540
|
Gpr26
|
G protein-coupled receptor 26 |
| chr8_-_14156656 | 78.84 |
ENSRNOT00000089364
|
Deup1
|
deuterosome assembly protein 1 |
| chr5_+_61474000 | 78.49 |
ENSRNOT00000013930
|
Ccdc180
|
coiled-coil domain containing 180 |
| chr4_+_147756553 | 77.94 |
ENSRNOT00000086549
ENSRNOT00000014733 |
Ift122
|
intraflagellar transport 122 |
| chr12_+_47551935 | 77.92 |
ENSRNOT00000056932
|
RGD1560398
|
RGD1560398 |
| chr7_-_120380200 | 77.85 |
ENSRNOT00000014878
|
RGD1359634
|
similar to RIKEN cDNA 1700088E04 |
| chr11_-_71601662 | 77.08 |
ENSRNOT00000002397
|
Tctex1d2
|
Tctex1 domain containing 2 |
| chr8_-_61519507 | 76.63 |
ENSRNOT00000038347
|
Odf3l1
|
outer dense fiber of sperm tails 3-like 1 |
| chr19_+_52225582 | 76.38 |
ENSRNOT00000020917
|
Dnaaf1
|
dynein, axonemal, assembly factor 1 |
| chr3_+_176721827 | 75.93 |
ENSRNOT00000066617
|
Fndc11
|
fibronectin type III domain containing 11 |
| chr1_+_205842489 | 75.72 |
ENSRNOT00000081610
|
Fank1
|
fibronectin type 3 and ankyrin repeat domains 1 |
| chr8_-_14157141 | 74.22 |
ENSRNOT00000079034
|
Deup1
|
deuterosome assembly protein 1 |
| chr4_+_86275717 | 73.81 |
ENSRNOT00000016414
|
Ppp1r17
|
protein phosphatase 1, regulatory subunit 17 |
| chr5_-_122642202 | 73.77 |
ENSRNOT00000046691
|
Wdr78
|
WD repeat domain 78 |
| chr8_+_127789048 | 73.52 |
ENSRNOT00000052275
|
Dlec1
|
deleted in lung and esophageal cancer 1 |
| chr8_-_59077690 | 73.16 |
ENSRNOT00000066197
|
Dmxl2
|
Dmx-like 2 |
| chr4_+_159403501 | 73.08 |
ENSRNOT00000086525
|
Akap3
|
A-kinase anchoring protein 3 |
| chr5_-_110706656 | 72.98 |
ENSRNOT00000033781
|
Izumo3
|
IZUMO family member 3 |
| chr8_-_68525911 | 72.76 |
ENSRNOT00000080588
ENSRNOT00000011109 |
Iqch
|
IQ motif containing H |
| chr11_-_31238026 | 72.70 |
ENSRNOT00000032366
|
RGD1562726
|
similar to Putative protein C21orf62 homolog |
| chr2_+_228544418 | 72.00 |
ENSRNOT00000013030
|
Tram1l1
|
translocation associated membrane protein 1-like 1 |
| chr8_-_23014499 | 71.78 |
ENSRNOT00000017820
|
Ccdc151
|
coiled-coil domain containing 151 |
| chr1_-_48825364 | 70.69 |
ENSRNOT00000024213
|
Agpat4
|
1-acylglycerol-3-phosphate O-acyltransferase 4 |
| chr10_-_74679858 | 70.18 |
ENSRNOT00000003859
|
Ppm1e
|
protein phosphatase, Mg2+/Mn2+ dependent, 1E |
| chr7_+_119647375 | 69.58 |
ENSRNOT00000046563
|
Kctd17
|
potassium channel tetramerization domain containing 17 |
| chr3_+_151335292 | 69.31 |
ENSRNOT00000073642
|
Mmp24
|
matrix metallopeptidase 24 |
| chr11_+_42858478 | 69.09 |
ENSRNOT00000002293
|
Arl6
|
ADP-ribosylation factor like GTPase 6 |
| chr12_-_6703979 | 69.01 |
ENSRNOT00000061246
|
Tex26
|
testis expressed 26 |
| chr3_-_45210474 | 68.81 |
ENSRNOT00000091777
|
Ccdc148
|
coiled-coil domain containing 148 |
| chr9_+_81644355 | 68.58 |
ENSRNOT00000071700
|
Catip
|
ciliogenesis associated TTC17 interacting protein |
| chr19_-_44158621 | 68.32 |
ENSRNOT00000031243
ENSRNOT00000088297 |
Tmem231
|
transmembrane protein 231 |
| chr14_-_84393421 | 67.94 |
ENSRNOT00000006911
|
Ccdc157
|
coiled-coil domain containing 157 |
| chr7_+_13013541 | 67.09 |
ENSRNOT00000042792
ENSRNOT00000010549 |
Theg
|
theg spermatid protein |
| chr20_+_4369394 | 66.67 |
ENSRNOT00000088734
ENSRNOT00000091491 |
Agpat1
|
1-acylglycerol-3-phosphate O-acyltransferase 1 |
| chr16_-_55132191 | 66.66 |
ENSRNOT00000017025
|
Micu3
|
mitochondrial calcium uptake family, member 3 |
| chr2_-_60538088 | 66.41 |
ENSRNOT00000086809
|
Ttc23l
|
tetratricopeptide repeat domain 23-like |
| chr10_-_57671080 | 65.58 |
ENSRNOT00000082511
|
LOC691995
|
hypothetical protein LOC691995 |
| chr1_-_220786615 | 65.28 |
ENSRNOT00000038198
|
Tsga10ip
|
testis specific 10 interacting protein |
| chr5_+_157165341 | 65.18 |
ENSRNOT00000087072
|
Pla2g2c
|
phospholipase A2, group IIC |
| chr15_+_18399515 | 64.19 |
ENSRNOT00000071273
|
Fam107a
|
family with sequence similarity 107, member A |
| chr5_-_12563429 | 64.05 |
ENSRNOT00000059625
|
St18
|
suppression of tumorigenicity 18 |
| chr2_+_211381036 | 63.87 |
ENSRNOT00000055862
|
Wdr47
|
WD repeat domain 47 |
| chr7_-_144837395 | 63.83 |
ENSRNOT00000089024
|
Cbx5
|
chromobox 5 |
| chr6_-_135259603 | 63.77 |
ENSRNOT00000010529
|
Mok
|
MOK protein kinase |
| chr19_-_9931930 | 63.77 |
ENSRNOT00000085144
|
Ccdc113
|
coiled-coil domain containing 113 |
| chr4_-_113988246 | 63.73 |
ENSRNOT00000013128
|
LOC103692166
|
WD repeat-containing protein 54 |
| chr1_+_266952561 | 63.33 |
ENSRNOT00000076452
|
Neurl1
|
neuralized E3 ubiquitin protein ligase 1 |
| chr16_+_80729400 | 63.04 |
ENSRNOT00000036383
|
Tdrp
|
testis development related protein |
| chr3_-_7632345 | 62.69 |
ENSRNOT00000049889
|
Cfap77
|
cilia and flagella associated protein 77 |
| chr4_+_172709724 | 62.69 |
ENSRNOT00000010707
|
Igbp1b
|
immunoglobulin (CD79A) binding protein 1b |
| chr3_+_148438939 | 61.57 |
ENSRNOT00000064196
|
Ttll9
|
tubulin tyrosine ligase like 9 |
| chr18_-_14016713 | 61.36 |
ENSRNOT00000041125
|
Nol4
|
nucleolar protein 4 |
| chr6_-_27024129 | 60.76 |
ENSRNOT00000012273
|
Dpysl5
|
dihydropyrimidinase-like 5 |
| chr5_+_153845094 | 60.55 |
ENSRNOT00000041600
|
Stpg1
|
sperm-tail PG-rich repeat containing 1 |
| chr17_+_24242642 | 60.49 |
ENSRNOT00000024323
|
Rnf182
|
ring finger protein 182 |
| chr6_-_27460038 | 60.48 |
ENSRNOT00000036815
|
Drc1
|
dynein regulatory complex subunit 1 |
| chr6_-_8346197 | 60.35 |
ENSRNOT00000061826
|
Prepl
|
prolyl endopeptidase-like |
Network of associatons between targets according to the STRING database.

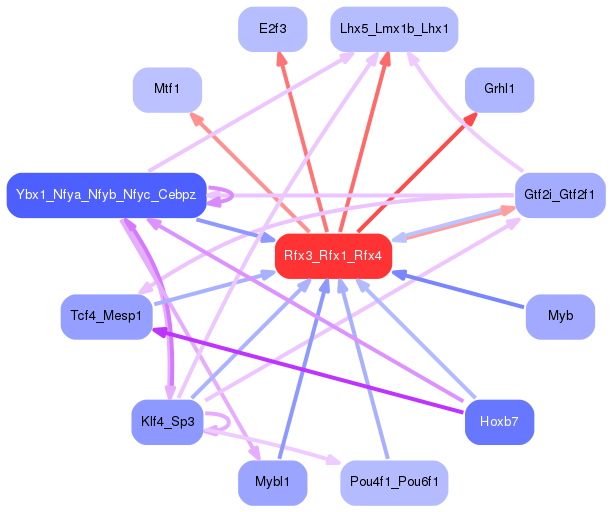
First level regulatory network of Rfx3_Rfx1_Rfx4
Gene Ontology Analysis
Gene overrepresentation in biological process category:
| Log-likelihood per target | Total log-likelihood | Term | Description |
|---|---|---|---|
| 88.3 | 264.8 | GO:2000771 | epidermal stem cell homeostasis(GO:0036334) regulation of establishment or maintenance of cell polarity regulating cell shape(GO:2000769) positive regulation of establishment or maintenance of cell polarity regulating cell shape(GO:2000771) |
| 58.2 | 174.7 | GO:0016598 | protein arginylation(GO:0016598) |
| 56.2 | 168.5 | GO:1902269 | positive regulation of polyamine transmembrane transport(GO:1902269) |
| 49.4 | 148.1 | GO:0021678 | third ventricle development(GO:0021678) |
| 47.6 | 142.9 | GO:1990792 | response to glial cell derived neurotrophic factor(GO:1990790) cellular response to glial cell derived neurotrophic factor(GO:1990792) |
| 41.5 | 207.4 | GO:1903251 | multi-ciliated epithelial cell differentiation(GO:1903251) |
| 34.7 | 104.1 | GO:0008594 | photoreceptor cell morphogenesis(GO:0008594) |
| 34.2 | 102.7 | GO:0060392 | negative regulation of SMAD protein import into nucleus(GO:0060392) negative regulation of sensory perception of pain(GO:1904057) |
| 33.5 | 167.5 | GO:0099628 | receptor diffusion trapping(GO:0098953) postsynaptic neurotransmitter receptor diffusion trapping(GO:0098970) NMDA selective glutamate receptor signaling pathway(GO:0098989) neurotransmitter receptor diffusion trapping(GO:0099628) |
| 32.4 | 194.6 | GO:0035093 | spermatogenesis, exchange of chromosomal proteins(GO:0035093) |
| 31.7 | 190.2 | GO:0006863 | purine nucleobase transport(GO:0006863) nucleobase transport(GO:0015851) |
| 30.5 | 91.5 | GO:0021849 | neuroblast division in subventricular zone(GO:0021849) |
| 28.1 | 112.5 | GO:0018406 | protein C-linked glycosylation(GO:0018103) peptidyl-tryptophan modification(GO:0018211) protein C-linked glycosylation via tryptophan(GO:0018317) protein C-linked glycosylation via 2'-alpha-mannosyl-L-tryptophan(GO:0018406) |
| 26.4 | 105.4 | GO:0036309 | protein localization to M-band(GO:0036309) protein localization to T-tubule(GO:0036371) |
| 25.6 | 358.9 | GO:0060294 | cilium movement involved in cell motility(GO:0060294) |
| 25.0 | 124.8 | GO:0030382 | sperm mitochondrion organization(GO:0030382) |
| 24.2 | 120.8 | GO:2000327 | positive regulation of ligand-dependent nuclear receptor transcription coactivator activity(GO:2000327) |
| 23.5 | 328.4 | GO:0007288 | sperm axoneme assembly(GO:0007288) |
| 23.3 | 581.4 | GO:0044458 | motile cilium assembly(GO:0044458) |
| 22.7 | 136.1 | GO:0061591 | calcium activated phospholipid scrambling(GO:0061588) calcium activated phosphatidylcholine scrambling(GO:0061590) calcium activated galactosylceramide scrambling(GO:0061591) |
| 19.5 | 77.9 | GO:0035720 | intraciliary anterograde transport(GO:0035720) ciliary receptor clustering involved in smoothened signaling pathway(GO:0060830) |
| 19.3 | 57.8 | GO:0032423 | regulation of mismatch repair(GO:0032423) |
| 18.9 | 113.5 | GO:1904491 | protein localization to ciliary transition zone(GO:1904491) |
| 18.7 | 205.6 | GO:0007258 | JUN phosphorylation(GO:0007258) |
| 18.3 | 54.8 | GO:1904457 | positive regulation of neuronal action potential(GO:1904457) |
| 16.7 | 333.6 | GO:0048268 | clathrin coat assembly(GO:0048268) |
| 16.5 | 82.6 | GO:0035721 | intraciliary retrograde transport(GO:0035721) |
| 16.3 | 390.4 | GO:0042073 | intraciliary transport(GO:0042073) |
| 16.1 | 32.1 | GO:0060300 | regulation of cytokine activity(GO:0060300) |
| 16.0 | 176.0 | GO:0031914 | negative regulation of synaptic plasticity(GO:0031914) |
| 15.7 | 47.0 | GO:0006532 | aspartate biosynthetic process(GO:0006532) |
| 15.1 | 45.4 | GO:0070649 | formin-nucleated actin cable assembly(GO:0070649) |
| 15.1 | 45.3 | GO:0000821 | regulation of arginine metabolic process(GO:0000821) negative regulation of cellular amino acid metabolic process(GO:0045763) |
| 14.3 | 185.8 | GO:0051013 | microtubule severing(GO:0051013) |
| 14.1 | 42.3 | GO:0042357 | thiamine diphosphate metabolic process(GO:0042357) |
| 13.9 | 55.6 | GO:0036353 | histone H2A-K119 monoubiquitination(GO:0036353) |
| 13.4 | 187.6 | GO:0021707 | cerebellar granular layer formation(GO:0021684) cerebellar granule cell differentiation(GO:0021707) |
| 13.4 | 160.7 | GO:2000786 | positive regulation of autophagosome assembly(GO:2000786) |
| 13.2 | 39.7 | GO:1903445 | protein transport from ciliary membrane to plasma membrane(GO:1903445) |
| 13.2 | 79.1 | GO:0032914 | positive regulation of transforming growth factor beta1 production(GO:0032914) |
| 13.0 | 156.2 | GO:0006654 | phosphatidic acid biosynthetic process(GO:0006654) |
| 12.9 | 154.3 | GO:2000480 | negative regulation of cAMP-dependent protein kinase activity(GO:2000480) |
| 12.6 | 50.5 | GO:0034316 | negative regulation of Arp2/3 complex-mediated actin nucleation(GO:0034316) |
| 12.4 | 86.6 | GO:0035610 | protein side chain deglutamylation(GO:0035610) |
| 12.3 | 24.6 | GO:0003356 | regulation of cilium movement(GO:0003352) regulation of cilium beat frequency(GO:0003356) |
| 12.2 | 24.5 | GO:1900126 | negative regulation of hyaluronan biosynthetic process(GO:1900126) |
| 12.1 | 60.5 | GO:0060285 | cilium or flagellum-dependent cell motility(GO:0001539) cilium-dependent cell motility(GO:0060285) |
| 10.9 | 97.7 | GO:0003351 | epithelial cilium movement(GO:0003351) |
| 10.0 | 30.0 | GO:0021508 | floor plate formation(GO:0021508) |
| 10.0 | 329.8 | GO:0010107 | potassium ion import(GO:0010107) |
| 9.8 | 117.8 | GO:0047484 | regulation of response to osmotic stress(GO:0047484) |
| 9.1 | 81.8 | GO:0098700 | neurotransmitter loading into synaptic vesicle(GO:0098700) |
| 8.3 | 58.3 | GO:0061002 | negative regulation of dendritic spine morphogenesis(GO:0061002) |
| 8.2 | 40.8 | GO:0035082 | axoneme assembly(GO:0035082) |
| 8.1 | 24.3 | GO:1903348 | positive regulation of bicellular tight junction assembly(GO:1903348) |
| 8.0 | 55.7 | GO:0000459 | exonucleolytic trimming involved in rRNA processing(GO:0000459) exonucleolytic trimming to generate mature 3'-end of 5.8S rRNA from tricistronic rRNA transcript (SSU-rRNA, 5.8S rRNA, LSU-rRNA)(GO:0000467) |
| 7.9 | 23.6 | GO:0048003 | antigen processing and presentation of lipid antigen via MHC class Ib(GO:0048003) antigen processing and presentation, exogenous lipid antigen via MHC class Ib(GO:0048007) |
| 7.9 | 70.7 | GO:0016024 | CDP-diacylglycerol biosynthetic process(GO:0016024) |
| 7.8 | 47.0 | GO:1900425 | negative regulation of defense response to bacterium(GO:1900425) |
| 7.6 | 68.6 | GO:0044782 | cilium organization(GO:0044782) |
| 7.5 | 113.0 | GO:0035970 | peptidyl-threonine dephosphorylation(GO:0035970) |
| 7.5 | 59.7 | GO:0007220 | Notch receptor processing(GO:0007220) |
| 7.4 | 163.3 | GO:1902043 | positive regulation of extrinsic apoptotic signaling pathway via death domain receptors(GO:1902043) |
| 7.2 | 71.8 | GO:0036158 | outer dynein arm assembly(GO:0036158) |
| 7.2 | 50.1 | GO:0010968 | regulation of microtubule nucleation(GO:0010968) |
| 7.1 | 57.0 | GO:0051388 | positive regulation of neurotrophin TRK receptor signaling pathway(GO:0051388) |
| 7.1 | 148.9 | GO:0021591 | ventricular system development(GO:0021591) |
| 6.6 | 26.5 | GO:0019918 | peptidyl-arginine methylation, to symmetrical-dimethyl arginine(GO:0019918) |
| 6.6 | 19.9 | GO:0034499 | late endosome to Golgi transport(GO:0034499) |
| 6.6 | 26.3 | GO:0061641 | CENP-A containing nucleosome assembly(GO:0034080) CENP-A containing chromatin organization(GO:0061641) |
| 6.3 | 37.9 | GO:0060528 | secretory columnal luminar epithelial cell differentiation involved in prostate glandular acinus development(GO:0060528) |
| 6.1 | 18.2 | GO:0035845 | photoreceptor cell outer segment organization(GO:0035845) |
| 6.0 | 29.9 | GO:0048549 | positive regulation of pinocytosis(GO:0048549) |
| 5.9 | 254.0 | GO:0045494 | photoreceptor cell maintenance(GO:0045494) |
| 5.9 | 17.6 | GO:0046340 | diacylglycerol catabolic process(GO:0046340) retrograde trans-synaptic signaling(GO:0098917) |
| 5.7 | 40.2 | GO:0003341 | cilium movement(GO:0003341) |
| 5.7 | 51.4 | GO:0098915 | membrane repolarization during ventricular cardiac muscle cell action potential(GO:0098915) |
| 5.4 | 265.2 | GO:0071158 | positive regulation of cell cycle arrest(GO:0071158) |
| 5.4 | 21.5 | GO:1903818 | positive regulation of voltage-gated potassium channel activity(GO:1903818) |
| 5.4 | 53.6 | GO:0010248 | establishment or maintenance of transmembrane electrochemical gradient(GO:0010248) |
| 5.3 | 69.3 | GO:0044331 | cell-cell adhesion mediated by cadherin(GO:0044331) |
| 5.3 | 37.1 | GO:0031087 | deadenylation-independent decapping of nuclear-transcribed mRNA(GO:0031087) |
| 5.3 | 21.2 | GO:0097167 | circadian regulation of translation(GO:0097167) |
| 5.2 | 20.6 | GO:0030581 | intracellular transport of viral protein in host cell(GO:0019060) symbiont intracellular protein transport in host(GO:0030581) intracellular protein transport in other organism involved in symbiotic interaction(GO:0051708) |
| 5.2 | 31.0 | GO:0021937 | cerebellar Purkinje cell-granule cell precursor cell signaling involved in regulation of granule cell precursor cell proliferation(GO:0021937) |
| 5.1 | 41.1 | GO:2000051 | negative regulation of non-canonical Wnt signaling pathway(GO:2000051) |
| 5.0 | 94.3 | GO:0007035 | vacuolar acidification(GO:0007035) |
| 4.8 | 38.8 | GO:0097211 | response to gonadotropin-releasing hormone(GO:0097210) cellular response to gonadotropin-releasing hormone(GO:0097211) |
| 4.8 | 80.9 | GO:1901386 | negative regulation of voltage-gated calcium channel activity(GO:1901386) |
| 4.7 | 28.5 | GO:0090154 | positive regulation of sphingolipid biosynthetic process(GO:0090154) positive regulation of ceramide biosynthetic process(GO:2000304) |
| 4.7 | 884.2 | GO:0060271 | cilium morphogenesis(GO:0060271) |
| 4.7 | 155.6 | GO:2000171 | negative regulation of dendrite development(GO:2000171) |
| 4.7 | 14.0 | GO:1903070 | negative regulation of ER-associated ubiquitin-dependent protein catabolic process(GO:1903070) |
| 4.5 | 117.0 | GO:0010738 | regulation of protein kinase A signaling(GO:0010738) |
| 4.4 | 22.1 | GO:0007197 | adenylate cyclase-inhibiting G-protein coupled acetylcholine receptor signaling pathway(GO:0007197) phospholipase C-activating G-protein coupled acetylcholine receptor signaling pathway(GO:0007207) |
| 4.4 | 13.1 | GO:0046103 | inosine biosynthetic process(GO:0046103) |
| 4.4 | 30.5 | GO:0035740 | CD8-positive, alpha-beta T cell proliferation(GO:0035740) |
| 4.2 | 142.2 | GO:0015701 | bicarbonate transport(GO:0015701) |
| 4.1 | 41.3 | GO:0002934 | desmosome organization(GO:0002934) |
| 3.8 | 119.2 | GO:0050482 | arachidonic acid secretion(GO:0050482) arachidonate transport(GO:1903963) |
| 3.8 | 133.1 | GO:0007339 | binding of sperm to zona pellucida(GO:0007339) |
| 3.4 | 13.7 | GO:0009212 | dTTP biosynthetic process(GO:0006235) pyrimidine deoxyribonucleoside triphosphate biosynthetic process(GO:0009212) |
| 3.4 | 27.4 | GO:0034551 | respiratory chain complex III assembly(GO:0017062) mitochondrial respiratory chain complex III assembly(GO:0034551) pyrimidine-containing compound transmembrane transport(GO:0072531) |
| 3.4 | 332.3 | GO:1903955 | positive regulation of establishment of protein localization to mitochondrion(GO:1903749) positive regulation of protein targeting to mitochondrion(GO:1903955) |
| 3.4 | 13.5 | GO:0006420 | arginyl-tRNA aminoacylation(GO:0006420) |
| 3.2 | 9.7 | GO:0052572 | response to immune response of other organism involved in symbiotic interaction(GO:0052564) response to host immune response(GO:0052572) |
| 3.2 | 6.4 | GO:1902953 | positive regulation of ER to Golgi vesicle-mediated transport(GO:1902953) |
| 3.1 | 37.7 | GO:0001302 | replicative cell aging(GO:0001302) |
| 3.1 | 18.7 | GO:0030913 | paranodal junction assembly(GO:0030913) |
| 3.1 | 9.3 | GO:0034983 | peptidyl-lysine deacetylation(GO:0034983) |
| 3.1 | 27.5 | GO:0070345 | negative regulation of fat cell proliferation(GO:0070345) |
| 3.0 | 124.7 | GO:0048741 | skeletal muscle fiber development(GO:0048741) |
| 3.0 | 33.1 | GO:1904322 | response to forskolin(GO:1904321) cellular response to forskolin(GO:1904322) |
| 2.8 | 90.5 | GO:0030517 | negative regulation of axon extension(GO:0030517) |
| 2.8 | 22.1 | GO:0003406 | retinal pigment epithelium development(GO:0003406) |
| 2.7 | 10.8 | GO:0060279 | positive regulation of ovulation(GO:0060279) |
| 2.7 | 8.1 | GO:0045575 | basophil activation(GO:0045575) |
| 2.7 | 13.4 | GO:0060903 | positive regulation of meiosis I(GO:0060903) |
| 2.6 | 7.8 | GO:0006478 | peptidyl-tyrosine sulfation(GO:0006478) |
| 2.6 | 82.9 | GO:0030866 | cortical actin cytoskeleton organization(GO:0030866) |
| 2.5 | 5.0 | GO:0033092 | positive regulation of immature T cell proliferation in thymus(GO:0033092) |
| 2.5 | 27.1 | GO:0097120 | receptor localization to synapse(GO:0097120) |
| 2.5 | 22.2 | GO:0021942 | radial glia guided migration of Purkinje cell(GO:0021942) |
| 2.4 | 24.4 | GO:0046085 | adenosine metabolic process(GO:0046085) |
| 2.4 | 107.3 | GO:0031122 | cytoplasmic microtubule organization(GO:0031122) |
| 2.4 | 17.0 | GO:0006868 | glutamine transport(GO:0006868) |
| 2.4 | 12.0 | GO:1904781 | positive regulation of protein localization to centrosome(GO:1904781) |
| 2.4 | 62.2 | GO:0071625 | vocalization behavior(GO:0071625) |
| 2.3 | 69.6 | GO:0001578 | microtubule bundle formation(GO:0001578) |
| 2.3 | 36.9 | GO:1901663 | ubiquinone biosynthetic process(GO:0006744) quinone biosynthetic process(GO:1901663) |
| 2.3 | 11.3 | GO:0051036 | regulation of endosome size(GO:0051036) |
| 2.2 | 26.7 | GO:1900017 | positive regulation of cytokine production involved in inflammatory response(GO:1900017) |
| 2.1 | 12.9 | GO:0072675 | osteoclast fusion(GO:0072675) |
| 2.1 | 6.4 | GO:0090071 | negative regulation of ribosome biogenesis(GO:0090071) |
| 2.1 | 99.9 | GO:0021795 | cerebral cortex cell migration(GO:0021795) |
| 2.1 | 6.4 | GO:1901856 | negative regulation of cellular respiration(GO:1901856) |
| 2.1 | 179.6 | GO:0090090 | negative regulation of canonical Wnt signaling pathway(GO:0090090) |
| 2.1 | 14.8 | GO:0046599 | regulation of centriole replication(GO:0046599) |
| 2.1 | 312.4 | GO:0007018 | microtubule-based movement(GO:0007018) |
| 2.1 | 10.6 | GO:0060689 | cell differentiation involved in salivary gland development(GO:0060689) |
| 2.1 | 6.3 | GO:0070212 | protein poly-ADP-ribosylation(GO:0070212) regulation of telomeric DNA binding(GO:1904742) |
| 2.1 | 27.3 | GO:0006707 | cholesterol catabolic process(GO:0006707) sterol catabolic process(GO:0016127) |
| 2.0 | 17.6 | GO:1900364 | negative regulation of mRNA polyadenylation(GO:1900364) |
| 1.9 | 5.8 | GO:0048669 | collateral sprouting in absence of injury(GO:0048669) |
| 1.9 | 17.3 | GO:0070995 | NADPH oxidation(GO:0070995) |
| 1.9 | 134.6 | GO:0007368 | determination of left/right symmetry(GO:0007368) |
| 1.8 | 12.8 | GO:0071318 | cellular response to ATP(GO:0071318) |
| 1.8 | 172.4 | GO:0007218 | neuropeptide signaling pathway(GO:0007218) |
| 1.8 | 19.9 | GO:0071578 | zinc II ion transmembrane import(GO:0071578) |
| 1.8 | 48.0 | GO:0090307 | mitotic spindle assembly(GO:0090307) microtubule cytoskeleton organization involved in mitosis(GO:1902850) |
| 1.8 | 7.1 | GO:0071494 | cellular response to UV-C(GO:0071494) |
| 1.8 | 10.5 | GO:0034427 | nuclear-transcribed mRNA catabolic process, exonucleolytic, 3'-5'(GO:0034427) |
| 1.8 | 17.5 | GO:0043162 | ubiquitin-dependent protein catabolic process via the multivesicular body sorting pathway(GO:0043162) |
| 1.8 | 82.4 | GO:0007193 | adenylate cyclase-inhibiting G-protein coupled receptor signaling pathway(GO:0007193) |
| 1.7 | 173.1 | GO:0006334 | nucleosome assembly(GO:0006334) |
| 1.7 | 16.6 | GO:0070862 | negative regulation of protein exit from endoplasmic reticulum(GO:0070862) negative regulation of retrograde protein transport, ER to cytosol(GO:1904153) |
| 1.6 | 23.1 | GO:0071481 | cellular response to X-ray(GO:0071481) |
| 1.6 | 17.1 | GO:1903543 | positive regulation of exosomal secretion(GO:1903543) |
| 1.5 | 24.7 | GO:1904355 | positive regulation of telomere capping(GO:1904355) |
| 1.4 | 4.3 | GO:0070343 | RNA repair(GO:0042245) white fat cell proliferation(GO:0070343) regulation of white fat cell proliferation(GO:0070350) |
| 1.4 | 22.3 | GO:0050884 | neuromuscular process controlling posture(GO:0050884) |
| 1.4 | 76.5 | GO:0002437 | inflammatory response to antigenic stimulus(GO:0002437) |
| 1.4 | 30.5 | GO:0032012 | regulation of ARF protein signal transduction(GO:0032012) |
| 1.4 | 11.0 | GO:1902260 | negative regulation of delayed rectifier potassium channel activity(GO:1902260) negative regulation of voltage-gated potassium channel activity(GO:1903817) |
| 1.3 | 22.9 | GO:0032515 | negative regulation of phosphoprotein phosphatase activity(GO:0032515) |
| 1.3 | 2.7 | GO:0099545 | trans-synaptic signaling by trans-synaptic complex(GO:0099545) |
| 1.3 | 11.9 | GO:0061302 | smooth muscle cell-matrix adhesion(GO:0061302) |
| 1.3 | 5.3 | GO:0006369 | termination of RNA polymerase II transcription(GO:0006369) |
| 1.3 | 48.5 | GO:0046839 | phospholipid dephosphorylation(GO:0046839) |
| 1.3 | 3.9 | GO:0006267 | pre-replicative complex assembly involved in nuclear cell cycle DNA replication(GO:0006267) pre-replicative complex assembly(GO:0036388) pre-replicative complex assembly involved in cell cycle DNA replication(GO:1902299) |
| 1.3 | 10.4 | GO:0051533 | positive regulation of NFAT protein import into nucleus(GO:0051533) |
| 1.3 | 27.3 | GO:0007095 | mitotic G2 DNA damage checkpoint(GO:0007095) G2 DNA damage checkpoint(GO:0031572) |
| 1.3 | 40.9 | GO:0009395 | phospholipid catabolic process(GO:0009395) |
| 1.3 | 8.8 | GO:0032927 | positive regulation of activin receptor signaling pathway(GO:0032927) |
| 1.3 | 15.0 | GO:0045648 | positive regulation of erythrocyte differentiation(GO:0045648) |
| 1.2 | 56.1 | GO:0007131 | reciprocal meiotic recombination(GO:0007131) reciprocal DNA recombination(GO:0035825) |
| 1.2 | 55.4 | GO:2000649 | regulation of sodium ion transmembrane transporter activity(GO:2000649) |
| 1.2 | 6.0 | GO:0045719 | negative regulation of glycogen biosynthetic process(GO:0045719) |
| 1.2 | 4.8 | GO:0070317 | negative regulation of G0 to G1 transition(GO:0070317) |
| 1.2 | 8.2 | GO:0045048 | protein insertion into ER membrane(GO:0045048) |
| 1.1 | 3.4 | GO:0045041 | protein import into mitochondrial intermembrane space(GO:0045041) |
| 1.0 | 14.3 | GO:0048672 | positive regulation of collateral sprouting(GO:0048672) |
| 1.0 | 67.4 | GO:0032092 | positive regulation of protein binding(GO:0032092) |
| 1.0 | 4.9 | GO:0002318 | myeloid progenitor cell differentiation(GO:0002318) |
| 1.0 | 13.7 | GO:0050771 | negative regulation of axonogenesis(GO:0050771) |
| 1.0 | 21.4 | GO:0097503 | sialylation(GO:0097503) |
| 1.0 | 2.9 | GO:0043633 | mitochondrial mRNA catabolic process(GO:0000958) positive regulation of mitochondrial RNA catabolic process(GO:0000962) RNA 5'-end processing(GO:0000966) rRNA import into mitochondrion(GO:0035928) polyadenylation-dependent RNA catabolic process(GO:0043633) |
| 0.9 | 34.5 | GO:0034766 | negative regulation of ion transmembrane transport(GO:0034766) |
| 0.9 | 23.4 | GO:1903959 | regulation of anion transmembrane transport(GO:1903959) |
| 0.9 | 136.4 | GO:0007411 | axon guidance(GO:0007411) |
| 0.9 | 2.7 | GO:0044375 | regulation of peroxisome size(GO:0044375) |
| 0.8 | 6.7 | GO:0008616 | queuosine biosynthetic process(GO:0008616) queuosine metabolic process(GO:0046116) |
| 0.8 | 16.8 | GO:0014002 | astrocyte development(GO:0014002) |
| 0.8 | 8.3 | GO:0090331 | negative regulation of platelet aggregation(GO:0090331) |
| 0.7 | 4.5 | GO:0007290 | spermatid nucleus elongation(GO:0007290) formaldehyde metabolic process(GO:0046292) |
| 0.7 | 27.4 | GO:0031338 | regulation of vesicle fusion(GO:0031338) |
| 0.7 | 168.6 | GO:0010951 | negative regulation of endopeptidase activity(GO:0010951) |
| 0.7 | 29.9 | GO:2001244 | positive regulation of intrinsic apoptotic signaling pathway(GO:2001244) |
| 0.6 | 7.6 | GO:0033617 | mitochondrial respiratory chain complex IV assembly(GO:0033617) |
| 0.6 | 24.0 | GO:0000413 | protein peptidyl-prolyl isomerization(GO:0000413) |
| 0.6 | 12.2 | GO:0045646 | regulation of erythrocyte differentiation(GO:0045646) |
| 0.6 | 4.1 | GO:0000722 | telomere maintenance via recombination(GO:0000722) |
| 0.6 | 19.3 | GO:1902475 | L-alpha-amino acid transmembrane transport(GO:1902475) |
| 0.5 | 11.0 | GO:0097178 | ruffle assembly(GO:0097178) |
| 0.5 | 60.8 | GO:0051017 | actin filament bundle assembly(GO:0051017) |
| 0.5 | 8.8 | GO:0015937 | coenzyme A biosynthetic process(GO:0015937) |
| 0.5 | 0.9 | GO:1900368 | regulation of RNA interference(GO:1900368) |
| 0.5 | 12.4 | GO:0042417 | dopamine metabolic process(GO:0042417) |
| 0.4 | 8.7 | GO:0032968 | positive regulation of transcription elongation from RNA polymerase II promoter(GO:0032968) |
| 0.4 | 11.8 | GO:0006779 | porphyrin-containing compound biosynthetic process(GO:0006779) |
| 0.4 | 28.7 | GO:0003073 | regulation of systemic arterial blood pressure(GO:0003073) |
| 0.4 | 10.7 | GO:1904377 | positive regulation of protein localization to plasma membrane(GO:1903078) positive regulation of protein localization to cell periphery(GO:1904377) |
| 0.4 | 0.8 | GO:0098759 | response to interleukin-8(GO:0098758) cellular response to interleukin-8(GO:0098759) |
| 0.3 | 1.0 | GO:0036500 | ATF6-mediated unfolded protein response(GO:0036500) |
| 0.3 | 28.3 | GO:0010921 | regulation of phosphatase activity(GO:0010921) |
| 0.3 | 6.1 | GO:0048566 | embryonic digestive tract development(GO:0048566) |
| 0.3 | 7.0 | GO:0030252 | growth hormone secretion(GO:0030252) |
| 0.3 | 2.2 | GO:0030854 | positive regulation of granulocyte differentiation(GO:0030854) |
| 0.3 | 2.6 | GO:0031145 | anaphase-promoting complex-dependent catabolic process(GO:0031145) |
| 0.3 | 28.6 | GO:0007416 | synapse assembly(GO:0007416) |
| 0.3 | 2.5 | GO:0006283 | transcription-coupled nucleotide-excision repair(GO:0006283) |
| 0.3 | 22.2 | GO:0008585 | female gonad development(GO:0008585) |
| 0.2 | 4.7 | GO:0006817 | phosphate ion transport(GO:0006817) |
| 0.2 | 10.5 | GO:0045454 | cell redox homeostasis(GO:0045454) |
| 0.2 | 18.8 | GO:0044070 | regulation of anion transport(GO:0044070) |
| 0.2 | 1.4 | GO:0072502 | cellular phosphate ion homeostasis(GO:0030643) cellular divalent inorganic anion homeostasis(GO:0072501) cellular trivalent inorganic anion homeostasis(GO:0072502) |
| 0.2 | 11.1 | GO:0050905 | neuromuscular process(GO:0050905) |
| 0.2 | 9.7 | GO:0000186 | activation of MAPKK activity(GO:0000186) |
| 0.2 | 83.8 | GO:0007283 | spermatogenesis(GO:0007283) |
| 0.2 | 8.3 | GO:0045669 | positive regulation of osteoblast differentiation(GO:0045669) |
| 0.2 | 13.3 | GO:0007613 | memory(GO:0007613) |
| 0.2 | 1.0 | GO:0032264 | IMP salvage(GO:0032264) |
| 0.2 | 26.0 | GO:0071805 | cellular potassium ion transport(GO:0071804) potassium ion transmembrane transport(GO:0071805) |
| 0.1 | 8.3 | GO:0006406 | mRNA export from nucleus(GO:0006406) mRNA-containing ribonucleoprotein complex export from nucleus(GO:0071427) |
| 0.1 | 2.4 | GO:0006415 | translational termination(GO:0006415) |
| 0.1 | 7.0 | GO:0030148 | sphingolipid biosynthetic process(GO:0030148) |
| 0.1 | 1.4 | GO:0042753 | positive regulation of circadian rhythm(GO:0042753) |
| 0.1 | 3.1 | GO:1901998 | toxin transport(GO:1901998) |
| 0.1 | 6.1 | GO:0006400 | tRNA modification(GO:0006400) |
| 0.1 | 3.5 | GO:0007631 | feeding behavior(GO:0007631) |
| 0.1 | 1.3 | GO:0045063 | T-helper 1 cell differentiation(GO:0045063) semaphorin-plexin signaling pathway(GO:0071526) |
| 0.1 | 1.9 | GO:0032781 | positive regulation of ATPase activity(GO:0032781) |
| 0.1 | 2.5 | GO:0006418 | tRNA aminoacylation for protein translation(GO:0006418) |
| 0.1 | 2.9 | GO:0001764 | neuron migration(GO:0001764) |
| 0.0 | 0.7 | GO:0035428 | hexose transmembrane transport(GO:0035428) glucose transmembrane transport(GO:1904659) |
| 0.0 | 1.1 | GO:0006367 | transcription initiation from RNA polymerase II promoter(GO:0006367) |
| 0.0 | 0.1 | GO:0046477 | glycosylceramide catabolic process(GO:0046477) |
Gene overrepresentation in cellular component category:
| Log-likelihood per target | Total log-likelihood | Term | Description |
|---|---|---|---|
| 53.0 | 264.8 | GO:0016939 | kinesin II complex(GO:0016939) |
| 42.1 | 168.5 | GO:1990005 | granular vesicle(GO:1990005) |
| 41.9 | 167.5 | GO:0099522 | region of cytosol(GO:0099522) postsynaptic cytosol(GO:0099524) |
| 38.8 | 194.1 | GO:1990716 | axonemal central apparatus(GO:1990716) |
| 30.6 | 153.1 | GO:0098536 | deuterosome(GO:0098536) |
| 22.6 | 293.5 | GO:0097539 | ciliary transition fiber(GO:0097539) |
| 21.0 | 734.1 | GO:0030990 | intraciliary transport particle(GO:0030990) |
| 19.3 | 77.1 | GO:0031021 | interphase microtubule organizing center(GO:0031021) |
| 17.3 | 294.7 | GO:0035686 | sperm fibrous sheath(GO:0035686) |
| 16.9 | 169.5 | GO:0034464 | BBSome(GO:0034464) |
| 15.6 | 78.0 | GO:0044316 | cone cell pedicle(GO:0044316) |
| 14.7 | 249.6 | GO:0036038 | MKS complex(GO:0036038) |
| 14.6 | 248.4 | GO:0035869 | ciliary transition zone(GO:0035869) |
| 14.0 | 335.3 | GO:0034451 | centriolar satellite(GO:0034451) |
| 13.7 | 672.6 | GO:0030286 | dynein complex(GO:0030286) |
| 13.5 | 229.6 | GO:0097228 | sperm principal piece(GO:0097228) |
| 13.0 | 116.9 | GO:0005952 | cAMP-dependent protein kinase complex(GO:0005952) |
| 11.9 | 95.3 | GO:0031314 | extrinsic component of mitochondrial inner membrane(GO:0031314) |
| 11.7 | 187.6 | GO:0032045 | guanyl-nucleotide exchange factor complex(GO:0032045) |
| 11.2 | 111.8 | GO:0002177 | manchette(GO:0002177) |
| 9.6 | 623.2 | GO:0036126 | sperm flagellum(GO:0036126) |
| 9.4 | 141.5 | GO:0097546 | ciliary base(GO:0097546) |
| 8.0 | 160.7 | GO:0010369 | chromocenter(GO:0010369) |
| 8.0 | 152.6 | GO:0001741 | XY body(GO:0001741) |
| 7.9 | 23.6 | GO:0098830 | presynaptic endosome(GO:0098830) |
| 7.2 | 157.5 | GO:0016581 | NuRD complex(GO:0016581) CHD-type complex(GO:0090545) |
| 6.5 | 45.2 | GO:0000235 | astral microtubule(GO:0000235) aster(GO:0005818) |
| 6.1 | 357.0 | GO:0005930 | axoneme(GO:0005930) ciliary plasm(GO:0097014) |
| 5.1 | 35.4 | GO:0032584 | growth cone membrane(GO:0032584) |
| 5.0 | 229.0 | GO:0016235 | aggresome(GO:0016235) |
| 4.9 | 108.8 | GO:0001673 | male germ cell nucleus(GO:0001673) |
| 4.9 | 19.5 | GO:0032021 | NELF complex(GO:0032021) |
| 4.5 | 53.6 | GO:0005890 | sodium:potassium-exchanging ATPase complex(GO:0005890) |
| 4.1 | 28.5 | GO:0000137 | Golgi cis cisterna(GO:0000137) |
| 4.0 | 169.1 | GO:0032809 | neuronal cell body membrane(GO:0032809) |
| 3.6 | 271.1 | GO:0001750 | photoreceptor outer segment(GO:0001750) |
| 3.6 | 10.8 | GO:0043511 | inhibin complex(GO:0043511) |
| 3.5 | 10.5 | GO:0055087 | Ski complex(GO:0055087) |
| 3.5 | 251.1 | GO:0036064 | ciliary basal body(GO:0036064) |
| 3.4 | 13.5 | GO:0005869 | dynactin complex(GO:0005869) |
| 3.3 | 9.8 | GO:0014701 | junctional sarcoplasmic reticulum membrane(GO:0014701) |
| 3.2 | 102.7 | GO:0005921 | gap junction(GO:0005921) |
| 3.2 | 38.5 | GO:0097431 | mitotic spindle pole(GO:0097431) |
| 3.1 | 42.8 | GO:0030122 | AP-2 adaptor complex(GO:0030122) |
| 3.0 | 29.9 | GO:0044352 | pinosome(GO:0044352) macropinosome(GO:0044354) |
| 2.9 | 52.7 | GO:0030131 | clathrin adaptor complex(GO:0030131) |
| 2.7 | 79.2 | GO:0031430 | M band(GO:0031430) |
| 2.7 | 8.1 | GO:0035838 | growing cell tip(GO:0035838) |
| 2.7 | 408.8 | GO:0005929 | cilium(GO:0005929) |
| 2.7 | 82.4 | GO:0005834 | heterotrimeric G-protein complex(GO:0005834) |
| 2.6 | 28.7 | GO:0002199 | zona pellucida receptor complex(GO:0002199) |
| 2.6 | 66.8 | GO:0032588 | trans-Golgi network membrane(GO:0032588) |
| 2.6 | 58.7 | GO:0098563 | integral component of synaptic vesicle membrane(GO:0030285) intrinsic component of synaptic vesicle membrane(GO:0098563) |
| 2.5 | 15.1 | GO:0090568 | nuclear transcriptional repressor complex(GO:0090568) |
| 2.5 | 152.2 | GO:0031901 | early endosome membrane(GO:0031901) |
| 2.5 | 124.5 | GO:0000307 | cyclin-dependent protein kinase holoenzyme complex(GO:0000307) |
| 2.4 | 65.3 | GO:0097440 | apical dendrite(GO:0097440) |
| 2.4 | 28.3 | GO:0044224 | juxtaparanode region of axon(GO:0044224) |
| 2.3 | 13.7 | GO:0005672 | transcription factor TFIIA complex(GO:0005672) |
| 2.2 | 28.9 | GO:0017101 | aminoacyl-tRNA synthetase multienzyme complex(GO:0017101) |
| 2.2 | 43.5 | GO:0097038 | perinuclear endoplasmic reticulum(GO:0097038) |
| 2.0 | 9.8 | GO:0000221 | vacuolar proton-transporting V-type ATPase, V1 domain(GO:0000221) |
| 1.8 | 70.2 | GO:0005801 | cis-Golgi network(GO:0005801) |
| 1.8 | 49.4 | GO:0080008 | Cul4-RING E3 ubiquitin ligase complex(GO:0080008) |
| 1.7 | 10.4 | GO:0005955 | calcineurin complex(GO:0005955) |
| 1.6 | 68.7 | GO:0005637 | nuclear inner membrane(GO:0005637) |
| 1.6 | 33.1 | GO:0008074 | guanylate cyclase complex, soluble(GO:0008074) |
| 1.5 | 6.1 | GO:0000938 | GARP complex(GO:0000938) EARP complex(GO:1990745) |
| 1.5 | 22.3 | GO:0034709 | methylosome(GO:0034709) |
| 1.5 | 22.1 | GO:0032279 | asymmetric synapse(GO:0032279) |
| 1.5 | 445.3 | GO:0030659 | cytoplasmic vesicle membrane(GO:0030659) |
| 1.4 | 8.6 | GO:0030681 | nucleolar ribonuclease P complex(GO:0005655) ribonuclease P complex(GO:0030677) multimeric ribonuclease P complex(GO:0030681) |
| 1.4 | 393.2 | GO:0014069 | postsynaptic density(GO:0014069) |
| 1.4 | 164.1 | GO:0005802 | trans-Golgi network(GO:0005802) |
| 1.3 | 127.7 | GO:0031225 | anchored component of membrane(GO:0031225) |
| 1.3 | 3.9 | GO:0036387 | nuclear pre-replicative complex(GO:0005656) pre-replicative complex(GO:0036387) |
| 1.2 | 17.6 | GO:0043196 | varicosity(GO:0043196) |
| 1.2 | 7.0 | GO:0005785 | signal recognition particle receptor complex(GO:0005785) |
| 1.1 | 11.4 | GO:0000347 | THO complex(GO:0000347) THO complex part of transcription export complex(GO:0000445) |
| 1.1 | 13.7 | GO:0071437 | invadopodium(GO:0071437) |
| 1.1 | 20.6 | GO:0060077 | inhibitory synapse(GO:0060077) |
| 1.1 | 171.9 | GO:0005769 | early endosome(GO:0005769) |
| 1.0 | 5.8 | GO:1990357 | terminal web(GO:1990357) |
| 1.0 | 2.9 | GO:0045025 | mitochondrial degradosome(GO:0045025) |
| 0.9 | 37.8 | GO:0005765 | lysosomal membrane(GO:0005765) lytic vacuole membrane(GO:0098852) |
| 0.8 | 4.1 | GO:0035061 | interchromatin granule(GO:0035061) |
| 0.8 | 36.5 | GO:0009925 | basal plasma membrane(GO:0009925) |
| 0.7 | 5.8 | GO:0030008 | TRAPP complex(GO:0030008) |
| 0.7 | 50.3 | GO:0008021 | synaptic vesicle(GO:0008021) |
| 0.7 | 14.1 | GO:0005849 | mRNA cleavage factor complex(GO:0005849) |
| 0.6 | 6.4 | GO:0032797 | SMN complex(GO:0032797) |
| 0.5 | 4.3 | GO:0072669 | tRNA-splicing ligase complex(GO:0072669) |
| 0.5 | 4.8 | GO:0097550 | transcriptional preinitiation complex(GO:0097550) |
| 0.5 | 12.8 | GO:0005790 | smooth endoplasmic reticulum(GO:0005790) |
| 0.5 | 26.3 | GO:0000777 | condensed chromosome kinetochore(GO:0000777) |
| 0.5 | 174.4 | GO:0043025 | neuronal cell body(GO:0043025) |
| 0.5 | 11.0 | GO:0030864 | cortical actin cytoskeleton(GO:0030864) |
| 0.4 | 11.8 | GO:0031307 | integral component of mitochondrial outer membrane(GO:0031307) |
| 0.4 | 6.4 | GO:0031201 | SNARE complex(GO:0031201) |
| 0.4 | 23.5 | GO:0030496 | midbody(GO:0030496) |
| 0.4 | 26.3 | GO:0031463 | Cul3-RING ubiquitin ligase complex(GO:0031463) |
| 0.4 | 4.8 | GO:0000812 | Swr1 complex(GO:0000812) |
| 0.4 | 344.3 | GO:0005887 | integral component of plasma membrane(GO:0005887) |
| 0.3 | 13.7 | GO:0005741 | mitochondrial outer membrane(GO:0005741) |
| 0.3 | 31.9 | GO:0000932 | cytoplasmic mRNA processing body(GO:0000932) |
| 0.3 | 13.3 | GO:1990391 | DNA repair complex(GO:1990391) |
| 0.3 | 22.0 | GO:0034702 | ion channel complex(GO:0034702) |
| 0.3 | 29.4 | GO:0005761 | organellar ribosome(GO:0000313) mitochondrial ribosome(GO:0005761) |
| 0.3 | 0.9 | GO:0031074 | nucleocytoplasmic shuttling complex(GO:0031074) |
| 0.3 | 12.1 | GO:0030173 | integral component of Golgi membrane(GO:0030173) |
| 0.3 | 1.8 | GO:0000808 | origin recognition complex(GO:0000808) nuclear origin of replication recognition complex(GO:0005664) |
| 0.2 | 8.9 | GO:0043596 | nuclear replication fork(GO:0043596) |
| 0.2 | 28.9 | GO:0000151 | ubiquitin ligase complex(GO:0000151) |
| 0.2 | 14.5 | GO:0005884 | actin filament(GO:0005884) |
| 0.2 | 7.9 | GO:0098793 | presynapse(GO:0098793) |
| 0.2 | 8.3 | GO:0005814 | centriole(GO:0005814) |
| 0.2 | 31.8 | GO:0030141 | secretory granule(GO:0030141) |
| 0.2 | 51.6 | GO:0005794 | Golgi apparatus(GO:0005794) |
| 0.2 | 20.1 | GO:0005882 | intermediate filament(GO:0005882) |
| 0.2 | 2.6 | GO:0005680 | anaphase-promoting complex(GO:0005680) |
| 0.1 | 4.2 | GO:0048770 | melanosome(GO:0042470) pigment granule(GO:0048770) |
| 0.1 | 51.3 | GO:0048471 | perinuclear region of cytoplasm(GO:0048471) |
| 0.1 | 4.7 | GO:0045111 | intermediate filament cytoskeleton(GO:0045111) |
| 0.1 | 7.5 | GO:0019005 | SCF ubiquitin ligase complex(GO:0019005) |
| 0.1 | 5.5 | GO:0055037 | recycling endosome(GO:0055037) |
| 0.1 | 18.4 | GO:0005777 | peroxisome(GO:0005777) microbody(GO:0042579) |
| 0.1 | 31.9 | GO:0005813 | centrosome(GO:0005813) |
| 0.1 | 0.8 | GO:0042629 | mast cell granule(GO:0042629) |
| 0.1 | 1.4 | GO:0031226 | intrinsic component of plasma membrane(GO:0031226) |
| 0.0 | 10.9 | GO:0015630 | microtubule cytoskeleton(GO:0015630) |
| 0.0 | 171.7 | GO:0016021 | integral component of membrane(GO:0016021) |
Gene overrepresentation in molecular function category:
| Log-likelihood per target | Total log-likelihood | Term | Description |
|---|---|---|---|
| 64.9 | 194.6 | GO:0061628 | H3K27me3 modified histone binding(GO:0061628) |
| 56.2 | 168.5 | GO:0015203 | polyamine transmembrane transporter activity(GO:0015203) putrescine transmembrane transporter activity(GO:0015489) ornithine decarboxylase activator activity(GO:0042978) |
| 51.1 | 102.2 | GO:0008158 | hedgehog receptor activity(GO:0008158) |
| 49.3 | 296.0 | GO:0032051 | clathrin light chain binding(GO:0032051) |
| 46.7 | 187.0 | GO:0008569 | ATP-dependent microtubule motor activity, minus-end-directed(GO:0008569) |
| 39.3 | 196.4 | GO:0015467 | G-protein activated inward rectifier potassium channel activity(GO:0015467) |
| 34.7 | 104.1 | GO:0005119 | smoothened binding(GO:0005119) |
| 29.1 | 116.5 | GO:0004127 | cytidylate kinase activity(GO:0004127) |
| 22.7 | 136.1 | GO:0045504 | dynein heavy chain binding(GO:0045504) |
| 20.6 | 205.6 | GO:0016909 | JUN kinase activity(GO:0004705) SAP kinase activity(GO:0016909) |
| 19.3 | 57.8 | GO:0004698 | calcium-dependent protein kinase C activity(GO:0004698) |
| 18.9 | 226.9 | GO:0003841 | 1-acylglycerol-3-phosphate O-acyltransferase activity(GO:0003841) |
| 18.6 | 167.5 | GO:0009931 | calcium-dependent protein serine/threonine kinase activity(GO:0009931) |
| 18.3 | 109.8 | GO:0032027 | myosin light chain binding(GO:0032027) |
| 16.7 | 116.9 | GO:0008603 | cAMP-dependent protein kinase regulator activity(GO:0008603) |
| 15.9 | 190.2 | GO:0015216 | purine nucleotide transmembrane transporter activity(GO:0015216) |
| 15.7 | 47.0 | GO:0004069 | L-aspartate:2-oxoglutarate aminotransferase activity(GO:0004069) |
| 13.2 | 119.2 | GO:0047498 | calcium-dependent phospholipase A2 activity(GO:0047498) |
| 12.1 | 96.7 | GO:0004865 | protein serine/threonine phosphatase inhibitor activity(GO:0004865) |
| 11.8 | 82.4 | GO:0031821 | G-protein coupled serotonin receptor binding(GO:0031821) |
| 11.6 | 185.8 | GO:0008568 | microtubule-severing ATPase activity(GO:0008568) |
| 10.3 | 51.4 | GO:0005250 | A-type (transient outward) potassium channel activity(GO:0005250) |
| 10.1 | 795.5 | GO:0003777 | microtubule motor activity(GO:0003777) |
| 9.4 | 94.1 | GO:0045505 | dynein intermediate chain binding(GO:0045505) |
| 9.1 | 54.4 | GO:0097506 | uracil DNA N-glycosylase activity(GO:0004844) deaminated base DNA N-glycosylase activity(GO:0097506) |
| 7.8 | 225.0 | GO:0004693 | cyclin-dependent protein serine/threonine kinase activity(GO:0004693) |
| 7.5 | 37.4 | GO:0004862 | cAMP-dependent protein kinase inhibitor activity(GO:0004862) |
| 7.4 | 133.4 | GO:0005242 | inward rectifier potassium channel activity(GO:0005242) |
| 7.1 | 21.4 | GO:0003828 | alpha-N-acetylneuraminate alpha-2,8-sialyltransferase activity(GO:0003828) |
| 6.8 | 136.1 | GO:0005229 | intracellular calcium activated chloride channel activity(GO:0005229) |
| 6.8 | 162.4 | GO:0005112 | Notch binding(GO:0005112) |
| 6.6 | 26.5 | GO:0035243 | protein-arginine omega-N symmetric methyltransferase activity(GO:0035243) |
| 5.8 | 120.8 | GO:0032183 | SUMO binding(GO:0032183) |
| 5.5 | 182.0 | GO:0016814 | hydrolase activity, acting on carbon-nitrogen (but not peptide) bonds, in cyclic amidines(GO:0016814) |
| 5.3 | 58.0 | GO:0030346 | protein phosphatase 2B binding(GO:0030346) |
| 5.1 | 142.2 | GO:0005452 | inorganic anion exchanger activity(GO:0005452) |
| 5.1 | 91.0 | GO:0017160 | Ral GTPase binding(GO:0017160) |
| 5.0 | 60.4 | GO:0070008 | serine-type exopeptidase activity(GO:0070008) |
| 4.7 | 112.5 | GO:0000030 | mannosyltransferase activity(GO:0000030) |
| 4.6 | 23.2 | GO:0005280 | hydrogen:amino acid symporter activity(GO:0005280) |
| 4.4 | 204.6 | GO:0005246 | calcium channel regulator activity(GO:0005246) |
| 4.4 | 22.1 | GO:0016907 | G-protein coupled acetylcholine receptor activity(GO:0016907) |
| 4.4 | 48.5 | GO:0042577 | lipid phosphatase activity(GO:0042577) |
| 4.4 | 17.5 | GO:0002046 | opsin binding(GO:0002046) |
| 4.4 | 61.0 | GO:0016500 | protein-hormone receptor activity(GO:0016500) |
| 4.3 | 17.0 | GO:0015186 | L-glutamine transmembrane transporter activity(GO:0015186) |
| 4.1 | 69.6 | GO:0097602 | cullin family protein binding(GO:0097602) |
| 4.0 | 60.7 | GO:0005313 | L-glutamate transmembrane transporter activity(GO:0005313) |
| 4.0 | 221.0 | GO:0051018 | protein kinase A binding(GO:0051018) |
| 3.9 | 50.5 | GO:0035256 | G-protein coupled glutamate receptor binding(GO:0035256) |
| 3.9 | 11.6 | GO:0008281 | sulfonylurea receptor activity(GO:0008281) |
| 3.8 | 53.6 | GO:0005391 | sodium:potassium-exchanging ATPase activity(GO:0005391) |
| 3.8 | 76.4 | GO:0070840 | dynein complex binding(GO:0070840) |
| 3.5 | 14.0 | GO:1904288 | BAT3 complex binding(GO:1904288) |
| 3.5 | 31.4 | GO:0015215 | nucleotide transmembrane transporter activity(GO:0015215) |
| 3.4 | 13.5 | GO:0004814 | arginine-tRNA ligase activity(GO:0004814) |
| 3.3 | 59.1 | GO:0005251 | delayed rectifier potassium channel activity(GO:0005251) |
| 3.2 | 86.6 | GO:0004181 | metallocarboxypeptidase activity(GO:0004181) |
| 3.2 | 15.8 | GO:0004140 | dephospho-CoA kinase activity(GO:0004140) |
| 3.1 | 15.3 | GO:0001729 | ceramide kinase activity(GO:0001729) |
| 3.0 | 106.1 | GO:0043015 | gamma-tubulin binding(GO:0043015) |
| 3.0 | 578.1 | GO:0008017 | microtubule binding(GO:0008017) |
| 3.0 | 53.4 | GO:0004707 | MAP kinase activity(GO:0004707) |
| 2.9 | 8.7 | GO:0097363 | protein O-GlcNAc transferase activity(GO:0097363) |
| 2.9 | 20.1 | GO:0004767 | sphingomyelin phosphodiesterase activity(GO:0004767) |
| 2.9 | 194.4 | GO:0005546 | phosphatidylinositol-4,5-bisphosphate binding(GO:0005546) |
| 2.9 | 171.2 | GO:0035064 | methylated histone binding(GO:0035064) |
| 2.8 | 11.1 | GO:1990955 | G-rich single-stranded DNA binding(GO:1990955) |
| 2.8 | 33.1 | GO:0008179 | adenylate cyclase binding(GO:0008179) |
| 2.7 | 32.8 | GO:0008190 | eukaryotic initiation factor 4E binding(GO:0008190) |
| 2.7 | 105.8 | GO:0030507 | spectrin binding(GO:0030507) |
| 2.7 | 8.1 | GO:0035651 | AP-3 adaptor complex binding(GO:0035651) |
| 2.7 | 18.7 | GO:0016413 | O-acetyltransferase activity(GO:0016413) |
| 2.6 | 7.8 | GO:0008476 | protein-tyrosine sulfotransferase activity(GO:0008476) |
| 2.4 | 14.7 | GO:0019211 | phosphatase activator activity(GO:0019211) |
| 2.4 | 33.9 | GO:0001206 | transcriptional repressor activity, RNA polymerase II distal enhancer sequence-specific binding(GO:0001206) |
| 2.3 | 33.9 | GO:0005247 | voltage-gated chloride channel activity(GO:0005247) |
| 2.1 | 79.1 | GO:0048020 | chemokine activity(GO:0008009) CCR chemokine receptor binding(GO:0048020) |
| 2.1 | 37.9 | GO:0008327 | methyl-CpG binding(GO:0008327) |
| 2.1 | 12.4 | GO:0008889 | glycerophosphodiester phosphodiesterase activity(GO:0008889) |
| 1.9 | 13.1 | GO:0004017 | adenylate kinase activity(GO:0004017) |
| 1.8 | 493.1 | GO:0003924 | GTPase activity(GO:0003924) |
| 1.8 | 386.0 | GO:0004866 | endopeptidase inhibitor activity(GO:0004866) |
| 1.8 | 54.8 | GO:0030552 | cAMP binding(GO:0030552) |
| 1.8 | 68.3 | GO:0016709 | oxidoreductase activity, acting on paired donors, with incorporation or reduction of molecular oxygen, NAD(P)H as one donor, and incorporation of one atom of oxygen(GO:0016709) |
| 1.7 | 36.1 | GO:0016864 | protein disulfide isomerase activity(GO:0003756) intramolecular oxidoreductase activity, transposing S-S bonds(GO:0016864) |
| 1.7 | 18.8 | GO:0005225 | volume-sensitive anion channel activity(GO:0005225) |
| 1.7 | 11.9 | GO:0038062 | protein tyrosine kinase collagen receptor activity(GO:0038062) |
| 1.7 | 60.8 | GO:0017080 | sodium channel regulator activity(GO:0017080) |
| 1.6 | 4.7 | GO:0052723 | inositol hexakisphosphate 1-kinase activity(GO:0052723) inositol hexakisphosphate 3-kinase activity(GO:0052724) |
| 1.5 | 10.8 | GO:0034711 | inhibin binding(GO:0034711) |
| 1.5 | 55.6 | GO:0005164 | tumor necrosis factor receptor binding(GO:0005164) |
| 1.5 | 35.5 | GO:0005086 | ARF guanyl-nucleotide exchange factor activity(GO:0005086) |
| 1.5 | 37.1 | GO:0004623 | phospholipase A2 activity(GO:0004623) |
| 1.5 | 6.1 | GO:0070568 | guanylyltransferase activity(GO:0070568) |
| 1.5 | 10.4 | GO:0016018 | cyclosporin A binding(GO:0016018) |
| 1.5 | 63.3 | GO:0045182 | translation regulator activity(GO:0045182) |
| 1.4 | 183.6 | GO:0005516 | calmodulin binding(GO:0005516) |
| 1.4 | 24.4 | GO:0008253 | 5'-nucleotidase activity(GO:0008253) |
| 1.4 | 175.0 | GO:0004222 | metalloendopeptidase activity(GO:0004222) |
| 1.4 | 12.8 | GO:0046790 | virion binding(GO:0046790) |
| 1.4 | 28.3 | GO:0004033 | aldo-keto reductase (NADP) activity(GO:0004033) |
| 1.4 | 220.5 | GO:0017137 | Rab GTPase binding(GO:0017137) |
| 1.4 | 176.5 | GO:0017016 | Ras GTPase binding(GO:0017016) |
| 1.4 | 66.3 | GO:0030276 | clathrin binding(GO:0030276) |
| 1.4 | 167.2 | GO:0005525 | GTP binding(GO:0005525) |
| 1.3 | 13.2 | GO:0015562 | efflux transmembrane transporter activity(GO:0015562) |
| 1.2 | 5.0 | GO:0071535 | RING-like zinc finger domain binding(GO:0071535) |
| 1.2 | 19.6 | GO:0016854 | racemase and epimerase activity(GO:0016854) |
| 1.1 | 4.3 | GO:0035515 | DNA demethylase activity(GO:0035514) oxidative RNA demethylase activity(GO:0035515) |
| 1.0 | 9.3 | GO:0032041 | histone deacetylase activity (H3-K14 specific)(GO:0031078) NAD-dependent histone deacetylase activity (H3-K14 specific)(GO:0032041) |
| 1.0 | 18.2 | GO:0031005 | filamin binding(GO:0031005) |
| 1.0 | 13.0 | GO:0098879 | structural constituent of postsynaptic specialization(GO:0098879) structural constituent of postsynaptic density(GO:0098919) |
| 1.0 | 28.6 | GO:0031624 | ubiquitin conjugating enzyme binding(GO:0031624) |
| 0.9 | 51.2 | GO:0044325 | ion channel binding(GO:0044325) |
| 0.9 | 11.0 | GO:0004791 | thioredoxin-disulfide reductase activity(GO:0004791) |
| 0.8 | 13.5 | GO:0017017 | MAP kinase tyrosine/serine/threonine phosphatase activity(GO:0017017) |
| 0.8 | 6.7 | GO:0008479 | queuine tRNA-ribosyltransferase activity(GO:0008479) |
| 0.8 | 58.3 | GO:0005089 | Rho guanyl-nucleotide exchange factor activity(GO:0005089) |
| 0.8 | 50.1 | GO:0043621 | protein self-association(GO:0043621) |
| 0.8 | 27.6 | GO:0019894 | kinesin binding(GO:0019894) |
| 0.7 | 24.0 | GO:0003755 | peptidyl-prolyl cis-trans isomerase activity(GO:0003755) |
| 0.7 | 26.7 | GO:0051059 | NF-kappaB binding(GO:0051059) |
| 0.6 | 17.3 | GO:0001103 | RNA polymerase II repressing transcription factor binding(GO:0001103) |
| 0.6 | 37.7 | GO:0030145 | manganese ion binding(GO:0030145) |
| 0.6 | 2.4 | GO:0004045 | aminoacyl-tRNA hydrolase activity(GO:0004045) |
| 0.6 | 17.5 | GO:0005154 | epidermal growth factor receptor binding(GO:0005154) |
| 0.6 | 313.9 | GO:0005509 | calcium ion binding(GO:0005509) |
| 0.5 | 18.7 | GO:0035035 | histone acetyltransferase binding(GO:0035035) |
| 0.5 | 46.4 | GO:0008565 | protein transporter activity(GO:0008565) |
| 0.5 | 11.6 | GO:0008198 | ferrous iron binding(GO:0008198) |
| 0.5 | 9.8 | GO:0046961 | proton-transporting ATPase activity, rotational mechanism(GO:0046961) |
| 0.5 | 22.5 | GO:0070888 | E-box binding(GO:0070888) |
| 0.5 | 2.9 | GO:0034046 | poly(G) binding(GO:0034046) |
| 0.4 | 2.7 | GO:0005005 | transmembrane-ephrin receptor activity(GO:0005005) |
| 0.4 | 9.7 | GO:0004709 | MAP kinase kinase kinase activity(GO:0004709) |
| 0.4 | 37.0 | GO:0043130 | ubiquitin-like protein binding(GO:0032182) ubiquitin binding(GO:0043130) |
| 0.4 | 68.6 | GO:0004252 | serine-type endopeptidase activity(GO:0004252) |
| 0.3 | 17.3 | GO:0015179 | L-amino acid transmembrane transporter activity(GO:0015179) |
| 0.3 | 3.7 | GO:0016595 | glutamate binding(GO:0016595) |
| 0.3 | 14.0 | GO:0043022 | ribosome binding(GO:0043022) |
| 0.3 | 13.7 | GO:0030374 | ligand-dependent nuclear receptor transcription coactivator activity(GO:0030374) |
| 0.3 | 4.5 | GO:0032454 | histone demethylase activity (H3-K9 specific)(GO:0032454) |
| 0.3 | 5.8 | GO:0003785 | actin monomer binding(GO:0003785) |
| 0.3 | 6.3 | GO:0003950 | NAD+ ADP-ribosyltransferase activity(GO:0003950) |
| 0.3 | 25.3 | GO:0015078 | hydrogen ion transmembrane transporter activity(GO:0015078) |
| 0.3 | 7.8 | GO:0061631 | ubiquitin conjugating enzyme activity(GO:0061631) ubiquitin-like protein conjugating enzyme activity(GO:0061650) |
| 0.3 | 0.8 | GO:0019959 | interleukin-8 receptor activity(GO:0004918) interleukin-8 binding(GO:0019959) |
| 0.2 | 6.0 | GO:0005070 | SH3/SH2 adaptor activity(GO:0005070) |
| 0.2 | 8.3 | GO:0005088 | Ras guanyl-nucleotide exchange factor activity(GO:0005088) |
| 0.2 | 2.2 | GO:0019966 | interleukin-1 binding(GO:0019966) |
| 0.2 | 4.4 | GO:0070003 | threonine-type endopeptidase activity(GO:0004298) threonine-type peptidase activity(GO:0070003) |
| 0.2 | 13.7 | GO:0051082 | unfolded protein binding(GO:0051082) |
| 0.2 | 17.8 | GO:0019955 | cytokine binding(GO:0019955) |
| 0.1 | 2.7 | GO:0070577 | lysine-acetylated histone binding(GO:0070577) |
| 0.1 | 3.8 | GO:0008081 | phosphoric diester hydrolase activity(GO:0008081) |
| 0.1 | 2.5 | GO:0051393 | alpha-actinin binding(GO:0051393) |
| 0.1 | 6.4 | GO:0004860 | protein kinase inhibitor activity(GO:0004860) |
| 0.0 | 8.3 | GO:0031625 | ubiquitin protein ligase binding(GO:0031625) ubiquitin-like protein ligase binding(GO:0044389) |
| 0.0 | 2.0 | GO:0008013 | beta-catenin binding(GO:0008013) |
| 0.0 | 1.7 | GO:0030674 | protein binding, bridging(GO:0030674) |
| 0.0 | 0.7 | GO:0005355 | glucose transmembrane transporter activity(GO:0005355) |
| 0.0 | 0.1 | GO:0016936 | galactoside binding(GO:0016936) |
Gene overrepresentation in curated gene sets: canonical pathways category:
| Log-likelihood per target | Total log-likelihood | Term | Description |
|---|---|---|---|
| 11.5 | 195.4 | SA REG CASCADE OF CYCLIN EXPR | Expression of cyclins regulates progression through the cell cycle by activating cyclin-dependent kinases. |
| 10.5 | 167.5 | ST WNT CA2 CYCLIC GMP PATHWAY | Wnt/Ca2+/cyclic GMP signaling. |
| 9.2 | 375.6 | ST ADRENERGIC | Adrenergic Pathway |
| 6.3 | 82.4 | PID S1P S1P4 PATHWAY | S1P4 pathway |
| 5.0 | 277.9 | PID HEDGEHOG GLI PATHWAY | Hedgehog signaling events mediated by Gli proteins |
| 3.0 | 106.1 | PID RAS PATHWAY | Regulation of Ras family activation |
| 2.9 | 58.5 | PID IL8 CXCR1 PATHWAY | IL8- and CXCR1-mediated signaling events |
| 2.4 | 71.9 | PID PI3K PLC TRK PATHWAY | Trk receptor signaling mediated by PI3K and PLC-gamma |
| 2.0 | 142.8 | PID E2F PATHWAY | E2F transcription factor network |
| 2.0 | 98.1 | PID PLK1 PATHWAY | PLK1 signaling events |
| 2.0 | 135.1 | PID BETA CATENIN NUC PATHWAY | Regulation of nuclear beta catenin signaling and target gene transcription |
| 1.9 | 33.1 | PID LPA4 PATHWAY | LPA4-mediated signaling events |
| 1.9 | 82.8 | PID INTEGRIN A4B1 PATHWAY | Alpha4 beta1 integrin signaling events |
| 1.9 | 58.3 | PID EPHA FWDPATHWAY | EPHA forward signaling |
| 1.6 | 22.2 | PID ALK2 PATHWAY | ALK2 signaling events |
| 1.2 | 21.2 | PID CIRCADIAN PATHWAY | Circadian rhythm pathway |
| 1.2 | 28.5 | PID CERAMIDE PATHWAY | Ceramide signaling pathway |
| 1.1 | 24.5 | PID ARF 3PATHWAY | Arf1 pathway |
| 1.0 | 8.1 | PID WNT CANONICAL PATHWAY | Canonical Wnt signaling pathway |
| 0.8 | 15.6 | PID ALPHA SYNUCLEIN PATHWAY | Alpha-synuclein signaling |
| 0.7 | 20.6 | PID LIS1 PATHWAY | Lissencephaly gene (LIS1) in neuronal migration and development |
| 0.7 | 32.1 | PID BMP PATHWAY | BMP receptor signaling |
| 0.7 | 39.2 | PID NOTCH PATHWAY | Notch signaling pathway |
| 0.7 | 140.7 | NABA ECM GLYCOPROTEINS | Genes encoding structural ECM glycoproteins |
| 0.6 | 9.3 | PID HDAC CLASSIII PATHWAY | Signaling events mediated by HDAC Class III |
| 0.5 | 4.0 | ST G ALPHA S PATHWAY | G alpha s Pathway |
| 0.5 | 12.0 | PID NEPHRIN NEPH1 PATHWAY | Nephrin/Neph1 signaling in the kidney podocyte |
| 0.5 | 13.2 | PID ERBB1 INTERNALIZATION PATHWAY | Internalization of ErbB1 |
| 0.5 | 16.1 | PID TCR CALCIUM PATHWAY | Calcium signaling in the CD4+ TCR pathway |
| 0.5 | 9.7 | PID P38 MKK3 6PATHWAY | p38 MAPK signaling pathway |
| 0.5 | 25.4 | PID AR PATHWAY | Coregulation of Androgen receptor activity |
| 0.5 | 15.4 | PID ATM PATHWAY | ATM pathway |
| 0.5 | 6.8 | PID EPHRINB REV PATHWAY | Ephrin B reverse signaling |
| 0.4 | 5.5 | ST DIFFERENTIATION PATHWAY IN PC12 CELLS | Differentiation Pathway in PC12 Cells; this is a specific case of PAC1 Receptor Pathway. |
| 0.4 | 22.1 | ST INTEGRIN SIGNALING PATHWAY | Integrin Signaling Pathway |
| 0.4 | 6.0 | PID RET PATHWAY | Signaling events regulated by Ret tyrosine kinase |
| 0.3 | 11.2 | PID IL6 7 PATHWAY | IL6-mediated signaling events |
| 0.3 | 72.1 | NABA ECM REGULATORS | Genes encoding enzymes and their regulators involved in the remodeling of the extracellular matrix |
| 0.3 | 3.9 | PID SYNDECAN 2 PATHWAY | Syndecan-2-mediated signaling events |
| 0.2 | 27.1 | PID P53 DOWNSTREAM PATHWAY | Direct p53 effectors |
| 0.2 | 6.3 | PID TELOMERASE PATHWAY | Regulation of Telomerase |
| 0.1 | 2.7 | PID RB 1PATHWAY | Regulation of retinoblastoma protein |
| 0.1 | 2.0 | PID P73PATHWAY | p73 transcription factor network |
Gene overrepresentation in curated gene sets: REACTOME pathways category:
| Log-likelihood per target | Total log-likelihood | Term | Description |
|---|---|---|---|
| 12.2 | 195.4 | REACTOME CYCLIN A B1 ASSOCIATED EVENTS DURING G2 M TRANSITION | Genes involved in Cyclin A/B1 associated events during G2/M transition |
| 11.0 | 329.8 | REACTOME INHIBITION OF VOLTAGE GATED CA2 CHANNELS VIA GBETA GAMMA SUBUNITS | Genes involved in Inhibition of voltage gated Ca2+ channels via Gbeta/gamma subunits |
| 11.0 | 373.5 | REACTOME TRAFFICKING OF AMPA RECEPTORS | Genes involved in Trafficking of AMPA receptors |
| 10.3 | 165.0 | REACTOME ACTIVATION OF THE AP1 FAMILY OF TRANSCRIPTION FACTORS | Genes involved in Activation of the AP-1 family of transcription factors |
| 10.0 | 170.3 | REACTOME RAP1 SIGNALLING | Genes involved in Rap1 signalling |
| 7.7 | 245.5 | REACTOME SYNTHESIS OF PA | Genes involved in Synthesis of PA |
| 7.5 | 150.0 | REACTOME PKA MEDIATED PHOSPHORYLATION OF CREB | Genes involved in PKA-mediated phosphorylation of CREB |
| 5.5 | 82.4 | REACTOME G PROTEIN ACTIVATION | Genes involved in G-protein activation |
| 4.2 | 54.4 | REACTOME BASE FREE SUGAR PHOSPHATE REMOVAL VIA THE SINGLE NUCLEOTIDE REPLACEMENT PATHWAY | Genes involved in Base-free sugar-phosphate removal via the single-nucleotide replacement pathway |
| 3.8 | 26.3 | REACTOME NRIF SIGNALS CELL DEATH FROM THE NUCLEUS | Genes involved in NRIF signals cell death from the nucleus |
| 3.4 | 60.8 | REACTOME CRMPS IN SEMA3A SIGNALING | Genes involved in CRMPs in Sema3A signaling |
| 2.9 | 46.7 | REACTOME REGULATION OF WATER BALANCE BY RENAL AQUAPORINS | Genes involved in Regulation of Water Balance by Renal Aquaporins |
| 2.9 | 87.2 | REACTOME ACTIVATED NOTCH1 TRANSMITS SIGNAL TO THE NUCLEUS | Genes involved in Activated NOTCH1 Transmits Signal to the Nucleus |
| 2.7 | 138.9 | REACTOME VOLTAGE GATED POTASSIUM CHANNELS | Genes involved in Voltage gated Potassium channels |
| 2.5 | 69.3 | REACTOME DEGRADATION OF THE EXTRACELLULAR MATRIX | Genes involved in Degradation of the extracellular matrix |
| 2.5 | 37.1 | REACTOME MRNA DECAY BY 5 TO 3 EXORIBONUCLEASE | Genes involved in mRNA Decay by 5' to 3' Exoribonuclease |
| 2.3 | 27.3 | REACTOME SYNTHESIS OF BILE ACIDS AND BILE SALTS VIA 24 HYDROXYCHOLESTEROL | Genes involved in Synthesis of bile acids and bile salts via 24-hydroxycholesterol |
| 2.3 | 260.4 | REACTOME TRANSPORT OF INORGANIC CATIONS ANIONS AND AMINO ACIDS OLIGOPEPTIDES | Genes involved in Transport of inorganic cations/anions and amino acids/oligopeptides |
| 2.0 | 28.7 | REACTOME IONOTROPIC ACTIVITY OF KAINATE RECEPTORS | Genes involved in Ionotropic activity of Kainate Receptors |
| 2.0 | 47.0 | REACTOME CHOLESTEROL BIOSYNTHESIS | Genes involved in Cholesterol biosynthesis |
| 2.0 | 33.3 | REACTOME CDC6 ASSOCIATION WITH THE ORC ORIGIN COMPLEX | Genes involved in CDC6 association with the ORC:origin complex |
| 1.8 | 85.0 | REACTOME ION TRANSPORT BY P TYPE ATPASES | Genes involved in Ion transport by P-type ATPases |
| 1.7 | 11.6 | REACTOME INWARDLY RECTIFYING K CHANNELS | Genes involved in Inwardly rectifying K+ channels |
| 1.6 | 14.7 | REACTOME ER PHAGOSOME PATHWAY | Genes involved in ER-Phagosome pathway |
| 1.6 | 79.9 | REACTOME CHEMOKINE RECEPTORS BIND CHEMOKINES | Genes involved in Chemokine receptors bind chemokines |
| 1.2 | 12.8 | REACTOME ACTIVATION OF CHAPERONE GENES BY ATF6 ALPHA | Genes involved in Activation of Chaperone Genes by ATF6-alpha |
| 1.2 | 25.3 | REACTOME SIGNALING BY HIPPO | Genes involved in Signaling by Hippo |
| 1.1 | 32.1 | REACTOME SIGNALING BY BMP | Genes involved in Signaling by BMP |
| 1.1 | 65.2 | REACTOME NRAGE SIGNALS DEATH THROUGH JNK | Genes involved in NRAGE signals death through JNK |
| 1.1 | 10.8 | REACTOME GLYCOPROTEIN HORMONES | Genes involved in Glycoprotein hormones |
| 1.1 | 28.9 | REACTOME CYTOSOLIC TRNA AMINOACYLATION | Genes involved in Cytosolic tRNA aminoacylation |
| 1.0 | 78.4 | REACTOME FACTORS INVOLVED IN MEGAKARYOCYTE DEVELOPMENT AND PLATELET PRODUCTION | Genes involved in Factors involved in megakaryocyte development and platelet production |
| 0.9 | 12.0 | REACTOME TGF BETA RECEPTOR SIGNALING IN EMT EPITHELIAL TO MESENCHYMAL TRANSITION | Genes involved in TGF-beta receptor signaling in EMT (epithelial to mesenchymal transition) |
| 0.8 | 178.1 | REACTOME ANTIGEN PROCESSING UBIQUITINATION PROTEASOME DEGRADATION | Genes involved in Antigen processing: Ubiquitination & Proteasome degradation |
| 0.7 | 42.3 | REACTOME METABOLISM OF VITAMINS AND COFACTORS | Genes involved in Metabolism of vitamins and cofactors |
| 0.7 | 13.1 | REACTOME SYNTHESIS AND INTERCONVERSION OF NUCLEOTIDE DI AND TRIPHOSPHATES | Genes involved in Synthesis and interconversion of nucleotide di- and triphosphates |
| 0.6 | 24.1 | REACTOME GLYCOSPHINGOLIPID METABOLISM | Genes involved in Glycosphingolipid metabolism |
| 0.6 | 17.6 | REACTOME EFFECTS OF PIP2 HYDROLYSIS | Genes involved in Effects of PIP2 hydrolysis |
| 0.6 | 8.1 | REACTOME SYNTHESIS OF PIPS AT THE EARLY ENDOSOME MEMBRANE | Genes involved in Synthesis of PIPs at the early endosome membrane |
| 0.6 | 22.5 | REACTOME BMAL1 CLOCK NPAS2 ACTIVATES CIRCADIAN EXPRESSION | Genes involved in BMAL1:CLOCK/NPAS2 Activates Circadian Expression |
| 0.5 | 10.4 | REACTOME DARPP 32 EVENTS | Genes involved in DARPP-32 events |
| 0.5 | 6.0 | REACTOME SIGNAL ATTENUATION | Genes involved in Signal attenuation |
| 0.4 | 22.3 | REACTOME METABOLISM OF NON CODING RNA | Genes involved in Metabolism of non-coding RNA |
| 0.4 | 9.8 | REACTOME INSULIN RECEPTOR RECYCLING | Genes involved in Insulin receptor recycling |
| 0.3 | 11.8 | REACTOME ABC FAMILY PROTEINS MEDIATED TRANSPORT | Genes involved in ABC-family proteins mediated transport |
| 0.3 | 2.5 | REACTOME FORMATION OF TRANSCRIPTION COUPLED NER TC NER REPAIR COMPLEX | Genes involved in Formation of transcription-coupled NER (TC-NER) repair complex |
| 0.3 | 5.5 | REACTOME POST CHAPERONIN TUBULIN FOLDING PATHWAY | Genes involved in Post-chaperonin tubulin folding pathway |
| 0.3 | 5.3 | REACTOME PROCESSING OF INTRONLESS PRE MRNAS | Genes involved in Processing of Intronless Pre-mRNAs |
| 0.3 | 1.0 | REACTOME ACTIVATION OF CHAPERONES BY ATF6 ALPHA | Genes involved in Activation of Chaperones by ATF6-alpha |
| 0.2 | 19.2 | REACTOME PPARA ACTIVATES GENE EXPRESSION | Genes involved in PPARA Activates Gene Expression |
| 0.1 | 4.1 | REACTOME TRANSPORT OF VITAMINS NUCLEOSIDES AND RELATED MOLECULES | Genes involved in Transport of vitamins, nucleosides, and related molecules |
| 0.1 | 1.3 | REACTOME OTHER SEMAPHORIN INTERACTIONS | Genes involved in Other semaphorin interactions |
| 0.0 | 3.9 | REACTOME L1CAM INTERACTIONS | Genes involved in L1CAM interactions |