Project
GSE53960: rat RNA-Seq transcriptomic Bodymap
Navigation
Downloads
Results for Rest
Z-value: 3.87
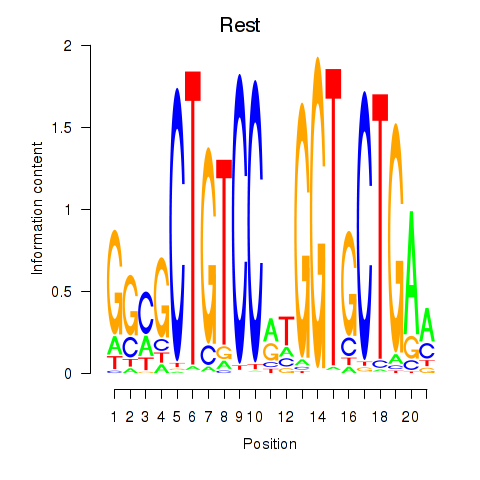
Motif logo
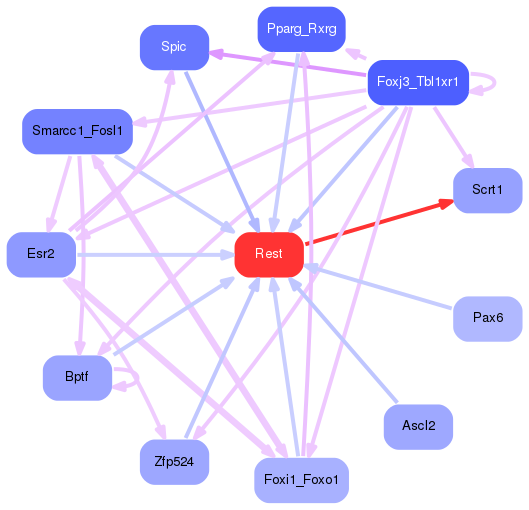
Transcription factors associated with Rest
| Gene Symbol | Gene ID | Gene Info |
|---|---|---|
|
Rest
|
ENSRNOG00000002074 | RE1-silencing transcription factor |
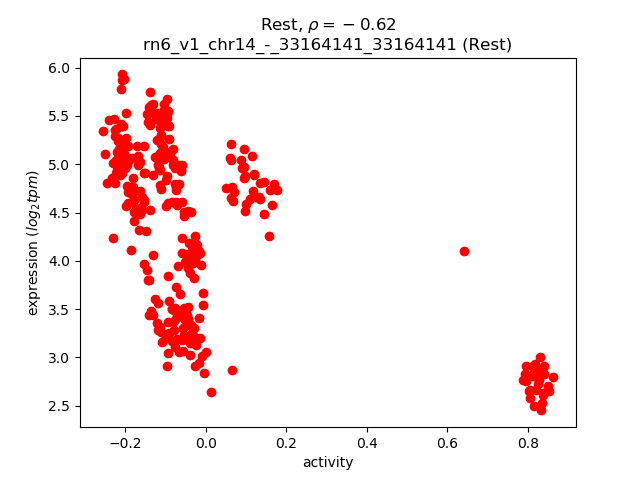
Activity-expression correlation:
| Gene | Promoter | Pearson corr. coef. | P-value | Plot |
|---|---|---|---|---|
| Rest | rn6_v1_chr14_-_33164141_33164141 | -0.62 | 2.5e-35 | Click! |
Activity profile of Rest motif
Sorted Z-values of Rest motif
| Promoter | Log-likelihood | Transcript | Gene | Gene Info |
|---|---|---|---|---|
| chr3_+_125428260 | 325.28 |
ENSRNOT00000028892
|
Chgb
|
chromogranin B |
| chr3_-_176816114 | 318.85 |
ENSRNOT00000079262
ENSRNOT00000018697 |
Stmn3
|
stathmin 3 |
| chr10_-_20622600 | 314.21 |
ENSRNOT00000020554
|
Fbll1
|
fibrillarin-like 1 |
| chr18_-_24182012 | 307.02 |
ENSRNOT00000023594
|
Syt4
|
synaptotagmin 4 |
| chr12_+_41073824 | 287.52 |
ENSRNOT00000001844
|
Rph3a
|
rabphilin 3A |
| chr4_+_145238947 | 281.25 |
ENSRNOT00000067396
ENSRNOT00000091934 |
Cpne9
|
copine family member 9 |
| chr6_+_126434226 | 263.75 |
ENSRNOT00000090857
|
Chga
|
chromogranin A |
| chr1_+_84470829 | 251.64 |
ENSRNOT00000025472
|
Ttc9b
|
tetratricopeptide repeat domain 9B |
| chr2_-_189096785 | 240.22 |
ENSRNOT00000028200
|
Chrnb2
|
cholinergic receptor nicotinic beta 2 subunit |
| chr2_-_179704629 | 237.99 |
ENSRNOT00000083361
ENSRNOT00000077941 |
Gria2
|
glutamate ionotropic receptor AMPA type subunit 2 |
| chr9_-_92291220 | 236.50 |
ENSRNOT00000093357
|
Dner
|
delta/notch-like EGF repeat containing |
| chr3_-_2534663 | 232.23 |
ENSRNOT00000049297
ENSRNOT00000044246 |
Grin1
|
glutamate ionotropic receptor NMDA type subunit 1 |
| chr1_+_106998623 | 231.23 |
ENSRNOT00000022383
|
Slc17a6
|
solute carrier family 17 member 6 |
| chr4_-_154043850 | 230.86 |
ENSRNOT00000018902
|
Iqsec3
|
IQ motif and Sec7 domain 3 |
| chr1_-_143315633 | 229.21 |
ENSRNOT00000026030
|
Ap3b2
|
adaptor-related protein complex 3, beta 2 subunit |
| chr3_-_2534375 | 217.58 |
ENSRNOT00000037725
|
Grin1
|
glutamate ionotropic receptor NMDA type subunit 1 |
| chr17_+_89171250 | 216.90 |
ENSRNOT00000024901
|
Gad2
|
glutamate decarboxylase 2 |
| chr6_-_92760018 | 211.05 |
ENSRNOT00000009560
|
Trim9
|
tripartite motif-containing 9 |
| chr3_+_161433410 | 199.93 |
ENSRNOT00000024657
|
Slc12a5
|
solute carrier family 12 member 5 |
| chr2_-_30127269 | 196.20 |
ENSRNOT00000023869
|
Cartpt
|
CART prepropeptide |
| chr10_+_90342051 | 192.11 |
ENSRNOT00000028487
|
Rundc3a
|
RUN domain containing 3A |
| chr20_+_5815837 | 190.31 |
ENSRNOT00000036999
|
Lhfpl5
|
lipoma HMGIC fusion partner-like 5 |
| chr5_-_172809353 | 175.32 |
ENSRNOT00000022246
|
Gabrd
|
gamma-aminobutyric acid type A receptor delta subunit |
| chr13_-_111765944 | 172.77 |
ENSRNOT00000073041
|
Syt14
|
synaptotagmin 14 |
| chr9_+_86874685 | 169.50 |
ENSRNOT00000041337
|
NEWGENE_1305560
|
neuronal tyrosine-phosphorylated phosphoinositide-3-kinase adaptor 2 |
| chr3_+_151310598 | 167.92 |
ENSRNOT00000092194
|
Mmp24
|
matrix metallopeptidase 24 |
| chr10_+_67862054 | 165.19 |
ENSRNOT00000031746
|
Cdk5r1
|
cyclin-dependent kinase 5 regulatory subunit 1 |
| chr3_-_5693147 | 163.42 |
ENSRNOT00000008660
|
Fam163b
|
family with sequence similarity 163, member B |
| chr1_+_105285419 | 161.26 |
ENSRNOT00000089693
|
Slc6a5
|
solute carrier family 6 member 5 |
| chr9_+_77834091 | 159.34 |
ENSRNOT00000033459
|
Vwc2l
|
von Willebrand factor C domain-containing protein 2-like |
| chr5_+_145257714 | 158.58 |
ENSRNOT00000019214
|
Dlgap3
|
DLG associated protein 3 |
| chr3_-_175479395 | 152.82 |
ENSRNOT00000077308
|
Hrh3
|
histamine receptor H3 |
| chr5_+_29538380 | 148.84 |
ENSRNOT00000010845
|
Calb1
|
calbindin 1 |
| chr1_+_42169501 | 147.74 |
ENSRNOT00000025477
ENSRNOT00000092791 |
Vip
|
vasoactive intestinal peptide |
| chr8_+_117620317 | 143.87 |
ENSRNOT00000084220
|
Celsr3
|
cadherin, EGF LAG seven-pass G-type receptor 3 |
| chr7_-_117587103 | 139.66 |
ENSRNOT00000035423
|
Scrt1
|
scratch family transcriptional repressor 1 |
| chr10_-_64915148 | 138.05 |
ENSRNOT00000048543
|
Sez6
|
seizure related 6 homolog |
| chr12_+_45727112 | 134.15 |
ENSRNOT00000001507
|
Srrm4
|
serine/arginine repetitive matrix 4 |
| chr1_+_43475589 | 133.88 |
ENSRNOT00000092034
ENSRNOT00000024682 |
Oprm1
|
opioid receptor, mu 1 |
| chrX_+_156911345 | 131.48 |
ENSRNOT00000080945
|
L1cam
|
L1 cell adhesion molecule |
| chr17_+_43357888 | 126.54 |
ENSRNOT00000022329
|
Scgn
|
secretagogin, EF-hand calcium binding protein |
| chr6_-_108415093 | 124.45 |
ENSRNOT00000031650
|
Syndig1l
|
synapse differentiation inducing 1-like |
| chr6_+_147876557 | 124.36 |
ENSRNOT00000080090
|
Tmem196
|
transmembrane protein 196 |
| chr17_-_10766253 | 123.50 |
ENSRNOT00000000117
|
Cplx2
|
complexin 2 |
| chr8_+_64364741 | 121.75 |
ENSRNOT00000082840
|
Celf6
|
CUGBP, Elav-like family member 6 |
| chr6_+_147876237 | 120.16 |
ENSRNOT00000056649
|
Tmem196
|
transmembrane protein 196 |
| chr20_-_45815940 | 116.33 |
ENSRNOT00000073276
|
Gpr6
|
G protein-coupled receptor 6 |
| chr6_-_137084739 | 113.04 |
ENSRNOT00000060943
|
Tmem179
|
transmembrane protein 179 |
| chr10_-_40953651 | 108.91 |
ENSRNOT00000063889
|
Glra1
|
glycine receptor, alpha 1 |
| chrX_+_1321315 | 105.55 |
ENSRNOT00000014250
|
Syn1
|
synapsin I |
| chr15_+_34167945 | 100.78 |
ENSRNOT00000032252
|
Carmil3
|
capping protein regulator and myosin 1 linker 3 |
| chr16_-_37908173 | 97.67 |
ENSRNOT00000075026
|
Glra3
|
glycine receptor, alpha 3 |
| chr3_+_3310954 | 92.34 |
ENSRNOT00000061773
|
Kcnt1
|
potassium sodium-activated channel subfamily T member 1 |
| chr16_-_38063821 | 91.84 |
ENSRNOT00000077452
ENSRNOT00000089533 |
Glra3
|
glycine receptor, alpha 3 |
| chr16_+_8497569 | 87.72 |
ENSRNOT00000027054
|
Ogdhl
|
oxoglutarate dehydrogenase-like |
| chr10_-_40953467 | 86.72 |
ENSRNOT00000092189
|
Glra1
|
glycine receptor, alpha 1 |
| chr6_+_126040631 | 85.80 |
ENSRNOT00000008886
|
Slc24a4
|
solute carrier family 24 member 4 |
| chr8_-_62248013 | 78.52 |
ENSRNOT00000080012
ENSRNOT00000089602 |
Scamp5
|
secretory carrier membrane protein 5 |
| chr9_+_117795132 | 73.64 |
ENSRNOT00000086943
|
Akain1
|
A-kinase anchor inhibitor 1 |
| chr1_-_215536980 | 67.85 |
ENSRNOT00000027344
|
Ifitm10
|
interferon induced transmembrane protein 10 |
| chr6_+_137997335 | 67.57 |
ENSRNOT00000006872
|
Tmem121
|
transmembrane protein 121 |
| chr7_-_117786872 | 65.63 |
ENSRNOT00000030517
|
Lrrc24
|
leucine rich repeat containing 24 |
| chr3_-_80000091 | 60.52 |
ENSRNOT00000079394
|
Madd
|
MAP-kinase activating death domain |
| chr3_-_175479034 | 58.24 |
ENSRNOT00000086761
|
Hrh3
|
histamine receptor H3 |
| chr8_-_21743338 | 57.63 |
ENSRNOT00000027829
|
Olfm2
|
olfactomedin 2 |
| chr5_-_48194251 | 56.86 |
ENSRNOT00000081748
ENSRNOT00000065912 |
Ankrd6
|
ankyrin repeat domain 6 |
| chr1_+_193187972 | 56.13 |
ENSRNOT00000090172
ENSRNOT00000065342 |
Slc5a11
|
solute carrier family 5 member 11 |
| chr5_+_26493212 | 50.28 |
ENSRNOT00000061328
|
Triqk
|
triple QxxK/R motif containing |
| chr1_+_220322940 | 45.20 |
ENSRNOT00000074972
|
LOC108348085
|
beta-1,4-glucuronyltransferase 1 |
| chr10_-_13075864 | 42.19 |
ENSRNOT00000005220
|
Paqr4
|
progestin and adipoQ receptor family member 4 |
| chr10_+_61403130 | 34.65 |
ENSRNOT00000092490
ENSRNOT00000077649 |
Ccdc92b
|
coiled-coil domain containing 92B |
| chr17_-_23923792 | 33.17 |
ENSRNOT00000018739
|
Gfod1
|
glucose-fructose oxidoreductase domain containing 1 |
| chr1_+_164425475 | 30.23 |
ENSRNOT00000023386
|
Klhl35
|
kelch-like family member 35 |
| chr1_-_215536770 | 29.09 |
ENSRNOT00000078030
|
Ifitm10
|
interferon induced transmembrane protein 10 |
| chr8_-_68038533 | 28.02 |
ENSRNOT00000018756
|
Skor1
|
SKI family transcriptional corepressor 1 |
| chr3_+_172385672 | 26.93 |
ENSRNOT00000090989
|
Gnas
|
GNAS complex locus |
| chr15_+_42653148 | 25.99 |
ENSRNOT00000022095
|
Clu
|
clusterin |
| chr7_-_58587787 | 21.28 |
ENSRNOT00000005814
|
Lgr5
|
leucine rich repeat containing G protein coupled receptor 5 |
| chr8_+_130749838 | 20.75 |
ENSRNOT00000079273
|
Snrk
|
SNF related kinase |
| chr3_+_153580861 | 18.98 |
ENSRNOT00000080516
ENSRNOT00000012739 |
Src
|
SRC proto-oncogene, non-receptor tyrosine kinase |
| chr10_+_60231027 | 17.81 |
ENSRNOT00000085543
|
Olr1482
|
olfactory receptor 1482 |
| chr3_+_100769839 | 17.13 |
ENSRNOT00000077703
|
Bdnf
|
brain-derived neurotrophic factor |
| chr17_+_8135251 | 16.15 |
ENSRNOT00000016982
|
Trpc7
|
transient receptor potential cation channel, subfamily C, member 7 |
| chr10_-_14597969 | 14.11 |
ENSRNOT00000029674
|
Gnptg
|
N-acetylglucosamine-1-phosphate transferase, gamma subunit |
| chr1_-_225128740 | 11.90 |
ENSRNOT00000026897
|
Rom1
|
retinal outer segment membrane protein 1 |
| chr5_-_64946580 | 5.44 |
ENSRNOT00000007290
|
Ppp3r2
|
protein phosphatase 3, regulatory subunit B, beta |
| chr1_+_85252103 | 5.12 |
ENSRNOT00000080740
|
Ifnl1
|
interferon, lambda 1 |
| chr1_+_80256973 | 4.83 |
ENSRNOT00000024113
|
Ercc1
|
ERCC excision repair 1, endonuclease non-catalytic subunit |
| chr1_-_85237775 | 4.06 |
ENSRNOT00000035328
|
Ifnl3
|
interferon, lambda 3 |
| chr10_-_60006037 | 3.29 |
ENSRNOT00000065541
|
Olr1485
|
olfactory receptor 1485 |
Network of associatons between targets according to the STRING database.

First level regulatory network of Rest
Gene Ontology Analysis
Gene overrepresentation in biological process category:
| Log-likelihood per target | Total log-likelihood | Term | Description |
|---|---|---|---|
| 153.7 | 615.0 | GO:0021586 | pons maturation(GO:0021586) |
| 104.7 | 314.2 | GO:0018364 | peptidyl-glutamine methylation(GO:0018364) |
| 87.9 | 263.7 | GO:1900738 | positive regulation of phospholipase C-activating G-protein coupled receptor signaling pathway(GO:1900738) |
| 86.3 | 518.1 | GO:0031339 | negative regulation of vesicle fusion(GO:0031339) |
| 80.1 | 240.2 | GO:0060084 | synaptic transmission involved in micturition(GO:0060084) |
| 54.2 | 216.9 | GO:0006538 | glutamate catabolic process(GO:0006538) |
| 49.7 | 546.4 | GO:0060012 | synaptic transmission, glycinergic(GO:0060012) |
| 49.0 | 196.2 | GO:0070093 | negative regulation of glucagon secretion(GO:0070093) |
| 44.6 | 133.9 | GO:0031635 | adenylate cyclase-inhibiting opioid receptor signaling pathway(GO:0031635) |
| 37.2 | 148.8 | GO:0035502 | metanephric part of ureteric bud development(GO:0035502) |
| 35.2 | 211.1 | GO:0014053 | negative regulation of gamma-aminobutyric acid secretion(GO:0014053) |
| 32.9 | 131.5 | GO:0097069 | cellular response to thyroxine stimulus(GO:0097069) |
| 31.9 | 318.9 | GO:0035021 | negative regulation of Rac protein signal transduction(GO:0035021) |
| 28.8 | 143.9 | GO:0036515 | serotonergic neuron axon guidance(GO:0036515) |
| 25.7 | 231.2 | GO:0098700 | neurotransmitter loading into synaptic vesicle(GO:0098700) |
| 23.7 | 236.5 | GO:0007220 | Notch receptor processing(GO:0007220) |
| 22.2 | 199.9 | GO:0030644 | cellular chloride ion homeostasis(GO:0030644) |
| 20.2 | 60.5 | GO:0036395 | pancreatic amylase secretion(GO:0036395) regulation of pancreatic amylase secretion(GO:1902276) |
| 18.5 | 147.7 | GO:0070459 | prolactin secretion(GO:0070459) |
| 17.5 | 192.1 | GO:0031284 | positive regulation of guanylate cyclase activity(GO:0031284) |
| 12.9 | 167.9 | GO:0044331 | cell-cell adhesion mediated by cadherin(GO:0044331) |
| 12.7 | 190.3 | GO:0060088 | auditory receptor cell stereocilium organization(GO:0060088) |
| 12.4 | 460.3 | GO:0048791 | calcium ion-regulated exocytosis of neurotransmitter(GO:0048791) |
| 11.5 | 229.2 | GO:0099517 | anterograde synaptic vesicle transport(GO:0048490) synaptic vesicle cytoskeletal transport(GO:0099514) synaptic vesicle transport along microtubule(GO:0099517) |
| 10.3 | 238.0 | GO:0060992 | response to fungicide(GO:0060992) |
| 9.6 | 230.9 | GO:0032012 | regulation of ARF protein signal transduction(GO:0032012) |
| 9.5 | 123.5 | GO:0031915 | positive regulation of synaptic plasticity(GO:0031915) |
| 9.4 | 281.2 | GO:1903861 | positive regulation of dendrite extension(GO:1903861) |
| 9.0 | 26.9 | GO:0040032 | post-embryonic body morphogenesis(GO:0040032) |
| 8.7 | 26.0 | GO:1902988 | regulation of neuronal signal transduction(GO:1902847) positive regulation of tau-protein kinase activity(GO:1902949) neurofibrillary tangle assembly(GO:1902988) regulation of neurofibrillary tangle assembly(GO:1902996) positive regulation of neurofibrillary tangle assembly(GO:1902998) |
| 7.8 | 116.3 | GO:0003376 | sphingosine-1-phosphate signaling pathway(GO:0003376) |
| 7.7 | 138.0 | GO:0090036 | regulation of protein kinase C signaling(GO:0090036) |
| 7.0 | 105.5 | GO:0097091 | synaptic vesicle clustering(GO:0097091) |
| 5.7 | 56.9 | GO:2000096 | positive regulation of Wnt signaling pathway, planar cell polarity pathway(GO:2000096) |
| 5.3 | 21.3 | GO:2001013 | epithelial cell proliferation involved in renal tubule morphogenesis(GO:2001013) |
| 5.2 | 57.6 | GO:0051152 | positive regulation of smooth muscle cell differentiation(GO:0051152) |
| 4.8 | 255.9 | GO:0000381 | regulation of alternative mRNA splicing, via spliceosome(GO:0000381) |
| 4.7 | 19.0 | GO:2001286 | regulation of caveolin-mediated endocytosis(GO:2001286) |
| 3.9 | 187.4 | GO:0030514 | negative regulation of BMP signaling pathway(GO:0030514) |
| 3.4 | 78.5 | GO:0045956 | positive regulation of calcium ion-dependent exocytosis(GO:0045956) |
| 2.9 | 87.7 | GO:0006099 | tricarboxylic acid cycle(GO:0006099) |
| 2.9 | 85.8 | GO:0097186 | amelogenesis(GO:0097186) |
| 2.5 | 73.6 | GO:0010738 | regulation of protein kinase A signaling(GO:0010738) |
| 2.4 | 4.8 | GO:0000720 | pyrimidine dimer repair by nucleotide-excision repair(GO:0000720) |
| 2.3 | 139.7 | GO:2001222 | regulation of neuron migration(GO:2001222) |
| 2.1 | 17.1 | GO:0061193 | taste bud development(GO:0061193) |
| 1.8 | 56.1 | GO:0035428 | hexose transmembrane transport(GO:0035428) glucose transmembrane transport(GO:1904659) |
| 1.7 | 175.3 | GO:1902476 | chloride transmembrane transport(GO:1902476) |
| 1.3 | 5.1 | GO:0042509 | negative regulation of interleukin-13 production(GO:0032696) regulation of tyrosine phosphorylation of STAT protein(GO:0042509) positive regulation of tyrosine phosphorylation of STAT protein(GO:0042531) |
| 0.9 | 65.6 | GO:0051965 | positive regulation of synapse assembly(GO:0051965) |
| 0.7 | 14.1 | GO:0006622 | protein targeting to lysosome(GO:0006622) |
| 0.5 | 11.9 | GO:0061298 | retina vasculature development in camera-type eye(GO:0061298) |
| 0.4 | 142.7 | GO:0051480 | regulation of cytosolic calcium ion concentration(GO:0051480) |
| 0.4 | 92.3 | GO:0071804 | cellular potassium ion transport(GO:0071804) potassium ion transmembrane transport(GO:0071805) |
| 0.1 | 4.1 | GO:0002385 | mucosal immune response(GO:0002385) |
Gene overrepresentation in cellular component category:
| Log-likelihood per target | Total log-likelihood | Term | Description |
|---|---|---|---|
| 112.5 | 449.8 | GO:0044307 | dendritic branch(GO:0044307) |
| 63.2 | 189.5 | GO:0098982 | glycine-gated chloride channel complex(GO:0016935) GABA-ergic synapse(GO:0098982) |
| 55.1 | 165.2 | GO:0016533 | cyclin-dependent protein kinase 5 holoenzyme complex(GO:0016533) |
| 39.3 | 314.2 | GO:0031428 | box C/D snoRNP complex(GO:0031428) |
| 26.3 | 289.7 | GO:0042583 | chromaffin granule(GO:0042583) |
| 23.8 | 238.0 | GO:0098839 | postsynaptic density membrane(GO:0098839) |
| 21.9 | 307.0 | GO:0031045 | dense core granule(GO:0031045) |
| 20.6 | 123.5 | GO:0070033 | synaptobrevin 2-SNAP-25-syntaxin-1a-complexin II complex(GO:0070033) |
| 17.5 | 87.7 | GO:0045252 | oxoglutarate dehydrogenase complex(GO:0045252) |
| 16.5 | 643.4 | GO:0060077 | inhibitory synapse(GO:0060077) |
| 16.4 | 229.2 | GO:0030123 | AP-3 adaptor complex(GO:0030123) |
| 13.6 | 190.3 | GO:0032426 | stereocilium tip(GO:0032426) |
| 12.8 | 231.2 | GO:0030285 | integral component of synaptic vesicle membrane(GO:0030285) intrinsic component of synaptic vesicle membrane(GO:0098563) |
| 12.2 | 158.6 | GO:0017146 | NMDA selective glutamate receptor complex(GO:0017146) |
| 12.0 | 240.2 | GO:0005892 | acetylcholine-gated channel complex(GO:0005892) |
| 11.0 | 131.5 | GO:0044294 | dendritic growth cone(GO:0044294) |
| 10.9 | 294.7 | GO:0032588 | trans-Golgi network membrane(GO:0032588) |
| 10.3 | 175.3 | GO:1902711 | GABA-A receptor complex(GO:1902711) |
| 9.3 | 333.8 | GO:0032590 | dendrite membrane(GO:0032590) |
| 7.2 | 217.0 | GO:0032281 | AMPA glutamate receptor complex(GO:0032281) |
| 6.3 | 393.1 | GO:0030672 | synaptic vesicle membrane(GO:0030672) exocytic vesicle membrane(GO:0099501) |
| 5.3 | 138.0 | GO:0097440 | apical dendrite(GO:0097440) |
| 2.3 | 288.7 | GO:0008021 | synaptic vesicle(GO:0008021) |
| 1.9 | 126.5 | GO:0030658 | transport vesicle membrane(GO:0030658) |
| 1.7 | 318.9 | GO:0030426 | growth cone(GO:0030426) |
| 1.6 | 148.8 | GO:0043195 | terminal bouton(GO:0043195) |
| 1.6 | 4.8 | GO:0000110 | nucleotide-excision repair factor 1 complex(GO:0000110) |
| 1.6 | 473.8 | GO:0030141 | secretory granule(GO:0030141) |
| 1.2 | 92.3 | GO:0008076 | voltage-gated potassium channel complex(GO:0008076) |
| 1.0 | 236.5 | GO:0005769 | early endosome(GO:0005769) |
| 1.0 | 211.1 | GO:0043209 | myelin sheath(GO:0043209) |
| 1.0 | 11.9 | GO:0042622 | photoreceptor outer segment membrane(GO:0042622) |
| 0.6 | 19.0 | GO:0002102 | podosome(GO:0002102) |
| 0.4 | 30.2 | GO:0031463 | Cul3-RING ubiquitin ligase complex(GO:0031463) |
| 0.4 | 152.3 | GO:0043025 | neuronal cell body(GO:0043025) |
| 0.4 | 324.5 | GO:0005887 | integral component of plasma membrane(GO:0005887) |
| 0.2 | 139.7 | GO:0016604 | nuclear body(GO:0016604) |
| 0.2 | 1059.5 | GO:0016021 | integral component of membrane(GO:0016021) |
| 0.2 | 205.2 | GO:0005615 | extracellular space(GO:0005615) |
| 0.2 | 255.3 | GO:0005886 | plasma membrane(GO:0005886) |
| 0.2 | 14.1 | GO:0000139 | Golgi membrane(GO:0000139) |
| 0.1 | 200.8 | GO:0005829 | cytosol(GO:0005829) |
Gene overrepresentation in molecular function category:
| Log-likelihood per target | Total log-likelihood | Term | Description |
|---|---|---|---|
| 90.0 | 449.8 | GO:1904315 | transmitter-gated ion channel activity involved in regulation of postsynaptic membrane potential(GO:1904315) |
| 79.3 | 238.0 | GO:0004971 | AMPA glutamate receptor activity(GO:0004971) |
| 65.2 | 195.6 | GO:0030977 | taurine binding(GO:0030977) |
| 63.2 | 189.5 | GO:0022852 | glycine-gated chloride ion channel activity(GO:0022852) |
| 61.4 | 307.0 | GO:0030348 | syntaxin-3 binding(GO:0030348) |
| 53.8 | 161.3 | GO:0005294 | neutral L-amino acid secondary active transmembrane transporter activity(GO:0005294) |
| 43.4 | 216.9 | GO:0004351 | glutamate decarboxylase activity(GO:0004351) |
| 42.2 | 211.1 | GO:0004969 | histamine receptor activity(GO:0004969) |
| 37.2 | 148.8 | GO:0099510 | calcium ion binding involved in regulation of cytosolic calcium ion concentration(GO:0099510) |
| 35.9 | 287.5 | GO:0008430 | selenium binding(GO:0008430) |
| 29.2 | 87.7 | GO:0004591 | oxoglutarate dehydrogenase (succinyl-transferring) activity(GO:0004591) |
| 27.4 | 192.1 | GO:0030250 | cyclase activator activity(GO:0010853) guanylate cyclase activator activity(GO:0030250) |
| 26.8 | 133.9 | GO:0004977 | melanocortin receptor activity(GO:0004977) |
| 24.2 | 314.2 | GO:0008649 | rRNA methyltransferase activity(GO:0008649) |
| 16.7 | 199.9 | GO:0015379 | potassium:chloride symporter activity(GO:0015379) potassium ion symporter activity(GO:0022820) |
| 15.4 | 231.2 | GO:0005313 | L-glutamate transmembrane transporter activity(GO:0005313) |
| 14.1 | 240.2 | GO:0022848 | acetylcholine-gated cation channel activity(GO:0022848) |
| 12.3 | 85.8 | GO:0008273 | calcium, potassium:sodium antiporter activity(GO:0008273) |
| 11.6 | 116.3 | GO:0038036 | sphingosine-1-phosphate receptor activity(GO:0038036) |
| 9.9 | 236.5 | GO:0005112 | Notch binding(GO:0005112) |
| 9.4 | 131.5 | GO:0033691 | sialic acid binding(GO:0033691) |
| 8.9 | 230.9 | GO:0005086 | ARF guanyl-nucleotide exchange factor activity(GO:0005086) |
| 7.0 | 175.3 | GO:0004890 | GABA-A receptor activity(GO:0004890) |
| 6.5 | 196.2 | GO:0005184 | neuropeptide hormone activity(GO:0005184) |
| 5.6 | 56.1 | GO:0005412 | glucose:sodium symporter activity(GO:0005412) |
| 5.2 | 165.2 | GO:0043539 | protein serine/threonine kinase activator activity(GO:0043539) |
| 4.7 | 14.1 | GO:0003976 | UDP-N-acetylglucosamine-lysosomal-enzyme N-acetylglucosaminephosphotransferase activity(GO:0003976) |
| 4.5 | 158.6 | GO:0001540 | beta-amyloid binding(GO:0001540) |
| 4.1 | 123.5 | GO:0017075 | syntaxin-1 binding(GO:0017075) |
| 3.8 | 26.9 | GO:0047391 | mu-type opioid receptor binding(GO:0031852) alkylglycerophosphoethanolamine phosphodiesterase activity(GO:0047391) |
| 3.2 | 73.6 | GO:0034237 | protein kinase A regulatory subunit binding(GO:0034237) |
| 3.2 | 92.3 | GO:0015269 | calcium-activated potassium channel activity(GO:0015269) |
| 3.0 | 383.8 | GO:0000149 | SNARE binding(GO:0000149) |
| 2.4 | 19.0 | GO:0071253 | connexin binding(GO:0071253) |
| 2.1 | 17.1 | GO:0005169 | neurotrophin TRKB receptor binding(GO:0005169) |
| 1.7 | 105.5 | GO:0048306 | calcium-dependent protein binding(GO:0048306) |
| 1.6 | 26.0 | GO:0051787 | misfolded protein binding(GO:0051787) |
| 1.4 | 60.5 | GO:0017112 | Rab guanyl-nucleotide exchange factor activity(GO:0017112) |
| 1.4 | 167.9 | GO:0004222 | metalloendopeptidase activity(GO:0004222) |
| 1.2 | 323.7 | GO:0008022 | protein C-terminus binding(GO:0008022) |
| 1.0 | 124.3 | GO:0005179 | hormone activity(GO:0005179) |
| 0.9 | 16.2 | GO:0015279 | store-operated calcium channel activity(GO:0015279) |
| 0.6 | 134.2 | GO:0003729 | mRNA binding(GO:0003729) poly(A) RNA binding(GO:0044822) |
| 0.3 | 28.0 | GO:0046332 | SMAD binding(GO:0046332) |
| 0.3 | 169.4 | GO:0005509 | calcium ion binding(GO:0005509) |
| 0.2 | 45.2 | GO:0016757 | transferase activity, transferring glycosyl groups(GO:0016757) |
| 0.1 | 121.8 | GO:0003723 | RNA binding(GO:0003723) |
| 0.0 | 20.7 | GO:0004674 | protein serine/threonine kinase activity(GO:0004674) |
| 0.0 | 33.2 | GO:0016491 | oxidoreductase activity(GO:0016491) |
Gene overrepresentation in curated gene sets: canonical pathways category:
| Log-likelihood per target | Total log-likelihood | Term | Description |
|---|---|---|---|
| 5.0 | 165.2 | PID LIS1 PATHWAY | Lissencephaly gene (LIS1) in neuronal migration and development |
| 4.8 | 238.0 | PID NCADHERIN PATHWAY | N-cadherin signaling events |
| 3.2 | 236.5 | PID NOTCH PATHWAY | Notch signaling pathway |
| 2.5 | 131.5 | PID INTEGRIN3 PATHWAY | Beta3 integrin cell surface interactions |
| 2.1 | 19.0 | ST STAT3 PATHWAY | STAT3 Pathway |
| 1.9 | 133.9 | PID IL4 2PATHWAY | IL4-mediated signaling events |
| 1.6 | 56.9 | ST WNT BETA CATENIN PATHWAY | Wnt/beta-catenin Pathway |
| 1.1 | 60.5 | PID CERAMIDE PATHWAY | Ceramide signaling pathway |
| 0.7 | 167.9 | NABA ECM REGULATORS | Genes encoding enzymes and their regulators involved in the remodeling of the extracellular matrix |
| 0.4 | 17.1 | PID AJDISS 2PATHWAY | Posttranslational regulation of adherens junction stability and dissassembly |
| 0.3 | 95.0 | NABA SECRETED FACTORS | Genes encoding secreted soluble factors |
Gene overrepresentation in curated gene sets: REACTOME pathways category:
| Log-likelihood per target | Total log-likelihood | Term | Description |
|---|---|---|---|
| 38.2 | 687.8 | REACTOME UNBLOCKING OF NMDA RECEPTOR GLUTAMATE BINDING AND ACTIVATION | Genes involved in Unblocking of NMDA receptor, glutamate binding and activation |
| 26.4 | 105.5 | REACTOME DOPAMINE NEUROTRANSMITTER RELEASE CYCLE | Genes involved in Dopamine Neurotransmitter Release Cycle |
| 20.0 | 240.2 | REACTOME PRESYNAPTIC NICOTINIC ACETYLCHOLINE RECEPTORS | Genes involved in Presynaptic nicotinic acetylcholine receptors |
| 13.8 | 385.1 | REACTOME LIGAND GATED ION CHANNEL TRANSPORT | Genes involved in Ligand-gated ion channel transport |
| 9.2 | 165.2 | REACTOME CRMPS IN SEMA3A SIGNALING | Genes involved in CRMPs in Sema3A signaling |
| 9.0 | 161.3 | REACTOME NA CL DEPENDENT NEUROTRANSMITTER TRANSPORTERS | Genes involved in Na+/Cl- dependent neurotransmitter transporters |
| 8.3 | 216.9 | REACTOME GABA SYNTHESIS RELEASE REUPTAKE AND DEGRADATION | Genes involved in GABA synthesis, release, reuptake and degradation |
| 7.9 | 236.5 | REACTOME ACTIVATED NOTCH1 TRANSMITS SIGNAL TO THE NUCLEUS | Genes involved in Activated NOTCH1 Transmits Signal to the Nucleus |
| 7.3 | 174.7 | REACTOME GLUCAGON TYPE LIGAND RECEPTORS | Genes involved in Glucagon-type ligand receptors |
| 6.0 | 167.9 | REACTOME DEGRADATION OF THE EXTRACELLULAR MATRIX | Genes involved in Degradation of the extracellular matrix |
| 5.4 | 150.5 | REACTOME RECYCLING PATHWAY OF L1 | Genes involved in Recycling pathway of L1 |
| 5.3 | 211.1 | REACTOME AMINE LIGAND BINDING RECEPTORS | Genes involved in Amine ligand-binding receptors |
| 4.8 | 517.0 | REACTOME TRANSPORT OF INORGANIC CATIONS ANIONS AND AMINO ACIDS OLIGOPEPTIDES | Genes involved in Transport of inorganic cations/anions and amino acids/oligopeptides |
| 4.5 | 133.9 | REACTOME G PROTEIN ACTIVATION | Genes involved in G-protein activation |
| 1.3 | 16.2 | REACTOME ELEVATION OF CYTOSOLIC CA2 LEVELS | Genes involved in Elevation of cytosolic Ca2+ levels |
| 0.9 | 211.1 | REACTOME ANTIGEN PROCESSING UBIQUITINATION PROTEASOME DEGRADATION | Genes involved in Antigen processing: Ubiquitination & Proteasome degradation |
| 0.3 | 26.0 | REACTOME RESPONSE TO ELEVATED PLATELET CYTOSOLIC CA2 | Genes involved in Response to elevated platelet cytosolic Ca2+ |
| 0.2 | 4.8 | REACTOME FORMATION OF INCISION COMPLEX IN GG NER | Genes involved in Formation of incision complex in GG-NER |
| 0.1 | 8.5 | REACTOME TRANSPORT OF GLUCOSE AND OTHER SUGARS BILE SALTS AND ORGANIC ACIDS METAL IONS AND AMINE COMPOUNDS | Genes involved in Transport of glucose and other sugars, bile salts and organic acids, metal ions and amine compounds |