Project
GSE53960: rat RNA-Seq transcriptomic Bodymap
Navigation
Downloads
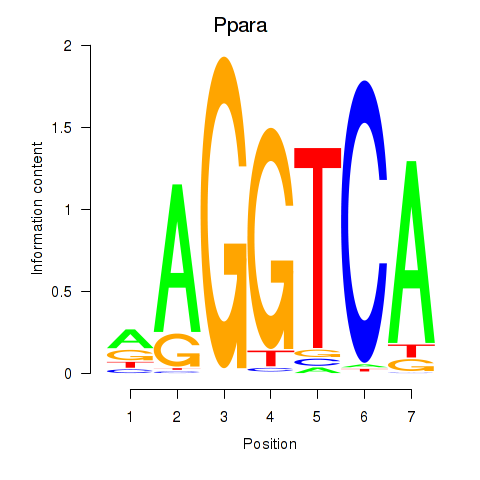
Results for Ppara
Z-value: 1.80
Motif logo
Transcription factors associated with Ppara
| Gene Symbol | Gene ID | Gene Info |
|---|---|---|
|
Ppara
|
ENSRNOG00000021463 | peroxisome proliferator activated receptor alpha |
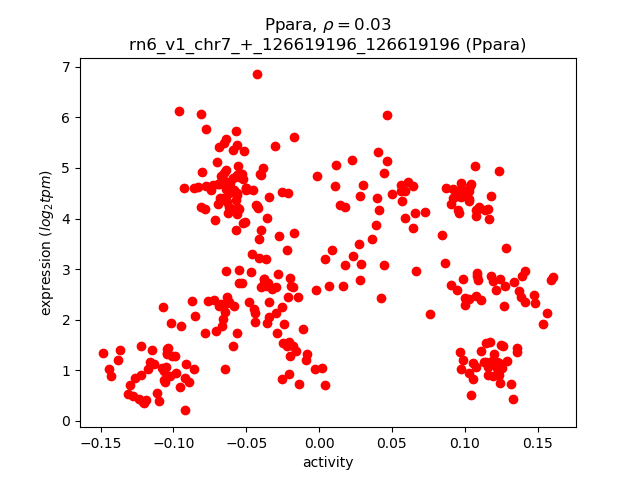
Activity-expression correlation:
| Gene | Promoter | Pearson corr. coef. | P-value | Plot |
|---|---|---|---|---|
| Ppara | rn6_v1_chr7_+_126619196_126619196 | 0.03 | 5.5e-01 | Click! |
Activity profile of Ppara motif
Sorted Z-values of Ppara motif
| Promoter | Log-likelihood | Transcript | Gene | Gene Info |
|---|---|---|---|---|
| chr17_-_66397653 | 106.59 |
ENSRNOT00000024098
|
Actn2
|
actinin alpha 2 |
| chr10_+_11240138 | 96.61 |
ENSRNOT00000048687
|
Srl
|
sarcalumenin |
| chr8_-_130429132 | 86.33 |
ENSRNOT00000026261
|
Hhatl
|
hedgehog acyltransferase-like |
| chr8_-_84522588 | 83.20 |
ENSRNOT00000076213
|
Mlip
|
muscular LMNA-interacting protein |
| chr15_+_33606124 | 76.61 |
ENSRNOT00000065210
|
AC115371.1
|
|
| chr19_-_56677084 | 74.11 |
ENSRNOT00000024084
|
Acta1
|
actin, alpha 1, skeletal muscle |
| chr7_-_80796670 | 73.16 |
ENSRNOT00000010539
|
Abra
|
actin-binding Rho activating protein |
| chr10_-_8498422 | 61.33 |
ENSRNOT00000082332
|
Rbfox1
|
RNA binding protein, fox-1 homolog 1 |
| chr8_-_84506328 | 60.26 |
ENSRNOT00000064754
|
Mlip
|
muscular LMNA-interacting protein |
| chr18_+_73564247 | 53.41 |
ENSRNOT00000077679
ENSRNOT00000035317 |
St8sia5
|
ST8 alpha-N-acetyl-neuraminide alpha-2,8-sialyltransferase 5 |
| chr17_+_32973695 | 52.70 |
ENSRNOT00000065674
|
RGD1565323
|
similar to OTTMUSP00000000621 |
| chr1_+_153861948 | 51.02 |
ENSRNOT00000087067
|
Me3
|
malic enzyme 3 |
| chr3_-_113525864 | 48.43 |
ENSRNOT00000046659
|
Frmd5
|
FERM domain containing 5 |
| chr14_+_26662965 | 47.68 |
ENSRNOT00000002621
|
Tecrl
|
trans-2,3-enoyl-CoA reductase-like |
| chr9_+_47536824 | 46.83 |
ENSRNOT00000049349
|
Tmem182
|
transmembrane protein 182 |
| chr3_+_168345152 | 44.71 |
ENSRNOT00000017654
|
Dok5
|
docking protein 5 |
| chr5_-_160179978 | 44.06 |
ENSRNOT00000022820
|
Slc25a34
|
solute carrier family 25, member 34 |
| chr3_-_159775643 | 43.86 |
ENSRNOT00000010939
|
Jph2
|
junctophilin 2 |
| chr3_+_113257688 | 43.56 |
ENSRNOT00000019320
|
Map1a
|
microtubule-associated protein 1A |
| chr8_+_48406260 | 42.71 |
ENSRNOT00000009975
|
Usp2
|
ubiquitin specific peptidase 2 |
| chr1_-_89488223 | 41.95 |
ENSRNOT00000028624
|
Fxyd1
|
FXYD domain-containing ion transport regulator 1 |
| chr15_-_27819376 | 41.91 |
ENSRNOT00000067400
|
A930018M24Rik
|
RIKEN cDNA A930018M24 gene |
| chr16_-_10941414 | 41.71 |
ENSRNOT00000086627
ENSRNOT00000085414 ENSRNOT00000081631 ENSRNOT00000087521 ENSRNOT00000083623 |
Ldb3
|
LIM domain binding 3 |
| chr9_+_81816872 | 40.88 |
ENSRNOT00000041407
|
Plcd4
|
phospholipase C, delta 4 |
| chr1_+_153861569 | 39.36 |
ENSRNOT00000023329
|
Me3
|
malic enzyme 3 |
| chr6_+_23337571 | 39.28 |
ENSRNOT00000011832
|
RGD1304963
|
similar to hypothetical protein MGC38716 |
| chr12_-_5822874 | 39.14 |
ENSRNOT00000075920
|
Fry
|
FRY microtubule binding protein |
| chr19_+_50848736 | 39.11 |
ENSRNOT00000077053
|
Cdh13
|
cadherin 13 |
| chrX_-_40086870 | 38.43 |
ENSRNOT00000010027
|
Smpx
|
small muscle protein, X-linked |
| chr10_-_109729019 | 38.18 |
ENSRNOT00000054959
|
Ppp1r27
|
protein phosphatase 1, regulatory subunit 27 |
| chr4_+_64088900 | 38.12 |
ENSRNOT00000075341
|
Chrm2
|
cholinergic receptor, muscarinic 2 |
| chr14_-_83741969 | 37.75 |
ENSRNOT00000026293
|
Inpp5j
|
inositol polyphosphate-5-phosphatase J |
| chr6_+_147876237 | 36.99 |
ENSRNOT00000056649
|
Tmem196
|
transmembrane protein 196 |
| chr10_+_39655455 | 36.90 |
ENSRNOT00000058817
|
Acsl6
|
acyl-CoA synthetase long-chain family member 6 |
| chr5_+_90338795 | 35.86 |
ENSRNOT00000077864
ENSRNOT00000058882 |
LOC298139
|
similar to RIKEN cDNA 2310003M01 |
| chr7_+_11356118 | 35.70 |
ENSRNOT00000041325
|
Atcay
|
ATCAY, caytaxin |
| chr1_-_81881549 | 34.98 |
ENSRNOT00000027497
|
Atp1a3
|
ATPase Na+/K+ transporting subunit alpha 3 |
| chr3_+_58632476 | 34.71 |
ENSRNOT00000010630
|
Rapgef4
|
Rap guanine nucleotide exchange factor 4 |
| chr1_+_224882439 | 34.46 |
ENSRNOT00000024785
|
Chrm1
|
cholinergic receptor, muscarinic 1 |
| chr4_-_157331905 | 34.43 |
ENSRNOT00000020647
|
Tpi1
|
triosephosphate isomerase 1 |
| chr9_+_20213776 | 33.81 |
ENSRNOT00000071439
|
LOC100911515
|
triosephosphate isomerase-like |
| chr6_+_28515025 | 33.70 |
ENSRNOT00000088033
ENSRNOT00000005317 ENSRNOT00000081141 |
Dnajc27
|
DnaJ heat shock protein family (Hsp40) member C27 |
| chr12_-_30566032 | 33.50 |
ENSRNOT00000093378
|
Gbas
|
glioblastoma amplified sequence |
| chr10_-_38782419 | 33.05 |
ENSRNOT00000073964
|
Uqcrq
|
ubiquinol-cytochrome c reductase, complex III subunit VII |
| chr12_-_44174583 | 32.00 |
ENSRNOT00000001490
|
Tesc
|
tescalcin |
| chr10_+_27973681 | 31.85 |
ENSRNOT00000004970
|
Gabrb2
|
gamma-aminobutyric acid type A receptor beta 2 subunit |
| chr5_+_173640780 | 31.82 |
ENSRNOT00000027476
|
Perm1
|
PPARGC1 and ESRR induced regulator, muscle 1 |
| chr1_+_72882806 | 31.58 |
ENSRNOT00000024640
|
Tnni3
|
troponin I3, cardiac type |
| chr5_+_118743632 | 31.43 |
ENSRNOT00000013785
|
Pgm1
|
phosphoglucomutase 1 |
| chr5_-_25584278 | 31.34 |
ENSRNOT00000090579
ENSRNOT00000090376 |
Pdp1
|
pyruvate dehyrogenase phosphatase catalytic subunit 1 |
| chr1_-_143398093 | 30.98 |
ENSRNOT00000078916
|
Fsd2
|
fibronectin type III and SPRY domain containing 2 |
| chr1_-_263269762 | 30.95 |
ENSRNOT00000022309
|
Got1
|
glutamic-oxaloacetic transaminase 1 |
| chr9_-_92291220 | 30.74 |
ENSRNOT00000093357
|
Dner
|
delta/notch-like EGF repeat containing |
| chr1_+_37507276 | 30.71 |
ENSRNOT00000047627
|
Adcy2
|
adenylate cyclase 2 |
| chr14_+_60764409 | 30.23 |
ENSRNOT00000005168
|
Lgi2
|
leucine-rich repeat LGI family, member 2 |
| chr13_+_52625441 | 29.79 |
ENSRNOT00000012095
|
Tnni1
|
troponin I1, slow skeletal type |
| chr10_-_102289837 | 29.57 |
ENSRNOT00000044922
|
AABR07030729.1
|
|
| chr1_-_170404056 | 29.23 |
ENSRNOT00000024402
|
Apbb1
|
amyloid beta precursor protein binding family B member 1 |
| chr10_-_27179900 | 28.80 |
ENSRNOT00000082445
|
Gabrg2
|
gamma-aminobutyric acid type A receptor gamma 2 subunit |
| chr6_+_126434226 | 28.66 |
ENSRNOT00000090857
|
Chga
|
chromogranin A |
| chr4_-_55398941 | 28.30 |
ENSRNOT00000075324
|
Grm8
|
glutamate metabotropic receptor 8 |
| chr7_+_121311024 | 28.25 |
ENSRNOT00000092260
ENSRNOT00000023066 ENSRNOT00000081377 |
Syngr1
|
synaptogyrin 1 |
| chr18_+_74156553 | 27.76 |
ENSRNOT00000022892
|
Atp5a1
|
ATP synthase, H+ transporting, mitochondrial F1 complex, alpha subunit 1, cardiac muscle |
| chr20_+_28572242 | 27.72 |
ENSRNOT00000072485
|
Sh3rf3
|
SH3 domain containing ring finger 3 |
| chr1_+_201117630 | 27.62 |
ENSRNOT00000077908
|
Tacc2
|
transforming, acidic coiled-coil containing protein 2 |
| chr2_+_119139717 | 27.42 |
ENSRNOT00000016051
|
Ndufb5
|
NADH:ubiquinone oxidoreductase subunit B5 |
| chr4_-_145948996 | 27.33 |
ENSRNOT00000043476
|
Atp2b2
|
ATPase plasma membrane Ca2+ transporting 2 |
| chr1_+_137799185 | 27.32 |
ENSRNOT00000083590
ENSRNOT00000092778 |
Agbl1
|
ATP/GTP binding protein-like 1 |
| chr7_-_74735650 | 27.18 |
ENSRNOT00000014407
|
Cox6c
|
cytochrome c oxidase subunit 6C |
| chr1_-_49844547 | 27.16 |
ENSRNOT00000086127
ENSRNOT00000077423 ENSRNOT00000089439 ENSRNOT00000090521 |
AABR07001519.1
|
|
| chr9_+_82741920 | 27.11 |
ENSRNOT00000027337
|
Slc4a3
|
solute carrier family 4 member 3 |
| chr10_-_15928169 | 27.06 |
ENSRNOT00000028069
|
Nsg2
|
neuron specific gene family member 2 |
| chr9_-_69953182 | 27.00 |
ENSRNOT00000015852
|
Ndufs1
|
NADH dehydrogenase (ubiquinone) Fe-S protein 1 |
| chr3_+_55910177 | 26.93 |
ENSRNOT00000009969
|
Klhl41
|
kelch-like family member 41 |
| chr1_-_219144610 | 26.58 |
ENSRNOT00000023526
|
Ndufs8
|
NADH:ubiquinone oxidoreductase core subunit S8 |
| chr1_+_197659187 | 26.30 |
ENSRNOT00000082228
|
LOC103690016
|
serine/threonine-protein kinase SBK1 |
| chr7_+_123102493 | 26.09 |
ENSRNOT00000038612
|
Aco2
|
aconitase 2 |
| chr11_+_80736576 | 26.05 |
ENSRNOT00000047678
|
Masp1
|
mannan-binding lectin serine peptidase 1 |
| chr8_+_116094851 | 26.04 |
ENSRNOT00000084120
|
RGD1307461
|
similar to RIKEN cDNA 6430571L13 gene; similar to g20 protein |
| chr1_-_88066101 | 25.94 |
ENSRNOT00000079473
ENSRNOT00000027893 |
Ryr1
|
ryanodine receptor 1 |
| chr8_-_55087832 | 25.85 |
ENSRNOT00000032152
|
Dlat
|
dihydrolipoamide S-acetyltransferase |
| chrX_+_53053609 | 25.76 |
ENSRNOT00000058357
|
Dmd
|
dystrophin |
| chr9_+_65478496 | 25.50 |
ENSRNOT00000016060
|
Ndufb3
|
NADH:ubiquinone oxidoreductase subunit B3 |
| chr8_+_59164572 | 25.43 |
ENSRNOT00000015102
|
Idh3a
|
isocitrate dehydrogenase 3 (NAD+) alpha |
| chrX_+_71342775 | 25.39 |
ENSRNOT00000004888
|
Itgb1bp2
|
integrin subunit beta 1 binding protein 2 |
| chr17_-_63994169 | 24.91 |
ENSRNOT00000075651
|
Chrm3
|
cholinergic receptor, muscarinic 3 |
| chr16_+_23553647 | 24.75 |
ENSRNOT00000041994
|
Psd3
|
pleckstrin and Sec7 domain containing 3 |
| chr4_-_80333326 | 24.64 |
ENSRNOT00000014058
|
LOC100363502
|
cytochrome c, somatic-like |
| chrX_+_77263359 | 24.60 |
ENSRNOT00000077604
|
Pgk1
|
phosphoglycerate kinase 1 |
| chr10_+_37724915 | 24.34 |
ENSRNOT00000008477
|
Vdac1
|
voltage-dependent anion channel 1 |
| chr19_-_37427989 | 24.16 |
ENSRNOT00000022863
|
Tppp3
|
tubulin polymerization-promoting protein family member 3 |
| chr20_+_31102476 | 24.06 |
ENSRNOT00000078719
|
Lrrc20
|
leucine rich repeat containing 20 |
| chr18_-_56331991 | 23.74 |
ENSRNOT00000085841
ENSRNOT00000091220 |
Slc6a7
|
solute carrier family 6 member 7 |
| chr5_+_140870140 | 23.46 |
ENSRNOT00000074347
|
Hpcal4
|
hippocalcin-like 4 |
| chr13_-_82758004 | 23.36 |
ENSRNOT00000003932
|
Atp1b1
|
ATPase Na+/K+ transporting subunit beta 1 |
| chr3_-_60813869 | 23.36 |
ENSRNOT00000058234
|
Atp5g3
|
ATP synthase, H+ transporting, mitochondrial Fo complex, subunit C3 (subunit 9) |
| chr3_+_48096954 | 23.22 |
ENSRNOT00000068238
ENSRNOT00000064344 ENSRNOT00000044638 |
Slc4a10
|
solute carrier family 4 member 10 |
| chr7_+_117409576 | 23.03 |
ENSRNOT00000017067
|
Cyc1
|
cytochrome c-1 |
| chr2_-_208420163 | 22.95 |
ENSRNOT00000021920
|
LOC100911417
|
ATP synthase subunit b, mitochondrial-like |
| chr4_+_51614676 | 22.87 |
ENSRNOT00000060494
|
Asb15
|
ankyrin repeat and SOCS box containing 15 |
| chr5_+_164808323 | 22.56 |
ENSRNOT00000011005
|
Nppa
|
natriuretic peptide A |
| chr4_+_49941304 | 22.43 |
ENSRNOT00000008719
|
Ptprz1
|
protein tyrosine phosphatase, receptor type Z1 |
| chr8_+_59900651 | 22.37 |
ENSRNOT00000020410
|
Tmem266
|
transmembrane protein 266 |
| chr2_+_210977938 | 22.35 |
ENSRNOT00000074725
|
Amigo1
|
adhesion molecule with Ig like domain 1 |
| chr7_+_35125424 | 21.82 |
ENSRNOT00000085978
ENSRNOT00000010117 |
Ndufa12
|
NADH:ubiquinone oxidoreductase subunit A12 |
| chr10_-_14056169 | 21.56 |
ENSRNOT00000017833
|
Syngr3
|
synaptogyrin 3 |
| chr10_-_90995982 | 21.45 |
ENSRNOT00000093266
|
Gfap
|
glial fibrillary acidic protein |
| chr1_-_222178725 | 21.45 |
ENSRNOT00000028697
|
Esrra
|
estrogen related receptor, alpha |
| chr10_-_83898527 | 21.41 |
ENSRNOT00000009815
|
Atp5g1
|
ATP synthase, H+ transporting, mitochondrial Fo complex, subunit C1 (subunit 9) |
| chrM_-_14061 | 21.28 |
ENSRNOT00000051268
|
Mt-nd6
|
mitochondrially encoded NADH dehydrogenase 6 |
| chr13_+_51034256 | 21.14 |
ENSRNOT00000004528
ENSRNOT00000046854 ENSRNOT00000087320 |
Mybph
|
myosin binding protein H |
| chr3_-_92969050 | 21.11 |
ENSRNOT00000088242
|
Pdhx
|
pyruvate dehydrogenase complex, component X |
| chr10_-_56624526 | 21.05 |
ENSRNOT00000024973
|
Acadvl
|
acyl-CoA dehydrogenase, very long chain |
| chr4_+_35279063 | 20.99 |
ENSRNOT00000011833
|
Nxph1
|
neurexophilin 1 |
| chr14_+_2325308 | 20.81 |
ENSRNOT00000000072
|
Atp5i
|
ATP synthase, H+ transporting, mitochondrial Fo complex, subunit E |
| chr10_+_109658032 | 20.70 |
ENSRNOT00000054965
|
Mrpl12
|
mitochondrial ribosomal protein L12 |
| chr5_+_159484370 | 20.59 |
ENSRNOT00000010593
|
Sdhb
|
succinate dehydrogenase complex iron sulfur subunit B |
| chr16_+_3293599 | 20.56 |
ENSRNOT00000081999
ENSRNOT00000047118 ENSRNOT00000020427 |
Erc2
|
ELKS/RAB6-interacting/CAST family member 2 |
| chr15_-_4026637 | 20.43 |
ENSRNOT00000012372
|
Chchd1
|
coiled-coil-helix-coiled-coil-helix domain containing 1 |
| chr3_+_58164931 | 20.17 |
ENSRNOT00000002078
|
Dlx1
|
distal-less homeobox 1 |
| chr1_+_268189277 | 20.13 |
ENSRNOT00000065001
|
Sorcs3
|
sortilin-related VPS10 domain containing receptor 3 |
| chr8_-_23099042 | 20.02 |
ENSRNOT00000019115
|
Ecsit
|
ECSIT signalling integrator |
| chr12_-_44520341 | 19.88 |
ENSRNOT00000066810
|
Nos1
|
nitric oxide synthase 1 |
| chr7_-_121029754 | 19.86 |
ENSRNOT00000004703
|
Nptxr
|
neuronal pentraxin receptor |
| chr11_-_71757801 | 19.63 |
ENSRNOT00000029572
|
Smco1
|
single-pass membrane protein with coiled-coil domains 1 |
| chr5_-_134927235 | 19.62 |
ENSRNOT00000016751
|
Uqcrh
|
ubiquinol-cytochrome c reductase hinge protein |
| chr3_+_177226417 | 19.48 |
ENSRNOT00000031328
|
Oprl1
|
opioid related nociceptin receptor 1 |
| chrM_+_14136 | 19.42 |
ENSRNOT00000042098
|
Mt-cyb
|
mitochondrially encoded cytochrome b |
| chr10_+_11146359 | 19.39 |
ENSRNOT00000006314
|
Pam16
|
presequence translocase associated motor 16 homolog |
| chr8_+_55037750 | 19.39 |
ENSRNOT00000013188
|
Timm8b
|
translocase of inner mitochondrial membrane 8 homolog B |
| chr10_-_62698541 | 19.26 |
ENSRNOT00000019759
|
Coro6
|
coronin 6 |
| chr2_-_14701903 | 19.25 |
ENSRNOT00000051895
|
Cox7c
|
cytochrome c oxidase subunit 7C |
| chr20_-_4489281 | 19.24 |
ENSRNOT00000031548
|
Cyp21a1
|
cytochrome P450, family 21, subfamily a, polypeptide 1 |
| chr13_-_85622314 | 19.15 |
ENSRNOT00000005719
|
Mgst3
|
microsomal glutathione S-transferase 3 |
| chr2_+_66940057 | 19.12 |
ENSRNOT00000043050
|
Cdh9
|
cadherin 9 |
| chr5_-_138545404 | 19.11 |
ENSRNOT00000011586
|
Rimkla
|
ribosomal modification protein rimK-like family member A |
| chr1_+_31264755 | 18.86 |
ENSRNOT00000028988
|
LOC679739
|
NADH dehydrogenase (ubiquinone) Fe-S protein 6 |
| chr1_+_222519615 | 18.77 |
ENSRNOT00000083585
|
Rcor2
|
REST corepressor 2 |
| chr5_+_74766636 | 18.73 |
ENSRNOT00000030913
|
Rn50_5_0791.1
|
|
| chr6_+_83083740 | 18.65 |
ENSRNOT00000007600
|
Lrfn5
|
leucine rich repeat and fibronectin type III domain containing 5 |
| chr12_+_42097626 | 18.45 |
ENSRNOT00000001893
|
Tbx5
|
T-box 5 |
| chr2_-_178389608 | 18.29 |
ENSRNOT00000013262
|
Etfdh
|
electron transfer flavoprotein dehydrogenase |
| chr10_+_82775691 | 18.27 |
ENSRNOT00000030737
|
Hils1
|
histone linker H1 domain, spermatid-specific 1 |
| chr1_-_80630038 | 18.21 |
ENSRNOT00000025281
|
Tomm40
|
translocase of outer mitochondrial membrane 40 |
| chr4_+_113968995 | 17.91 |
ENSRNOT00000079511
|
Rtkn
|
rhotekin |
| chr2_-_119140110 | 17.89 |
ENSRNOT00000058810
|
AABR07009978.1
|
|
| chr3_+_131351587 | 17.76 |
ENSRNOT00000010835
|
Btbd3
|
BTB domain containing 3 |
| chr4_+_49369296 | 17.69 |
ENSRNOT00000007822
|
Wnt16
|
wingless-type MMTV integration site family, member 16 |
| chr18_-_29587760 | 17.66 |
ENSRNOT00000023811
|
Ndufa2
|
NADH:ubiquinone oxidoreductase subunit A2 |
| chr5_-_130085838 | 17.66 |
ENSRNOT00000035252
|
Elavl4
|
ELAV like RNA binding protein 4 |
| chr10_-_50574539 | 17.51 |
ENSRNOT00000034261
|
Cox10
|
COX10 heme A:farnesyltransferase cytochrome c oxidase assembly factor |
| chr4_-_55407922 | 17.40 |
ENSRNOT00000031714
|
Grm8
|
glutamate metabotropic receptor 8 |
| chr15_-_93307420 | 17.31 |
ENSRNOT00000012195
|
Slitrk1
|
SLIT and NTRK-like family, member 1 |
| chr1_+_215609036 | 17.30 |
ENSRNOT00000076187
|
Tnni2
|
troponin I2, fast skeletal type |
| chr8_+_29453643 | 17.16 |
ENSRNOT00000090643
|
Opcml
|
opioid binding protein/cell adhesion molecule-like |
| chr8_+_117679278 | 17.07 |
ENSRNOT00000042114
|
Uqcrc1
|
ubiquinol-cytochrome c reductase core protein I |
| chr8_-_130491998 | 17.06 |
ENSRNOT00000064114
|
Higd1a
|
HIG1 hypoxia inducible domain family, member 1A |
| chrX_+_53360839 | 17.00 |
ENSRNOT00000091467
ENSRNOT00000034372 ENSRNOT00000081061 |
Dmd
|
dystrophin |
| chr6_+_109110534 | 16.90 |
ENSRNOT00000009156
|
Zc2hc1c
|
zinc finger, C2HC-type containing 1C |
| chr4_+_138269142 | 16.82 |
ENSRNOT00000007788
|
Cntn4
|
contactin 4 |
| chr20_+_5815837 | 16.80 |
ENSRNOT00000036999
|
Lhfpl5
|
lipoma HMGIC fusion partner-like 5 |
| chr2_-_140464607 | 16.37 |
ENSRNOT00000058190
|
Ndufc1
|
NADH:ubiquinone oxidoreductase subunit C1 |
| chrX_+_37579957 | 16.26 |
ENSRNOT00000008509
|
Eif1ax
|
eukaryotic translation initiation factor 1A, X-linked |
| chr5_-_58163584 | 16.22 |
ENSRNOT00000060594
|
Ccl27
|
C-C motif chemokine ligand 27 |
| chr1_-_64175099 | 16.19 |
ENSRNOT00000091288
|
Ndufa3
|
NADH:ubiquinone oxidoreductase subunit A3 |
| chr4_-_157381105 | 15.95 |
ENSRNOT00000021670
|
Gpr162
|
G protein-coupled receptor 162 |
| chr14_-_84937725 | 15.80 |
ENSRNOT00000083839
|
Uqcr10
|
ubiquinol-cytochrome c reductase, complex III subunit X |
| chr19_-_10596851 | 15.72 |
ENSRNOT00000021716
|
Coq9
|
coenzyme Q9 |
| chr17_+_13670520 | 15.71 |
ENSRNOT00000019442
|
Shc3
|
SHC adaptor protein 3 |
| chr1_+_255186728 | 15.63 |
ENSRNOT00000086991
|
Hectd2
|
HECT domain E3 ubiquitin protein ligase 2 |
| chr13_-_93677377 | 15.59 |
ENSRNOT00000004917
|
Fh
|
fumarate hydratase |
| chrM_+_3904 | 15.59 |
ENSRNOT00000040993
|
Mt-nd2
|
mitochondrially encoded NADH dehydrogenase 2 |
| chr1_+_220335254 | 15.50 |
ENSRNOT00000072261
|
Rin1
|
Ras and Rab interactor 1 |
| chr18_-_55891710 | 15.49 |
ENSRNOT00000064686
|
Synpo
|
synaptopodin |
| chr19_-_37440471 | 15.45 |
ENSRNOT00000066636
|
Zdhhc1
|
zinc finger, DHHC-type containing 1 |
| chr17_+_12310214 | 15.29 |
ENSRNOT00000015786
|
Auh
|
AU RNA binding methylglutaconyl-CoA hydratase |
| chr9_+_82571269 | 15.26 |
ENSRNOT00000026941
|
Speg
|
SPEG complex locus |
| chr1_-_183763664 | 15.25 |
ENSRNOT00000044231
|
LOC691427
|
similar to 6.8 kDa mitochondrial proteolipid |
| chr6_+_106496992 | 15.08 |
ENSRNOT00000086136
ENSRNOT00000058181 |
Rgs6
|
regulator of G-protein signaling 6 |
| chr10_-_56403188 | 15.05 |
ENSRNOT00000019947
|
Chrnb1
|
cholinergic receptor nicotinic beta 1 subunit |
| chr19_+_54245950 | 15.01 |
ENSRNOT00000024033
|
Cox4i1
|
cytochrome c oxidase subunit 4i1 |
| chr7_-_117267803 | 14.82 |
ENSRNOT00000082271
|
Plec
|
plectin |
| chr2_+_209840404 | 14.56 |
ENSRNOT00000050149
|
Kcna2
|
potassium voltage-gated channel subfamily A member 2 |
| chr2_+_95045034 | 14.56 |
ENSRNOT00000081305
|
Mrps28
|
mitochondrial ribosomal protein S28 |
| chr18_+_15467870 | 14.49 |
ENSRNOT00000091696
|
B4galt6
|
beta-1,4-galactosyltransferase 6 |
| chr1_-_16203838 | 14.41 |
ENSRNOT00000018556
ENSRNOT00000078586 |
Pde7b
|
phosphodiesterase 7B |
| chr7_+_141326950 | 14.37 |
ENSRNOT00000084075
|
Asic1
|
acid sensing ion channel subunit 1 |
| chr1_+_101687855 | 14.35 |
ENSRNOT00000028546
ENSRNOT00000091597 |
Dbp
|
D-box binding PAR bZIP transcription factor |
| chr10_+_56381813 | 14.34 |
ENSRNOT00000019687
|
Zbtb4
|
zinc finger and BTB domain containing 4 |
| chr1_+_220428481 | 14.29 |
ENSRNOT00000027335
|
LOC108348044
|
ras and Rab interactor 1 |
| chr1_+_97632473 | 14.29 |
ENSRNOT00000023671
|
Vstm2b
|
V-set and transmembrane domain containing 2B |
| chr1_-_64350338 | 14.12 |
ENSRNOT00000078444
|
Cacng8
|
calcium voltage-gated channel auxiliary subunit gamma 8 |
| chr10_+_85257876 | 14.08 |
ENSRNOT00000014752
|
Mrpl45
|
mitochondrial ribosomal protein L45 |
| chr3_-_81304181 | 14.00 |
ENSRNOT00000079746
|
Mapk8ip1
|
mitogen-activated protein kinase 8 interacting protein 1 |
| chr16_+_23668595 | 13.94 |
ENSRNOT00000067886
|
Psd3
|
pleckstrin and Sec7 domain containing 3 |
| chr6_-_136550371 | 13.93 |
ENSRNOT00000065971
|
Rd3l
|
retinal degeneration 3-like |
| chr1_+_101884276 | 13.80 |
ENSRNOT00000082917
|
Tmem143
|
transmembrane protein 143 |
| chr1_-_222350173 | 13.76 |
ENSRNOT00000030625
|
Flrt1
|
fibronectin leucine rich transmembrane protein 1 |
| chr1_-_88826302 | 13.34 |
ENSRNOT00000028275
|
Lrfn3
|
leucine rich repeat and fibronectin type III domain containing 3 |
| chr15_+_61662264 | 13.15 |
ENSRNOT00000072969
|
Mtrf1
|
mitochondrial translation release factor 1 |
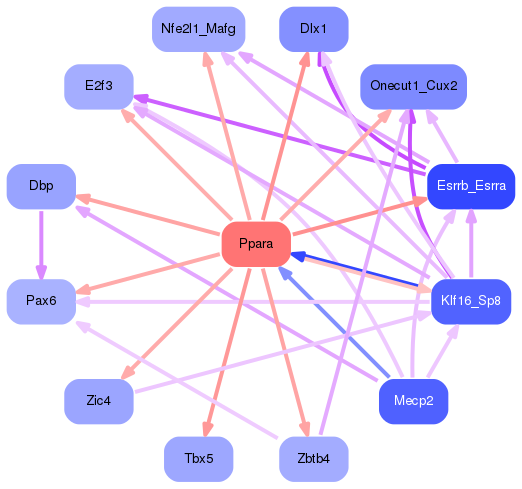
Network of associatons between targets according to the STRING database.

First level regulatory network of Ppara
Gene Ontology Analysis
Gene overrepresentation in biological process category:
| Log-likelihood per target | Total log-likelihood | Term | Description |
|---|---|---|---|
| 35.5 | 106.6 | GO:2001137 | actin filament uncapping(GO:0051695) phospholipase C-activating angiotensin-activated signaling pathway(GO:0086097) positive regulation of endocytic recycling(GO:2001137) |
| 24.2 | 96.6 | GO:0014873 | response to muscle activity involved in regulation of muscle adaptation(GO:0014873) |
| 19.5 | 97.5 | GO:0007197 | adenylate cyclase-inhibiting G-protein coupled acetylcholine receptor signaling pathway(GO:0007197) phospholipase C-activating G-protein coupled acetylcholine receptor signaling pathway(GO:0007207) |
| 18.5 | 74.1 | GO:0030240 | skeletal muscle thin filament assembly(GO:0030240) |
| 17.4 | 34.7 | GO:1904457 | positive regulation of neuronal action potential(GO:1904457) |
| 15.5 | 46.5 | GO:0006106 | fumarate metabolic process(GO:0006106) |
| 14.4 | 86.3 | GO:1903059 | regulation of protein lipidation(GO:1903059) |
| 14.3 | 42.8 | GO:0021629 | muscle attachment(GO:0016203) olfactory nerve morphogenesis(GO:0021627) olfactory nerve structural organization(GO:0021629) |
| 13.1 | 65.3 | GO:1903278 | positive regulation of sodium ion export(GO:1903275) positive regulation of sodium ion export from cell(GO:1903278) |
| 12.3 | 36.9 | GO:0010747 | positive regulation of plasma membrane long-chain fatty acid transport(GO:0010747) |
| 11.9 | 35.7 | GO:0045763 | negative regulation of cellular amino acid metabolic process(GO:0045763) |
| 11.0 | 33.0 | GO:0021539 | subthalamus development(GO:0021539) |
| 10.7 | 32.0 | GO:0032417 | positive regulation of sodium:proton antiporter activity(GO:0032417) |
| 9.9 | 19.9 | GO:1901204 | regulation of adrenergic receptor signaling pathway involved in heart process(GO:1901204) |
| 9.8 | 39.1 | GO:1904428 | negative regulation of tubulin deacetylation(GO:1904428) |
| 9.6 | 28.7 | GO:1901079 | positive regulation of relaxation of muscle(GO:1901079) |
| 8.8 | 35.1 | GO:0042776 | mitochondrial ATP synthesis coupled proton transport(GO:0042776) |
| 8.6 | 51.5 | GO:0006102 | isocitrate metabolic process(GO:0006102) |
| 8.2 | 90.4 | GO:0006108 | malate metabolic process(GO:0006108) |
| 7.5 | 22.6 | GO:1902304 | positive regulation of potassium ion export(GO:1902304) |
| 7.3 | 80.7 | GO:0006122 | mitochondrial electron transport, ubiquinol to cytochrome c(GO:0006122) |
| 7.0 | 35.0 | GO:0036376 | sodium ion export from cell(GO:0036376) |
| 6.9 | 34.4 | GO:0019563 | glycerol catabolic process(GO:0019563) |
| 6.7 | 20.2 | GO:0021882 | regulation of transcription from RNA polymerase II promoter involved in forebrain neuron fate commitment(GO:0021882) commitment of multipotent stem cells to neuronal lineage in forebrain(GO:0021898) |
| 6.3 | 19.0 | GO:0006121 | mitochondrial electron transport, succinate to ubiquinone(GO:0006121) |
| 6.3 | 43.9 | GO:0060316 | positive regulation of ryanodine-sensitive calcium-release channel activity(GO:0060316) |
| 6.2 | 12.4 | GO:0003350 | pulmonary myocardium development(GO:0003350) |
| 5.6 | 22.4 | GO:0036135 | Schwann cell migration(GO:0036135) regulation of Schwann cell migration(GO:1900147) |
| 5.4 | 10.9 | GO:0099543 | retrograde trans-synaptic signaling by soluble gas(GO:0098923) trans-synaptic signaling by soluble gas(GO:0099543) |
| 5.4 | 32.4 | GO:1904714 | positive regulation of Schwann cell proliferation(GO:0010625) regulation of chaperone-mediated autophagy(GO:1904714) |
| 5.0 | 130.9 | GO:0010614 | negative regulation of cardiac muscle hypertrophy(GO:0010614) |
| 5.0 | 123.9 | GO:0015985 | energy coupled proton transport, down electrochemical gradient(GO:0015985) ATP synthesis coupled proton transport(GO:0015986) |
| 4.9 | 39.3 | GO:1903546 | protein localization to photoreceptor outer segment(GO:1903546) |
| 4.9 | 39.1 | GO:0055096 | lipoprotein particle mediated signaling(GO:0055095) low-density lipoprotein particle mediated signaling(GO:0055096) |
| 4.9 | 9.7 | GO:1903070 | negative regulation of ER-associated ubiquitin-dependent protein catabolic process(GO:1903070) |
| 4.6 | 27.3 | GO:0035609 | C-terminal protein deglutamylation(GO:0035609) |
| 4.4 | 8.8 | GO:0043134 | hindgut contraction(GO:0043133) regulation of hindgut contraction(GO:0043134) |
| 4.4 | 13.1 | GO:2000546 | positive regulation of cell chemotaxis to fibroblast growth factor(GO:1904849) positive regulation of endothelial cell chemotaxis to fibroblast growth factor(GO:2000546) |
| 4.3 | 25.9 | GO:0071313 | cellular response to caffeine(GO:0071313) |
| 4.2 | 58.9 | GO:0071420 | cellular response to histamine(GO:0071420) |
| 4.2 | 12.5 | GO:0021740 | trigeminal sensory nucleus development(GO:0021730) principal sensory nucleus of trigeminal nerve development(GO:0021740) |
| 4.1 | 16.6 | GO:1904059 | regulation of locomotor rhythm(GO:1904059) |
| 4.1 | 12.4 | GO:2001160 | regulation of histone H3-K79 methylation(GO:2001160) |
| 4.1 | 44.9 | GO:0007196 | adenylate cyclase-inhibiting G-protein coupled glutamate receptor signaling pathway(GO:0007196) |
| 4.1 | 12.2 | GO:1904937 | pancreatic A cell development(GO:0003322) forebrain-midbrain boundary formation(GO:0021905) somatic motor neuron fate commitment(GO:0021917) regulation of transcription from RNA polymerase II promoter involved in somatic motor neuron fate commitment(GO:0021918) sensory neuron migration(GO:1904937) |
| 3.9 | 31.4 | GO:0019388 | galactose catabolic process(GO:0019388) |
| 3.9 | 11.7 | GO:0071691 | cardiac muscle thin filament assembly(GO:0071691) |
| 3.9 | 15.5 | GO:0098886 | modification of dendritic spine(GO:0098886) |
| 3.7 | 18.4 | GO:0003166 | bundle of His development(GO:0003166) |
| 3.7 | 88.3 | GO:2001014 | regulation of skeletal muscle cell differentiation(GO:2001014) |
| 3.6 | 39.3 | GO:0033539 | fatty acid beta-oxidation using acyl-CoA dehydrogenase(GO:0033539) |
| 3.5 | 10.4 | GO:0015864 | pyrimidine nucleoside transport(GO:0015864) |
| 3.4 | 27.3 | GO:0048840 | otolith development(GO:0048840) |
| 3.4 | 47.0 | GO:0006086 | acetyl-CoA biosynthetic process from pyruvate(GO:0006086) |
| 3.3 | 62.6 | GO:0045475 | locomotor rhythm(GO:0045475) |
| 3.2 | 9.5 | GO:0030091 | protein repair(GO:0030091) |
| 3.1 | 30.7 | GO:0007220 | Notch receptor processing(GO:0007220) |
| 3.0 | 29.8 | GO:0014883 | transition between fast and slow fiber(GO:0014883) |
| 2.9 | 17.4 | GO:0021633 | optic nerve structural organization(GO:0021633) |
| 2.8 | 47.7 | GO:0042761 | very long-chain fatty acid biosynthetic process(GO:0042761) |
| 2.8 | 44.7 | GO:0051386 | regulation of neurotrophin TRK receptor signaling pathway(GO:0051386) |
| 2.7 | 16.2 | GO:0071677 | positive regulation of mononuclear cell migration(GO:0071677) |
| 2.7 | 43.2 | GO:0030150 | protein import into mitochondrial matrix(GO:0030150) |
| 2.7 | 10.7 | GO:0010615 | positive regulation of cardiac muscle adaptation(GO:0010615) regulation of cardiac muscle hypertrophy in response to stress(GO:1903242) positive regulation of cardiac muscle hypertrophy in response to stress(GO:1903244) |
| 2.6 | 31.6 | GO:0010882 | regulation of cardiac muscle contraction by calcium ion signaling(GO:0010882) |
| 2.5 | 7.6 | GO:0060086 | circadian temperature homeostasis(GO:0060086) |
| 2.5 | 12.3 | GO:0006556 | S-adenosylmethionine biosynthetic process(GO:0006556) |
| 2.4 | 159.7 | GO:0022900 | electron transport chain(GO:0022900) |
| 2.4 | 23.7 | GO:0035524 | proline transmembrane transport(GO:0035524) |
| 2.4 | 77.7 | GO:0035025 | positive regulation of Rho protein signal transduction(GO:0035025) |
| 2.3 | 21.1 | GO:0071688 | striated muscle myosin thick filament assembly(GO:0071688) |
| 2.2 | 15.5 | GO:0031914 | negative regulation of synaptic plasticity(GO:0031914) |
| 2.2 | 6.6 | GO:0009644 | response to high light intensity(GO:0009644) |
| 2.2 | 30.7 | GO:1904322 | response to forskolin(GO:1904321) cellular response to forskolin(GO:1904322) |
| 2.2 | 11.0 | GO:0015793 | glycerol transport(GO:0015793) |
| 2.2 | 10.9 | GO:0044861 | protein transport into plasma membrane raft(GO:0044861) |
| 2.1 | 27.6 | GO:0022027 | interkinetic nuclear migration(GO:0022027) |
| 2.1 | 14.4 | GO:0050915 | sensory perception of sour taste(GO:0050915) |
| 2.0 | 5.9 | GO:1903542 | negative regulation of exosomal secretion(GO:1903542) |
| 2.0 | 11.8 | GO:0032914 | positive regulation of transforming growth factor beta1 production(GO:0032914) |
| 1.9 | 26.9 | GO:0006851 | mitochondrial calcium ion transport(GO:0006851) |
| 1.9 | 11.4 | GO:0086047 | regulation of ventricular cardiac muscle cell membrane depolarization(GO:0060373) membrane depolarization during Purkinje myocyte cell action potential(GO:0086047) membrane depolarization during bundle of His cell action potential(GO:0086048) membrane depolarization during atrial cardiac muscle cell action potential(GO:0098912) |
| 1.8 | 5.5 | GO:0090164 | asymmetric Golgi ribbon formation(GO:0090164) |
| 1.8 | 9.1 | GO:0051596 | methylglyoxal catabolic process to D-lactate via S-lactoyl-glutathione(GO:0019243) methylglyoxal catabolic process(GO:0051596) methylglyoxal catabolic process to lactate(GO:0061727) |
| 1.8 | 27.3 | GO:0035970 | peptidyl-threonine dephosphorylation(GO:0035970) |
| 1.8 | 39.2 | GO:0097503 | sialylation(GO:0097503) |
| 1.8 | 8.8 | GO:0060478 | acrosomal vesicle exocytosis(GO:0060478) |
| 1.7 | 14.0 | GO:0007258 | JUN phosphorylation(GO:0007258) |
| 1.7 | 5.2 | GO:0014826 | vein smooth muscle contraction(GO:0014826) |
| 1.7 | 15.3 | GO:0070601 | centromeric sister chromatid cohesion(GO:0070601) |
| 1.7 | 21.9 | GO:0006390 | transcription from mitochondrial promoter(GO:0006390) |
| 1.7 | 10.1 | GO:0090403 | oxidative stress-induced premature senescence(GO:0090403) |
| 1.7 | 10.0 | GO:0015074 | DNA integration(GO:0015074) |
| 1.6 | 11.3 | GO:0000160 | phosphorelay signal transduction system(GO:0000160) |
| 1.6 | 38.2 | GO:0032012 | regulation of ARF protein signal transduction(GO:0032012) |
| 1.6 | 31.8 | GO:0014850 | response to muscle activity(GO:0014850) |
| 1.5 | 12.1 | GO:0060385 | axonogenesis involved in innervation(GO:0060385) |
| 1.5 | 4.5 | GO:0033552 | response to vitamin B3(GO:0033552) |
| 1.5 | 6.0 | GO:0070940 | dephosphorylation of RNA polymerase II C-terminal domain(GO:0070940) |
| 1.5 | 28.3 | GO:0048172 | regulation of short-term neuronal synaptic plasticity(GO:0048172) |
| 1.5 | 19.2 | GO:0042448 | progesterone metabolic process(GO:0042448) |
| 1.5 | 7.4 | GO:0001579 | medium-chain fatty acid transport(GO:0001579) |
| 1.5 | 2.9 | GO:0072076 | nephrogenic mesenchyme development(GO:0072076) |
| 1.5 | 11.7 | GO:1901897 | regulation of relaxation of cardiac muscle(GO:1901897) |
| 1.5 | 11.6 | GO:2000346 | negative regulation of hepatocyte proliferation(GO:2000346) |
| 1.4 | 2.9 | GO:1903286 | regulation of potassium ion import(GO:1903286) |
| 1.4 | 5.7 | GO:1901906 | diadenosine polyphosphate catabolic process(GO:0015961) diphosphoinositol polyphosphate metabolic process(GO:0071543) diadenosine pentaphosphate metabolic process(GO:1901906) diadenosine pentaphosphate catabolic process(GO:1901907) diadenosine hexaphosphate metabolic process(GO:1901908) diadenosine hexaphosphate catabolic process(GO:1901909) adenosine 5'-(hexahydrogen pentaphosphate) metabolic process(GO:1901910) adenosine 5'-(hexahydrogen pentaphosphate) catabolic process(GO:1901911) |
| 1.4 | 27.0 | GO:0031581 | hemidesmosome assembly(GO:0031581) |
| 1.4 | 28.4 | GO:0019682 | pentose-phosphate shunt(GO:0006098) glyceraldehyde-3-phosphate metabolic process(GO:0019682) |
| 1.4 | 7.1 | GO:0000957 | mitochondrial RNA catabolic process(GO:0000957) regulation of mitochondrial RNA catabolic process(GO:0000960) |
| 1.4 | 37.8 | GO:0046856 | phosphatidylinositol dephosphorylation(GO:0046856) |
| 1.4 | 41.7 | GO:0045214 | sarcomere organization(GO:0045214) |
| 1.4 | 5.5 | GO:0019042 | viral latency(GO:0019042) release from viral latency(GO:0019046) |
| 1.4 | 16.4 | GO:0045916 | negative regulation of complement activation(GO:0045916) negative regulation of protein activation cascade(GO:2000258) |
| 1.4 | 9.5 | GO:0043951 | negative regulation of cAMP-mediated signaling(GO:0043951) |
| 1.4 | 12.2 | GO:0035879 | plasma membrane lactate transport(GO:0035879) |
| 1.3 | 14.5 | GO:0006688 | glycosphingolipid biosynthetic process(GO:0006688) |
| 1.3 | 16.8 | GO:0060088 | auditory receptor cell stereocilium organization(GO:0060088) |
| 1.3 | 23.2 | GO:0021860 | pyramidal neuron development(GO:0021860) |
| 1.3 | 7.5 | GO:0060528 | secretory columnal luminar epithelial cell differentiation involved in prostate glandular acinus development(GO:0060528) |
| 1.2 | 11.1 | GO:0070345 | negative regulation of fat cell proliferation(GO:0070345) |
| 1.2 | 10.9 | GO:0006527 | arginine catabolic process(GO:0006527) |
| 1.2 | 17.5 | GO:0008535 | respiratory chain complex IV assembly(GO:0008535) |
| 1.2 | 15.1 | GO:0035095 | behavioral response to nicotine(GO:0035095) |
| 1.2 | 6.9 | GO:0060723 | regulation of spongiotrophoblast cell proliferation(GO:0060721) regulation of cell proliferation involved in embryonic placenta development(GO:0060723) |
| 1.1 | 11.5 | GO:1901642 | nucleoside transmembrane transport(GO:1901642) |
| 1.1 | 17.1 | GO:0010257 | NADH dehydrogenase complex assembly(GO:0010257) mitochondrial respiratory chain complex I assembly(GO:0032981) mitochondrial respiratory chain complex I biogenesis(GO:0097031) |
| 1.1 | 4.5 | GO:0090074 | negative regulation of protein homodimerization activity(GO:0090074) |
| 1.1 | 12.3 | GO:0000338 | protein deneddylation(GO:0000338) |
| 1.1 | 2.2 | GO:0032510 | endosome to lysosome transport via multivesicular body sorting pathway(GO:0032510) |
| 1.1 | 32.5 | GO:0007413 | axonal fasciculation(GO:0007413) |
| 1.1 | 40.9 | GO:0007340 | acrosome reaction(GO:0007340) |
| 1.1 | 10.6 | GO:1902993 | positive regulation of beta-amyloid formation(GO:1902004) positive regulation of amyloid precursor protein catabolic process(GO:1902993) |
| 1.0 | 20.1 | GO:1900452 | regulation of long term synaptic depression(GO:1900452) |
| 1.0 | 1.0 | GO:0072709 | cellular response to sorbitol(GO:0072709) |
| 1.0 | 3.0 | GO:2000015 | regulation of determination of dorsal identity(GO:2000015) |
| 1.0 | 3.0 | GO:0010796 | regulation of multivesicular body size(GO:0010796) |
| 1.0 | 3.9 | GO:0060315 | negative regulation of ryanodine-sensitive calcium-release channel activity(GO:0060315) |
| 1.0 | 2.9 | GO:0008594 | photoreceptor cell morphogenesis(GO:0008594) post-embryonic retina morphogenesis in camera-type eye(GO:0060060) |
| 0.9 | 11.4 | GO:0007614 | short-term memory(GO:0007614) |
| 0.9 | 2.8 | GO:1902037 | negative regulation of hematopoietic stem cell differentiation(GO:1902037) |
| 0.9 | 5.6 | GO:2000973 | regulation of pro-B cell differentiation(GO:2000973) |
| 0.9 | 11.9 | GO:0043374 | CD8-positive, alpha-beta T cell differentiation(GO:0043374) |
| 0.9 | 8.2 | GO:0030644 | cellular chloride ion homeostasis(GO:0030644) |
| 0.9 | 35.6 | GO:0007026 | negative regulation of microtubule depolymerization(GO:0007026) |
| 0.9 | 1.7 | GO:0061055 | myotome development(GO:0061055) |
| 0.8 | 3.3 | GO:0019464 | glycine catabolic process(GO:0006546) glycine decarboxylation via glycine cleavage system(GO:0019464) |
| 0.8 | 3.3 | GO:0060529 | ectoderm and mesoderm interaction(GO:0007499) squamous basal epithelial stem cell differentiation involved in prostate gland acinus development(GO:0060529) |
| 0.8 | 9.8 | GO:0034643 | establishment of mitochondrion localization, microtubule-mediated(GO:0034643) mitochondrion transport along microtubule(GO:0047497) |
| 0.8 | 5.3 | GO:0033634 | positive regulation of cell-cell adhesion mediated by integrin(GO:0033634) |
| 0.7 | 8.9 | GO:0043162 | ubiquitin-dependent protein catabolic process via the multivesicular body sorting pathway(GO:0043162) |
| 0.7 | 2.9 | GO:0032747 | positive regulation of interleukin-23 production(GO:0032747) |
| 0.7 | 11.0 | GO:1902259 | regulation of delayed rectifier potassium channel activity(GO:1902259) |
| 0.7 | 26.1 | GO:0046825 | regulation of protein export from nucleus(GO:0046825) |
| 0.7 | 10.1 | GO:0007097 | nuclear migration(GO:0007097) |
| 0.7 | 7.2 | GO:0002860 | positive regulation of natural killer cell mediated immune response to tumor cell(GO:0002857) positive regulation of natural killer cell mediated cytotoxicity directed against tumor cell target(GO:0002860) |
| 0.7 | 14.1 | GO:2000311 | regulation of alpha-amino-3-hydroxy-5-methyl-4-isoxazole propionate selective glutamate receptor activity(GO:2000311) |
| 0.7 | 7.7 | GO:0006388 | tRNA splicing, via endonucleolytic cleavage and ligation(GO:0006388) |
| 0.7 | 2.8 | GO:1901491 | negative regulation of lymphangiogenesis(GO:1901491) |
| 0.7 | 2.1 | GO:1903544 | response to butyrate(GO:1903544) |
| 0.7 | 9.5 | GO:0099612 | protein localization to axon(GO:0099612) |
| 0.7 | 5.4 | GO:1903301 | positive regulation of glucokinase activity(GO:0033133) positive regulation of hexokinase activity(GO:1903301) |
| 0.7 | 2.0 | GO:2000324 | positive regulation of glucocorticoid receptor signaling pathway(GO:2000324) |
| 0.6 | 9.6 | GO:0001675 | acrosome assembly(GO:0001675) sperm axoneme assembly(GO:0007288) |
| 0.6 | 34.5 | GO:0045739 | positive regulation of DNA repair(GO:0045739) |
| 0.6 | 3.8 | GO:0070836 | caveola assembly(GO:0070836) |
| 0.6 | 6.2 | GO:0097499 | protein localization to nonmotile primary cilium(GO:0097499) |
| 0.6 | 3.6 | GO:0097039 | protein linear polyubiquitination(GO:0097039) |
| 0.6 | 6.7 | GO:0051560 | mitochondrial calcium ion homeostasis(GO:0051560) |
| 0.5 | 31.1 | GO:0051965 | positive regulation of synapse assembly(GO:0051965) |
| 0.5 | 2.1 | GO:0048312 | intracellular distribution of mitochondria(GO:0048312) |
| 0.5 | 7.4 | GO:0031340 | positive regulation of vesicle fusion(GO:0031340) |
| 0.5 | 8.7 | GO:0016558 | protein import into peroxisome matrix(GO:0016558) |
| 0.5 | 8.1 | GO:0000042 | protein targeting to Golgi(GO:0000042) |
| 0.5 | 3.5 | GO:0044351 | macropinocytosis(GO:0044351) |
| 0.5 | 21.6 | GO:0021762 | substantia nigra development(GO:0021762) |
| 0.5 | 2.9 | GO:0034393 | positive regulation of smooth muscle cell apoptotic process(GO:0034393) |
| 0.5 | 10.1 | GO:0000188 | inactivation of MAPK activity(GO:0000188) |
| 0.5 | 29.3 | GO:0042220 | response to cocaine(GO:0042220) |
| 0.5 | 19.0 | GO:0042149 | cellular response to glucose starvation(GO:0042149) |
| 0.5 | 49.9 | GO:0006941 | striated muscle contraction(GO:0006941) |
| 0.5 | 2.3 | GO:2000327 | regulation of ligand-dependent nuclear receptor transcription coactivator activity(GO:2000325) positive regulation of ligand-dependent nuclear receptor transcription coactivator activity(GO:2000327) |
| 0.5 | 12.7 | GO:0015701 | bicarbonate transport(GO:0015701) |
| 0.4 | 22.8 | GO:0035249 | synaptic transmission, glutamatergic(GO:0035249) |
| 0.4 | 19.0 | GO:0055013 | cardiac muscle cell development(GO:0055013) |
| 0.4 | 2.1 | GO:0014870 | response to muscle inactivity(GO:0014870) |
| 0.4 | 23.8 | GO:0006096 | glycolytic process(GO:0006096) |
| 0.4 | 2.1 | GO:0042264 | peptidyl-aspartic acid hydroxylation(GO:0042264) |
| 0.4 | 27.3 | GO:1902600 | hydrogen ion transmembrane transport(GO:1902600) |
| 0.4 | 3.3 | GO:0007182 | common-partner SMAD protein phosphorylation(GO:0007182) |
| 0.4 | 6.1 | GO:0090344 | positive regulation of mitochondrial fission(GO:0090141) negative regulation of cell aging(GO:0090344) |
| 0.4 | 13.1 | GO:0030261 | chromosome condensation(GO:0030261) |
| 0.4 | 2.0 | GO:0045656 | negative regulation of monocyte differentiation(GO:0045656) |
| 0.4 | 10.6 | GO:0006611 | protein export from nucleus(GO:0006611) |
| 0.4 | 1.5 | GO:0032509 | endosome transport via multivesicular body sorting pathway(GO:0032509) |
| 0.4 | 12.8 | GO:0014003 | oligodendrocyte development(GO:0014003) |
| 0.4 | 1.8 | GO:1902035 | positive regulation of hematopoietic stem cell proliferation(GO:1902035) |
| 0.4 | 3.9 | GO:0033141 | regulation of peptidyl-serine phosphorylation of STAT protein(GO:0033139) positive regulation of peptidyl-serine phosphorylation of STAT protein(GO:0033141) serine phosphorylation of STAT protein(GO:0042501) |
| 0.4 | 2.5 | GO:0035989 | tendon development(GO:0035989) |
| 0.3 | 10.0 | GO:0030728 | ovulation(GO:0030728) |
| 0.3 | 3.0 | GO:2000060 | positive regulation of protein ubiquitination involved in ubiquitin-dependent protein catabolic process(GO:2000060) |
| 0.3 | 38.4 | GO:0031032 | actomyosin structure organization(GO:0031032) |
| 0.3 | 3.9 | GO:1901409 | positive regulation of phosphorylation of RNA polymerase II C-terminal domain(GO:1901409) |
| 0.3 | 4.5 | GO:0051085 | chaperone mediated protein folding requiring cofactor(GO:0051085) |
| 0.3 | 7.5 | GO:0034260 | negative regulation of GTPase activity(GO:0034260) |
| 0.3 | 2.8 | GO:0043649 | dicarboxylic acid catabolic process(GO:0043649) |
| 0.3 | 20.6 | GO:0007416 | synapse assembly(GO:0007416) |
| 0.3 | 7.8 | GO:0048488 | synaptic vesicle endocytosis(GO:0048488) |
| 0.3 | 25.4 | GO:0007229 | integrin-mediated signaling pathway(GO:0007229) |
| 0.3 | 3.1 | GO:0015732 | prostaglandin transport(GO:0015732) |
| 0.3 | 4.8 | GO:0006415 | translational termination(GO:0006415) |
| 0.3 | 0.8 | GO:0042196 | chlorinated hydrocarbon metabolic process(GO:0042196) halogenated hydrocarbon metabolic process(GO:0042197) |
| 0.3 | 18.8 | GO:0010923 | negative regulation of phosphatase activity(GO:0010923) |
| 0.2 | 2.9 | GO:0048268 | clathrin coat assembly(GO:0048268) |
| 0.2 | 0.7 | GO:1900104 | hyaluranon cable assembly(GO:0036118) regulation of hyaluranon cable assembly(GO:1900104) positive regulation of hyaluranon cable assembly(GO:1900106) |
| 0.2 | 10.7 | GO:0032543 | mitochondrial translation(GO:0032543) |
| 0.2 | 6.6 | GO:0043001 | Golgi to plasma membrane protein transport(GO:0043001) |
| 0.2 | 2.2 | GO:0061525 | hindgut development(GO:0061525) |
| 0.2 | 17.2 | GO:0021987 | cerebral cortex development(GO:0021987) |
| 0.2 | 4.8 | GO:1900078 | positive regulation of cellular response to insulin stimulus(GO:1900078) |
| 0.2 | 2.2 | GO:0030238 | male sex determination(GO:0030238) |
| 0.2 | 13.6 | GO:0001578 | microtubule bundle formation(GO:0001578) |
| 0.2 | 3.2 | GO:2000114 | regulation of establishment of cell polarity(GO:2000114) |
| 0.2 | 5.2 | GO:0001662 | behavioral fear response(GO:0001662) behavioral defense response(GO:0002209) |
| 0.2 | 2.6 | GO:0099517 | anterograde synaptic vesicle transport(GO:0048490) synaptic vesicle cytoskeletal transport(GO:0099514) synaptic vesicle transport along microtubule(GO:0099517) |
| 0.2 | 12.6 | GO:1902476 | chloride transmembrane transport(GO:1902476) |
| 0.2 | 8.1 | GO:0006635 | fatty acid beta-oxidation(GO:0006635) |
| 0.2 | 6.9 | GO:0051290 | protein heterotetramerization(GO:0051290) |
| 0.2 | 5.7 | GO:1901998 | toxin transport(GO:1901998) |
| 0.1 | 1.7 | GO:0030277 | maintenance of gastrointestinal epithelium(GO:0030277) |
| 0.1 | 6.5 | GO:0019933 | cAMP-mediated signaling(GO:0019933) |
| 0.1 | 4.6 | GO:0061077 | chaperone-mediated protein folding(GO:0061077) |
| 0.1 | 11.3 | GO:0006665 | sphingolipid metabolic process(GO:0006665) |
| 0.1 | 5.9 | GO:0000186 | activation of MAPKK activity(GO:0000186) |
| 0.1 | 9.4 | GO:0021549 | cerebellum development(GO:0021549) |
| 0.1 | 16.7 | GO:0007411 | axon guidance(GO:0007411) |
| 0.1 | 3.5 | GO:0032728 | positive regulation of interferon-beta production(GO:0032728) |
| 0.1 | 6.2 | GO:0001707 | mesoderm formation(GO:0001707) |
| 0.1 | 2.1 | GO:0043968 | histone H2A acetylation(GO:0043968) |
| 0.1 | 1.3 | GO:0043982 | histone H4-K5 acetylation(GO:0043981) histone H4-K8 acetylation(GO:0043982) |
| 0.1 | 0.7 | GO:0006099 | tricarboxylic acid cycle(GO:0006099) |
| 0.1 | 2.1 | GO:0010824 | regulation of centrosome duplication(GO:0010824) SCF-dependent proteasomal ubiquitin-dependent protein catabolic process(GO:0031146) |
| 0.1 | 2.5 | GO:0051693 | actin filament capping(GO:0051693) |
| 0.1 | 2.2 | GO:0070534 | protein K63-linked ubiquitination(GO:0070534) |
| 0.1 | 4.6 | GO:0007030 | Golgi organization(GO:0007030) |
| 0.1 | 0.3 | GO:0033227 | dsRNA transport(GO:0033227) |
| 0.0 | 2.9 | GO:0006888 | ER to Golgi vesicle-mediated transport(GO:0006888) |
| 0.0 | 0.2 | GO:0006198 | cAMP catabolic process(GO:0006198) |
Gene overrepresentation in cellular component category:
| Log-likelihood per target | Total log-likelihood | Term | Description |
|---|---|---|---|
| 13.2 | 39.6 | GO:0045283 | mitochondrial respiratory chain complex II, succinate dehydrogenase complex (ubiquinone)(GO:0005749) succinate dehydrogenase complex (ubiquinone)(GO:0045257) fumarate reductase complex(GO:0045283) |
| 9.3 | 112.2 | GO:0045275 | respiratory chain complex III(GO:0045275) |
| 8.8 | 17.5 | GO:0070069 | cytochrome complex(GO:0070069) |
| 8.7 | 35.0 | GO:0044326 | dendritic spine neck(GO:0044326) |
| 8.5 | 25.4 | GO:0005962 | mitochondrial isocitrate dehydrogenase complex (NAD+)(GO:0005962) isocitrate dehydrogenase complex (NAD+)(GO:0045242) |
| 8.1 | 32.4 | GO:0098574 | cytoplasmic side of lysosomal membrane(GO:0098574) |
| 7.9 | 31.6 | GO:1990584 | cardiac Troponin complex(GO:1990584) |
| 7.8 | 69.8 | GO:0030314 | junctional membrane complex(GO:0030314) |
| 7.7 | 15.5 | GO:0097444 | spine apparatus(GO:0097444) |
| 7.7 | 38.4 | GO:0005927 | muscle tendon junction(GO:0005927) |
| 7.3 | 29.2 | GO:1990761 | growth cone lamellipodium(GO:1990761) growth cone filopodium(GO:1990812) |
| 6.9 | 34.7 | GO:0044316 | cone cell pedicle(GO:0044316) |
| 6.3 | 133.0 | GO:0005865 | striated muscle thin filament(GO:0005865) |
| 5.4 | 32.3 | GO:0032280 | symmetric synapse(GO:0032280) |
| 5.3 | 69.0 | GO:0000276 | mitochondrial proton-transporting ATP synthase complex, coupling factor F(o)(GO:0000276) |
| 5.0 | 20.0 | GO:0001405 | presequence translocase-associated import motor(GO:0001405) |
| 4.7 | 47.0 | GO:0045254 | pyruvate dehydrogenase complex(GO:0045254) |
| 4.7 | 14.0 | GO:0044302 | dentate gyrus mossy fiber(GO:0044302) |
| 4.5 | 22.4 | GO:0072534 | perineuronal net(GO:0072534) |
| 4.4 | 349.7 | GO:0070469 | respiratory chain(GO:0070469) |
| 4.1 | 12.3 | GO:0048269 | methionine adenosyltransferase complex(GO:0048269) |
| 4.0 | 31.9 | GO:0000275 | mitochondrial proton-transporting ATP synthase complex, catalytic core F(1)(GO:0000275) proton-transporting ATP synthase complex, catalytic core F(1)(GO:0045261) |
| 3.9 | 23.2 | GO:0097441 | basilar dendrite(GO:0097441) |
| 3.5 | 59.4 | GO:0098984 | asymmetric synapse(GO:0032279) neuron to neuron synapse(GO:0098984) |
| 3.1 | 6.1 | GO:0097512 | cardiac myofibril(GO:0097512) |
| 3.0 | 27.3 | GO:0098839 | postsynaptic density membrane(GO:0098839) |
| 2.9 | 2.9 | GO:0070033 | synaptobrevin 2-SNAP-25-syntaxin-1a-complexin II complex(GO:0070033) |
| 2.9 | 28.7 | GO:0042583 | chromaffin granule(GO:0042583) |
| 2.6 | 60.7 | GO:1902711 | GABA-A receptor complex(GO:1902711) |
| 2.6 | 20.9 | GO:0005753 | mitochondrial proton-transporting ATP synthase complex(GO:0005753) |
| 2.6 | 23.1 | GO:0005742 | mitochondrial outer membrane translocase complex(GO:0005742) |
| 2.3 | 42.8 | GO:0016010 | dystrophin-associated glycoprotein complex(GO:0016010) glycoprotein complex(GO:0090665) |
| 2.1 | 23.4 | GO:0005890 | sodium:potassium-exchanging ATPase complex(GO:0005890) |
| 2.1 | 6.4 | GO:0032173 | septin collar(GO:0032173) |
| 2.1 | 14.6 | GO:0031415 | NatA complex(GO:0031415) |
| 2.1 | 26.9 | GO:0031143 | pseudopodium(GO:0031143) |
| 2.0 | 19.8 | GO:0042788 | polysomal ribosome(GO:0042788) |
| 1.9 | 9.5 | GO:1990769 | proximal neuron projection(GO:1990769) |
| 1.8 | 275.6 | GO:0030018 | Z disc(GO:0030018) |
| 1.5 | 4.5 | GO:0097451 | glial limiting end-foot(GO:0097451) |
| 1.5 | 16.3 | GO:0045239 | tricarboxylic acid cycle enzyme complex(GO:0045239) |
| 1.4 | 76.4 | GO:0030017 | sarcomere(GO:0030017) |
| 1.4 | 27.0 | GO:0043034 | costamere(GO:0043034) |
| 1.3 | 44.3 | GO:0034707 | chloride channel complex(GO:0034707) |
| 1.2 | 16.8 | GO:0032426 | stereocilium tip(GO:0032426) |
| 1.2 | 32.1 | GO:0042629 | mast cell granule(GO:0042629) |
| 1.2 | 110.4 | GO:0042734 | presynaptic membrane(GO:0042734) |
| 1.2 | 11.7 | GO:0033017 | sarcoplasmic reticulum membrane(GO:0033017) |
| 1.1 | 119.7 | GO:0016605 | PML body(GO:0016605) |
| 1.1 | 7.9 | GO:0016593 | Cdc73/Paf1 complex(GO:0016593) |
| 1.1 | 3.3 | GO:0005960 | glycine cleavage complex(GO:0005960) |
| 1.1 | 10.9 | GO:0044354 | pinosome(GO:0044352) macropinosome(GO:0044354) |
| 1.1 | 61.2 | GO:0043198 | dendritic shaft(GO:0043198) |
| 1.0 | 5.2 | GO:0070552 | BRISC complex(GO:0070552) |
| 1.0 | 3.0 | GO:0036488 | CHOP-C/EBP complex(GO:0036488) CHOP-ATF3 complex(GO:1990622) |
| 0.9 | 23.2 | GO:0008074 | guanylate cyclase complex, soluble(GO:0008074) |
| 0.9 | 25.2 | GO:0000314 | organellar small ribosomal subunit(GO:0000314) mitochondrial small ribosomal subunit(GO:0005763) |
| 0.9 | 42.2 | GO:0030173 | integral component of Golgi membrane(GO:0030173) |
| 0.9 | 2.6 | GO:0005745 | m-AAA complex(GO:0005745) |
| 0.8 | 56.0 | GO:0000313 | organellar ribosome(GO:0000313) mitochondrial ribosome(GO:0005761) |
| 0.8 | 5.9 | GO:0071986 | Ragulator complex(GO:0071986) |
| 0.8 | 15.1 | GO:0005892 | acetylcholine-gated channel complex(GO:0005892) |
| 0.8 | 24.8 | GO:0032809 | neuronal cell body membrane(GO:0032809) |
| 0.8 | 2.5 | GO:0005592 | collagen type XI trimer(GO:0005592) |
| 0.8 | 38.6 | GO:0009295 | nucleoid(GO:0009295) mitochondrial nucleoid(GO:0042645) |
| 0.8 | 7.0 | GO:0005797 | Golgi medial cisterna(GO:0005797) |
| 0.8 | 64.8 | GO:0001750 | photoreceptor outer segment(GO:0001750) |
| 0.7 | 5.2 | GO:0016281 | eukaryotic translation initiation factor 4F complex(GO:0016281) |
| 0.7 | 10.9 | GO:0071565 | nBAF complex(GO:0071565) |
| 0.7 | 3.6 | GO:0071797 | LUBAC complex(GO:0071797) |
| 0.7 | 18.3 | GO:0031305 | intrinsic component of mitochondrial inner membrane(GO:0031304) integral component of mitochondrial inner membrane(GO:0031305) |
| 0.7 | 52.0 | GO:0099501 | synaptic vesicle membrane(GO:0030672) exocytic vesicle membrane(GO:0099501) |
| 0.7 | 2.1 | GO:0005943 | phosphatidylinositol 3-kinase complex, class IA(GO:0005943) |
| 0.7 | 5.9 | GO:0000306 | extrinsic component of vacuolar membrane(GO:0000306) |
| 0.6 | 14.1 | GO:0032281 | AMPA glutamate receptor complex(GO:0032281) |
| 0.6 | 11.7 | GO:0001673 | male germ cell nucleus(GO:0001673) |
| 0.5 | 5.9 | GO:0043205 | microfibril(GO:0001527) fibril(GO:0043205) |
| 0.5 | 5.3 | GO:0036057 | filtration diaphragm(GO:0036056) slit diaphragm(GO:0036057) |
| 0.5 | 7.5 | GO:0034709 | methylosome(GO:0034709) |
| 0.5 | 17.0 | GO:0008180 | COP9 signalosome(GO:0008180) |
| 0.5 | 7.5 | GO:0030061 | mitochondrial crista(GO:0030061) |
| 0.5 | 2.3 | GO:0030015 | CCR4-NOT core complex(GO:0030015) |
| 0.4 | 15.1 | GO:0005834 | heterotrimeric G-protein complex(GO:0005834) |
| 0.4 | 5.7 | GO:0035253 | ciliary rootlet(GO:0035253) |
| 0.4 | 37.6 | GO:0005901 | caveola(GO:0005901) |
| 0.4 | 14.0 | GO:0031201 | SNARE complex(GO:0031201) |
| 0.4 | 2.2 | GO:0097598 | sperm cytoplasmic droplet(GO:0097598) |
| 0.4 | 38.9 | GO:0005759 | mitochondrial matrix(GO:0005759) |
| 0.3 | 20.0 | GO:0031903 | peroxisomal membrane(GO:0005778) microbody membrane(GO:0031903) |
| 0.3 | 79.2 | GO:0005743 | mitochondrial inner membrane(GO:0005743) |
| 0.3 | 1.7 | GO:0030991 | intraciliary transport particle A(GO:0030991) |
| 0.3 | 2.2 | GO:0000815 | ESCRT III complex(GO:0000815) |
| 0.3 | 34.5 | GO:0043679 | axon terminus(GO:0043679) |
| 0.3 | 2.1 | GO:0032541 | cortical endoplasmic reticulum(GO:0032541) |
| 0.2 | 0.7 | GO:0036117 | hyaluranon cable(GO:0036117) |
| 0.2 | 2.8 | GO:0044439 | microbody part(GO:0044438) peroxisomal part(GO:0044439) |
| 0.2 | 7.7 | GO:0010494 | cytoplasmic stress granule(GO:0010494) |
| 0.2 | 2.0 | GO:1990635 | proximal dendrite(GO:1990635) |
| 0.2 | 2.6 | GO:0030123 | AP-3 adaptor complex(GO:0030123) |
| 0.2 | 11.4 | GO:0031234 | extrinsic component of cytoplasmic side of plasma membrane(GO:0031234) |
| 0.2 | 2.9 | GO:0030131 | clathrin adaptor complex(GO:0030131) |
| 0.2 | 24.9 | GO:0001650 | fibrillar center(GO:0001650) |
| 0.2 | 3.8 | GO:0001891 | phagocytic cup(GO:0001891) |
| 0.2 | 10.6 | GO:0008021 | synaptic vesicle(GO:0008021) |
| 0.2 | 3.1 | GO:0031588 | nucleotide-activated protein kinase complex(GO:0031588) |
| 0.2 | 191.9 | GO:0005739 | mitochondrion(GO:0005739) |
| 0.2 | 85.8 | GO:0048471 | perinuclear region of cytoplasm(GO:0048471) |
| 0.2 | 10.8 | GO:0005643 | nuclear pore(GO:0005643) |
| 0.2 | 26.2 | GO:0005802 | trans-Golgi network(GO:0005802) |
| 0.2 | 10.8 | GO:0043197 | dendritic spine(GO:0043197) |
| 0.1 | 0.6 | GO:0036157 | outer dynein arm(GO:0036157) |
| 0.1 | 3.9 | GO:0016235 | aggresome(GO:0016235) |
| 0.1 | 13.0 | GO:0030427 | site of polarized growth(GO:0030427) |
| 0.1 | 2.1 | GO:0043189 | NuA4 histone acetyltransferase complex(GO:0035267) H4/H2A histone acetyltransferase complex(GO:0043189) H4 histone acetyltransferase complex(GO:1902562) |
| 0.1 | 16.8 | GO:0005769 | early endosome(GO:0005769) |
| 0.1 | 2.1 | GO:0080008 | Cul4-RING E3 ubiquitin ligase complex(GO:0080008) |
| 0.1 | 20.4 | GO:0045202 | synapse(GO:0045202) |
| 0.1 | 3.1 | GO:0032580 | Golgi cisterna membrane(GO:0032580) |
| 0.1 | 6.2 | GO:0030425 | dendrite(GO:0030425) |
| 0.0 | 0.6 | GO:0030126 | COPI vesicle coat(GO:0030126) |
| 0.0 | 1.3 | GO:0000307 | cyclin-dependent protein kinase holoenzyme complex(GO:0000307) |
| 0.0 | 3.7 | GO:0031301 | integral component of organelle membrane(GO:0031301) |
| 0.0 | 1.4 | GO:0030658 | transport vesicle membrane(GO:0030658) |
| 0.0 | 9.9 | GO:0005578 | proteinaceous extracellular matrix(GO:0005578) |
| 0.0 | 2.1 | GO:0001726 | ruffle(GO:0001726) |
| 0.0 | 3.4 | GO:0005635 | nuclear envelope(GO:0005635) |
| 0.0 | 1.2 | GO:0016591 | DNA-directed RNA polymerase II, holoenzyme(GO:0016591) |
Gene overrepresentation in molecular function category:
| Log-likelihood per target | Total log-likelihood | Term | Description |
|---|---|---|---|
| 22.7 | 68.2 | GO:0004807 | triose-phosphate isomerase activity(GO:0004807) |
| 21.3 | 106.6 | GO:0051373 | FATZ binding(GO:0051373) |
| 19.5 | 97.5 | GO:0016907 | G-protein coupled acetylcholine receptor activity(GO:0016907) |
| 17.8 | 53.4 | GO:0003828 | alpha-N-acetylneuraminate alpha-2,8-sialyltransferase activity(GO:0003828) |
| 15.6 | 46.7 | GO:0051538 | 3 iron, 4 sulfur cluster binding(GO:0051538) |
| 15.1 | 90.4 | GO:0004470 | malic enzyme activity(GO:0004470) malate dehydrogenase (decarboxylating) (NAD+) activity(GO:0004471) malate dehydrogenase (decarboxylating) (NADP+) activity(GO:0004473) |
| 12.6 | 37.8 | GO:0034485 | phosphatidylinositol-3,4,5-trisphosphate 5-phosphatase activity(GO:0034485) inositol tetrakisphosphate phosphatase activity(GO:0052743) |
| 11.4 | 45.7 | GO:0001642 | group III metabotropic glutamate receptor activity(GO:0001642) |
| 10.4 | 31.3 | GO:0004724 | magnesium-dependent protein serine/threonine phosphatase activity(GO:0004724) |
| 10.3 | 31.0 | GO:0080130 | L-aspartate:2-oxoglutarate aminotransferase activity(GO:0004069) L-phenylalanine:2-oxoglutarate aminotransferase activity(GO:0080130) |
| 9.8 | 39.1 | GO:0055100 | adiponectin binding(GO:0055100) |
| 9.5 | 19.0 | GO:0008177 | succinate dehydrogenase (ubiquinone) activity(GO:0008177) |
| 9.1 | 27.3 | GO:0030899 | calcium-dependent ATPase activity(GO:0030899) |
| 9.0 | 72.1 | GO:0008121 | ubiquinol-cytochrome-c reductase activity(GO:0008121) oxidoreductase activity, acting on diphenols and related substances as donors, cytochrome as acceptor(GO:0016681) |
| 8.2 | 24.6 | GO:0004618 | phosphoglycerate kinase activity(GO:0004618) |
| 7.9 | 31.6 | GO:0030172 | troponin C binding(GO:0030172) |
| 7.0 | 21.1 | GO:0004466 | long-chain-acyl-CoA dehydrogenase activity(GO:0004466) |
| 6.6 | 19.9 | GO:0001847 | opsonin receptor activity(GO:0001847) |
| 6.5 | 25.9 | GO:0005219 | ryanodine-sensitive calcium-release channel activity(GO:0005219) |
| 6.4 | 31.9 | GO:0043532 | angiostatin binding(GO:0043532) |
| 6.4 | 19.1 | GO:0072590 | N-acetyl-L-aspartate-L-glutamate ligase activity(GO:0072590) |
| 6.4 | 25.4 | GO:0004449 | isocitrate dehydrogenase (NAD+) activity(GO:0004449) |
| 6.3 | 31.4 | GO:0004614 | phosphoglucomutase activity(GO:0004614) |
| 5.9 | 47.0 | GO:0034604 | pyruvate dehydrogenase activity(GO:0004738) pyruvate dehydrogenase [NAD(P)+] activity(GO:0034603) pyruvate dehydrogenase (NAD+) activity(GO:0034604) |
| 5.7 | 28.7 | GO:0004517 | nitric-oxide synthase activity(GO:0004517) |
| 4.8 | 129.9 | GO:0008137 | NADH dehydrogenase (ubiquinone) activity(GO:0008137) NADH dehydrogenase (quinone) activity(GO:0050136) |
| 4.8 | 14.4 | GO:0044736 | acid-sensing ion channel activity(GO:0044736) |
| 4.6 | 18.3 | GO:0048039 | ubiquinone binding(GO:0048039) |
| 4.3 | 60.7 | GO:0005237 | inhibitory extracellular ligand-gated ion channel activity(GO:0005237) |
| 4.2 | 58.3 | GO:0005391 | sodium:potassium-exchanging ATPase activity(GO:0005391) |
| 4.0 | 71.2 | GO:0046933 | proton-transporting ATP synthase activity, rotational mechanism(GO:0046933) |
| 3.9 | 62.8 | GO:0051371 | muscle alpha-actinin binding(GO:0051371) |
| 3.8 | 3.8 | GO:0002134 | UTP binding(GO:0002134) pyrimidine ribonucleoside binding(GO:0032551) |
| 3.7 | 11.0 | GO:0015254 | glycerol channel activity(GO:0015254) |
| 3.6 | 10.9 | GO:0016403 | dimethylargininase activity(GO:0016403) |
| 3.6 | 14.5 | GO:0008489 | UDP-galactose:glucosylceramide beta-1,4-galactosyltransferase activity(GO:0008489) |
| 3.5 | 17.3 | GO:0031014 | troponin T binding(GO:0031014) |
| 3.3 | 13.2 | GO:0016149 | translation release factor activity, codon specific(GO:0016149) |
| 3.2 | 19.5 | GO:0004985 | opioid receptor activity(GO:0004985) |
| 3.1 | 36.9 | GO:0102391 | decanoate--CoA ligase activity(GO:0102391) |
| 2.8 | 39.8 | GO:0010314 | phosphatidylinositol-5-phosphate binding(GO:0010314) |
| 2.7 | 80.4 | GO:0016676 | cytochrome-c oxidase activity(GO:0004129) heme-copper terminal oxidase activity(GO:0015002) oxidoreductase activity, acting on a heme group of donors, oxygen as acceptor(GO:0016676) |
| 2.6 | 18.5 | GO:0005078 | MAP-kinase scaffold activity(GO:0005078) |
| 2.5 | 12.6 | GO:0000213 | tRNA-intron endonuclease activity(GO:0000213) |
| 2.4 | 9.7 | GO:1904288 | BAT3 complex binding(GO:1904288) |
| 2.4 | 52.9 | GO:0005521 | lamin binding(GO:0005521) |
| 2.4 | 23.7 | GO:0015193 | L-proline transmembrane transporter activity(GO:0015193) |
| 2.4 | 9.5 | GO:0033743 | peptide-methionine (R)-S-oxide reductase activity(GO:0033743) |
| 2.3 | 11.4 | GO:0086062 | voltage-gated sodium channel activity involved in Purkinje myocyte action potential(GO:0086062) |
| 2.3 | 6.9 | GO:0047025 | 3-oxoacyl-[acyl-carrier-protein] reductase (NADH) activity(GO:0047025) |
| 2.1 | 8.5 | GO:0003836 | beta-galactoside (CMP) alpha-2,3-sialyltransferase activity(GO:0003836) |
| 2.1 | 14.6 | GO:0004115 | 3',5'-cyclic-AMP phosphodiesterase activity(GO:0004115) |
| 2.0 | 18.2 | GO:0015266 | protein channel activity(GO:0015266) |
| 1.9 | 40.9 | GO:0004435 | phosphatidylinositol phospholipase C activity(GO:0004435) |
| 1.9 | 15.3 | GO:0004300 | enoyl-CoA hydratase activity(GO:0004300) |
| 1.9 | 11.3 | GO:0017040 | ceramidase activity(GO:0017040) |
| 1.8 | 9.1 | GO:0004416 | hydroxyacylglutathione hydrolase activity(GO:0004416) |
| 1.8 | 21.1 | GO:0030215 | semaphorin receptor binding(GO:0030215) |
| 1.7 | 5.2 | GO:0031708 | endothelin B receptor binding(GO:0031708) |
| 1.6 | 47.7 | GO:0009055 | electron carrier activity(GO:0009055) |
| 1.6 | 30.7 | GO:0008179 | adenylate cyclase binding(GO:0008179) |
| 1.6 | 11.3 | GO:0000155 | phosphorelay sensor kinase activity(GO:0000155) |
| 1.5 | 12.2 | GO:0015129 | lactate transmembrane transporter activity(GO:0015129) |
| 1.5 | 7.4 | GO:0004467 | long-chain fatty acid-CoA ligase activity(GO:0004467) |
| 1.5 | 38.2 | GO:0005086 | ARF guanyl-nucleotide exchange factor activity(GO:0005086) |
| 1.4 | 4.3 | GO:0030156 | benzodiazepine receptor binding(GO:0030156) |
| 1.4 | 5.7 | GO:0034432 | endopolyphosphatase activity(GO:0000298) diphosphoinositol-polyphosphate diphosphatase activity(GO:0008486) bis(5'-adenosyl)-hexaphosphatase activity(GO:0034431) bis(5'-adenosyl)-pentaphosphatase activity(GO:0034432) |
| 1.4 | 30.7 | GO:0005112 | Notch binding(GO:0005112) |
| 1.4 | 145.5 | GO:0005200 | structural constituent of cytoskeleton(GO:0005200) |
| 1.4 | 10.8 | GO:0005049 | nuclear export signal receptor activity(GO:0005049) |
| 1.3 | 42.7 | GO:0030332 | cyclin binding(GO:0030332) |
| 1.3 | 9.3 | GO:0004111 | creatine kinase activity(GO:0004111) |
| 1.3 | 36.9 | GO:0005452 | inorganic anion exchanger activity(GO:0005452) |
| 1.2 | 9.8 | GO:0005169 | neurotrophin TRKB receptor binding(GO:0005169) |
| 1.2 | 12.2 | GO:0003680 | AT DNA binding(GO:0003680) |
| 1.2 | 24.3 | GO:0015288 | porin activity(GO:0015288) |
| 1.1 | 36.9 | GO:0019212 | phosphatase inhibitor activity(GO:0019212) |
| 1.1 | 13.1 | GO:0005024 | transforming growth factor beta-activated receptor activity(GO:0005024) |
| 1.1 | 8.7 | GO:0004705 | JUN kinase activity(GO:0004705) SAP kinase activity(GO:0016909) |
| 1.1 | 42.0 | GO:0017080 | sodium channel regulator activity(GO:0017080) |
| 1.1 | 8.6 | GO:0005095 | GTPase inhibitor activity(GO:0005095) |
| 1.1 | 10.7 | GO:0070679 | inositol 1,4,5 trisphosphate binding(GO:0070679) |
| 1.0 | 31.3 | GO:0005184 | neuropeptide hormone activity(GO:0005184) |
| 1.0 | 14.6 | GO:0004596 | peptide alpha-N-acetyltransferase activity(GO:0004596) |
| 1.0 | 27.3 | GO:0004181 | metallocarboxypeptidase activity(GO:0004181) |
| 1.0 | 29.2 | GO:0070064 | proline-rich region binding(GO:0070064) |
| 1.0 | 119.9 | GO:0001191 | transcriptional repressor activity, RNA polymerase II transcription factor binding(GO:0001191) |
| 1.0 | 15.1 | GO:0022848 | acetylcholine-gated cation channel activity(GO:0022848) |
| 1.0 | 56.0 | GO:0019894 | kinesin binding(GO:0019894) |
| 1.0 | 21.8 | GO:0008327 | methyl-CpG binding(GO:0008327) |
| 1.0 | 26.9 | GO:0005104 | fibroblast growth factor receptor binding(GO:0005104) |
| 0.9 | 47.3 | GO:0016627 | oxidoreductase activity, acting on the CH-CH group of donors(GO:0016627) |
| 0.9 | 25.3 | GO:0017134 | fibroblast growth factor binding(GO:0017134) |
| 0.8 | 34.7 | GO:0030552 | cAMP binding(GO:0030552) |
| 0.8 | 10.9 | GO:0042043 | neurexin family protein binding(GO:0042043) |
| 0.8 | 11.7 | GO:0005523 | tropomyosin binding(GO:0005523) |
| 0.8 | 19.2 | GO:0004602 | glutathione peroxidase activity(GO:0004602) |
| 0.8 | 10.0 | GO:0005527 | macrolide binding(GO:0005527) FK506 binding(GO:0005528) |
| 0.7 | 19.2 | GO:0008395 | steroid hydroxylase activity(GO:0008395) |
| 0.7 | 17.7 | GO:0017091 | AU-rich element binding(GO:0017091) |
| 0.7 | 4.7 | GO:0070095 | fructose-6-phosphate binding(GO:0070095) |
| 0.6 | 12.2 | GO:0005212 | structural constituent of eye lens(GO:0005212) |
| 0.6 | 48.1 | GO:0005518 | collagen binding(GO:0005518) |
| 0.6 | 11.8 | GO:0008307 | structural constituent of muscle(GO:0008307) |
| 0.5 | 2.2 | GO:0050682 | AF-2 domain binding(GO:0050682) |
| 0.5 | 32.6 | GO:0005544 | calcium-dependent phospholipid binding(GO:0005544) |
| 0.5 | 21.6 | GO:0042169 | SH2 domain binding(GO:0042169) |
| 0.5 | 10.4 | GO:0005337 | nucleoside transmembrane transporter activity(GO:0005337) |
| 0.5 | 10.3 | GO:0005229 | intracellular calcium activated chloride channel activity(GO:0005229) |
| 0.5 | 7.6 | GO:0001222 | transcription corepressor binding(GO:0001222) |
| 0.5 | 5.2 | GO:0000340 | RNA 7-methylguanosine cap binding(GO:0000340) |
| 0.5 | 21.3 | GO:0015459 | potassium channel regulator activity(GO:0015459) |
| 0.5 | 15.3 | GO:0004683 | calmodulin-dependent protein kinase activity(GO:0004683) |
| 0.5 | 108.4 | GO:0008022 | protein C-terminus binding(GO:0008022) |
| 0.4 | 37.2 | GO:0005178 | integrin binding(GO:0005178) |
| 0.4 | 2.1 | GO:0046934 | phosphatidylinositol-4,5-bisphosphate 3-kinase activity(GO:0046934) phosphatidylinositol bisphosphate kinase activity(GO:0052813) |
| 0.4 | 16.1 | GO:0005109 | frizzled binding(GO:0005109) |
| 0.4 | 13.2 | GO:0005158 | insulin receptor binding(GO:0005158) |
| 0.4 | 3.9 | GO:0005132 | type I interferon receptor binding(GO:0005132) |
| 0.4 | 11.8 | GO:0001784 | phosphotyrosine binding(GO:0001784) |
| 0.4 | 2.7 | GO:0005173 | stem cell factor receptor binding(GO:0005173) |
| 0.4 | 1.5 | GO:0016492 | nerve growth factor receptor activity(GO:0010465) G-protein coupled neurotensin receptor activity(GO:0016492) |
| 0.4 | 3.0 | GO:0043522 | leucine zipper domain binding(GO:0043522) |
| 0.4 | 19.4 | GO:0008138 | protein tyrosine/serine/threonine phosphatase activity(GO:0008138) |
| 0.4 | 2.9 | GO:0004703 | G-protein coupled receptor kinase activity(GO:0004703) |
| 0.4 | 20.9 | GO:0015078 | hydrogen ion transmembrane transporter activity(GO:0015078) |
| 0.3 | 4.8 | GO:0033038 | bitter taste receptor activity(GO:0033038) |
| 0.3 | 4.5 | GO:0004791 | thioredoxin-disulfide reductase activity(GO:0004791) |
| 0.3 | 11.2 | GO:0070888 | E-box binding(GO:0070888) |
| 0.3 | 7.5 | GO:0004407 | histone deacetylase activity(GO:0004407) |
| 0.3 | 16.4 | GO:0048306 | calcium-dependent protein binding(GO:0048306) |
| 0.3 | 9.6 | GO:0004623 | phospholipase A2 activity(GO:0004623) |
| 0.3 | 3.3 | GO:0097371 | MDM2/MDM4 family protein binding(GO:0097371) |
| 0.3 | 3.0 | GO:0051959 | dynein light intermediate chain binding(GO:0051959) |
| 0.3 | 6.7 | GO:0035255 | ionotropic glutamate receptor binding(GO:0035255) |
| 0.3 | 3.8 | GO:0070300 | phosphatidic acid binding(GO:0070300) |
| 0.3 | 16.3 | GO:0003743 | translation initiation factor activity(GO:0003743) |
| 0.2 | 0.7 | GO:0004591 | oxoglutarate dehydrogenase (succinyl-transferring) activity(GO:0004591) |
| 0.2 | 10.6 | GO:0016651 | oxidoreductase activity, acting on NAD(P)H(GO:0016651) |
| 0.2 | 3.5 | GO:0001056 | RNA polymerase III activity(GO:0001056) |
| 0.2 | 2.3 | GO:0045294 | alpha-catenin binding(GO:0045294) |
| 0.2 | 10.5 | GO:0005245 | voltage-gated calcium channel activity(GO:0005245) |
| 0.2 | 2.8 | GO:0016290 | palmitoyl-CoA hydrolase activity(GO:0016290) |
| 0.2 | 27.3 | GO:0051015 | actin filament binding(GO:0051015) |
| 0.2 | 3.1 | GO:0004679 | AMP-activated protein kinase activity(GO:0004679) |
| 0.2 | 8.2 | GO:0016836 | hydro-lyase activity(GO:0016836) |
| 0.2 | 72.3 | GO:0005525 | GTP binding(GO:0005525) |
| 0.2 | 5.9 | GO:0061631 | ubiquitin conjugating enzyme activity(GO:0061631) ubiquitin-like protein conjugating enzyme activity(GO:0061650) |
| 0.2 | 6.6 | GO:0005484 | SNAP receptor activity(GO:0005484) |
| 0.2 | 2.9 | GO:0008301 | DNA binding, bending(GO:0008301) |
| 0.2 | 2.2 | GO:1990381 | ubiquitin-specific protease binding(GO:1990381) |
| 0.2 | 5.9 | GO:0004715 | non-membrane spanning protein tyrosine kinase activity(GO:0004715) |
| 0.1 | 0.7 | GO:0050501 | hyaluronan synthase activity(GO:0050501) |
| 0.1 | 9.1 | GO:0004004 | RNA helicase activity(GO:0003724) ATP-dependent RNA helicase activity(GO:0004004) |
| 0.1 | 0.4 | GO:0004307 | ethanolaminephosphotransferase activity(GO:0004307) |
| 0.1 | 5.2 | GO:0005164 | tumor necrosis factor receptor binding(GO:0005164) |
| 0.1 | 1.3 | GO:0043996 | histone acetyltransferase activity (H4-K5 specific)(GO:0043995) histone acetyltransferase activity (H4-K8 specific)(GO:0043996) histone acetyltransferase activity (H4-K16 specific)(GO:0046972) |
| 0.1 | 3.2 | GO:0005546 | phosphatidylinositol-4,5-bisphosphate binding(GO:0005546) |
| 0.1 | 5.6 | GO:0004860 | protein kinase inhibitor activity(GO:0004860) |
| 0.1 | 0.7 | GO:0004331 | fructose-2,6-bisphosphate 2-phosphatase activity(GO:0004331) |
| 0.1 | 0.6 | GO:0000774 | adenyl-nucleotide exchange factor activity(GO:0000774) |
| 0.1 | 1.3 | GO:0016538 | cyclin-dependent protein serine/threonine kinase regulator activity(GO:0016538) |
| 0.1 | 1.3 | GO:0005545 | 1-phosphatidylinositol binding(GO:0005545) |
| 0.1 | 0.8 | GO:0008484 | sulfuric ester hydrolase activity(GO:0008484) |
| 0.1 | 2.0 | GO:0001965 | G-protein alpha-subunit binding(GO:0001965) |
| 0.1 | 2.5 | GO:0019905 | syntaxin binding(GO:0019905) |
| 0.1 | 0.3 | GO:0051032 | nucleic acid transmembrane transporter activity(GO:0051032) RNA transmembrane transporter activity(GO:0051033) |
| 0.1 | 1.2 | GO:0003899 | DNA-directed RNA polymerase activity(GO:0003899) |
| 0.0 | 2.5 | GO:0005201 | extracellular matrix structural constituent(GO:0005201) |
| 0.0 | 0.7 | GO:0001594 | trace-amine receptor activity(GO:0001594) |
| 0.0 | 0.4 | GO:0005540 | hyaluronic acid binding(GO:0005540) |
| 0.0 | 11.8 | GO:0004842 | ubiquitin-protein transferase activity(GO:0004842) |
| 0.0 | 4.8 | GO:0001227 | transcriptional repressor activity, RNA polymerase II transcription regulatory region sequence-specific binding(GO:0001227) |
| 0.0 | 0.5 | GO:0071889 | 14-3-3 protein binding(GO:0071889) |
| 0.0 | 0.4 | GO:0008009 | chemokine activity(GO:0008009) |
Gene overrepresentation in curated gene sets: canonical pathways category:
| Log-likelihood per target | Total log-likelihood | Term | Description |
|---|---|---|---|
| 1.5 | 30.7 | PID LPA4 PATHWAY | LPA4-mediated signaling events |
| 1.4 | 92.6 | PID CASPASE PATHWAY | Caspase cascade in apoptosis |
| 1.2 | 16.9 | PID ALK2 PATHWAY | ALK2 signaling events |
| 0.9 | 23.7 | ST GRANULE CELL SURVIVAL PATHWAY | Granule Cell Survival Pathway is a specific case of more general PAC1 Receptor Pathway. |
| 0.8 | 38.7 | PID RET PATHWAY | Signaling events regulated by Ret tyrosine kinase |
| 0.8 | 11.7 | ST WNT CA2 CYCLIC GMP PATHWAY | Wnt/Ca2+/cyclic GMP signaling. |
| 0.7 | 50.7 | PID HIF1 TFPATHWAY | HIF-1-alpha transcription factor network |
| 0.6 | 12.4 | ST MYOCYTE AD PATHWAY | Myocyte Adrenergic Pathway is a specific case of the generalized Adrenergic Pathway. |
| 0.4 | 7.6 | PID CIRCADIAN PATHWAY | Circadian rhythm pathway |
| 0.4 | 11.6 | PID ILK PATHWAY | Integrin-linked kinase signaling |
| 0.4 | 8.0 | PID PI3K PLC TRK PATHWAY | Trk receptor signaling mediated by PI3K and PLC-gamma |
| 0.3 | 2.5 | PID AR NONGENOMIC PATHWAY | Nongenotropic Androgen signaling |
| 0.3 | 14.5 | PID ERA GENOMIC PATHWAY | Validated nuclear estrogen receptor alpha network |
| 0.3 | 10.9 | PID LIS1 PATHWAY | Lissencephaly gene (LIS1) in neuronal migration and development |
| 0.3 | 5.2 | PID ENDOTHELIN PATHWAY | Endothelins |
| 0.3 | 11.8 | PID P38 ALPHA BETA DOWNSTREAM PATHWAY | Signaling mediated by p38-alpha and p38-beta |
| 0.3 | 7.5 | PID HDAC CLASSII PATHWAY | Signaling events mediated by HDAC Class II |
| 0.3 | 12.3 | PID SHP2 PATHWAY | SHP2 signaling |
| 0.3 | 10.4 | PID ERBB1 INTERNALIZATION PATHWAY | Internalization of ErbB1 |
| 0.3 | 5.6 | ST PHOSPHOINOSITIDE 3 KINASE PATHWAY | PI3K Pathway |
| 0.3 | 18.6 | PID AP1 PATHWAY | AP-1 transcription factor network |
| 0.3 | 8.0 | ST WNT BETA CATENIN PATHWAY | Wnt/beta-catenin Pathway |
| 0.2 | 8.5 | PID KIT PATHWAY | Signaling events mediated by Stem cell factor receptor (c-Kit) |
| 0.2 | 6.7 | PID INSULIN GLUCOSE PATHWAY | Insulin-mediated glucose transport |
| 0.2 | 10.4 | NABA COLLAGENS | Genes encoding collagen proteins |
| 0.2 | 5.9 | PID IL8 CXCR2 PATHWAY | IL8- and CXCR2-mediated signaling events |
| 0.2 | 2.9 | PID IL27 PATHWAY | IL27-mediated signaling events |
| 0.2 | 12.6 | PID MYC ACTIV PATHWAY | Validated targets of C-MYC transcriptional activation |
| 0.2 | 6.9 | PID LKB1 PATHWAY | LKB1 signaling events |
| 0.2 | 2.2 | PID ERB GENOMIC PATHWAY | Validated nuclear estrogen receptor beta network |
| 0.2 | 3.9 | PID CD8 TCR DOWNSTREAM PATHWAY | Downstream signaling in naïve CD8+ T cells |
| 0.2 | 6.9 | PID TNF PATHWAY | TNF receptor signaling pathway |
| 0.1 | 11.2 | WNT SIGNALING | Genes related to Wnt-mediated signal transduction |
| 0.1 | 6.3 | PID SMAD2 3NUCLEAR PATHWAY | Regulation of nuclear SMAD2/3 signaling |
| 0.1 | 4.9 | PID NOTCH PATHWAY | Notch signaling pathway |
| 0.1 | 2.1 | PID RHODOPSIN PATHWAY | Visual signal transduction: Rods |
| 0.1 | 2.9 | PID ECADHERIN NASCENT AJ PATHWAY | E-cadherin signaling in the nascent adherens junction |
| 0.1 | 2.2 | PID HEDGEHOG GLI PATHWAY | Hedgehog signaling events mediated by Gli proteins |
| 0.1 | 4.5 | PID ARF6 TRAFFICKING PATHWAY | Arf6 trafficking events |
| 0.1 | 4.6 | PID RHOA REG PATHWAY | Regulation of RhoA activity |
| 0.1 | 3.3 | PID TAP63 PATHWAY | Validated transcriptional targets of TAp63 isoforms |
| 0.1 | 3.3 | PID TGFBR PATHWAY | TGF-beta receptor signaling |
| 0.0 | 1.5 | PID P75 NTR PATHWAY | p75(NTR)-mediated signaling |
Gene overrepresentation in curated gene sets: REACTOME pathways category:
| Log-likelihood per target | Total log-likelihood | Term | Description |
|---|---|---|---|
| 6.2 | 402.9 | REACTOME RESPIRATORY ELECTRON TRANSPORT | Genes involved in Respiratory electron transport |
| 6.1 | 239.8 | REACTOME STRIATED MUSCLE CONTRACTION | Genes involved in Striated Muscle Contraction |
| 5.2 | 78.3 | REACTOME REGULATION OF PYRUVATE DEHYDROGENASE PDH COMPLEX | Genes involved in Regulation of pyruvate dehydrogenase (PDH) complex |
| 5.2 | 67.1 | REACTOME CITRIC ACID CYCLE TCA CYCLE | Genes involved in Citric acid cycle (TCA cycle) |
| 4.6 | 74.1 | REACTOME FORMATION OF ATP BY CHEMIOSMOTIC COUPLING | Genes involved in Formation of ATP by chemiosmotic coupling |
| 3.6 | 60.7 | REACTOME GABA A RECEPTOR ACTIVATION | Genes involved in GABA A receptor activation |
| 2.5 | 24.9 | REACTOME REGULATION OF INSULIN SECRETION BY ACETYLCHOLINE | Genes involved in Regulation of Insulin Secretion by Acetylcholine |
| 2.4 | 93.5 | REACTOME MITOCHONDRIAL PROTEIN IMPORT | Genes involved in Mitochondrial Protein Import |
| 2.4 | 93.2 | REACTOME GLUCONEOGENESIS | Genes involved in Gluconeogenesis |
| 2.4 | 26.1 | REACTOME CREATION OF C4 AND C2 ACTIVATORS | Genes involved in Creation of C4 and C2 activators |
| 2.2 | 60.6 | REACTOME ADHERENS JUNCTIONS INTERACTIONS | Genes involved in Adherens junctions interactions |
| 2.0 | 36.9 | REACTOME SYNTHESIS OF VERY LONG CHAIN FATTY ACYL COAS | Genes involved in Synthesis of very long-chain fatty acyl-CoAs |
| 2.0 | 30.7 | REACTOME ADENYLATE CYCLASE ACTIVATING PATHWAY | Genes involved in Adenylate cyclase activating pathway |
| 2.0 | 44.9 | REACTOME CLASS C 3 METABOTROPIC GLUTAMATE PHEROMONE RECEPTORS | Genes involved in Class C/3 (Metabotropic glutamate/pheromone receptors) |
| 1.8 | 70.8 | REACTOME AMINE LIGAND BINDING RECEPTORS | Genes involved in Amine ligand-binding receptors |
| 1.7 | 12.2 | REACTOME PYRUVATE METABOLISM | Genes involved in Pyruvate metabolism |
| 1.6 | 31.4 | REACTOME GLYCOGEN BREAKDOWN GLYCOGENOLYSIS | Genes involved in Glycogen breakdown (glycogenolysis) |
| 1.5 | 21.1 | REACTOME MITOCHONDRIAL FATTY ACID BETA OXIDATION | Genes involved in Mitochondrial Fatty Acid Beta-Oxidation |
| 1.2 | 33.6 | REACTOME CASPASE MEDIATED CLEAVAGE OF CYTOSKELETAL PROTEINS | Genes involved in Caspase-mediated cleavage of cytoskeletal proteins |
| 1.2 | 56.6 | REACTOME ION TRANSPORT BY P TYPE ATPASES | Genes involved in Ion transport by P-type ATPases |
| 1.0 | 39.8 | REACTOME SYNTHESIS OF PIPS AT THE PLASMA MEMBRANE | Genes involved in Synthesis of PIPs at the plasma membrane |
| 1.0 | 30.7 | REACTOME ACTIVATED NOTCH1 TRANSMITS SIGNAL TO THE NUCLEUS | Genes involved in Activated NOTCH1 Transmits Signal to the Nucleus |
| 0.9 | 13.8 | REACTOME RAP1 SIGNALLING | Genes involved in Rap1 signalling |
| 0.9 | 11.0 | REACTOME PASSIVE TRANSPORT BY AQUAPORINS | Genes involved in Passive Transport by Aquaporins |
| 0.9 | 15.3 | REACTOME BRANCHED CHAIN AMINO ACID CATABOLISM | Genes involved in Branched-chain amino acid catabolism |
| 0.9 | 14.5 | REACTOME N GLYCAN ANTENNAE ELONGATION | Genes involved in N-Glycan antennae elongation |
| 0.8 | 21.9 | REACTOME BMAL1 CLOCK NPAS2 ACTIVATES CIRCADIAN EXPRESSION | Genes involved in BMAL1:CLOCK/NPAS2 Activates Circadian Expression |
| 0.8 | 15.8 | REACTOME NEPHRIN INTERACTIONS | Genes involved in Nephrin interactions |
| 0.8 | 10.7 | REACTOME ROLE OF SECOND MESSENGERS IN NETRIN1 SIGNALING | Genes involved in Role of second messengers in netrin-1 signaling |
| 0.8 | 21.8 | REACTOME YAP1 AND WWTR1 TAZ STIMULATED GENE EXPRESSION | Genes involved in YAP1- and WWTR1 (TAZ)-stimulated gene expression |
| 0.7 | 29.8 | REACTOME NUCLEAR SIGNALING BY ERBB4 | Genes involved in Nuclear signaling by ERBB4 |
| 0.7 | 8.5 | REACTOME TERMINATION OF O GLYCAN BIOSYNTHESIS | Genes involved in Termination of O-glycan biosynthesis |
| 0.6 | 19.2 | REACTOME GLUTATHIONE CONJUGATION | Genes involved in Glutathione conjugation |
| 0.6 | 20.9 | REACTOME TRANSPORT OF VITAMINS NUCLEOSIDES AND RELATED MOLECULES | Genes involved in Transport of vitamins, nucleosides, and related molecules |
| 0.6 | 3.6 | REACTOME DOWNSTREAM SIGNALING EVENTS OF B CELL RECEPTOR BCR | Genes involved in Downstream Signaling Events Of B Cell Receptor (BCR) |
| 0.6 | 9.4 | REACTOME CELL EXTRACELLULAR MATRIX INTERACTIONS | Genes involved in Cell-extracellular matrix interactions |
| 0.6 | 13.4 | REACTOME NA CL DEPENDENT NEUROTRANSMITTER TRANSPORTERS | Genes involved in Na+/Cl- dependent neurotransmitter transporters |
| 0.6 | 20.0 | REACTOME LATENT INFECTION OF HOMO SAPIENS WITH MYCOBACTERIUM TUBERCULOSIS | Genes involved in Latent infection of Homo sapiens with Mycobacterium tuberculosis |
| 0.5 | 7.6 | REACTOME SIGNAL ATTENUATION | Genes involved in Signal attenuation |
| 0.5 | 8.7 | REACTOME ACTIVATION OF THE AP1 FAMILY OF TRANSCRIPTION FACTORS | Genes involved in Activation of the AP-1 family of transcription factors |
| 0.5 | 17.0 | REACTOME TRAFFICKING OF AMPA RECEPTORS | Genes involved in Trafficking of AMPA receptors |
| 0.5 | 12.3 | REACTOME SULFUR AMINO ACID METABOLISM | Genes involved in Sulfur amino acid metabolism |
| 0.5 | 26.4 | REACTOME VOLTAGE GATED POTASSIUM CHANNELS | Genes involved in Voltage gated Potassium channels |
| 0.4 | 11.4 | REACTOME INTERACTION BETWEEN L1 AND ANKYRINS | Genes involved in Interaction between L1 and Ankyrins |
| 0.4 | 11.5 | REACTOME REGULATION OF GENE EXPRESSION IN BETA CELLS | Genes involved in Regulation of gene expression in beta cells |
| 0.4 | 5.2 | REACTOME MTORC1 MEDIATED SIGNALLING | Genes involved in mTORC1-mediated signalling |
| 0.4 | 9.6 | REACTOME ACYL CHAIN REMODELLING OF PE | Genes involved in Acyl chain remodelling of PE |
| 0.4 | 2.9 | REACTOME NEF MEDIATED DOWNREGULATION OF MHC CLASS I COMPLEX CELL SURFACE EXPRESSION | Genes involved in Nef mediated downregulation of MHC class I complex cell surface expression |
| 0.4 | 2.5 | REACTOME TIE2 SIGNALING | Genes involved in Tie2 Signaling |
| 0.3 | 11.1 | REACTOME INTERACTIONS OF VPR WITH HOST CELLULAR PROTEINS | Genes involved in Interactions of Vpr with host cellular proteins |
| 0.3 | 12.1 | REACTOME GLYCOSPHINGOLIPID METABOLISM | Genes involved in Glycosphingolipid metabolism |
| 0.3 | 7.5 | REACTOME METABOLISM OF NON CODING RNA | Genes involved in Metabolism of non-coding RNA |
| 0.3 | 3.5 | REACTOME P38MAPK EVENTS | Genes involved in p38MAPK events |
| 0.3 | 3.0 | REACTOME ACTIVATION OF CHAPERONE GENES BY ATF6 ALPHA | Genes involved in Activation of Chaperone Genes by ATF6-alpha |
| 0.3 | 7.5 | REACTOME SIGNALING BY NOTCH1 | Genes involved in Signaling by NOTCH1 |
| 0.3 | 2.1 | REACTOME SYNTHESIS OF PIPS AT THE EARLY ENDOSOME MEMBRANE | Genes involved in Synthesis of PIPs at the early endosome membrane |
| 0.2 | 12.2 | REACTOME CHEMOKINE RECEPTORS BIND CHEMOKINES | Genes involved in Chemokine receptors bind chemokines |
| 0.2 | 4.4 | REACTOME SIGNALING BY FGFR1 FUSION MUTANTS | Genes involved in Signaling by FGFR1 fusion mutants |
| 0.2 | 5.4 | REACTOME RNA POL I TRANSCRIPTION TERMINATION | Genes involved in RNA Polymerase I Transcription Termination |
| 0.2 | 2.9 | REACTOME NOREPINEPHRINE NEUROTRANSMITTER RELEASE CYCLE | Genes involved in Norepinephrine Neurotransmitter Release Cycle |
| 0.2 | 5.9 | REACTOME G ALPHA S SIGNALLING EVENTS | Genes involved in G alpha (s) signalling events |
| 0.2 | 10.1 | REACTOME FORMATION OF THE TERNARY COMPLEX AND SUBSEQUENTLY THE 43S COMPLEX | Genes involved in Formation of the ternary complex, and subsequently, the 43S complex |
| 0.2 | 2.8 | REACTOME SYNTHESIS OF BILE ACIDS AND BILE SALTS VIA 7ALPHA HYDROXYCHOLESTEROL | Genes involved in Synthesis of bile acids and bile salts via 7alpha-hydroxycholesterol |
| 0.2 | 19.3 | REACTOME TRANSPORT OF INORGANIC CATIONS ANIONS AND AMINO ACIDS OLIGOPEPTIDES | Genes involved in Transport of inorganic cations/anions and amino acids/oligopeptides |
| 0.2 | 4.2 | REACTOME PRE NOTCH TRANSCRIPTION AND TRANSLATION | Genes involved in Pre-NOTCH Transcription and Translation |
| 0.2 | 7.2 | REACTOME IMMUNOREGULATORY INTERACTIONS BETWEEN A LYMPHOID AND A NON LYMPHOID CELL | Genes involved in Immunoregulatory interactions between a Lymphoid and a non-Lymphoid cell |
| 0.1 | 11.2 | REACTOME PPARA ACTIVATES GENE EXPRESSION | Genes involved in PPARA Activates Gene Expression |
| 0.1 | 8.9 | REACTOME TRAF6 MEDIATED INDUCTION OF NFKB AND MAP KINASES UPON TLR7 8 OR 9 ACTIVATION | Genes involved in TRAF6 mediated induction of NFkB and MAP kinases upon TLR7/8 or 9 activation |
| 0.1 | 3.9 | REACTOME TGF BETA RECEPTOR SIGNALING ACTIVATES SMADS | Genes involved in TGF-beta receptor signaling activates SMADs |
| 0.1 | 6.2 | REACTOME NRAGE SIGNALS DEATH THROUGH JNK | Genes involved in NRAGE signals death through JNK |
| 0.1 | 1.0 | REACTOME SIGNALING BY ERBB2 | Genes involved in Signaling by ERBB2 |
| 0.1 | 0.7 | REACTOME CS DS DEGRADATION | Genes involved in CS/DS degradation |
| 0.1 | 1.2 | REACTOME P75 NTR RECEPTOR MEDIATED SIGNALLING | Genes involved in p75 NTR receptor-mediated signalling |
| 0.1 | 0.7 | REACTOME GLYCOLYSIS | Genes involved in Glycolysis |
| 0.1 | 3.4 | REACTOME COLLAGEN FORMATION | Genes involved in Collagen formation |
| 0.1 | 0.9 | REACTOME OTHER SEMAPHORIN INTERACTIONS | Genes involved in Other semaphorin interactions |
| 0.0 | 1.7 | REACTOME ABC FAMILY PROTEINS MEDIATED TRANSPORT | Genes involved in ABC-family proteins mediated transport |
| 0.0 | 1.1 | REACTOME APOPTOTIC CLEAVAGE OF CELLULAR PROTEINS | Genes involved in Apoptotic cleavage of cellular proteins |
| 0.0 | 1.5 | REACTOME GOLGI ASSOCIATED VESICLE BIOGENESIS | Genes involved in Golgi Associated Vesicle Biogenesis |
| 0.0 | 3.4 | REACTOME G ALPHA I SIGNALLING EVENTS | Genes involved in G alpha (i) signalling events |
| 0.0 | 0.2 | REACTOME DARPP 32 EVENTS | Genes involved in DARPP-32 events |