Project
GSE53960: rat RNA-Seq transcriptomic Bodymap
Navigation
Downloads
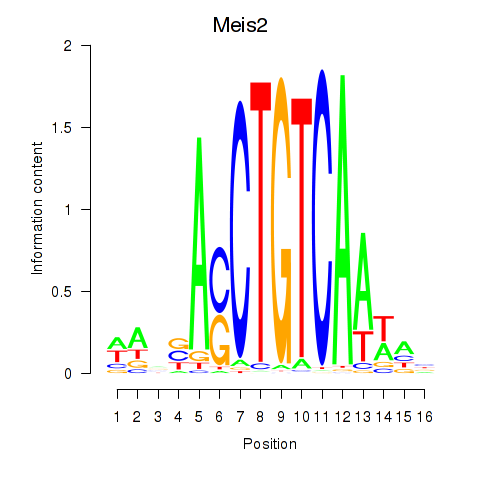
Results for Meis2
Z-value: 1.12
Motif logo
Transcription factors associated with Meis2
| Gene Symbol | Gene ID | Gene Info |
|---|---|---|
|
Meis2
|
ENSRNOG00000004730 | Meis homeobox 2 |
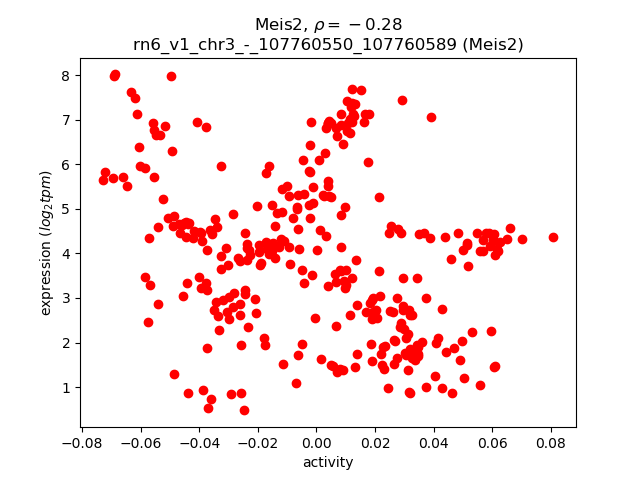
Activity-expression correlation:
| Gene | Promoter | Pearson corr. coef. | P-value | Plot |
|---|---|---|---|---|
| Meis2 | rn6_v1_chr3_-_107760550_107760589 | -0.28 | 4.6e-07 | Click! |
Activity profile of Meis2 motif
Sorted Z-values of Meis2 motif
| Promoter | Log-likelihood | Transcript | Gene | Gene Info |
|---|---|---|---|---|
| chr7_-_118108864 | 32.96 |
ENSRNOT00000006184
|
Mb
|
myoglobin |
| chr9_-_73958480 | 24.20 |
ENSRNOT00000017838
|
Myl1
|
myosin, light chain 1 |
| chr13_-_47397890 | 21.48 |
ENSRNOT00000005505
|
C4bpb
|
complement component 4 binding protein, beta |
| chr9_+_14529218 | 21.34 |
ENSRNOT00000016893
|
Apobec2
|
apolipoprotein B mRNA editing enzyme catalytic subunit 2 |
| chrX_-_23187341 | 19.38 |
ENSRNOT00000000180
|
Alas2
|
5'-aminolevulinate synthase 2 |
| chr10_-_15590220 | 18.22 |
ENSRNOT00000048977
|
Hba-a2
|
hemoglobin alpha, adult chain 2 |
| chr3_-_176666282 | 17.64 |
ENSRNOT00000016947
|
Eef1a2
|
eukaryotic translation elongation factor 1 alpha 2 |
| chr4_-_99125111 | 17.20 |
ENSRNOT00000009184
|
Smyd1
|
SET and MYND domain containing 1 |
| chr1_-_168972725 | 16.25 |
ENSRNOT00000090422
|
Hbb
|
hemoglobin subunit beta |
| chr2_-_105089659 | 15.59 |
ENSRNOT00000043381
|
Cpb1
|
carboxypeptidase B1 |
| chr13_+_52625441 | 15.32 |
ENSRNOT00000012095
|
Tnni1
|
troponin I1, slow skeletal type |
| chr4_-_69268336 | 14.93 |
ENSRNOT00000018042
|
Prss3b
|
protease, serine, 3B |
| chr1_-_143398093 | 14.47 |
ENSRNOT00000078916
|
Fsd2
|
fibronectin type III and SPRY domain containing 2 |
| chr13_-_98478327 | 14.46 |
ENSRNOT00000030135
|
Coq8a
|
coenzyme Q8A |
| chr7_-_29152442 | 14.40 |
ENSRNOT00000079774
|
Mybpc1
|
myosin binding protein C, slow type |
| chr2_+_46980976 | 14.40 |
ENSRNOT00000083668
ENSRNOT00000082990 |
Mocs2
|
molybdenum cofactor synthesis 2 |
| chr2_-_96668222 | 13.48 |
ENSRNOT00000016567
|
Pkia
|
cAMP-dependent protein kinase inhibitor alpha |
| chr20_-_5805627 | 13.14 |
ENSRNOT00000085996
|
Clps
|
colipase |
| chr14_+_22251499 | 13.09 |
ENSRNOT00000087991
ENSRNOT00000002705 |
Ugt2a1
|
UDP glucuronosyltransferase 2 family, polypeptide A1 |
| chr1_+_147713892 | 13.06 |
ENSRNOT00000092985
ENSRNOT00000054742 ENSRNOT00000074103 |
Cyp2c6v1
|
cytochrome P450, family 2, subfamily C, polypeptide 6, variant 1 |
| chr9_+_37727942 | 12.91 |
ENSRNOT00000016511
ENSRNOT00000074276 |
LOC100912306
|
myotilin-like |
| chr1_+_101324652 | 12.72 |
ENSRNOT00000028116
|
Hrc
|
histidine rich calcium binding protein |
| chr3_+_58632476 | 12.51 |
ENSRNOT00000010630
|
Rapgef4
|
Rap guanine nucleotide exchange factor 4 |
| chr10_+_53621375 | 11.93 |
ENSRNOT00000004147
|
Myh3
|
myosin heavy chain 3 |
| chr7_-_117289961 | 11.64 |
ENSRNOT00000042642
|
Plec
|
plectin |
| chr19_-_43911057 | 11.42 |
ENSRNOT00000026017
|
Ctrb1
|
chymotrypsinogen B1 |
| chr4_-_164453171 | 11.41 |
ENSRNOT00000077539
ENSRNOT00000083610 ENSRNOT00000079975 |
Ly49s6
|
Ly49 stimulatory receptor 6 |
| chr1_-_195096694 | 11.41 |
ENSRNOT00000088874
|
Snurf
|
SNRPN upstream reading frame |
| chr20_-_5806097 | 11.14 |
ENSRNOT00000000611
|
Clps
|
colipase |
| chr7_-_118933812 | 11.05 |
ENSRNOT00000031951
|
Apol9a
|
apolipoprotein L 9a |
| chr4_-_60358562 | 10.88 |
ENSRNOT00000018001
|
Chchd3
|
coiled-coil-helix-coiled-coil-helix domain containing 3 |
| chr9_-_82419288 | 10.71 |
ENSRNOT00000004797
|
Tuba4a
|
tubulin, alpha 4A |
| chr5_-_77749613 | 10.59 |
ENSRNOT00000075988
|
Mup5
|
major urinary protein 5 |
| chr2_-_227411964 | 10.57 |
ENSRNOT00000019931
|
Synpo2
|
synaptopodin 2 |
| chr12_-_11733099 | 10.44 |
ENSRNOT00000051244
ENSRNOT00000087257 |
Cyp3a23/3a1
|
cytochrome P450, family 3, subfamily a, polypeptide 23/polypeptide 1 |
| chr17_-_65955606 | 10.36 |
ENSRNOT00000067949
ENSRNOT00000023601 |
Ryr2
|
ryanodine receptor 2 |
| chr2_-_52282548 | 10.29 |
ENSRNOT00000033627
|
Nnt
|
nicotinamide nucleotide transhydrogenase |
| chrX_+_143097525 | 10.03 |
ENSRNOT00000004559
|
F9
|
coagulation factor IX |
| chr1_-_195096460 | 10.03 |
ENSRNOT00000077253
|
Snrpn
|
small nuclear ribonucleoprotein polypeptide N |
| chr3_-_113519780 | 9.96 |
ENSRNOT00000064663
|
Frmd5
|
FERM domain containing 5 |
| chr4_+_166833320 | 9.95 |
ENSRNOT00000031438
|
Tas2r120
|
taste receptor, type 2, member 120 |
| chr13_-_37287458 | 9.73 |
ENSRNOT00000003391
|
Insig2
|
insulin induced gene 2 |
| chr1_-_128695796 | 9.62 |
ENSRNOT00000076329
|
Synm
|
synemin |
| chr1_+_264893162 | 9.58 |
ENSRNOT00000021714
|
Tlx1
|
T-cell leukemia, homeobox 1 |
| chr12_+_30450316 | 9.45 |
ENSRNOT00000001222
|
Phkg1
|
phosphorylase kinase, gamma 1 |
| chr2_-_104461863 | 9.36 |
ENSRNOT00000016953
|
Crh
|
corticotropin releasing hormone |
| chr13_+_52662996 | 8.99 |
ENSRNOT00000047682
|
Tnnt2
|
troponin T2, cardiac type |
| chr4_-_113610243 | 8.98 |
ENSRNOT00000008813
|
Hk2
|
hexokinase 2 |
| chr3_-_125213607 | 8.82 |
ENSRNOT00000078070
|
Gpcpd1
|
glycerophosphocholine phosphodiesterase 1 |
| chr3_+_72238981 | 8.78 |
ENSRNOT00000011006
|
Slc43a1
|
solute carrier family 43 member 1 |
| chr4_-_166869399 | 8.62 |
ENSRNOT00000007521
|
Tas2r121
|
taste receptor, type 2, member 121 |
| chr2_-_19808937 | 8.41 |
ENSRNOT00000044237
|
Atp6ap1l
|
ATPase H+ transporting accessory protein 1 like |
| chr14_-_80130139 | 8.31 |
ENSRNOT00000091652
ENSRNOT00000010482 |
Ablim2
|
actin binding LIM protein family, member 2 |
| chr19_+_37235001 | 8.19 |
ENSRNOT00000020908
|
Nol3
|
nucleolar protein 3 |
| chr15_-_35417273 | 8.18 |
ENSRNOT00000083961
ENSRNOT00000041430 |
Gzmb
|
granzyme B |
| chr7_-_135630654 | 8.17 |
ENSRNOT00000047388
ENSRNOT00000088223 ENSRNOT00000074793 |
Adamts20
|
ADAM metallopeptidase with thrombospondin type 1 motif, 20 |
| chr10_-_15603649 | 8.13 |
ENSRNOT00000051483
|
Hba-a2
|
hemoglobin alpha, adult chain 2 |
| chr5_-_105010857 | 7.83 |
ENSRNOT00000009749
|
Plin2
|
perilipin 2 |
| chr9_-_89193821 | 7.77 |
ENSRNOT00000090881
|
Sphkap
|
SPHK1 interactor, AKAP domain containing |
| chrX_+_45420596 | 7.75 |
ENSRNOT00000051897
|
Sts
|
steroid sulfatase (microsomal), isozyme S |
| chr17_+_28504623 | 7.62 |
ENSRNOT00000021568
|
F13a1
|
coagulation factor XIII A1 chain |
| chr8_+_119228612 | 7.62 |
ENSRNOT00000078439
ENSRNOT00000043737 |
Lrrc2
|
leucine rich repeat containing 2 |
| chr2_+_181987217 | 7.44 |
ENSRNOT00000034521
|
Fgg
|
fibrinogen gamma chain |
| chr13_+_89586283 | 7.43 |
ENSRNOT00000079355
ENSRNOT00000049873 |
Nr1i3
|
nuclear receptor subfamily 1, group I, member 3 |
| chr15_-_36472327 | 7.21 |
ENSRNOT00000032601
ENSRNOT00000059660 |
LOC102553861
|
granzyme-like protein 1-like |
| chr17_+_42241159 | 7.13 |
ENSRNOT00000024878
|
Acot13
|
acyl-CoA thioesterase 13 |
| chr1_+_68176904 | 7.08 |
ENSRNOT00000044950
|
Vom1r28
|
vomeronasal 1 receptor 28 |
| chr4_-_164691405 | 7.05 |
ENSRNOT00000090979
ENSRNOT00000091932 ENSRNOT00000078219 |
Ly49s4
Ly49i2
|
Ly49 stimulatory receptor 4 Ly49 inhibitory receptor 2 |
| chr4_+_163349125 | 6.98 |
ENSRNOT00000084823
|
Klre1
|
killer cell lectin-like receptor, family E, member 1 |
| chr2_+_205568935 | 6.91 |
ENSRNOT00000025248
|
Ampd1
|
adenosine monophosphate deaminase 1 |
| chr7_-_29171783 | 6.85 |
ENSRNOT00000079235
|
Mybpc1
|
myosin binding protein C, slow type |
| chr6_+_27589657 | 6.79 |
ENSRNOT00000038649
|
Hadha
|
hydroxyacyl-CoA dehydrogenase/3-ketoacyl-CoA thiolase/enoyl-CoA hydratase (trifunctional protein), alpha subunit |
| chr1_+_177048655 | 6.75 |
ENSRNOT00000081595
|
Mical2
|
microtubule associated monooxygenase, calponin and LIM domain containing 2 |
| chr3_-_8979889 | 6.65 |
ENSRNOT00000065128
|
Crat
|
carnitine O-acetyltransferase |
| chr11_-_81444375 | 6.62 |
ENSRNOT00000058479
ENSRNOT00000078131 ENSRNOT00000080949 ENSRNOT00000080562 ENSRNOT00000084867 |
Kng1
|
kininogen 1 |
| chr2_+_211337271 | 6.51 |
ENSRNOT00000045155
|
Cox6b1
|
cytochrome c oxidase subunit 6B1 |
| chr16_+_75572070 | 6.45 |
ENSRNOT00000043486
|
Defb52
|
defensin beta 52 |
| chr10_+_66099531 | 6.44 |
ENSRNOT00000056192
|
Lyrm9
|
LYR motif containing 9 |
| chrX_-_13601069 | 6.39 |
ENSRNOT00000004686
|
Otc
|
ornithine carbamoyltransferase |
| chr8_-_133128290 | 6.28 |
ENSRNOT00000008783
|
Ccr1l1
|
chemokine (C-C motif) receptor 1-like 1 |
| chr9_-_54327958 | 6.17 |
ENSRNOT00000019465
|
Stat1
|
signal transducer and activator of transcription 1 |
| chr13_-_52266100 | 6.14 |
ENSRNOT00000087532
|
AC096239.3
|
|
| chr17_-_87826421 | 6.10 |
ENSRNOT00000068156
|
Arhgap21
|
Rho GTPase activating protein 21 |
| chr16_+_26906716 | 6.04 |
ENSRNOT00000064297
|
Cpe
|
carboxypeptidase E |
| chr18_+_17043903 | 6.01 |
ENSRNOT00000068139
|
Fhod3
|
formin homology 2 domain containing 3 |
| chr11_-_38420032 | 5.87 |
ENSRNOT00000002209
ENSRNOT00000080681 |
C2cd2
|
C2 calcium-dependent domain containing 2 |
| chr9_+_43259709 | 5.78 |
ENSRNOT00000022487
|
Cox5b
|
cytochrome c oxidase subunit 5B |
| chr7_-_71269869 | 5.68 |
ENSRNOT00000037030
|
Uqcrb
|
ubiquinol-cytochrome c reductase binding protein |
| chr1_+_153861569 | 5.64 |
ENSRNOT00000023329
|
Me3
|
malic enzyme 3 |
| chr16_+_54332660 | 5.58 |
ENSRNOT00000037685
|
Mtus1
|
microtubule associated tumor suppressor 1 |
| chr4_+_181103774 | 5.57 |
ENSRNOT00000084207
ENSRNOT00000055473 ENSRNOT00000077619 |
Arntl2
|
aryl hydrocarbon receptor nuclear translocator-like 2 |
| chr6_-_141062581 | 5.55 |
ENSRNOT00000073446
|
AABR07065778.3
|
|
| chr8_+_119261747 | 5.55 |
ENSRNOT00000079648
|
AC132539.1
|
|
| chr14_-_84937725 | 5.50 |
ENSRNOT00000083839
|
Uqcr10
|
ubiquinol-cytochrome c reductase, complex III subunit X |
| chr8_+_87211819 | 5.47 |
ENSRNOT00000086093
|
LOC100363289
|
LRRGT00022-like |
| chr1_+_153861948 | 5.47 |
ENSRNOT00000087067
|
Me3
|
malic enzyme 3 |
| chr14_+_5928737 | 5.32 |
ENSRNOT00000071877
ENSRNOT00000040985 ENSRNOT00000074889 |
Mpa2l
|
macrophage activation 2 like |
| chr20_+_10265806 | 5.29 |
ENSRNOT00000001564
ENSRNOT00000086272 |
Ndufv3
|
NADH:ubiquinone oxidoreductase subunit V3 |
| chr3_+_72329967 | 5.27 |
ENSRNOT00000090256
|
Slc43a3
|
solute carrier family 43, member 3 |
| chr9_-_4945352 | 5.26 |
ENSRNOT00000082530
|
Sult1c3
|
sulfotransferase family 1C member 3 |
| chr5_+_147476221 | 5.14 |
ENSRNOT00000010730
|
Sync
|
syncoilin, intermediate filament protein |
| chr12_+_19512591 | 5.13 |
ENSRNOT00000060024
|
RGD1562319
|
similar to family with sequence similarity 55, member C |
| chr7_+_118712035 | 5.11 |
ENSRNOT00000074245
|
LOC100911562
|
apolipoprotein L3-like |
| chr1_+_141218095 | 5.06 |
ENSRNOT00000051411
|
LOC691427
|
similar to 6.8 kDa mitochondrial proteolipid |
| chr4_-_164306500 | 5.06 |
ENSRNOT00000080133
|
Ly49i5
|
Ly49 inhibitory receptor 5 |
| chr13_+_113373578 | 5.06 |
ENSRNOT00000009900
|
Plxna2
|
plexin A2 |
| chr17_+_8489266 | 5.00 |
ENSRNOT00000016252
|
Lect2
|
leukocyte cell-derived chemotaxin 2 |
| chr19_+_26016382 | 4.95 |
ENSRNOT00000004601
|
Klf1
|
Kruppel like factor 1 |
| chr12_+_15890170 | 4.85 |
ENSRNOT00000001654
|
Gna12
|
G protein subunit alpha 12 |
| chr13_-_47831110 | 4.76 |
ENSRNOT00000061070
|
Mapkapk2
|
mitogen-activated protein kinase-activated protein kinase 2 |
| chr7_+_118895405 | 4.74 |
ENSRNOT00000092095
|
RGD1309808
|
similar to apolipoprotein L2; apolipoprotein L-II |
| chr1_+_40982862 | 4.71 |
ENSRNOT00000026367
ENSRNOT00000092953 |
Armt1
|
acidic residue methyltransferase 1 |
| chr13_-_49313940 | 4.64 |
ENSRNOT00000012190
|
Cntn2
|
contactin 2 |
| chr2_-_105047984 | 4.63 |
ENSRNOT00000014970
|
Cpa3
|
carboxypeptidase A3 |
| chr16_+_23553647 | 4.63 |
ENSRNOT00000041994
|
Psd3
|
pleckstrin and Sec7 domain containing 3 |
| chr9_-_99667689 | 4.60 |
ENSRNOT00000046464
|
Olr1344
|
olfactory receptor 1344 |
| chr10_-_34439470 | 4.52 |
ENSRNOT00000072081
|
Btnl9
|
butyrophilin-like 9 |
| chr10_-_109795697 | 4.49 |
ENSRNOT00000054952
|
Pcyt2
|
phosphate cytidylyltransferase 2, ethanolamine |
| chr14_+_22375955 | 4.48 |
ENSRNOT00000063915
ENSRNOT00000034784 |
Ugt2b37
|
UDP-glucuronosyltransferase 2 family, member 37 |
| chr10_-_110585376 | 4.48 |
ENSRNOT00000054917
|
Rab40b
|
Rab40b, member RAS oncogene family |
| chr1_-_278042312 | 4.46 |
ENSRNOT00000018693
|
Ablim1
|
actin-binding LIM protein 1 |
| chr18_+_56414488 | 4.45 |
ENSRNOT00000088988
|
Csf1r
|
colony stimulating factor 1 receptor |
| chr10_-_67479077 | 4.45 |
ENSRNOT00000090278
|
Tefm
|
transcription elongation factor, mitochondrial |
| chr15_-_34392066 | 4.44 |
ENSRNOT00000027315
|
Tgm1
|
transglutaminase 1 |
| chr3_+_100768637 | 4.39 |
ENSRNOT00000083542
|
Bdnf
|
brain-derived neurotrophic factor |
| chr4_-_165317573 | 4.39 |
ENSRNOT00000087529
ENSRNOT00000080017 |
Klra5
|
killer cell lectin-like receptor, subfamily A, member 5 |
| chr3_-_119075606 | 4.36 |
ENSRNOT00000041569
ENSRNOT00000086724 |
Hdc
|
histidine decarboxylase |
| chr8_-_43470377 | 4.32 |
ENSRNOT00000050312
|
LOC103690273
|
olfactory receptor 149 |
| chr7_-_3875067 | 4.31 |
ENSRNOT00000072301
|
Olr883
|
olfactory receptor 883 |
| chr9_-_10338216 | 4.28 |
ENSRNOT00000070862
|
Ndufa11
|
NADH:ubiquinone oxidoreductase subunit A11 |
| chr1_-_128695995 | 4.26 |
ENSRNOT00000077020
|
Synm
|
synemin |
| chr10_-_36452378 | 4.26 |
ENSRNOT00000004872
|
Prop1
|
PROP paired-like homeobox 1 |
| chr4_+_149261044 | 4.26 |
ENSRNOT00000066670
|
Cxcl12
|
C-X-C motif chemokine ligand 12 |
| chrX_-_137015266 | 4.26 |
ENSRNOT00000040369
|
Olr1767
|
olfactory receptor 1767 |
| chr8_+_116857684 | 4.26 |
ENSRNOT00000026711
|
Mst1
|
macrophage stimulating 1 |
| chr1_-_212548730 | 4.24 |
ENSRNOT00000089729
|
Caly
|
calcyon neuron-specific vesicular protein |
| chr14_-_87701884 | 4.23 |
ENSRNOT00000079338
|
Mospd1
|
motile sperm domain containing 1 |
| chr4_+_32495321 | 4.21 |
ENSRNOT00000015286
|
Sdhaf3
|
succinate dehydrogenase complex assembly factor 3 |
| chr8_-_43524220 | 4.20 |
ENSRNOT00000088755
|
Olr1315
|
olfactory receptor 1315 |
| chr3_+_60026747 | 4.17 |
ENSRNOT00000081881
|
Scrn3
|
secernin 3 |
| chr11_-_67702955 | 4.15 |
ENSRNOT00000084540
ENSRNOT00000078285 |
Kpna1
|
karyopherin subunit alpha 1 |
| chr18_+_61490031 | 4.15 |
ENSRNOT00000022958
|
Sec11c
|
SEC11 homolog C, signal peptidase complex subunit |
| chr2_+_46140482 | 4.15 |
ENSRNOT00000072858
|
Olr1262
|
olfactory receptor 1262 |
| chr20_-_1878126 | 4.12 |
ENSRNOT00000000995
|
Ubd
|
ubiquitin D |
| chr5_-_157518511 | 4.12 |
ENSRNOT00000070865
ENSRNOT00000078028 |
Htr6
|
5-hydroxytryptamine receptor 6 |
| chr7_+_32193086 | 4.12 |
ENSRNOT00000079193
|
AABR07056611.1
|
|
| chr4_-_31730386 | 4.12 |
ENSRNOT00000013817
|
Slc25a13
|
solute carrier family 25 member 13 |
| chr18_-_57920169 | 4.10 |
ENSRNOT00000040936
|
Spink7
|
serine peptidase inhibitor, Kazal type 7 |
| chr7_-_70661891 | 4.10 |
ENSRNOT00000010240
|
Inhbc
|
inhibin beta C subunit |
| chr1_-_185143272 | 4.08 |
ENSRNOT00000027752
|
Nucb2
|
nucleobindin 2 |
| chr7_-_119712888 | 4.06 |
ENSRNOT00000077438
|
Il2rb
|
interleukin 2 receptor subunit beta |
| chr2_+_127770676 | 4.03 |
ENSRNOT00000068405
|
Abhd18
|
abhydrolase domain containing 18 |
| chr16_+_50152008 | 4.02 |
ENSRNOT00000019237
|
Klkb1
|
kallikrein B1 |
| chr1_+_68239314 | 4.00 |
ENSRNOT00000070823
|
Vom1r109
|
vomeronasal 1 receptor 109 |
| chr7_-_97977135 | 4.00 |
ENSRNOT00000008785
|
Wdyhv1
|
WDYHV motif containing 1 |
| chr8_-_94352246 | 3.99 |
ENSRNOT00000013244
|
Me1
|
malic enzyme 1 |
| chr4_+_102592965 | 3.98 |
ENSRNOT00000031103
|
AABR07061003.1
|
|
| chr2_+_35310188 | 3.92 |
ENSRNOT00000073523
|
LOC100910145
|
olfactory receptor 147-like |
| chr10_+_92667869 | 3.90 |
ENSRNOT00000082780
ENSRNOT00000073350 |
Itgb3
|
integrin subunit beta 3 |
| chrX_-_77675487 | 3.88 |
ENSRNOT00000042799
|
Cysltr1
|
cysteinyl leukotriene receptor 1 |
| chr8_+_118066988 | 3.88 |
ENSRNOT00000056161
|
Map4
|
microtubule-associated protein 4 |
| chr7_+_118962897 | 3.87 |
ENSRNOT00000074888
|
RGD1309808
|
similar to apolipoprotein L2; apolipoprotein L-II |
| chr6_-_141472746 | 3.84 |
ENSRNOT00000048010
|
AABR07065792.2
|
|
| chr11_-_32088002 | 3.83 |
ENSRNOT00000002732
|
Atp5o
|
ATP synthase, H+ transporting, mitochondrial F1 complex, O subunit |
| chr13_-_98530724 | 3.81 |
ENSRNOT00000040203
|
Psen2
|
presenilin 2 |
| chr6_+_107460668 | 3.81 |
ENSRNOT00000013515
|
Acot2
|
acyl-CoA thioesterase 2 |
| chr6_+_10306405 | 3.80 |
ENSRNOT00000090420
ENSRNOT00000080507 |
Epas1
|
endothelial PAS domain protein 1 |
| chr2_-_219628997 | 3.78 |
ENSRNOT00000064484
|
Trmt13
|
tRNA methyltransferase 13 homolog |
| chr9_-_4327679 | 3.78 |
ENSRNOT00000073468
|
LOC100910235
|
sulfotransferase 1C1-like |
| chr4_-_144318580 | 3.76 |
ENSRNOT00000007591
|
Ssuh2
|
ssu-2 homolog |
| chr2_+_186555632 | 3.72 |
ENSRNOT00000052347
|
Fcrl1
|
Fc receptor-like 1 |
| chr6_-_138640187 | 3.70 |
ENSRNOT00000087983
|
AABR07065651.6
|
|
| chr20_+_46667121 | 3.69 |
ENSRNOT00000089611
|
Sesn1
|
sestrin 1 |
| chr11_-_28598179 | 3.68 |
ENSRNOT00000070889
|
LOC100912272
|
keratin-associated protein 26-1-like |
| chr7_+_123578878 | 3.68 |
ENSRNOT00000011316
|
Smdt1
|
single-pass membrane protein with aspartate-rich tail 1 |
| chrX_-_156440461 | 3.65 |
ENSRNOT00000083951
|
Rpl10
|
ribosomal protein L10 |
| chr1_+_88875375 | 3.65 |
ENSRNOT00000028284
|
Tyrobp
|
Tyro protein tyrosine kinase binding protein |
| chr6_-_139654508 | 3.65 |
ENSRNOT00000082576
|
AABR07065705.5
|
|
| chr3_+_75559775 | 3.61 |
ENSRNOT00000035844
|
Pramel6
|
preferentially expressed antigen in melanoma-like 6 |
| chr15_-_28323507 | 3.61 |
ENSRNOT00000060539
|
Rnase13
|
ribonuclease A family member 13 |
| chr17_+_3991330 | 3.60 |
ENSRNOT00000024208
|
Ctsq
|
cathepsin Q |
| chr2_-_210839295 | 3.55 |
ENSRNOT00000025994
|
Gstm4
|
glutathione S-transferase mu 4 |
| chr6_-_140805551 | 3.54 |
ENSRNOT00000080018
|
AABR07065774.1
|
|
| chr7_-_18612118 | 3.54 |
ENSRNOT00000078122
ENSRNOT00000010197 |
Rab11b
|
RAB11B, member RAS oncogene family |
| chr8_-_73194837 | 3.54 |
ENSRNOT00000024885
ENSRNOT00000081450 ENSRNOT00000064613 |
Tln2
|
talin 2 |
| chr6_+_94429068 | 3.51 |
ENSRNOT00000008238
|
Ppm1a
|
protein phosphatase, Mg2+/Mn2+ dependent, 1A |
| chr6_+_139551751 | 3.51 |
ENSRNOT00000081684
|
AABR07065699.2
|
|
| chr1_+_75693232 | 3.49 |
ENSRNOT00000020090
|
Cabp5
|
calcium binding protein 5 |
| chr16_+_8207223 | 3.47 |
ENSRNOT00000026751
|
Oxnad1
|
oxidoreductase NAD-binding domain containing 1 |
| chr8_+_2659865 | 3.47 |
ENSRNOT00000088553
ENSRNOT00000010243 |
Casp12
|
caspase 12 |
| chr3_+_141927400 | 3.47 |
ENSRNOT00000066588
|
AABR07054117.1
|
|
| chr2_-_210726179 | 3.45 |
ENSRNOT00000025689
|
Gstm7
|
glutathione S-transferase, mu 7 |
| chr12_+_41316764 | 3.45 |
ENSRNOT00000090867
|
Oas3
|
2'-5'-oligoadenylate synthetase 3 |
| chr10_-_102200596 | 3.44 |
ENSRNOT00000081519
|
Fam104a
|
family with sequence similarity 104, member A |
| chr14_+_22517774 | 3.43 |
ENSRNOT00000047655
|
Ugt2b37
|
UDP-glucuronosyltransferase 2 family, member 37 |
| chr19_-_10976396 | 3.43 |
ENSRNOT00000073239
|
Nlrc5
|
NLR family, CARD domain containing 5 |
| chr4_-_132111079 | 3.40 |
ENSRNOT00000013719
|
Eif4e3
|
eukaryotic translation initiation factor 4E family member 3 |
| chr4_+_78639672 | 3.40 |
ENSRNOT00000011588
|
Svs1
|
seminal vesicle secretory protein 1 |
| chr4_-_164536556 | 3.38 |
ENSRNOT00000087796
|
Ly49i2
|
Ly49 inhibitory receptor 2 |
| chr18_+_51523758 | 3.36 |
ENSRNOT00000078518
|
Gramd3
|
GRAM domain containing 3 |
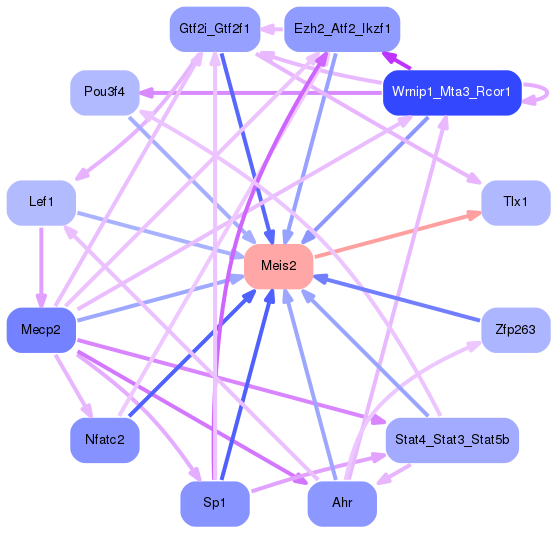
Network of associatons between targets according to the STRING database.

First level regulatory network of Meis2
Gene Ontology Analysis
Gene overrepresentation in biological process category:
| Log-likelihood per target | Total log-likelihood | Term | Description |
|---|---|---|---|
| 11.0 | 33.0 | GO:0031444 | slow-twitch skeletal muscle fiber contraction(GO:0031444) |
| 8.0 | 31.9 | GO:1901423 | response to benzene(GO:1901423) |
| 7.2 | 21.5 | GO:0045959 | negative regulation of complement activation, classical pathway(GO:0045959) |
| 5.3 | 21.3 | GO:0016554 | cytidine to uridine editing(GO:0016554) |
| 4.2 | 12.7 | GO:1990036 | calcium ion import into sarcoplasmic reticulum(GO:1990036) |
| 4.1 | 16.2 | GO:0010999 | regulation of eIF2 alpha phosphorylation by heme(GO:0010999) |
| 3.5 | 10.4 | GO:0003220 | left ventricular cardiac muscle tissue morphogenesis(GO:0003220) |
| 3.4 | 13.4 | GO:0070093 | negative regulation of glucagon secretion(GO:0070093) |
| 3.0 | 9.0 | GO:0032972 | regulation of muscle filament sliding speed(GO:0032972) |
| 2.9 | 17.2 | GO:0035795 | negative regulation of mitochondrial membrane permeability(GO:0035795) |
| 2.7 | 8.2 | GO:0060545 | positive regulation of necroptotic process(GO:0060545) |
| 2.6 | 13.1 | GO:0016098 | monoterpenoid metabolic process(GO:0016098) |
| 2.4 | 9.6 | GO:0042776 | mitochondrial ATP synthesis coupled proton transport(GO:0042776) |
| 2.3 | 7.0 | GO:0002838 | stimulatory C-type lectin receptor signaling pathway(GO:0002223) negative regulation of response to tumor cell(GO:0002835) negative regulation of immune response to tumor cell(GO:0002838) negative regulation of natural killer cell mediated immune response to tumor cell(GO:0002856) negative regulation of natural killer cell mediated cytotoxicity directed against tumor cell target(GO:0002859) |
| 2.3 | 13.9 | GO:0014721 | voluntary skeletal muscle contraction(GO:0003010) twitch skeletal muscle contraction(GO:0014721) |
| 2.2 | 6.7 | GO:0019417 | sulfur oxidation(GO:0019417) |
| 2.2 | 15.3 | GO:0014883 | transition between fast and slow fiber(GO:0014883) |
| 2.1 | 21.3 | GO:0071688 | striated muscle myosin thick filament assembly(GO:0071688) |
| 2.0 | 26.3 | GO:0015671 | oxygen transport(GO:0015671) |
| 1.7 | 6.7 | GO:0019254 | carnitine metabolic process, CoA-linked(GO:0019254) |
| 1.5 | 4.6 | GO:0060167 | clustering of voltage-gated potassium channels(GO:0045163) regulation of adenosine receptor signaling pathway(GO:0060167) |
| 1.5 | 6.2 | GO:0034240 | negative regulation of macrophage fusion(GO:0034240) |
| 1.5 | 6.1 | GO:0051684 | maintenance of Golgi location(GO:0051684) |
| 1.5 | 4.4 | GO:0006421 | asparaginyl-tRNA aminoacylation(GO:0006421) |
| 1.4 | 4.3 | GO:0048850 | hypophysis morphogenesis(GO:0048850) |
| 1.3 | 14.4 | GO:0006777 | Mo-molybdopterin cofactor biosynthetic process(GO:0006777) Mo-molybdopterin cofactor metabolic process(GO:0019720) |
| 1.3 | 3.9 | GO:2000474 | adenylate cyclase-inhibiting opioid receptor signaling pathway(GO:0031635) regulation of opioid receptor signaling pathway(GO:2000474) |
| 1.3 | 3.9 | GO:0051012 | microtubule sliding(GO:0051012) |
| 1.3 | 6.4 | GO:0006526 | arginine biosynthetic process(GO:0006526) |
| 1.3 | 15.1 | GO:0006108 | malate metabolic process(GO:0006108) |
| 1.2 | 6.0 | GO:2000173 | insulin processing(GO:0030070) negative regulation of branching morphogenesis of a nerve(GO:2000173) |
| 1.2 | 14.4 | GO:0072378 | blood coagulation, fibrin clot formation(GO:0072378) |
| 1.2 | 3.5 | GO:0018916 | nitrobenzene metabolic process(GO:0018916) |
| 1.2 | 3.5 | GO:0045054 | constitutive secretory pathway(GO:0045054) |
| 1.2 | 6.9 | GO:0032264 | IMP salvage(GO:0032264) |
| 1.1 | 4.4 | GO:0001692 | histamine metabolic process(GO:0001692) |
| 1.1 | 4.3 | GO:1990478 | response to ultrasound(GO:1990478) |
| 1.0 | 3.1 | GO:0033615 | mitochondrial proton-transporting ATP synthase complex assembly(GO:0033615) |
| 1.0 | 10.4 | GO:0070989 | oxidative demethylation(GO:0070989) |
| 1.0 | 4.1 | GO:0043490 | malate-aspartate shuttle(GO:0043490) |
| 1.0 | 3.1 | GO:1904444 | regulation of establishment of Sertoli cell barrier(GO:1904444) |
| 1.0 | 4.1 | GO:0038110 | interleukin-2-mediated signaling pathway(GO:0038110) |
| 1.0 | 3.0 | GO:0030824 | negative regulation of cGMP metabolic process(GO:0030824) |
| 0.9 | 2.8 | GO:0070681 | glutaminyl-tRNAGln biosynthesis via transamidation(GO:0070681) |
| 0.9 | 8.2 | GO:0045636 | positive regulation of melanocyte differentiation(GO:0045636) |
| 0.9 | 14.5 | GO:1901663 | ubiquinone biosynthetic process(GO:0006744) quinone biosynthetic process(GO:1901663) |
| 0.9 | 4.5 | GO:0038145 | macrophage colony-stimulating factor signaling pathway(GO:0038145) |
| 0.9 | 9.7 | GO:0071501 | SREBP signaling pathway(GO:0032933) cellular response to sterol depletion(GO:0071501) |
| 0.9 | 3.4 | GO:0060332 | positive regulation of response to interferon-gamma(GO:0060332) positive regulation of interferon-gamma-mediated signaling pathway(GO:0060335) |
| 0.8 | 2.5 | GO:1904217 | regulation of CDP-diacylglycerol-serine O-phosphatidyltransferase activity(GO:1904217) positive regulation of CDP-diacylglycerol-serine O-phosphatidyltransferase activity(GO:1904219) positive regulation of serine C-palmitoyltransferase activity(GO:1904222) |
| 0.8 | 4.2 | GO:0034552 | respiratory chain complex II assembly(GO:0034552) mitochondrial respiratory chain complex II assembly(GO:0034553) mitochondrial respiratory chain complex II biogenesis(GO:0097032) |
| 0.8 | 2.4 | GO:0080120 | CAAX-box protein processing(GO:0071586) CAAX-box protein maturation(GO:0080120) |
| 0.8 | 3.2 | GO:0035616 | histone H2B conserved C-terminal lysine deubiquitination(GO:0035616) |
| 0.8 | 7.0 | GO:0036444 | calcium ion transmembrane import into mitochondrion(GO:0036444) |
| 0.8 | 2.3 | GO:0006045 | N-acetylglucosamine biosynthetic process(GO:0006045) N-acetylneuraminate biosynthetic process(GO:0046380) |
| 0.8 | 3.8 | GO:0048625 | myoblast fate commitment(GO:0048625) |
| 0.7 | 2.2 | GO:0019747 | regulation of isoprenoid metabolic process(GO:0019747) |
| 0.7 | 3.6 | GO:0045040 | protein import into mitochondrial outer membrane(GO:0045040) |
| 0.7 | 10.9 | GO:0042407 | cristae formation(GO:0042407) |
| 0.7 | 5.7 | GO:0017062 | respiratory chain complex III assembly(GO:0017062) mitochondrial respiratory chain complex III assembly(GO:0034551) |
| 0.7 | 3.5 | GO:0034059 | response to anoxia(GO:0034059) |
| 0.7 | 4.1 | GO:0014053 | negative regulation of gamma-aminobutyric acid secretion(GO:0014053) |
| 0.7 | 2.0 | GO:2000537 | T-helper 1 cell activation(GO:0035711) granzyme B production(GO:0071613) regulation of granzyme B production(GO:0071661) positive regulation of granzyme B production(GO:0071663) regulation of thymocyte migration(GO:2000410) regulation of B cell chemotaxis(GO:2000537) positive regulation of B cell chemotaxis(GO:2000538) |
| 0.6 | 3.9 | GO:0061737 | leukotriene signaling pathway(GO:0061737) |
| 0.6 | 43.5 | GO:0032094 | response to food(GO:0032094) |
| 0.6 | 11.6 | GO:0031581 | hemidesmosome assembly(GO:0031581) |
| 0.6 | 2.4 | GO:0035521 | monoubiquitinated histone deubiquitination(GO:0035521) monoubiquitinated histone H2A deubiquitination(GO:0035522) |
| 0.6 | 3.5 | GO:0006499 | N-terminal protein myristoylation(GO:0006499) |
| 0.6 | 4.0 | GO:0051919 | positive regulation of fibrinolysis(GO:0051919) |
| 0.6 | 2.9 | GO:1903715 | regulation of aerobic respiration(GO:1903715) |
| 0.6 | 5.1 | GO:0060174 | limb bud formation(GO:0060174) |
| 0.6 | 6.7 | GO:2000480 | negative regulation of cAMP-dependent protein kinase activity(GO:2000480) |
| 0.6 | 1.7 | GO:0048749 | compound eye development(GO:0048749) |
| 0.6 | 2.2 | GO:1902626 | assembly of large subunit precursor of preribosome(GO:1902626) |
| 0.5 | 4.3 | GO:0060763 | mammary duct terminal end bud growth(GO:0060763) |
| 0.5 | 4.8 | GO:0044351 | macropinocytosis(GO:0044351) |
| 0.5 | 2.6 | GO:0051534 | negative regulation of NFAT protein import into nucleus(GO:0051534) |
| 0.5 | 17.2 | GO:0010831 | positive regulation of myotube differentiation(GO:0010831) |
| 0.5 | 4.1 | GO:0070842 | aggresome assembly(GO:0070842) |
| 0.5 | 4.6 | GO:0002002 | regulation of angiotensin levels in blood(GO:0002002) |
| 0.5 | 1.5 | GO:0001788 | antibody-dependent cellular cytotoxicity(GO:0001788) |
| 0.5 | 1.5 | GO:0000294 | nuclear-transcribed mRNA catabolic process, endonucleolytic cleavage-dependent decay(GO:0000294) cellular response to sodium arsenite(GO:1903936) response to chemokine(GO:1990868) cellular response to chemokine(GO:1990869) |
| 0.5 | 3.0 | GO:0001835 | blastocyst hatching(GO:0001835) hatching(GO:0035188) organism emergence from protective structure(GO:0071684) |
| 0.5 | 4.9 | GO:0043249 | erythrocyte maturation(GO:0043249) |
| 0.5 | 1.5 | GO:0038172 | interleukin-33-mediated signaling pathway(GO:0038172) |
| 0.5 | 3.4 | GO:0071460 | cellular response to cell-matrix adhesion(GO:0071460) |
| 0.5 | 2.4 | GO:0010841 | positive regulation of circadian sleep/wake cycle, wakefulness(GO:0010841) |
| 0.5 | 3.8 | GO:0042760 | very long-chain fatty acid catabolic process(GO:0042760) |
| 0.5 | 1.4 | GO:0002191 | cap-dependent translational initiation(GO:0002191) |
| 0.5 | 6.2 | GO:0051639 | actin filament network formation(GO:0051639) |
| 0.5 | 3.8 | GO:0034035 | purine ribonucleoside bisphosphate metabolic process(GO:0034035) 3'-phosphoadenosine 5'-phosphosulfate metabolic process(GO:0050427) |
| 0.5 | 2.4 | GO:1903750 | regulation of intrinsic apoptotic signaling pathway in response to hydrogen peroxide(GO:1903750) negative regulation of intrinsic apoptotic signaling pathway in response to hydrogen peroxide(GO:1903751) negative regulation of p38MAPK cascade(GO:1903753) |
| 0.5 | 3.3 | GO:0044598 | polyketide metabolic process(GO:0030638) daunorubicin metabolic process(GO:0044597) doxorubicin metabolic process(GO:0044598) |
| 0.4 | 1.8 | GO:0070560 | protein secretion by platelet(GO:0070560) |
| 0.4 | 3.1 | GO:0035338 | long-chain fatty-acyl-CoA biosynthetic process(GO:0035338) |
| 0.4 | 1.3 | GO:0036367 | adaptation of rhodopsin mediated signaling(GO:0016062) light adaption(GO:0036367) |
| 0.4 | 1.7 | GO:0048023 | positive regulation of melanin biosynthetic process(GO:0048023) positive regulation of secondary metabolite biosynthetic process(GO:1900378) |
| 0.4 | 7.7 | GO:0046475 | glycerophospholipid catabolic process(GO:0046475) |
| 0.4 | 3.2 | GO:1901727 | positive regulation of histone deacetylase activity(GO:1901727) |
| 0.4 | 2.8 | GO:1902083 | negative regulation of peptidyl-cysteine S-nitrosylation(GO:1902083) |
| 0.4 | 2.8 | GO:0002322 | B cell proliferation involved in immune response(GO:0002322) |
| 0.4 | 0.8 | GO:1904879 | positive regulation of calcium ion transmembrane transport via high voltage-gated calcium channel(GO:1904879) |
| 0.4 | 3.8 | GO:0007220 | Notch receptor processing(GO:0007220) |
| 0.4 | 4.2 | GO:0006465 | signal peptide processing(GO:0006465) |
| 0.4 | 2.6 | GO:0036006 | response to macrophage colony-stimulating factor(GO:0036005) cellular response to macrophage colony-stimulating factor stimulus(GO:0036006) |
| 0.4 | 4.4 | GO:0006390 | transcription from mitochondrial promoter(GO:0006390) |
| 0.4 | 15.1 | GO:0090218 | positive regulation of lipid kinase activity(GO:0090218) |
| 0.3 | 6.3 | GO:0090026 | positive regulation of monocyte chemotaxis(GO:0090026) |
| 0.3 | 3.4 | GO:0060700 | regulation of ribonuclease activity(GO:0060700) |
| 0.3 | 4.4 | GO:0010838 | positive regulation of keratinocyte proliferation(GO:0010838) |
| 0.3 | 11.2 | GO:0015991 | ATP hydrolysis coupled proton transport(GO:0015991) |
| 0.3 | 3.0 | GO:0002430 | complement receptor mediated signaling pathway(GO:0002430) |
| 0.3 | 11.9 | GO:0003009 | skeletal muscle contraction(GO:0003009) |
| 0.3 | 2.3 | GO:2000346 | negative regulation of hepatocyte proliferation(GO:2000346) |
| 0.3 | 2.3 | GO:0050915 | sensory perception of sour taste(GO:0050915) |
| 0.3 | 3.5 | GO:0007016 | cytoskeletal anchoring at plasma membrane(GO:0007016) |
| 0.3 | 6.0 | GO:1902572 | negative regulation of serine-type endopeptidase activity(GO:1900004) negative regulation of serine-type peptidase activity(GO:1902572) |
| 0.3 | 1.9 | GO:0006995 | cellular response to nitrogen starvation(GO:0006995) cellular response to nitrogen levels(GO:0043562) |
| 0.3 | 8.6 | GO:0001580 | detection of chemical stimulus involved in sensory perception of bitter taste(GO:0001580) |
| 0.3 | 3.1 | GO:0070995 | NADPH oxidation(GO:0070995) |
| 0.3 | 6.1 | GO:0048268 | clathrin coat assembly(GO:0048268) |
| 0.3 | 2.1 | GO:0033211 | adiponectin-activated signaling pathway(GO:0033211) |
| 0.3 | 1.8 | GO:0038170 | somatostatin receptor signaling pathway(GO:0038169) somatostatin signaling pathway(GO:0038170) |
| 0.3 | 0.9 | GO:0009992 | cellular water homeostasis(GO:0009992) |
| 0.3 | 4.5 | GO:0002335 | mature B cell differentiation(GO:0002335) |
| 0.3 | 10.1 | GO:0006739 | NADP metabolic process(GO:0006739) |
| 0.3 | 4.3 | GO:0006646 | phosphatidylethanolamine biosynthetic process(GO:0006646) |
| 0.3 | 2.6 | GO:0042178 | xenobiotic catabolic process(GO:0042178) |
| 0.3 | 3.1 | GO:0040016 | embryonic cleavage(GO:0040016) |
| 0.3 | 5.6 | GO:0010758 | regulation of macrophage chemotaxis(GO:0010758) |
| 0.3 | 5.6 | GO:0042753 | positive regulation of circadian rhythm(GO:0042753) |
| 0.3 | 0.8 | GO:0038158 | granulocyte colony-stimulating factor signaling pathway(GO:0038158) |
| 0.3 | 0.5 | GO:0090360 | platelet-derived growth factor production(GO:0090360) regulation of platelet-derived growth factor production(GO:0090361) |
| 0.3 | 1.8 | GO:0051532 | regulation of NFAT protein import into nucleus(GO:0051532) positive regulation of NFAT protein import into nucleus(GO:0051533) |
| 0.3 | 6.0 | GO:0032012 | regulation of ARF protein signal transduction(GO:0032012) |
| 0.2 | 7.6 | GO:0010738 | regulation of protein kinase A signaling(GO:0010738) |
| 0.2 | 3.2 | GO:0051014 | actin filament severing(GO:0051014) |
| 0.2 | 1.9 | GO:2001204 | regulation of osteoclast development(GO:2001204) |
| 0.2 | 0.7 | GO:0048861 | leukemia inhibitory factor signaling pathway(GO:0048861) |
| 0.2 | 0.7 | GO:0010572 | positive regulation of platelet activation(GO:0010572) |
| 0.2 | 2.0 | GO:0035751 | regulation of lysosomal lumen pH(GO:0035751) |
| 0.2 | 3.3 | GO:0050872 | white fat cell differentiation(GO:0050872) |
| 0.2 | 0.7 | GO:1904694 | negative regulation of vascular smooth muscle contraction(GO:1904694) |
| 0.2 | 9.4 | GO:0005978 | glycogen biosynthetic process(GO:0005978) glucan biosynthetic process(GO:0009250) |
| 0.2 | 4.2 | GO:0006607 | NLS-bearing protein import into nucleus(GO:0006607) |
| 0.2 | 6.8 | GO:0030195 | negative regulation of blood coagulation(GO:0030195) negative regulation of hemostasis(GO:1900047) |
| 0.2 | 2.5 | GO:0030206 | chondroitin sulfate biosynthetic process(GO:0030206) |
| 0.2 | 2.5 | GO:0035269 | protein O-linked mannosylation(GO:0035269) |
| 0.2 | 1.0 | GO:2000551 | regulation of T-helper 2 cell cytokine production(GO:2000551) |
| 0.2 | 7.5 | GO:1902475 | L-alpha-amino acid transmembrane transport(GO:1902475) |
| 0.2 | 0.6 | GO:0044339 | canonical Wnt signaling pathway involved in osteoblast differentiation(GO:0044339) |
| 0.2 | 0.6 | GO:0055129 | L-proline biosynthetic process(GO:0055129) |
| 0.2 | 3.5 | GO:0060707 | trophoblast giant cell differentiation(GO:0060707) |
| 0.2 | 1.7 | GO:0045162 | clustering of voltage-gated sodium channels(GO:0045162) |
| 0.2 | 8.3 | GO:0048536 | spleen development(GO:0048536) |
| 0.2 | 2.0 | GO:0060011 | Sertoli cell proliferation(GO:0060011) |
| 0.2 | 3.1 | GO:0050718 | positive regulation of interleukin-1 secretion(GO:0050716) positive regulation of interleukin-1 beta secretion(GO:0050718) |
| 0.2 | 0.5 | GO:0016240 | autophagosome docking(GO:0016240) |
| 0.2 | 0.5 | GO:0035600 | tRNA methylthiolation(GO:0035600) |
| 0.2 | 7.6 | GO:0009268 | response to pH(GO:0009268) |
| 0.2 | 0.7 | GO:0035426 | extracellular matrix-cell signaling(GO:0035426) |
| 0.2 | 20.2 | GO:0042157 | lipoprotein metabolic process(GO:0042157) |
| 0.2 | 2.5 | GO:1904262 | negative regulation of TORC1 signaling(GO:1904262) |
| 0.2 | 0.5 | GO:0061443 | endocardial cushion cell differentiation(GO:0061443) |
| 0.2 | 3.2 | GO:0007194 | negative regulation of adenylate cyclase activity(GO:0007194) negative regulation of cyclase activity(GO:0031280) |
| 0.2 | 3.9 | GO:0000027 | ribosomal large subunit assembly(GO:0000027) |
| 0.2 | 6.9 | GO:0006182 | cGMP biosynthetic process(GO:0006182) |
| 0.2 | 199.5 | GO:0007608 | sensory perception of smell(GO:0007608) |
| 0.1 | 17.2 | GO:0060048 | cardiac muscle contraction(GO:0060048) |
| 0.1 | 4.9 | GO:0010762 | regulation of fibroblast migration(GO:0010762) |
| 0.1 | 2.4 | GO:0030903 | notochord development(GO:0030903) |
| 0.1 | 6.4 | GO:0021762 | substantia nigra development(GO:0021762) |
| 0.1 | 1.0 | GO:0051934 | dopamine uptake involved in synaptic transmission(GO:0051583) catecholamine uptake involved in synaptic transmission(GO:0051934) |
| 0.1 | 0.9 | GO:0044387 | negative regulation of protein kinase activity by regulation of protein phosphorylation(GO:0044387) |
| 0.1 | 1.1 | GO:1904424 | regulation of GTP binding(GO:1904424) |
| 0.1 | 5.3 | GO:0042775 | mitochondrial ATP synthesis coupled electron transport(GO:0042775) |
| 0.1 | 3.4 | GO:0030488 | tRNA methylation(GO:0030488) |
| 0.1 | 1.0 | GO:0045542 | positive regulation of cholesterol biosynthetic process(GO:0045542) positive regulation of cholesterol metabolic process(GO:0090205) |
| 0.1 | 6.8 | GO:0006635 | fatty acid beta-oxidation(GO:0006635) |
| 0.1 | 2.4 | GO:0006450 | regulation of translational fidelity(GO:0006450) |
| 0.1 | 1.0 | GO:0001865 | NK T cell differentiation(GO:0001865) |
| 0.1 | 1.2 | GO:0045899 | positive regulation of RNA polymerase II transcriptional preinitiation complex assembly(GO:0045899) |
| 0.1 | 0.5 | GO:1902897 | regulation of postsynaptic density protein 95 clustering(GO:1902897) |
| 0.1 | 2.3 | GO:0044126 | regulation of growth of symbiont in host(GO:0044126) modulation of growth of symbiont involved in interaction with host(GO:0044144) |
| 0.1 | 10.7 | GO:0031638 | zymogen activation(GO:0031638) |
| 0.1 | 4.5 | GO:0019915 | lipid storage(GO:0019915) |
| 0.1 | 0.9 | GO:0043476 | endosome to melanosome transport(GO:0035646) pigment accumulation(GO:0043476) cellular pigment accumulation(GO:0043482) endosome to pigment granule transport(GO:0043485) pigment granule maturation(GO:0048757) |
| 0.1 | 0.2 | GO:0030186 | melatonin metabolic process(GO:0030186) |
| 0.1 | 1.6 | GO:0015012 | heparan sulfate proteoglycan biosynthetic process(GO:0015012) |
| 0.1 | 0.2 | GO:0015740 | C4-dicarboxylate transport(GO:0015740) |
| 0.1 | 0.8 | GO:1902969 | mitotic DNA replication(GO:1902969) |
| 0.1 | 1.8 | GO:0032331 | negative regulation of chondrocyte differentiation(GO:0032331) |
| 0.1 | 0.5 | GO:0007035 | vacuolar acidification(GO:0007035) |
| 0.1 | 1.2 | GO:0006880 | intracellular sequestering of iron ion(GO:0006880) sequestering of iron ion(GO:0097577) |
| 0.1 | 0.8 | GO:0007343 | egg activation(GO:0007343) |
| 0.1 | 1.3 | GO:0051601 | exocyst localization(GO:0051601) |
| 0.1 | 4.0 | GO:0045103 | intermediate filament-based process(GO:0045103) |
| 0.1 | 0.4 | GO:2000323 | negative regulation of glucocorticoid receptor signaling pathway(GO:2000323) |
| 0.1 | 2.7 | GO:0051930 | regulation of sensory perception of pain(GO:0051930) regulation of sensory perception(GO:0051931) |
| 0.1 | 7.1 | GO:0051289 | protein homotetramerization(GO:0051289) |
| 0.1 | 7.7 | GO:0007586 | digestion(GO:0007586) |
| 0.1 | 4.5 | GO:0000045 | autophagosome assembly(GO:0000045) |
| 0.1 | 10.0 | GO:0007606 | sensory perception of chemical stimulus(GO:0007606) |
| 0.1 | 0.3 | GO:0035726 | common myeloid progenitor cell proliferation(GO:0035726) |
| 0.1 | 2.1 | GO:0070207 | protein homotrimerization(GO:0070207) |
| 0.1 | 2.5 | GO:0006891 | intra-Golgi vesicle-mediated transport(GO:0006891) |
| 0.1 | 2.1 | GO:0010862 | positive regulation of pathway-restricted SMAD protein phosphorylation(GO:0010862) |
| 0.1 | 1.4 | GO:0043171 | peptide catabolic process(GO:0043171) |
| 0.1 | 1.3 | GO:0001913 | T cell mediated cytotoxicity(GO:0001913) |
| 0.1 | 1.5 | GO:0006911 | phagocytosis, engulfment(GO:0006911) |
| 0.0 | 0.5 | GO:0061469 | regulation of type B pancreatic cell proliferation(GO:0061469) |
| 0.0 | 0.4 | GO:0042501 | regulation of peptidyl-serine phosphorylation of STAT protein(GO:0033139) positive regulation of peptidyl-serine phosphorylation of STAT protein(GO:0033141) serine phosphorylation of STAT protein(GO:0042501) |
| 0.0 | 0.4 | GO:0044821 | meiotic telomere tethering at nuclear periphery(GO:0044821) meiotic attachment of telomere to nuclear envelope(GO:0070197) chromosome attachment to the nuclear envelope(GO:0097240) |
| 0.0 | 0.7 | GO:0006027 | glycosaminoglycan catabolic process(GO:0006027) |
| 0.0 | 2.8 | GO:0007218 | neuropeptide signaling pathway(GO:0007218) |
| 0.0 | 2.0 | GO:0030032 | lamellipodium assembly(GO:0030032) |
| 0.0 | 1.0 | GO:0000028 | ribosomal small subunit assembly(GO:0000028) |
| 0.0 | 1.6 | GO:0046580 | negative regulation of Ras protein signal transduction(GO:0046580) negative regulation of small GTPase mediated signal transduction(GO:0051058) |
| 0.0 | 0.1 | GO:2000825 | positive regulation of androgen receptor activity(GO:2000825) |
| 0.0 | 1.7 | GO:0097192 | signal transduction in absence of ligand(GO:0038034) extrinsic apoptotic signaling pathway in absence of ligand(GO:0097192) |
| 0.0 | 3.2 | GO:0030178 | negative regulation of Wnt signaling pathway(GO:0030178) |
| 0.0 | 0.6 | GO:0001522 | pseudouridine synthesis(GO:0001522) |
| 0.0 | 2.4 | GO:0071773 | response to BMP(GO:0071772) cellular response to BMP stimulus(GO:0071773) |
| 0.0 | 0.1 | GO:0002125 | maternal aggressive behavior(GO:0002125) |
| 0.0 | 0.9 | GO:0046854 | phosphatidylinositol phosphorylation(GO:0046854) |
| 0.0 | 0.3 | GO:0006515 | misfolded or incompletely synthesized protein catabolic process(GO:0006515) |
| 0.0 | 0.5 | GO:0007340 | acrosome reaction(GO:0007340) |
| 0.0 | 0.6 | GO:1900449 | regulation of glutamate receptor signaling pathway(GO:1900449) |
| 0.0 | 3.0 | GO:0042742 | defense response to bacterium(GO:0042742) |
| 0.0 | 0.0 | GO:0061668 | mitochondrial ribosome assembly(GO:0061668) |
| 0.0 | 1.0 | GO:0006641 | triglyceride metabolic process(GO:0006641) |
| 0.0 | 0.7 | GO:0042273 | ribosomal large subunit biogenesis(GO:0042273) |
| 0.0 | 0.1 | GO:0008616 | queuosine biosynthetic process(GO:0008616) queuosine metabolic process(GO:0046116) |
| 0.0 | 0.4 | GO:0031572 | mitotic G2 DNA damage checkpoint(GO:0007095) G2 DNA damage checkpoint(GO:0031572) |
| 0.0 | 0.0 | GO:0016598 | protein arginylation(GO:0016598) |
| 0.0 | 0.1 | GO:0051001 | negative regulation of nitric-oxide synthase activity(GO:0051001) |
| 0.0 | 0.1 | GO:0060723 | regulation of spongiotrophoblast cell proliferation(GO:0060721) regulation of cell proliferation involved in embryonic placenta development(GO:0060723) |
| 0.0 | 1.3 | GO:0090501 | RNA phosphodiester bond hydrolysis(GO:0090501) |
| 0.0 | 0.7 | GO:1902600 | hydrogen ion transmembrane transport(GO:1902600) |
Gene overrepresentation in cellular component category:
| Log-likelihood per target | Total log-likelihood | Term | Description |
|---|---|---|---|
| 10.6 | 42.6 | GO:0031838 | haptoglobin-hemoglobin complex(GO:0031838) |
| 5.9 | 17.6 | GO:0005853 | eukaryotic translation elongation factor 1 complex(GO:0005853) |
| 3.2 | 9.7 | GO:0032937 | SREBP-SCAP-Insig complex(GO:0032937) |
| 2.8 | 13.9 | GO:0060053 | neurofilament cytoskeleton(GO:0060053) |
| 2.5 | 12.5 | GO:0044316 | cone cell pedicle(GO:0044316) |
| 2.2 | 9.0 | GO:1990584 | cardiac Troponin complex(GO:1990584) |
| 1.9 | 15.3 | GO:0005861 | troponin complex(GO:0005861) |
| 1.9 | 27.8 | GO:0032982 | myosin filament(GO:0032982) |
| 1.6 | 10.9 | GO:0061617 | MICOS complex(GO:0061617) |
| 1.5 | 4.5 | GO:1990682 | CSF1-CSF1R complex(GO:1990682) |
| 1.2 | 9.4 | GO:0005964 | phosphorylase kinase complex(GO:0005964) |
| 1.0 | 21.5 | GO:0044217 | other organism(GO:0044215) other organism cell(GO:0044216) other organism part(GO:0044217) |
| 0.9 | 2.8 | GO:0030956 | glutamyl-tRNA(Gln) amidotransferase complex(GO:0030956) |
| 0.9 | 2.6 | GO:0044302 | dentate gyrus mossy fiber(GO:0044302) |
| 0.9 | 6.8 | GO:0044194 | cytolytic granule(GO:0044194) |
| 0.8 | 6.8 | GO:0005577 | fibrinogen complex(GO:0005577) |
| 0.8 | 10.0 | GO:0005687 | U4 snRNP(GO:0005687) |
| 0.8 | 3.9 | GO:0035867 | alphav-beta3 integrin-IGF-1-IGF1R complex(GO:0035867) |
| 0.8 | 3.1 | GO:0009330 | DNA topoisomerase complex (ATP-hydrolyzing)(GO:0009330) |
| 0.7 | 6.5 | GO:0061700 | GATOR2 complex(GO:0061700) |
| 0.7 | 8.4 | GO:0033180 | proton-transporting V-type ATPase, V1 domain(GO:0033180) |
| 0.7 | 3.5 | GO:0097169 | IPAF inflammasome complex(GO:0072557) AIM2 inflammasome complex(GO:0097169) |
| 0.7 | 4.2 | GO:0005787 | signal peptidase complex(GO:0005787) |
| 0.7 | 23.1 | GO:0033017 | sarcoplasmic reticulum membrane(GO:0033017) |
| 0.6 | 1.9 | GO:0098835 | presynaptic endosome(GO:0098830) presynaptic endocytic zone(GO:0098833) presynaptic endocytic zone membrane(GO:0098835) |
| 0.6 | 3.7 | GO:1990246 | uniplex complex(GO:1990246) |
| 0.6 | 11.6 | GO:0030056 | hemidesmosome(GO:0030056) |
| 0.5 | 3.2 | GO:0002142 | stereocilia ankle link complex(GO:0002142) |
| 0.5 | 2.1 | GO:0005956 | protein kinase CK2 complex(GO:0005956) |
| 0.5 | 5.7 | GO:0005750 | mitochondrial respiratory chain complex III(GO:0005750) |
| 0.5 | 6.6 | GO:0000276 | mitochondrial proton-transporting ATP synthase complex, coupling factor F(o)(GO:0000276) |
| 0.5 | 7.7 | GO:0005753 | mitochondrial proton-transporting ATP synthase complex(GO:0005753) |
| 0.5 | 1.9 | GO:0044299 | C-fiber(GO:0044299) |
| 0.5 | 6.0 | GO:0036379 | striated muscle thin filament(GO:0005865) myofilament(GO:0036379) |
| 0.4 | 3.5 | GO:0005916 | fascia adherens(GO:0005916) |
| 0.4 | 4.7 | GO:0017071 | intracellular cyclic nucleotide activated cation channel complex(GO:0017071) |
| 0.4 | 3.3 | GO:0005638 | lamin filament(GO:0005638) |
| 0.4 | 7.0 | GO:0030061 | mitochondrial crista(GO:0030061) |
| 0.4 | 3.6 | GO:0005742 | mitochondrial outer membrane translocase complex(GO:0005742) |
| 0.4 | 6.0 | GO:0031045 | dense core granule(GO:0031045) |
| 0.4 | 8.0 | GO:0043196 | varicosity(GO:0043196) |
| 0.4 | 1.9 | GO:0035859 | Seh1-associated complex(GO:0035859) |
| 0.4 | 4.1 | GO:0005797 | Golgi medial cisterna(GO:0005797) |
| 0.4 | 5.8 | GO:0005751 | mitochondrial respiratory chain complex IV(GO:0005751) |
| 0.3 | 1.8 | GO:0033269 | internode region of axon(GO:0033269) |
| 0.3 | 0.9 | GO:0042584 | chromaffin granule membrane(GO:0042584) |
| 0.3 | 1.8 | GO:0005955 | calcineurin complex(GO:0005955) |
| 0.3 | 4.6 | GO:0044224 | juxtaparanode region of axon(GO:0044224) |
| 0.3 | 8.2 | GO:0016529 | sarcoplasmic reticulum(GO:0016529) |
| 0.3 | 13.8 | GO:0016459 | myosin complex(GO:0016459) |
| 0.2 | 2.0 | GO:0071439 | CORVET complex(GO:0033263) clathrin complex(GO:0071439) |
| 0.2 | 11.4 | GO:0009295 | nucleoid(GO:0009295) mitochondrial nucleoid(GO:0042645) |
| 0.2 | 1.5 | GO:0042406 | extrinsic component of endoplasmic reticulum membrane(GO:0042406) |
| 0.2 | 15.0 | GO:0097517 | stress fiber(GO:0001725) contractile actin filament bundle(GO:0097517) |
| 0.2 | 4.9 | GO:0008074 | guanylate cyclase complex, soluble(GO:0008074) |
| 0.2 | 9.6 | GO:0005747 | mitochondrial respiratory chain complex I(GO:0005747) NADH dehydrogenase complex(GO:0030964) respiratory chain complex I(GO:0045271) |
| 0.2 | 0.7 | GO:0031092 | platelet alpha granule membrane(GO:0031092) |
| 0.2 | 51.3 | GO:0005743 | mitochondrial inner membrane(GO:0005743) |
| 0.2 | 3.1 | GO:0032592 | integral component of mitochondrial membrane(GO:0032592) |
| 0.2 | 2.6 | GO:0030126 | COPI vesicle coat(GO:0030126) |
| 0.2 | 1.2 | GO:0031595 | nuclear proteasome complex(GO:0031595) |
| 0.1 | 2.5 | GO:0090665 | dystrophin-associated glycoprotein complex(GO:0016010) glycoprotein complex(GO:0090665) |
| 0.1 | 1.5 | GO:0032426 | stereocilium tip(GO:0032426) |
| 0.1 | 1.5 | GO:0072546 | ER membrane protein complex(GO:0072546) |
| 0.1 | 0.5 | GO:0020016 | ciliary pocket(GO:0020016) ciliary pocket membrane(GO:0020018) |
| 0.1 | 1.3 | GO:0016471 | vacuolar proton-transporting V-type ATPase complex(GO:0016471) |
| 0.1 | 5.1 | GO:0005834 | heterotrimeric G-protein complex(GO:0005834) |
| 0.1 | 2.2 | GO:0005640 | nuclear outer membrane(GO:0005640) |
| 0.1 | 7.7 | GO:0005811 | lipid particle(GO:0005811) |
| 0.1 | 4.2 | GO:0005758 | mitochondrial intermembrane space(GO:0005758) |
| 0.1 | 3.7 | GO:0005790 | smooth endoplasmic reticulum(GO:0005790) |
| 0.1 | 1.1 | GO:0030877 | beta-catenin destruction complex(GO:0030877) |
| 0.1 | 1.4 | GO:0000164 | protein phosphatase type 1 complex(GO:0000164) |
| 0.1 | 0.5 | GO:0048179 | activin receptor complex(GO:0048179) |
| 0.1 | 1.2 | GO:0035253 | ciliary rootlet(GO:0035253) |
| 0.1 | 1.6 | GO:0031235 | intrinsic component of the cytoplasmic side of the plasma membrane(GO:0031235) |
| 0.1 | 9.0 | GO:0005741 | mitochondrial outer membrane(GO:0005741) |
| 0.1 | 0.6 | GO:0001652 | granular component(GO:0001652) |
| 0.1 | 4.3 | GO:0005637 | nuclear inner membrane(GO:0005637) |
| 0.1 | 8.5 | GO:0030018 | Z disc(GO:0030018) |
| 0.1 | 1.7 | GO:0043194 | axon initial segment(GO:0043194) |
| 0.1 | 2.1 | GO:0033116 | endoplasmic reticulum-Golgi intermediate compartment membrane(GO:0033116) |
| 0.1 | 0.4 | GO:0033588 | Elongator holoenzyme complex(GO:0033588) |
| 0.1 | 3.2 | GO:0005793 | endoplasmic reticulum-Golgi intermediate compartment(GO:0005793) |
| 0.1 | 3.3 | GO:0016235 | aggresome(GO:0016235) |
| 0.1 | 4.4 | GO:0005913 | cell-cell adherens junction(GO:0005913) |
| 0.1 | 1.6 | GO:0001533 | cornified envelope(GO:0001533) |
| 0.1 | 3.0 | GO:0034704 | calcium channel complex(GO:0034704) |
| 0.1 | 0.4 | GO:0005726 | perichromatin fibrils(GO:0005726) |
| 0.1 | 1.0 | GO:0005666 | DNA-directed RNA polymerase III complex(GO:0005666) |
| 0.1 | 4.1 | GO:0031225 | anchored component of membrane(GO:0031225) |
| 0.1 | 0.4 | GO:0071014 | post-mRNA release spliceosomal complex(GO:0071014) |
| 0.0 | 18.1 | GO:0005874 | microtubule(GO:0005874) |
| 0.0 | 1.3 | GO:0030670 | phagocytic vesicle membrane(GO:0030670) |
| 0.0 | 0.7 | GO:0000421 | autophagosome membrane(GO:0000421) |
| 0.0 | 0.7 | GO:0032420 | stereocilium(GO:0032420) |
| 0.0 | 2.4 | GO:0030016 | myofibril(GO:0030016) |
| 0.0 | 3.0 | GO:0022625 | cytosolic large ribosomal subunit(GO:0022625) |
| 0.0 | 0.2 | GO:0097197 | tetraspanin-enriched microdomain(GO:0097197) |
| 0.0 | 47.1 | GO:0005615 | extracellular space(GO:0005615) |
| 0.0 | 17.6 | GO:0005789 | endoplasmic reticulum membrane(GO:0005789) |
| 0.0 | 0.7 | GO:0030687 | preribosome, large subunit precursor(GO:0030687) |
| 0.0 | 1.4 | GO:0032587 | ruffle membrane(GO:0032587) |
| 0.0 | 24.7 | GO:0005739 | mitochondrion(GO:0005739) |
| 0.0 | 0.9 | GO:0031519 | PcG protein complex(GO:0031519) |
| 0.0 | 0.1 | GO:0016282 | eukaryotic 43S preinitiation complex(GO:0016282) |
| 0.0 | 1.0 | GO:0022627 | cytosolic small ribosomal subunit(GO:0022627) |
Gene overrepresentation in molecular function category:
| Log-likelihood per target | Total log-likelihood | Term | Description |
|---|---|---|---|
| 14.2 | 42.6 | GO:0031720 | haptoglobin binding(GO:0031720) |
| 6.5 | 19.4 | GO:0016748 | succinyltransferase activity(GO:0016748) |
| 3.6 | 21.3 | GO:0004126 | cytidine deaminase activity(GO:0004126) |
| 2.9 | 8.8 | GO:2001070 | starch binding(GO:2001070) |
| 2.7 | 33.0 | GO:0005344 | oxygen transporter activity(GO:0005344) |
| 2.6 | 10.4 | GO:0005219 | ryanodine-sensitive calcium-release channel activity(GO:0005219) |
| 2.5 | 15.1 | GO:0004470 | malic enzyme activity(GO:0004470) malate dehydrogenase (decarboxylating) (NAD+) activity(GO:0004471) malate dehydrogenase (decarboxylating) (NADP+) activity(GO:0004473) |
| 2.3 | 9.4 | GO:0051431 | corticotropin-releasing hormone receptor 2 binding(GO:0051431) |
| 2.3 | 6.8 | GO:0016509 | long-chain-enoyl-CoA hydratase activity(GO:0016508) long-chain-3-hydroxyacyl-CoA dehydrogenase activity(GO:0016509) |
| 2.2 | 9.0 | GO:0030172 | troponin C binding(GO:0030172) |
| 2.1 | 34.1 | GO:0051371 | muscle alpha-actinin binding(GO:0051371) |
| 2.0 | 8.2 | GO:0035877 | death effector domain binding(GO:0035877) |
| 1.7 | 6.9 | GO:0003876 | AMP deaminase activity(GO:0003876) adenosine-phosphate deaminase activity(GO:0047623) |
| 1.6 | 4.9 | GO:0031752 | D5 dopamine receptor binding(GO:0031752) |
| 1.5 | 9.0 | GO:0008865 | glucokinase activity(GO:0004340) hexokinase activity(GO:0004396) fructokinase activity(GO:0008865) mannokinase activity(GO:0019158) |
| 1.5 | 4.4 | GO:0030337 | DNA polymerase processivity factor activity(GO:0030337) |
| 1.4 | 4.1 | GO:0004911 | interleukin-2 receptor activity(GO:0004911) |
| 1.3 | 5.3 | GO:0004027 | alcohol sulfotransferase activity(GO:0004027) |
| 1.3 | 14.4 | GO:0016783 | sulfurtransferase activity(GO:0016783) |
| 1.2 | 9.4 | GO:0004689 | phosphorylase kinase activity(GO:0004689) |
| 1.1 | 3.3 | GO:0047025 | 3-oxoacyl-[acyl-carrier-protein] reductase (NADH) activity(GO:0047025) |
| 1.1 | 29.5 | GO:0004181 | metallocarboxypeptidase activity(GO:0004181) |
| 1.1 | 6.5 | GO:0070728 | leucine binding(GO:0070728) |
| 1.0 | 7.7 | GO:0016413 | O-acetyltransferase activity(GO:0016413) |
| 0.9 | 2.8 | GO:0050567 | glutaminyl-tRNA synthase (glutamine-hydrolyzing) activity(GO:0050567) |
| 0.9 | 3.5 | GO:0033192 | calcium-dependent protein serine/threonine phosphatase activity(GO:0004723) calmodulin-dependent protein phosphatase activity(GO:0033192) |
| 0.9 | 13.9 | GO:0019215 | intermediate filament binding(GO:0019215) |
| 0.8 | 23.5 | GO:0008395 | steroid hydroxylase activity(GO:0008395) |
| 0.8 | 4.1 | GO:0015183 | L-aspartate transmembrane transporter activity(GO:0015183) |
| 0.8 | 17.6 | GO:0003746 | translation elongation factor activity(GO:0003746) |
| 0.8 | 3.9 | GO:0019960 | C-X3-C chemokine binding(GO:0019960) neuregulin binding(GO:0038132) |
| 0.8 | 3.9 | GO:0004974 | leukotriene receptor activity(GO:0004974) |
| 0.8 | 2.3 | GO:0009384 | N-acylmannosamine kinase activity(GO:0009384) |
| 0.8 | 3.8 | GO:0004062 | aryl sulfotransferase activity(GO:0004062) |
| 0.8 | 15.0 | GO:0046933 | proton-transporting ATP synthase activity, rotational mechanism(GO:0046933) |
| 0.7 | 5.7 | GO:0008121 | ubiquinol-cytochrome-c reductase activity(GO:0008121) oxidoreductase activity, acting on diphenols and related substances as donors(GO:0016679) oxidoreductase activity, acting on diphenols and related substances as donors, cytochrome as acceptor(GO:0016681) |
| 0.7 | 4.2 | GO:0032051 | clathrin light chain binding(GO:0032051) |
| 0.7 | 2.8 | GO:0016492 | G-protein coupled neurotensin receptor activity(GO:0016492) |
| 0.7 | 7.4 | GO:0004887 | thyroid hormone receptor activity(GO:0004887) |
| 0.7 | 4.7 | GO:0010340 | carboxyl-O-methyltransferase activity(GO:0010340) protein carboxyl O-methyltransferase activity(GO:0051998) |
| 0.6 | 2.6 | GO:0036004 | GAF domain binding(GO:0036004) |
| 0.6 | 2.5 | GO:0047756 | chondroitin 4-sulfotransferase activity(GO:0047756) |
| 0.6 | 6.2 | GO:0031730 | CCR5 chemokine receptor binding(GO:0031730) |
| 0.6 | 8.6 | GO:0033038 | bitter taste receptor activity(GO:0033038) |
| 0.6 | 7.1 | GO:0005223 | intracellular cGMP activated cation channel activity(GO:0005223) |
| 0.6 | 6.4 | GO:0009931 | calcium-dependent protein serine/threonine kinase activity(GO:0009931) |
| 0.6 | 6.7 | GO:0004862 | cAMP-dependent protein kinase inhibitor activity(GO:0004862) |
| 0.6 | 7.8 | GO:0008484 | sulfuric ester hydrolase activity(GO:0008484) |
| 0.5 | 4.4 | GO:0005169 | neurotrophin TRKB receptor binding(GO:0005169) |
| 0.5 | 4.9 | GO:0001730 | 2'-5'-oligoadenylate synthetase activity(GO:0001730) |
| 0.5 | 3.1 | GO:0047961 | glycine N-acyltransferase activity(GO:0047961) |
| 0.5 | 10.9 | GO:0047617 | acyl-CoA hydrolase activity(GO:0047617) |
| 0.5 | 3.1 | GO:0003917 | DNA topoisomerase type I activity(GO:0003917) |
| 0.5 | 3.0 | GO:0004982 | N-formyl peptide receptor activity(GO:0004982) |
| 0.5 | 4.5 | GO:0070567 | cytidylyltransferase activity(GO:0070567) |
| 0.5 | 1.5 | GO:0002114 | interleukin-33 receptor activity(GO:0002114) |
| 0.5 | 6.4 | GO:0042301 | phosphate ion binding(GO:0042301) |
| 0.4 | 1.8 | GO:0004459 | L-lactate dehydrogenase activity(GO:0004459) |
| 0.4 | 12.5 | GO:0030552 | cAMP binding(GO:0030552) |
| 0.4 | 6.3 | GO:0016493 | C-C chemokine receptor activity(GO:0016493) |
| 0.4 | 4.1 | GO:0003810 | protein-glutamine gamma-glutamyltransferase activity(GO:0003810) |
| 0.4 | 3.3 | GO:0005521 | lamin binding(GO:0005521) |
| 0.4 | 12.3 | GO:0016676 | cytochrome-c oxidase activity(GO:0004129) heme-copper terminal oxidase activity(GO:0015002) oxidoreductase activity, acting on a heme group of donors, oxygen as acceptor(GO:0016676) |
| 0.4 | 3.6 | GO:0015266 | protein channel activity(GO:0015266) |
| 0.4 | 3.3 | GO:0015217 | ATP transmembrane transporter activity(GO:0005347) ADP transmembrane transporter activity(GO:0015217) |
| 0.4 | 5.1 | GO:0017154 | semaphorin receptor activity(GO:0017154) |
| 0.3 | 3.8 | GO:0050897 | cobalt ion binding(GO:0050897) |
| 0.3 | 11.6 | GO:0008307 | structural constituent of muscle(GO:0008307) |
| 0.3 | 1.7 | GO:0031782 | melanocortin receptor binding(GO:0031779) type 3 melanocortin receptor binding(GO:0031781) type 4 melanocortin receptor binding(GO:0031782) |
| 0.3 | 1.0 | GO:0016520 | growth hormone-releasing hormone receptor activity(GO:0016520) |
| 0.3 | 2.9 | GO:0047498 | calcium-dependent phospholipase A2 activity(GO:0047498) |
| 0.3 | 2.2 | GO:0035375 | zymogen binding(GO:0035375) |
| 0.3 | 3.5 | GO:0097200 | cysteine-type endopeptidase activity involved in execution phase of apoptosis(GO:0097200) |
| 0.3 | 1.9 | GO:0008294 | calcium- and calmodulin-responsive adenylate cyclase activity(GO:0008294) |
| 0.3 | 3.4 | GO:0008131 | primary amine oxidase activity(GO:0008131) |
| 0.3 | 1.5 | GO:0019770 | IgG receptor activity(GO:0019770) |
| 0.3 | 4.3 | GO:0045236 | CXCR chemokine receptor binding(GO:0045236) |
| 0.3 | 1.8 | GO:0004994 | somatostatin receptor activity(GO:0004994) |
| 0.3 | 2.4 | GO:0031404 | chloride ion binding(GO:0031404) |
| 0.3 | 1.8 | GO:0016018 | cyclosporin A binding(GO:0016018) |
| 0.3 | 8.0 | GO:0043531 | ADP binding(GO:0043531) |
| 0.3 | 0.8 | GO:0051916 | granulocyte colony-stimulating factor binding(GO:0051916) |
| 0.3 | 2.6 | GO:0030346 | protein phosphatase 2B binding(GO:0030346) |
| 0.3 | 10.9 | GO:0015175 | neutral amino acid transmembrane transporter activity(GO:0015175) |
| 0.3 | 2.0 | GO:0004966 | galanin receptor activity(GO:0004966) |
| 0.3 | 1.3 | GO:0008502 | melatonin receptor activity(GO:0008502) |
| 0.2 | 7.7 | GO:0015020 | glucuronosyltransferase activity(GO:0015020) |
| 0.2 | 2.0 | GO:0034046 | poly(G) binding(GO:0034046) |
| 0.2 | 9.6 | GO:0004364 | glutathione transferase activity(GO:0004364) |
| 0.2 | 1.0 | GO:0005333 | norepinephrine transmembrane transporter activity(GO:0005333) |
| 0.2 | 0.7 | GO:0004924 | oncostatin-M receptor activity(GO:0004924) |
| 0.2 | 0.7 | GO:0042806 | fucose binding(GO:0042806) |
| 0.2 | 2.4 | GO:0000774 | adenyl-nucleotide exchange factor activity(GO:0000774) |
| 0.2 | 6.0 | GO:0005086 | ARF guanyl-nucleotide exchange factor activity(GO:0005086) |
| 0.2 | 1.2 | GO:0070137 | ubiquitin-like protein-specific endopeptidase activity(GO:0070137) SUMO-specific endopeptidase activity(GO:0070139) |
| 0.2 | 0.9 | GO:0044378 | non-sequence-specific DNA binding, bending(GO:0044378) |
| 0.2 | 4.1 | GO:0099589 | G-protein coupled serotonin receptor activity(GO:0004993) serotonin receptor activity(GO:0099589) |
| 0.2 | 3.6 | GO:0000146 | microfilament motor activity(GO:0000146) |
| 0.2 | 19.9 | GO:0005200 | structural constituent of cytoskeleton(GO:0005200) |
| 0.2 | 3.0 | GO:0015643 | toxic substance binding(GO:0015643) |
| 0.2 | 4.1 | GO:0070628 | proteasome binding(GO:0070628) |
| 0.2 | 51.8 | GO:0008236 | serine-type peptidase activity(GO:0008236) |
| 0.2 | 2.7 | GO:0004683 | calmodulin-dependent protein kinase activity(GO:0004683) |
| 0.2 | 1.9 | GO:0032050 | clathrin heavy chain binding(GO:0032050) clathrin adaptor activity(GO:0035615) endocytic adaptor activity(GO:0098748) |
| 0.2 | 1.0 | GO:0030229 | very-low-density lipoprotein particle receptor activity(GO:0030229) |
| 0.2 | 20.7 | GO:0051117 | ATPase binding(GO:0051117) |
| 0.2 | 1.2 | GO:0036402 | proteasome-activating ATPase activity(GO:0036402) |
| 0.2 | 1.7 | GO:0086080 | protein binding involved in heterotypic cell-cell adhesion(GO:0086080) |
| 0.2 | 0.4 | GO:0008607 | phosphorylase kinase regulator activity(GO:0008607) |
| 0.2 | 0.5 | GO:0035596 | methylthiotransferase activity(GO:0035596) transferase activity, transferring alkylthio groups(GO:0050497) |
| 0.2 | 3.1 | GO:0005149 | interleukin-1 receptor binding(GO:0005149) |
| 0.2 | 3.1 | GO:0070402 | NADPH binding(GO:0070402) |
| 0.2 | 2.4 | GO:0001206 | transcriptional repressor activity, RNA polymerase II distal enhancer sequence-specific binding(GO:0001206) |
| 0.2 | 1.7 | GO:0015562 | efflux transmembrane transporter activity(GO:0015562) |
| 0.2 | 3.1 | GO:0005537 | mannose binding(GO:0005537) |
| 0.2 | 3.8 | GO:0004190 | aspartic-type endopeptidase activity(GO:0004190) |
| 0.2 | 1.7 | GO:0003841 | 1-acylglycerol-3-phosphate O-acyltransferase activity(GO:0003841) |
| 0.2 | 2.4 | GO:0002161 | aminoacyl-tRNA editing activity(GO:0002161) |
| 0.2 | 63.3 | GO:0005549 | odorant binding(GO:0005549) |
| 0.2 | 1.5 | GO:0035613 | RNA stem-loop binding(GO:0035613) |
| 0.2 | 2.7 | GO:0031005 | filamin binding(GO:0031005) |
| 0.1 | 10.9 | GO:0032947 | protein complex scaffold(GO:0032947) |
| 0.1 | 3.4 | GO:0071949 | FAD binding(GO:0071949) |
| 0.1 | 2.2 | GO:0042288 | MHC class I protein binding(GO:0042288) |
| 0.1 | 10.1 | GO:0004197 | cysteine-type endopeptidase activity(GO:0004197) |
| 0.1 | 3.1 | GO:0016790 | thiolester hydrolase activity(GO:0016790) |
| 0.1 | 3.1 | GO:0043325 | phosphatidylinositol-3,4-bisphosphate binding(GO:0043325) |
| 0.1 | 0.8 | GO:0086056 | voltage-gated calcium channel activity involved in AV node cell action potential(GO:0086056) |
| 0.1 | 115.7 | GO:0004984 | olfactory receptor activity(GO:0004984) |
| 0.1 | 5.5 | GO:0051018 | protein kinase A binding(GO:0051018) |
| 0.1 | 4.6 | GO:0004812 | aminoacyl-tRNA ligase activity(GO:0004812) ligase activity, forming carbon-oxygen bonds(GO:0016875) ligase activity, forming aminoacyl-tRNA and related compounds(GO:0016876) |
| 0.1 | 9.9 | GO:0016651 | oxidoreductase activity, acting on NAD(P)H(GO:0016651) |
| 0.1 | 20.1 | GO:0003714 | transcription corepressor activity(GO:0003714) |
| 0.1 | 23.4 | GO:0030414 | peptidase inhibitor activity(GO:0030414) |
| 0.1 | 0.6 | GO:0070697 | activin receptor binding(GO:0070697) |
| 0.1 | 0.2 | GO:0015141 | succinate transmembrane transporter activity(GO:0015141) |
| 0.1 | 9.5 | GO:0016503 | pheromone receptor activity(GO:0016503) |
| 0.1 | 2.3 | GO:0015248 | sterol transporter activity(GO:0015248) |
| 0.1 | 1.1 | GO:0045028 | G-protein coupled nucleotide receptor activity(GO:0001608) G-protein coupled purinergic nucleotide receptor activity(GO:0045028) |
| 0.1 | 2.0 | GO:0048020 | CCR chemokine receptor binding(GO:0048020) |
| 0.1 | 5.3 | GO:0004843 | thiol-dependent ubiquitin-specific protease activity(GO:0004843) |
| 0.1 | 0.5 | GO:0016361 | activin receptor activity, type I(GO:0016361) |
| 0.1 | 1.9 | GO:0005248 | voltage-gated sodium channel activity(GO:0005248) voltage-gated ion channel activity involved in regulation of postsynaptic membrane potential(GO:1905030) |
| 0.1 | 22.3 | GO:0030246 | carbohydrate binding(GO:0030246) |
| 0.1 | 3.3 | GO:0005504 | fatty acid binding(GO:0005504) |
| 0.1 | 6.5 | GO:0030674 | protein binding, bridging(GO:0030674) |
| 0.1 | 24.8 | GO:0003779 | actin binding(GO:0003779) |
| 0.1 | 2.2 | GO:0008139 | nuclear localization sequence binding(GO:0008139) |
| 0.1 | 1.3 | GO:0031489 | myosin V binding(GO:0031489) |
| 0.1 | 1.0 | GO:0001056 | RNA polymerase III activity(GO:0001056) |
| 0.1 | 7.3 | GO:0004540 | ribonuclease activity(GO:0004540) |
| 0.1 | 0.9 | GO:0097371 | MDM2/MDM4 family protein binding(GO:0097371) |
| 0.1 | 1.2 | GO:0008199 | ferric iron binding(GO:0008199) |
| 0.1 | 1.4 | GO:0070006 | metalloaminopeptidase activity(GO:0070006) |
| 0.1 | 0.7 | GO:0004579 | oligosaccharyl transferase activity(GO:0004576) dolichyl-diphosphooligosaccharide-protein glycotransferase activity(GO:0004579) |
| 0.1 | 1.5 | GO:0017075 | syntaxin-1 binding(GO:0017075) |
| 0.1 | 7.4 | GO:0005179 | hormone activity(GO:0005179) |
| 0.0 | 2.9 | GO:0004722 | protein serine/threonine phosphatase activity(GO:0004722) |
| 0.0 | 1.2 | GO:0008175 | tRNA methyltransferase activity(GO:0008175) |
| 0.0 | 3.0 | GO:0016811 | hydrolase activity, acting on carbon-nitrogen (but not peptide) bonds, in linear amides(GO:0016811) |
| 0.0 | 1.4 | GO:0046875 | ephrin receptor binding(GO:0046875) |
| 0.0 | 2.1 | GO:0004715 | non-membrane spanning protein tyrosine kinase activity(GO:0004715) |
| 0.0 | 3.1 | GO:0033613 | activating transcription factor binding(GO:0033613) |
| 0.0 | 0.4 | GO:0005132 | type I interferon receptor binding(GO:0005132) |
| 0.0 | 1.9 | GO:0016831 | carboxy-lyase activity(GO:0016831) |
| 0.0 | 0.6 | GO:0009982 | pseudouridine synthase activity(GO:0009982) |
| 0.0 | 3.2 | GO:0051082 | unfolded protein binding(GO:0051082) |
| 0.0 | 0.7 | GO:0042813 | Wnt-activated receptor activity(GO:0042813) |
| 0.0 | 2.5 | GO:0003743 | translation initiation factor activity(GO:0003743) |
| 0.0 | 0.7 | GO:0005540 | hyaluronic acid binding(GO:0005540) |
| 0.0 | 0.3 | GO:1990948 | ligase inhibitor activity(GO:0055104) ubiquitin ligase inhibitor activity(GO:1990948) |
| 0.0 | 1.9 | GO:0001227 | transcriptional repressor activity, RNA polymerase II transcription regulatory region sequence-specific binding(GO:0001227) |
| 0.0 | 3.1 | GO:0043021 | ribonucleoprotein complex binding(GO:0043021) |
| 0.0 | 1.2 | GO:0019894 | kinesin binding(GO:0019894) |
| 0.0 | 1.0 | GO:0016765 | transferase activity, transferring alkyl or aryl (other than methyl) groups(GO:0016765) |
| 0.0 | 10.8 | GO:0008047 | enzyme activator activity(GO:0008047) |
| 0.0 | 14.5 | GO:0005198 | structural molecule activity(GO:0005198) |
| 0.0 | 0.3 | GO:0016805 | dipeptidase activity(GO:0016805) |
| 0.0 | 0.2 | GO:0048407 | platelet-derived growth factor binding(GO:0048407) |
| 0.0 | 8.7 | GO:0000982 | transcription factor activity, RNA polymerase II core promoter proximal region sequence-specific binding(GO:0000982) |
| 0.0 | 1.2 | GO:0002020 | protease binding(GO:0002020) |
| 0.0 | 0.5 | GO:0097110 | scaffold protein binding(GO:0097110) |
| 0.0 | 0.1 | GO:0043184 | vascular endothelial growth factor receptor 2 binding(GO:0043184) |
| 0.0 | 0.6 | GO:0005484 | SNAP receptor activity(GO:0005484) |
| 0.0 | 1.1 | GO:0001948 | glycoprotein binding(GO:0001948) |
| 0.0 | 0.2 | GO:0008171 | O-methyltransferase activity(GO:0008171) |
| 0.0 | 0.8 | GO:0017137 | Rab GTPase binding(GO:0017137) |
| 0.0 | 2.0 | GO:0008017 | microtubule binding(GO:0008017) |
Gene overrepresentation in curated gene sets: canonical pathways category:
| Log-likelihood per target | Total log-likelihood | Term | Description |
|---|---|---|---|
| 0.5 | 7.2 | ST TYPE I INTERFERON PATHWAY | Type I Interferon (alpha/beta IFN) Pathway |
| 0.4 | 8.4 | PID INTEGRIN A9B1 PATHWAY | Alpha9 beta1 integrin signaling events |
| 0.4 | 2.5 | ST PAC1 RECEPTOR PATHWAY | PAC1 Receptor Pathway |
| 0.4 | 8.2 | SA CASPASE CASCADE | Apoptosis is mediated by caspases, cysteine proteases arranged in a proteolytic cascade. |
| 0.4 | 17.7 | PID UPA UPAR PATHWAY | Urokinase-type plasminogen activator (uPA) and uPAR-mediated signaling |
| 0.3 | 18.1 | PID HNF3A PATHWAY | FOXA1 transcription factor network |
| 0.3 | 5.1 | PID S1P S1P4 PATHWAY | S1P4 pathway |
| 0.3 | 21.1 | PID HIF1 TFPATHWAY | HIF-1-alpha transcription factor network |
| 0.2 | 3.5 | PID SMAD2 3PATHWAY | Regulation of cytoplasmic and nuclear SMAD2/3 signaling |
| 0.2 | 6.6 | PID SYNDECAN 2 PATHWAY | Syndecan-2-mediated signaling events |
| 0.2 | 8.5 | PID P38 ALPHA BETA DOWNSTREAM PATHWAY | Signaling mediated by p38-alpha and p38-beta |
| 0.2 | 3.8 | PID HIF2PATHWAY | HIF-2-alpha transcription factor network |
| 0.2 | 4.1 | PID IL2 STAT5 PATHWAY | IL2 signaling events mediated by STAT5 |
| 0.2 | 4.5 | PID TCPTP PATHWAY | Signaling events mediated by TCPTP |
| 0.1 | 7.3 | PID A6B1 A6B4 INTEGRIN PATHWAY | a6b1 and a6b4 Integrin signaling |
| 0.1 | 4.2 | PID PI3KCI AKT PATHWAY | Class I PI3K signaling events mediated by Akt |
| 0.1 | 6.8 | PID BCR 5PATHWAY | BCR signaling pathway |
| 0.1 | 7.7 | PID AR PATHWAY | Coregulation of Androgen receptor activity |
| 0.1 | 1.9 | PID LPA4 PATHWAY | LPA4-mediated signaling events |
| 0.1 | 1.7 | PID INSULIN GLUCOSE PATHWAY | Insulin-mediated glucose transport |
| 0.1 | 1.4 | PID VEGFR1 PATHWAY | VEGFR1 specific signals |
| 0.1 | 2.9 | PID NFAT 3PATHWAY | Role of Calcineurin-dependent NFAT signaling in lymphocytes |
| 0.1 | 0.5 | PID ALK2 PATHWAY | ALK2 signaling events |
| 0.1 | 3.8 | PID ARF6 TRAFFICKING PATHWAY | Arf6 trafficking events |
| 0.1 | 3.3 | PID AP1 PATHWAY | AP-1 transcription factor network |
| 0.1 | 6.3 | WNT SIGNALING | Genes related to Wnt-mediated signal transduction |
| 0.1 | 3.1 | PID TAP63 PATHWAY | Validated transcriptional targets of TAp63 isoforms |
| 0.1 | 2.4 | PID AJDISS 2PATHWAY | Posttranslational regulation of adherens junction stability and dissassembly |
| 0.1 | 2.3 | PID ILK PATHWAY | Integrin-linked kinase signaling |
| 0.1 | 1.5 | PID IL1 PATHWAY | IL1-mediated signaling events |
| 0.1 | 1.0 | PID ANGIOPOIETIN RECEPTOR PATHWAY | Angiopoietin receptor Tie2-mediated signaling |
| 0.0 | 1.0 | PID CD8 TCR DOWNSTREAM PATHWAY | Downstream signaling in naïve CD8+ T cells |
| 0.0 | 0.9 | PID RAS PATHWAY | Regulation of Ras family activation |
| 0.0 | 6.9 | NABA ECM REGULATORS | Genes encoding enzymes and their regulators involved in the remodeling of the extracellular matrix |
| 0.0 | 1.9 | PID CMYB PATHWAY | C-MYB transcription factor network |
| 0.0 | 1.0 | PID DELTA NP63 PATHWAY | Validated transcriptional targets of deltaNp63 isoforms |
| 0.0 | 2.8 | PID P53 DOWNSTREAM PATHWAY | Direct p53 effectors |
| 0.0 | 0.7 | PID IL4 2PATHWAY | IL4-mediated signaling events |
| 0.0 | 0.4 | PID CIRCADIAN PATHWAY | Circadian rhythm pathway |
| 0.0 | 1.6 | NABA ECM AFFILIATED | Genes encoding proteins affiliated structurally or functionally to extracellular matrix proteins |
Gene overrepresentation in curated gene sets: REACTOME pathways category:
| Log-likelihood per target | Total log-likelihood | Term | Description |
|---|---|---|---|
| 2.1 | 81.7 | REACTOME STRIATED MUSCLE CONTRACTION | Genes involved in Striated Muscle Contraction |
| 2.1 | 4.2 | REACTOME TRANSPORT OF RIBONUCLEOPROTEINS INTO THE HOST NUCLEUS | Genes involved in Transport of Ribonucleoproteins into the Host Nucleus |
| 1.5 | 21.5 | REACTOME REGULATION OF COMPLEMENT CASCADE | Genes involved in Regulation of Complement cascade |
| 1.3 | 15.1 | REACTOME COMMON PATHWAY | Genes involved in Common Pathway |
| 1.1 | 19.4 | REACTOME METABOLISM OF PORPHYRINS | Genes involved in Metabolism of porphyrins |
| 1.1 | 10.0 | REACTOME GAMMA CARBOXYLATION TRANSPORT AND AMINO TERMINAL CLEAVAGE OF PROTEINS | Genes involved in Gamma-carboxylation, transport, and amino-terminal cleavage of proteins |
| 0.9 | 6.1 | REACTOME GLYCOPROTEIN HORMONES | Genes involved in Glycoprotein hormones |
| 0.8 | 7.8 | REACTOME THE ACTIVATION OF ARYLSULFATASES | Genes involved in The activation of arylsulfatases |
| 0.7 | 12.5 | REACTOME RAP1 SIGNALLING | Genes involved in Rap1 signalling |
| 0.7 | 18.8 | REACTOME DEGRADATION OF THE EXTRACELLULAR MATRIX | Genes involved in Degradation of the extracellular matrix |
| 0.6 | 10.7 | REACTOME POST CHAPERONIN TUBULIN FOLDING PATHWAY | Genes involved in Post-chaperonin tubulin folding pathway |
| 0.6 | 10.3 | REACTOME CITRIC ACID CYCLE TCA CYCLE | Genes involved in Citric acid cycle (TCA cycle) |
| 0.6 | 22.8 | REACTOME METABOLISM OF STEROID HORMONES AND VITAMINS A AND D | Genes involved in Metabolism of steroid hormones and vitamins A and D |
| 0.5 | 6.8 | REACTOME MITOCHONDRIAL FATTY ACID BETA OXIDATION | Genes involved in Mitochondrial Fatty Acid Beta-Oxidation |
| 0.5 | 8.7 | REACTOME OTHER SEMAPHORIN INTERACTIONS | Genes involved in Other semaphorin interactions |
| 0.5 | 6.2 | REACTOME IL 6 SIGNALING | Genes involved in Interleukin-6 signaling |
| 0.5 | 9.4 | REACTOME GLYCOGEN BREAKDOWN GLYCOGENOLYSIS | Genes involved in Glycogen breakdown (glycogenolysis) |
| 0.5 | 27.5 | REACTOME RESPIRATORY ELECTRON TRANSPORT | Genes involved in Respiratory electron transport |
| 0.4 | 6.9 | REACTOME PURINE SALVAGE | Genes involved in Purine salvage |
| 0.4 | 6.6 | REACTOME INTRINSIC PATHWAY | Genes involved in Intrinsic Pathway |
| 0.4 | 3.8 | REACTOME REGULATED PROTEOLYSIS OF P75NTR | Genes involved in Regulated proteolysis of p75NTR |
| 0.4 | 3.9 | REACTOME P130CAS LINKAGE TO MAPK SIGNALING FOR INTEGRINS | Genes involved in p130Cas linkage to MAPK signaling for integrins |
| 0.3 | 4.5 | REACTOME SYNTHESIS OF PE | Genes involved in Synthesis of PE |
| 0.3 | 6.7 | REACTOME PEROXISOMAL LIPID METABOLISM | Genes involved in Peroxisomal lipid metabolism |
| 0.3 | 4.2 | REACTOME SYNTHESIS SECRETION AND DEACYLATION OF GHRELIN | Genes involved in Synthesis, Secretion, and Deacylation of Ghrelin |
| 0.3 | 4.1 | REACTOME SEROTONIN RECEPTORS | Genes involved in Serotonin receptors |
| 0.3 | 7.3 | REACTOME INSULIN SYNTHESIS AND PROCESSING | Genes involved in Insulin Synthesis and Processing |
| 0.3 | 3.9 | REACTOME EICOSANOID LIGAND BINDING RECEPTORS | Genes involved in Eicosanoid ligand-binding receptors |
| 0.3 | 4.4 | REACTOME REGULATION OF AMPK ACTIVITY VIA LKB1 | Genes involved in Regulation of AMPK activity via LKB1 |
| 0.3 | 7.4 | REACTOME CASPASE MEDIATED CLEAVAGE OF CYTOSKELETAL PROTEINS | Genes involved in Caspase-mediated cleavage of cytoskeletal proteins |
| 0.3 | 5.7 | REACTOME DCC MEDIATED ATTRACTIVE SIGNALING | Genes involved in DCC mediated attractive signaling |
| 0.3 | 4.8 | REACTOME DESTABILIZATION OF MRNA BY TRISTETRAPROLIN TTP | Genes involved in Destabilization of mRNA by Tristetraprolin (TTP) |
| 0.2 | 8.2 | REACTOME INTRINSIC PATHWAY FOR APOPTOSIS | Genes involved in Intrinsic Pathway for Apoptosis |
| 0.2 | 3.8 | REACTOME FORMATION OF ATP BY CHEMIOSMOTIC COUPLING | Genes involved in Formation of ATP by chemiosmotic coupling |
| 0.2 | 14.4 | REACTOME METABOLISM OF VITAMINS AND COFACTORS | Genes involved in Metabolism of vitamins and cofactors |
| 0.2 | 6.1 | REACTOME GLUTATHIONE CONJUGATION | Genes involved in Glutathione conjugation |
| 0.2 | 2.6 | REACTOME COPI MEDIATED TRANSPORT | Genes involved in COPI Mediated Transport |
| 0.2 | 4.6 | REACTOME MITOCHONDRIAL TRNA AMINOACYLATION | Genes involved in Mitochondrial tRNA aminoacylation |
| 0.2 | 8.4 | REACTOME AMINO ACID TRANSPORT ACROSS THE PLASMA MEMBRANE | Genes involved in Amino acid transport across the plasma membrane |
| 0.2 | 2.7 | REACTOME CRMPS IN SEMA3A SIGNALING | Genes involved in CRMPs in Sema3A signaling |
| 0.2 | 3.8 | REACTOME OXYGEN DEPENDENT PROLINE HYDROXYLATION OF HYPOXIA INDUCIBLE FACTOR ALPHA | Genes involved in Oxygen-dependent Proline Hydroxylation of Hypoxia-inducible Factor Alpha |
| 0.2 | 7.8 | REACTOME MITOCHONDRIAL PROTEIN IMPORT | Genes involved in Mitochondrial Protein Import |
| 0.2 | 2.0 | REACTOME REGULATION OF IFNA SIGNALING | Genes involved in Regulation of IFNA signaling |
| 0.2 | 1.7 | REACTOME SPRY REGULATION OF FGF SIGNALING | Genes involved in Spry regulation of FGF signaling |
| 0.2 | 5.1 | REACTOME THROMBIN SIGNALLING THROUGH PROTEINASE ACTIVATED RECEPTORS PARS | Genes involved in Thrombin signalling through proteinase activated receptors (PARs) |
| 0.2 | 2.0 | REACTOME HORMONE SENSITIVE LIPASE HSL MEDIATED TRIACYLGLYCEROL HYDROLYSIS | Genes involved in Hormone-sensitive lipase (HSL)-mediated triacylglycerol hydrolysis |
| 0.1 | 4.9 | REACTOME IL RECEPTOR SHC SIGNALING | Genes involved in Interleukin receptor SHC signaling |
| 0.1 | 2.3 | REACTOME CELL EXTRACELLULAR MATRIX INTERACTIONS | Genes involved in Cell-extracellular matrix interactions |
| 0.1 | 6.3 | REACTOME CHEMOKINE RECEPTORS BIND CHEMOKINES | Genes involved in Chemokine receptors bind chemokines |
| 0.1 | 10.0 | REACTOME CLASS B 2 SECRETIN FAMILY RECEPTORS | Genes involved in Class B/2 (Secretin family receptors) |
| 0.1 | 1.9 | REACTOME ADENYLATE CYCLASE ACTIVATING PATHWAY | Genes involved in Adenylate cyclase activating pathway |
| 0.1 | 11.8 | REACTOME PPARA ACTIVATES GENE EXPRESSION | Genes involved in PPARA Activates Gene Expression |
| 0.1 | 1.2 | REACTOME BILE SALT AND ORGANIC ANION SLC TRANSPORTERS | Genes involved in Bile salt and organic anion SLC transporters |
| 0.1 | 4.6 | REACTOME BMAL1 CLOCK NPAS2 ACTIVATES CIRCADIAN EXPRESSION | Genes involved in BMAL1:CLOCK/NPAS2 Activates Circadian Expression |
| 0.1 | 0.9 | REACTOME NEF MEDIATED DOWNREGULATION OF MHC CLASS I COMPLEX CELL SURFACE EXPRESSION | Genes involved in Nef mediated downregulation of MHC class I complex cell surface expression |
| 0.1 | 0.8 | REACTOME INHIBITION OF INSULIN SECRETION BY ADRENALINE NORADRENALINE | Genes involved in Inhibition of Insulin Secretion by Adrenaline/Noradrenaline |
| 0.1 | 13.0 | REACTOME G ALPHA I SIGNALLING EVENTS | Genes involved in G alpha (i) signalling events |
| 0.1 | 2.5 | REACTOME CHONDROITIN SULFATE BIOSYNTHESIS | Genes involved in Chondroitin sulfate biosynthesis |
| 0.1 | 4.5 | REACTOME IL1 SIGNALING | Genes involved in Interleukin-1 signaling |
| 0.1 | 2.6 | REACTOME INSULIN RECEPTOR RECYCLING | Genes involved in Insulin receptor recycling |
| 0.1 | 3.4 | REACTOME INTERFERON ALPHA BETA SIGNALING | Genes involved in Interferon alpha/beta signaling |
| 0.1 | 7.0 | REACTOME GLYCEROPHOSPHOLIPID BIOSYNTHESIS | Genes involved in Glycerophospholipid biosynthesis |
| 0.1 | 2.8 | REACTOME SPHINGOLIPID DE NOVO BIOSYNTHESIS | Genes involved in Sphingolipid de novo biosynthesis |
| 0.1 | 1.8 | REACTOME PYRUVATE METABOLISM | Genes involved in Pyruvate metabolism |
| 0.1 | 1.1 | REACTOME CTNNB1 PHOSPHORYLATION CASCADE | Genes involved in Beta-catenin phosphorylation cascade |
| 0.1 | 6.7 | REACTOME L1CAM INTERACTIONS | Genes involved in L1CAM interactions |
| 0.1 | 2.4 | REACTOME ANTIVIRAL MECHANISM BY IFN STIMULATED GENES | Genes involved in Antiviral mechanism by IFN-stimulated genes |
| 0.1 | 3.8 | REACTOME NUCLEAR RECEPTOR TRANSCRIPTION PATHWAY | Genes involved in Nuclear Receptor transcription pathway |
| 0.1 | 2.7 | REACTOME GLUCOSE TRANSPORT | Genes involved in Glucose transport |
| 0.1 | 1.0 | REACTOME NA CL DEPENDENT NEUROTRANSMITTER TRANSPORTERS | Genes involved in Na+/Cl- dependent neurotransmitter transporters |
| 0.1 | 8.0 | REACTOME METABOLISM OF AMINO ACIDS AND DERIVATIVES | Genes involved in Metabolism of amino acids and derivatives |
| 0.1 | 2.8 | REACTOME CROSS PRESENTATION OF SOLUBLE EXOGENOUS ANTIGENS ENDOSOMES | Genes involved in Cross-presentation of soluble exogenous antigens (endosomes) |
| 0.1 | 0.7 | REACTOME HYALURONAN UPTAKE AND DEGRADATION | Genes involved in Hyaluronan uptake and degradation |
| 0.1 | 3.6 | REACTOME MHC CLASS II ANTIGEN PRESENTATION | Genes involved in MHC class II antigen presentation |
| 0.1 | 1.0 | REACTOME RNA POL III CHAIN ELONGATION | Genes involved in RNA Polymerase III Chain Elongation |
| 0.0 | 4.9 | REACTOME PEPTIDE CHAIN ELONGATION | Genes involved in Peptide chain elongation |
| 0.0 | 3.1 | REACTOME FACTORS INVOLVED IN MEGAKARYOCYTE DEVELOPMENT AND PLATELET PRODUCTION | Genes involved in Factors involved in megakaryocyte development and platelet production |
| 0.0 | 2.7 | REACTOME RESPONSE TO ELEVATED PLATELET CYTOSOLIC CA2 | Genes involved in Response to elevated platelet cytosolic Ca2+ |
| 0.0 | 1.2 | REACTOME TIGHT JUNCTION INTERACTIONS | Genes involved in Tight junction interactions |
| 0.0 | 1.0 | REACTOME APOPTOTIC CLEAVAGE OF CELLULAR PROTEINS | Genes involved in Apoptotic cleavage of cellular proteins |
| 0.0 | 0.7 | REACTOME SRP DEPENDENT COTRANSLATIONAL PROTEIN TARGETING TO MEMBRANE | Genes involved in SRP-dependent cotranslational protein targeting to membrane |
| 0.0 | 0.3 | REACTOME TRNA AMINOACYLATION | Genes involved in tRNA Aminoacylation |