Project
GSE53960: rat RNA-Seq transcriptomic Bodymap
Navigation
Downloads
Results for Mecom
Z-value: 0.54
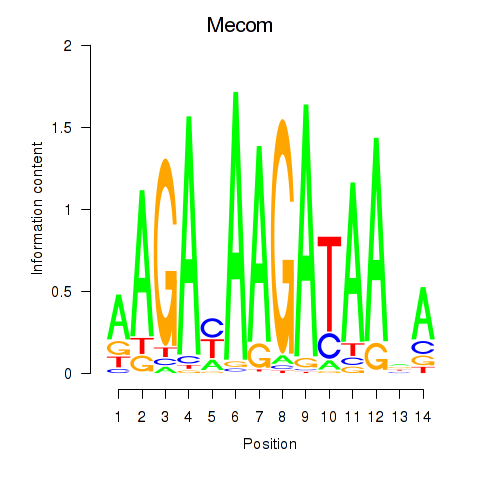
Motif logo
Transcription factors associated with Mecom
| Gene Symbol | Gene ID | Gene Info |
|---|---|---|
|
Mecom
|
ENSRNOG00000012645 | MDS1 and EVI1 complex locus |
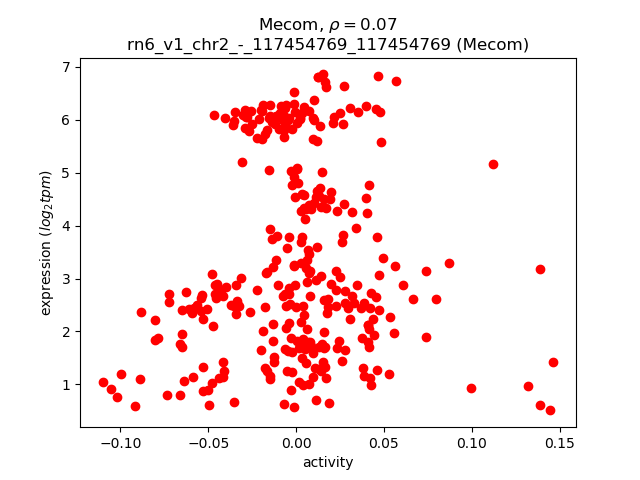
Activity-expression correlation:
| Gene | Promoter | Pearson corr. coef. | P-value | Plot |
|---|---|---|---|---|
| Mecom | rn6_v1_chr2_-_117454769_117454769 | 0.07 | 2.5e-01 | Click! |
Activity profile of Mecom motif
Sorted Z-values of Mecom motif
| Promoter | Log-likelihood | Transcript | Gene | Gene Info |
|---|---|---|---|---|
| chr5_-_77408323 | 27.18 |
ENSRNOT00000046857
ENSRNOT00000046760 |
LOC259245
Mup4
|
alpha-2u globulin PGCL5 major urinary protein 4 |
| chr5_-_77492013 | 25.97 |
ENSRNOT00000012293
|
LOC259245
|
alpha-2u globulin PGCL5 |
| chr5_-_52767592 | 24.48 |
ENSRNOT00000048383
|
LOC298111
|
alpha2u globulin |
| chr5_-_77316764 | 23.38 |
ENSRNOT00000071395
ENSRNOT00000076464 |
Mup4
|
major urinary protein 4 |
| chr7_-_116201756 | 13.41 |
ENSRNOT00000091401
|
Cyp11b2
|
cytochrome P450, family 11, subfamily b, polypeptide 2 |
| chr1_+_42121636 | 11.11 |
ENSRNOT00000025616
|
Myct1
|
myc target 1 |
| chr17_+_76008807 | 9.66 |
ENSRNOT00000070895
|
Echdc3
|
enoyl CoA hydratase domain containing 3 |
| chr17_+_15852548 | 9.46 |
ENSRNOT00000022203
|
Card19
|
caspase recruitment domain family, member 19 |
| chr9_-_76768770 | 8.23 |
ENSRNOT00000087779
ENSRNOT00000057849 |
Ikzf2
|
IKAROS family zinc finger 2 |
| chr16_+_75966352 | 6.68 |
ENSRNOT00000022774
|
Angpt2
|
angiopoietin 2 |
| chr11_+_60383431 | 5.58 |
ENSRNOT00000093295
|
Cd200
|
Cd200 molecule |
| chr3_-_107760550 | 5.48 |
ENSRNOT00000077091
ENSRNOT00000051638 |
Meis2
|
Meis homeobox 2 |
| chr13_+_89826254 | 5.43 |
ENSRNOT00000006141
|
F11r
|
F11 receptor |
| chr20_-_27657983 | 5.31 |
ENSRNOT00000057313
|
Fam26e
|
family with sequence similarity 26, member E |
| chr2_+_150756185 | 5.02 |
ENSRNOT00000088461
ENSRNOT00000036808 |
Mbnl1
|
muscleblind-like splicing regulator 1 |
| chr16_+_10727571 | 5.02 |
ENSRNOT00000084422
|
Mmrn2
|
multimerin 2 |
| chrX_+_21696772 | 4.80 |
ENSRNOT00000043559
|
Hsd17b10
|
hydroxysteroid (17-beta) dehydrogenase 10 |
| chr8_+_14060394 | 4.46 |
ENSRNOT00000014827
|
Smco4
|
single-pass membrane protein with coiled-coil domains 4 |
| chr5_+_148051126 | 4.14 |
ENSRNOT00000074415
|
Ptp4a2
|
protein tyrosine phosphatase type IVA, member 2 |
| chr10_+_57251253 | 4.05 |
ENSRNOT00000043171
|
LOC108348287
|
60S ribosomal protein L36a |
| chr5_+_134492756 | 4.02 |
ENSRNOT00000012888
ENSRNOT00000057095 ENSRNOT00000051385 |
Cyp4a1
|
cytochrome P450, family 4, subfamily a, polypeptide 1 |
| chr6_+_128050250 | 3.97 |
ENSRNOT00000077517
ENSRNOT00000013961 |
LOC500712
|
Ab1-233 |
| chr4_-_118578815 | 3.97 |
ENSRNOT00000080502
|
Anxa4
|
annexin A4 |
| chr7_+_97559841 | 3.95 |
ENSRNOT00000007326
|
Zhx2
|
zinc fingers and homeoboxes 2 |
| chr8_-_109560747 | 3.84 |
ENSRNOT00000087334
|
Ppp2r3a
|
protein phosphatase 2, regulatory subunit B'', alpha |
| chr9_-_20154077 | 3.77 |
ENSRNOT00000082904
|
Adgrf5
|
adhesion G protein-coupled receptor F5 |
| chr5_+_57239086 | 3.70 |
ENSRNOT00000060714
|
Spink4
|
serine peptidase inhibitor, Kazal type 4 |
| chr1_-_14412807 | 3.60 |
ENSRNOT00000074583
|
Tnfaip3
|
TNF alpha induced protein 3 |
| chr11_+_44877859 | 3.54 |
ENSRNOT00000060838
|
Col8a1
|
collagen type VIII alpha 1 chain |
| chr19_-_38344845 | 3.43 |
ENSRNOT00000072666
|
AABR07043748.1
|
|
| chr5_-_12172009 | 3.39 |
ENSRNOT00000061903
|
Pcmtd1
|
protein-L-isoaspartate (D-aspartate) O-methyltransferase domain containing 1 |
| chr4_-_82202096 | 3.26 |
ENSRNOT00000081824
|
LOC100912608
|
homeobox protein Hox-A10-like |
| chr8_+_71514281 | 2.92 |
ENSRNOT00000022256
|
Ns5atp9
|
NS5A (hepatitis C virus) transactivated protein 9 |
| chr9_-_121972055 | 2.80 |
ENSRNOT00000089735
|
AABR07068851.1
|
clusterin-like protein 1 |
| chr1_+_128924966 | 2.80 |
ENSRNOT00000019267
|
Igf1r
|
insulin-like growth factor 1 receptor |
| chr1_+_93242050 | 2.66 |
ENSRNOT00000013741
|
RGD1562402
|
similar to 60S ribosomal protein L27a |
| chr1_-_227506822 | 2.62 |
ENSRNOT00000091506
|
Ms4a7
|
membrane spanning 4-domains A7 |
| chr7_+_12471824 | 2.50 |
ENSRNOT00000068197
|
Sbno2
|
strawberry notch homolog 2 |
| chr20_+_3242470 | 2.46 |
ENSRNOT00000078110
ENSRNOT00000041502 |
RT1-T24-2
RT1-T24-1
|
RT1 class I, locus T24, gene 2 RT1 class I, locus T24, gene 1 |
| chr17_+_25082056 | 2.27 |
ENSRNOT00000037041
|
AABR07027339.1
|
|
| chr5_+_116973159 | 2.27 |
ENSRNOT00000046475
|
LOC100912024
|
uncharacterized LOC100912024 |
| chr4_+_1658278 | 2.19 |
ENSRNOT00000073845
|
Olr1250
|
olfactory receptor 1250 |
| chr1_+_264507985 | 2.19 |
ENSRNOT00000085811
|
Pax2
|
paired box 2 |
| chr5_+_69851171 | 2.15 |
ENSRNOT00000047780
|
AABR07048271.1
|
|
| chr13_+_98615287 | 1.98 |
ENSRNOT00000004032
|
Itpkb
|
inositol-trisphosphate 3-kinase B |
| chr3_+_158847203 | 1.92 |
ENSRNOT00000071502
|
LOC100912388
|
olfactory receptor 8B8-like |
| chr5_+_50381244 | 1.81 |
ENSRNOT00000012385
|
Cga
|
glycoprotein hormones, alpha polypeptide |
| chr8_+_113603533 | 1.76 |
ENSRNOT00000017280
|
Mrpl3
|
mitochondrial ribosomal protein L3 |
| chr14_+_63095720 | 1.69 |
ENSRNOT00000006071
|
Ppargc1a
|
PPARG coactivator 1 alpha |
| chr5_+_173148884 | 1.51 |
ENSRNOT00000041753
|
LOC100364191
|
hCG1994130-like |
| chr1_+_79727597 | 1.50 |
ENSRNOT00000034790
|
AC093995.1
|
|
| chr9_+_51302151 | 1.49 |
ENSRNOT00000085908
|
Gulp1
|
GULP, engulfment adaptor PTB domain containing 1 |
| chr15_-_55209342 | 1.44 |
ENSRNOT00000021752
|
Rb1
|
RB transcriptional corepressor 1 |
| chr17_+_39411721 | 1.17 |
ENSRNOT00000080680
ENSRNOT00000022705 ENSRNOT00000022659 |
Prl8a4
|
prolactin family 8, subfamily a, member 4 |
| chr11_-_82366505 | 1.10 |
ENSRNOT00000041326
|
RGD1559972
|
similar to ribosomal protein L27a |
| chr9_-_61033553 | 1.09 |
ENSRNOT00000002864
ENSRNOT00000082681 |
Gtf3c3
|
general transcription factor IIIC subunit 3 |
| chr1_-_20155960 | 1.08 |
ENSRNOT00000061389
|
Samd3
|
sterile alpha motif domain containing 3 |
| chr17_+_39455908 | 1.06 |
ENSRNOT00000068163
|
Prl8a3
|
prolactin family 8, subfamily a, member 3 |
| chr4_+_6282278 | 1.05 |
ENSRNOT00000010349
|
Kmt2c
|
lysine methyltransferase 2C |
| chr7_-_50034932 | 1.04 |
ENSRNOT00000081885
|
Ptprq
|
protein tyrosine phosphatase, receptor type, Q |
| chr5_+_154265097 | 1.04 |
ENSRNOT00000012342
|
Cnr2
|
cannabinoid receptor 2 |
| chr13_-_35048444 | 1.02 |
ENSRNOT00000009963
|
Gli2
|
GLI family zinc finger 2 |
| chr3_-_44177689 | 1.00 |
ENSRNOT00000006387
|
Cytip
|
cytohesin 1 interacting protein |
| chr10_+_106800142 | 0.99 |
ENSRNOT00000074899
|
LOC688282
|
hypothetical protein LOC688282 |
| chr8_+_43763859 | 0.93 |
ENSRNOT00000080504
|
Olr1328
|
olfactory receptor 1328 |
| chr7_+_58419197 | 0.88 |
ENSRNOT00000085829
|
Zfc3h1
|
zinc finger, C3H1-type containing |
| chr1_-_274107138 | 0.85 |
ENSRNOT00000078670
|
Smndc1
|
survival motor neuron domain containing 1 |
| chr8_-_32609212 | 0.80 |
ENSRNOT00000011329
|
Tmem45b
|
transmembrane protein 45b |
| chr6_-_36876805 | 0.79 |
ENSRNOT00000006482
|
Msgn1
|
mesogenin 1 |
| chr10_+_34519790 | 0.79 |
ENSRNOT00000052360
|
Mgat1
|
mannosyl (alpha-1,3-)-glycoprotein beta-1,2-N-acetylglucosaminyltransferase |
| chr3_-_29993715 | 0.79 |
ENSRNOT00000085801
|
Zeb2
|
zinc finger E-box binding homeobox 2 |
| chr13_+_92504374 | 0.79 |
ENSRNOT00000033697
|
Olr1602
|
olfactory receptor 1602 |
| chr1_-_94404211 | 0.72 |
ENSRNOT00000019463
|
Uri1
|
URI1, prefoldin-like chaperone |
| chr7_-_117719331 | 0.66 |
ENSRNOT00000088696
|
Cyhr1
|
cysteine and histidine rich 1 |
| chr6_+_8284878 | 0.65 |
ENSRNOT00000009581
|
Slc3a1
|
solute carrier family 3 member 1 |
| chr10_-_87437455 | 0.47 |
ENSRNOT00000051080
|
Krt39
|
keratin 39 |
| chr12_-_12330929 | 0.47 |
ENSRNOT00000001336
|
Bri3
|
brain protein I3 |
| chrX_-_111191932 | 0.45 |
ENSRNOT00000088050
ENSRNOT00000083613 |
Morc4
|
MORC family CW-type zinc finger 4 |
| chr10_-_36452378 | 0.43 |
ENSRNOT00000004872
|
Prop1
|
PROP paired-like homeobox 1 |
| chr2_-_196582997 | 0.42 |
ENSRNOT00000081672
|
AABR07012475.1
|
|
| chr8_+_40345160 | 0.41 |
ENSRNOT00000076308
|
Olr1200
|
olfactory receptor 1200 |
| chr19_+_38846201 | 0.37 |
ENSRNOT00000030768
ENSRNOT00000063977 |
Tango6
|
transport and golgi organization 6 homolog |
| chr2_-_187786700 | 0.34 |
ENSRNOT00000092257
ENSRNOT00000092612 ENSRNOT00000068360 |
Slc25a44
|
solute carrier family 25, member 44 |
| chr9_-_26932201 | 0.34 |
ENSRNOT00000017081
|
Mcm3
|
minichromosome maintenance complex component 3 |
| chr2_-_77784522 | 0.32 |
ENSRNOT00000030328
|
LOC310177
|
similar to RIKEN cDNA 0610040D20 |
| chr1_-_167765552 | 0.32 |
ENSRNOT00000024954
|
Bcl2l1-ps1
|
Bcl2-like 1, pseudogene 1 |
| chr4_-_131694755 | 0.31 |
ENSRNOT00000013271
|
Foxp1
|
forkhead box P1 |
| chr10_+_52334240 | 0.30 |
ENSRNOT00000005518
|
Zfp18
|
zinc finger protein 18 |
| chr3_+_147952879 | 0.24 |
ENSRNOT00000031922
|
Defb20
|
defensin beta 20 |
| chr7_+_13673934 | 0.24 |
ENSRNOT00000048564
|
Olr1085
|
olfactory receptor 1085 |
| chr1_-_217677997 | 0.22 |
ENSRNOT00000092824
|
Ppfia1
|
PTPRF interacting protein alpha 1 |
| chr15_+_34520142 | 0.18 |
ENSRNOT00000074659
|
Nynrin
|
NYN domain and retroviral integrase containing |
| chr20_+_1787174 | 0.13 |
ENSRNOT00000072824
ENSRNOT00000041883 |
Olr1738
|
olfactory receptor 1738 |
| chr3_+_72990358 | 0.12 |
ENSRNOT00000091920
|
Olr444
|
olfactory receptor 444 |
| chr3_-_148312420 | 0.12 |
ENSRNOT00000047416
ENSRNOT00000081272 |
Bcl2l1
|
Bcl2-like 1 |
| chr18_+_79813759 | 0.11 |
ENSRNOT00000021768
|
Zfp516
|
zinc finger protein 516 |
| chr1_+_230377079 | 0.08 |
ENSRNOT00000042937
|
Olr367
|
olfactory receptor 367 |
| chr3_-_4341771 | 0.05 |
ENSRNOT00000034694
|
LOC684988
|
similar to ribosomal protein S13 |
| chr4_+_52147641 | 0.03 |
ENSRNOT00000009458
|
Hyal4
|
hyaluronoglucosaminidase 4 |
| chr20_+_6205903 | 0.02 |
ENSRNOT00000092333
ENSRNOT00000092655 |
Kctd20
|
potassium channel tetramerization domain containing 20 |
| chr8_+_43722228 | 0.00 |
ENSRNOT00000084016
|
Olr1325
|
olfactory receptor 1325 |
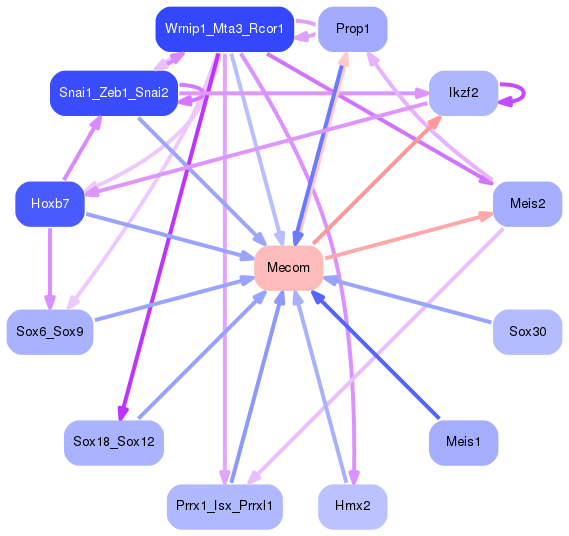
Network of associatons between targets according to the STRING database.

First level regulatory network of Mecom
Gene Ontology Analysis
Gene overrepresentation in biological process category:
| Log-likelihood per target | Total log-likelihood | Term | Description |
|---|---|---|---|
| 2.2 | 13.4 | GO:0051365 | cellular response to potassium ion starvation(GO:0051365) |
| 2.2 | 6.7 | GO:0048014 | Tie signaling pathway(GO:0048014) |
| 1.4 | 4.2 | GO:1903943 | regulation of hepatocyte apoptotic process(GO:1903943) negative regulation of hepatocyte apoptotic process(GO:1903944) |
| 1.3 | 3.8 | GO:0090249 | cell motility involved in somitogenic axis elongation(GO:0090247) regulation of cell motility involved in somitogenic axis elongation(GO:0090249) |
| 1.2 | 3.6 | GO:0070433 | negative regulation of toll-like receptor 3 signaling pathway(GO:0034140) toll-like receptor 5 signaling pathway(GO:0034146) negative regulation of nucleotide-binding oligomerization domain containing signaling pathway(GO:0070425) negative regulation of nucleotide-binding oligomerization domain containing 2 signaling pathway(GO:0070433) protein deubiquitination involved in ubiquitin-dependent protein catabolic process(GO:0071947) |
| 1.0 | 9.3 | GO:0043031 | negative regulation of macrophage activation(GO:0043031) |
| 1.0 | 4.0 | GO:0048252 | lauric acid metabolic process(GO:0048252) |
| 0.8 | 2.5 | GO:0071348 | cellular response to interleukin-11(GO:0071348) |
| 0.7 | 2.2 | GO:0035566 | regulation of metanephros size(GO:0035566) |
| 0.7 | 4.0 | GO:2000483 | negative regulation of interleukin-8 secretion(GO:2000483) |
| 0.6 | 1.7 | GO:2000182 | cellular response to nitrite(GO:0071250) response to nitrite(GO:0080033) response to resveratrol(GO:1904638) regulation of progesterone biosynthetic process(GO:2000182) |
| 0.6 | 5.0 | GO:0030948 | negative regulation of vascular endothelial growth factor receptor signaling pathway(GO:0030948) |
| 0.4 | 2.0 | GO:0033030 | negative regulation of neutrophil apoptotic process(GO:0033030) |
| 0.3 | 1.0 | GO:0021508 | floor plate formation(GO:0021508) |
| 0.3 | 5.4 | GO:0090557 | establishment of endothelial intestinal barrier(GO:0090557) |
| 0.3 | 0.8 | GO:0009227 | nucleotide-sugar catabolic process(GO:0009227) |
| 0.2 | 4.8 | GO:0033327 | Leydig cell differentiation(GO:0033327) |
| 0.2 | 5.0 | GO:0006376 | mRNA splice site selection(GO:0006376) |
| 0.1 | 0.4 | GO:0048850 | hypophysis morphogenesis(GO:0048850) |
| 0.1 | 1.0 | GO:0038171 | cannabinoid signaling pathway(GO:0038171) |
| 0.1 | 1.8 | GO:0046884 | follicle-stimulating hormone secretion(GO:0046884) |
| 0.1 | 0.3 | GO:0061470 | T follicular helper cell differentiation(GO:0061470) |
| 0.1 | 1.1 | GO:0061029 | eyelid development in camera-type eye(GO:0061029) |
| 0.1 | 0.2 | GO:1902748 | positive regulation of lens fiber cell differentiation(GO:1902748) |
| 0.1 | 4.0 | GO:0035019 | somatic stem cell population maintenance(GO:0035019) |
| 0.1 | 3.5 | GO:0035987 | endodermal cell differentiation(GO:0035987) |
| 0.1 | 5.5 | GO:0045638 | negative regulation of myeloid cell differentiation(GO:0045638) |
| 0.1 | 0.8 | GO:0007379 | segment specification(GO:0007379) |
| 0.1 | 1.0 | GO:0050910 | detection of mechanical stimulus involved in sensory perception of sound(GO:0050910) |
| 0.1 | 1.1 | GO:0006359 | regulation of transcription from RNA polymerase III promoter(GO:0006359) |
| 0.1 | 2.5 | GO:0002474 | antigen processing and presentation of peptide antigen via MHC class I(GO:0002474) |
| 0.0 | 0.1 | GO:1905218 | cellular response to astaxanthin(GO:1905218) |
| 0.0 | 4.1 | GO:0035335 | peptidyl-tyrosine dephosphorylation(GO:0035335) |
| 0.0 | 0.2 | GO:0015074 | DNA integration(GO:0015074) |
| 0.0 | 1.5 | GO:0006911 | phagocytosis, engulfment(GO:0006911) |
| 0.0 | 2.7 | GO:0008213 | protein methylation(GO:0006479) protein alkylation(GO:0008213) |
| 0.0 | 0.2 | GO:0090005 | negative regulation of establishment of protein localization to plasma membrane(GO:0090005) |
| 0.0 | 8.5 | GO:0006412 | translation(GO:0006412) |
| 0.0 | 0.3 | GO:0006270 | DNA replication initiation(GO:0006270) |
Gene overrepresentation in cellular component category:
| Log-likelihood per target | Total log-likelihood | Term | Description |
|---|---|---|---|
| 0.6 | 2.8 | GO:0035867 | alphav-beta3 integrin-IGF-1-IGF1R complex(GO:0035867) |
| 0.5 | 5.4 | GO:0036056 | filtration diaphragm(GO:0036056) slit diaphragm(GO:0036057) |
| 0.2 | 1.4 | GO:0035189 | Rb-E2F complex(GO:0035189) |
| 0.2 | 1.1 | GO:0000127 | transcription factor TFIIIC complex(GO:0000127) |
| 0.1 | 3.8 | GO:0000159 | protein phosphatase type 2A complex(GO:0000159) |
| 0.1 | 5.0 | GO:0010494 | cytoplasmic stress granule(GO:0010494) |
| 0.1 | 4.8 | GO:0009295 | nucleoid(GO:0009295) mitochondrial nucleoid(GO:0042645) |
| 0.1 | 1.1 | GO:0044666 | MLL3/4 complex(GO:0044666) |
| 0.1 | 1.0 | GO:0097542 | ciliary tip(GO:0097542) |
| 0.1 | 6.7 | GO:0022625 | cytosolic large ribosomal subunit(GO:0022625) |
| 0.1 | 2.2 | GO:0034451 | centriolar satellite(GO:0034451) |
| 0.1 | 1.7 | GO:0005719 | nuclear euchromatin(GO:0005719) |
| 0.1 | 5.0 | GO:0005604 | basement membrane(GO:0005604) |
| 0.0 | 5.6 | GO:0005913 | cell-cell adherens junction(GO:0005913) |
| 0.0 | 3.5 | GO:0005581 | collagen trimer(GO:0005581) |
| 0.0 | 0.7 | GO:0005665 | DNA-directed RNA polymerase II, core complex(GO:0005665) |
| 0.0 | 54.1 | GO:0005615 | extracellular space(GO:0005615) |
| 0.0 | 0.3 | GO:0042555 | MCM complex(GO:0042555) |
| 0.0 | 1.8 | GO:0005762 | organellar large ribosomal subunit(GO:0000315) mitochondrial large ribosomal subunit(GO:0005762) |
| 0.0 | 14.5 | GO:0031966 | mitochondrial membrane(GO:0031966) |
| 0.0 | 1.0 | GO:0032421 | stereocilium bundle(GO:0032421) |
| 0.0 | 4.4 | GO:0005769 | early endosome(GO:0005769) |
| 0.0 | 0.8 | GO:0015030 | Cajal body(GO:0015030) |
| 0.0 | 3.2 | GO:0031965 | nuclear membrane(GO:0031965) |
| 0.0 | 13.1 | GO:0005739 | mitochondrion(GO:0005739) |
Gene overrepresentation in molecular function category:
| Log-likelihood per target | Total log-likelihood | Term | Description |
|---|---|---|---|
| 10.1 | 50.6 | GO:0005550 | pheromone binding(GO:0005550) |
| 4.5 | 13.4 | GO:0004507 | steroid 11-beta-monooxygenase activity(GO:0004507) corticosterone 18-monooxygenase activity(GO:0047783) |
| 1.7 | 5.0 | GO:0001069 | regulatory region RNA binding(GO:0001069) |
| 1.0 | 4.0 | GO:0018685 | alkane 1-monooxygenase activity(GO:0018685) |
| 1.0 | 4.8 | GO:0030283 | testosterone dehydrogenase [NAD(P)] activity(GO:0030283) |
| 0.8 | 3.4 | GO:0004719 | protein-L-isoaspartate (D-aspartate) O-methyltransferase activity(GO:0004719) |
| 0.6 | 3.6 | GO:0061578 | Lys63-specific deubiquitinase activity(GO:0061578) |
| 0.3 | 2.8 | GO:0043559 | insulin binding(GO:0043559) |
| 0.3 | 1.4 | GO:0061676 | importin-alpha family protein binding(GO:0061676) |
| 0.3 | 1.1 | GO:0000995 | transcription factor activity, core RNA polymerase III binding(GO:0000995) |
| 0.3 | 1.0 | GO:0004949 | cannabinoid receptor activity(GO:0004949) |
| 0.2 | 2.2 | GO:0016175 | superoxide-generating NADPH oxidase activity(GO:0016175) |
| 0.2 | 2.0 | GO:0008440 | inositol-1,4,5-trisphosphate 3-kinase activity(GO:0008440) |
| 0.1 | 4.0 | GO:0051059 | NF-kappaB binding(GO:0051059) |
| 0.1 | 6.7 | GO:0030971 | receptor tyrosine kinase binding(GO:0030971) |
| 0.1 | 2.7 | GO:1990841 | promoter-specific chromatin binding(GO:1990841) |
| 0.1 | 2.5 | GO:0042605 | peptide antigen binding(GO:0042605) |
| 0.0 | 5.2 | GO:0004725 | protein tyrosine phosphatase activity(GO:0004725) |
| 0.0 | 1.1 | GO:0042800 | histone methyltransferase activity (H3-K4 specific)(GO:0042800) |
| 0.0 | 3.7 | GO:0004867 | serine-type endopeptidase inhibitor activity(GO:0004867) |
| 0.0 | 8.5 | GO:0003735 | structural constituent of ribosome(GO:0003735) |
| 0.0 | 0.4 | GO:0001206 | transcriptional repressor activity, RNA polymerase II distal enhancer sequence-specific binding(GO:0001206) |
| 0.0 | 3.8 | GO:0030674 | protein binding, bridging(GO:0030674) |
| 0.0 | 4.7 | GO:0003714 | transcription corepressor activity(GO:0003714) |
| 0.0 | 4.0 | GO:0005179 | hormone activity(GO:0005179) |
| 0.0 | 0.1 | GO:0051434 | BH3 domain binding(GO:0051434) |
| 0.0 | 5.5 | GO:0003712 | transcription cofactor activity(GO:0003712) |
| 0.0 | 0.3 | GO:0050681 | androgen receptor binding(GO:0050681) |
| 0.0 | 0.8 | GO:0008375 | acetylglucosaminyltransferase activity(GO:0008375) |
Gene overrepresentation in curated gene sets: canonical pathways category:
| Log-likelihood per target | Total log-likelihood | Term | Description |
|---|---|---|---|
| 0.3 | 2.0 | ST PAC1 RECEPTOR PATHWAY | PAC1 Receptor Pathway |
| 0.2 | 5.4 | PID INTEGRIN2 PATHWAY | Beta2 integrin cell surface interactions |
| 0.1 | 4.1 | PID PRL SIGNALING EVENTS PATHWAY | Signaling events mediated by PRL |
| 0.1 | 2.8 | PID IGF1 PATHWAY | IGF1 pathway |
| 0.1 | 3.6 | PID NFKAPPAB CANONICAL PATHWAY | Canonical NF-kappaB pathway |
| 0.1 | 6.7 | PID ANGIOPOIETIN RECEPTOR PATHWAY | Angiopoietin receptor Tie2-mediated signaling |
| 0.1 | 11.1 | PID MYC ACTIV PATHWAY | Validated targets of C-MYC transcriptional activation |
| 0.1 | 3.5 | PID SYNDECAN 1 PATHWAY | Syndecan-1-mediated signaling events |
| 0.1 | 1.7 | PID HDAC CLASSIII PATHWAY | Signaling events mediated by HDAC Class III |
| 0.1 | 1.0 | PID HEDGEHOG 2PATHWAY | Signaling events mediated by the Hedgehog family |
| 0.0 | 1.5 | PID ARF6 PATHWAY | Arf6 signaling events |
| 0.0 | 1.4 | PID FOXM1 PATHWAY | FOXM1 transcription factor network |
| 0.0 | 4.0 | NABA ECM AFFILIATED | Genes encoding proteins affiliated structurally or functionally to extracellular matrix proteins |
| 0.0 | 5.0 | NABA ECM GLYCOPROTEINS | Genes encoding structural ECM glycoproteins |
| 0.0 | 1.8 | PID REG GR PATHWAY | Glucocorticoid receptor regulatory network |
Gene overrepresentation in curated gene sets: REACTOME pathways category:
| Log-likelihood per target | Total log-likelihood | Term | Description |
|---|---|---|---|
| 0.8 | 13.4 | REACTOME ENDOGENOUS STEROLS | Genes involved in Endogenous sterols |
| 0.3 | 6.7 | REACTOME TIE2 SIGNALING | Genes involved in Tie2 Signaling |
| 0.3 | 5.4 | REACTOME TGF BETA RECEPTOR SIGNALING IN EMT EPITHELIAL TO MESENCHYMAL TRANSITION | Genes involved in TGF-beta receptor signaling in EMT (epithelial to mesenchymal transition) |
| 0.3 | 4.8 | REACTOME BRANCHED CHAIN AMINO ACID CATABOLISM | Genes involved in Branched-chain amino acid catabolism |
| 0.2 | 1.8 | REACTOME ANDROGEN BIOSYNTHESIS | Genes involved in Androgen biosynthesis |
| 0.1 | 3.6 | REACTOME NEGATIVE REGULATORS OF RIG I MDA5 SIGNALING | Genes involved in Negative regulators of RIG-I/MDA5 signaling |
| 0.1 | 1.4 | REACTOME INHIBITION OF REPLICATION INITIATION OF DAMAGED DNA BY RB1 E2F1 | Genes involved in Inhibition of replication initiation of damaged DNA by RB1/E2F1 |
| 0.1 | 1.7 | REACTOME CIRCADIAN REPRESSION OF EXPRESSION BY REV ERBA | Genes involved in Circadian Repression of Expression by REV-ERBA |
| 0.1 | 3.5 | REACTOME COLLAGEN FORMATION | Genes involved in Collagen formation |
| 0.0 | 1.1 | REACTOME RNA POL III TRANSCRIPTION INITIATION FROM TYPE 2 PROMOTER | Genes involved in RNA Polymerase III Transcription Initiation From Type 2 Promoter |
| 0.0 | 0.3 | REACTOME UNWINDING OF DNA | Genes involved in Unwinding of DNA |
| 0.0 | 0.8 | REACTOME TRANSPORT TO THE GOLGI AND SUBSEQUENT MODIFICATION | Genes involved in Transport to the Golgi and subsequent modification |
| 0.0 | 0.7 | REACTOME AMINO ACID TRANSPORT ACROSS THE PLASMA MEMBRANE | Genes involved in Amino acid transport across the plasma membrane |