Project
GSE53960: rat RNA-Seq transcriptomic Bodymap
Navigation
Downloads
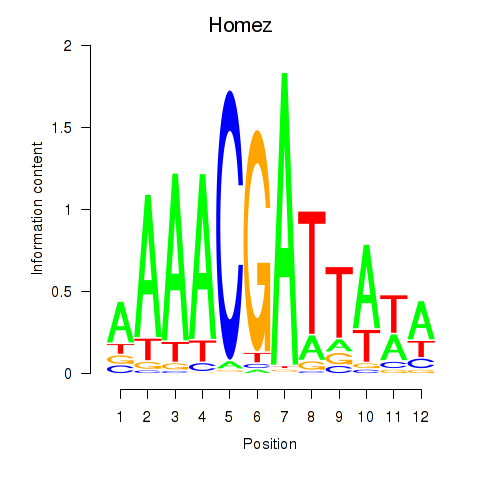
Results for Homez
Z-value: 0.82
Motif logo
Transcription factors associated with Homez
| Gene Symbol | Gene ID | Gene Info |
|---|---|---|
|
Homez
|
ENSRNOG00000014887 | homeobox and leucine zipper encoding |
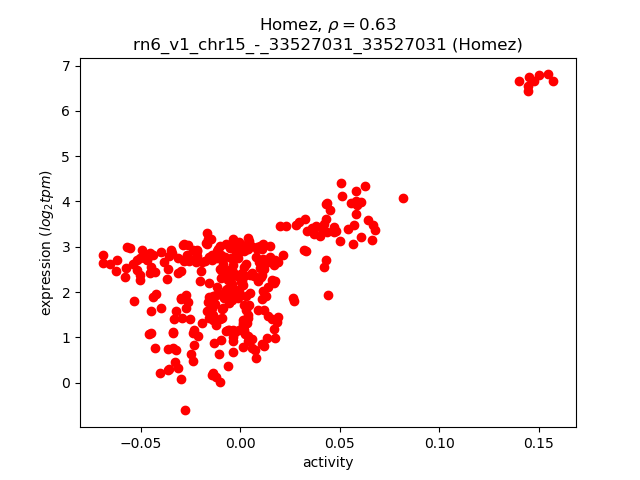
Activity-expression correlation:
| Gene | Promoter | Pearson corr. coef. | P-value | Plot |
|---|---|---|---|---|
| Homez | rn6_v1_chr15_-_33527031_33527031 | 0.63 | 9.0e-37 | Click! |
Activity profile of Homez motif
Sorted Z-values of Homez motif
| Promoter | Log-likelihood | Transcript | Gene | Gene Info |
|---|---|---|---|---|
| chr2_+_200778122 | 42.77 |
ENSRNOT00000091845
|
Hao2
|
hydroxyacid oxidase 2 |
| chr1_-_54854353 | 26.37 |
ENSRNOT00000072895
|
Smok2a
|
sperm motility kinase 2A |
| chr17_+_9746485 | 22.44 |
ENSRNOT00000072298
|
Pfn3
|
profilin 3 |
| chr8_+_117906014 | 22.27 |
ENSRNOT00000056180
|
Spink8
|
serine peptidase inhibitor, Kazal type 8 |
| chr2_+_154921999 | 20.92 |
ENSRNOT00000057620
|
LOC691044
|
similar to GTPase activating protein testicular GAP1 |
| chr1_-_54036068 | 20.75 |
ENSRNOT00000075019
|
RGD1560718
|
similar to putative protein kinase |
| chr18_-_15089988 | 18.68 |
ENSRNOT00000074116
|
Mep1b
|
meprin A subunit beta |
| chr18_+_47294292 | 18.60 |
ENSRNOT00000020109
|
Ftmt
|
ferritin mitochondrial |
| chr19_+_568287 | 18.58 |
ENSRNOT00000016419
|
Cdh16
|
cadherin 16 |
| chr4_+_96831880 | 17.94 |
ENSRNOT00000068400
|
RSA-14-44
|
RSA-14-44 protein |
| chr2_-_132551235 | 17.83 |
ENSRNOT00000058250
|
LOC100365525
|
rCG65904-like |
| chr2_+_155076464 | 17.78 |
ENSRNOT00000057619
|
LOC691033
|
similar to GTPase activating protein testicular GAP1 |
| chr10_+_64174931 | 17.52 |
ENSRNOT00000035948
|
RGD1565611
|
RGD1565611 |
| chr1_+_55219773 | 15.77 |
ENSRNOT00000041610
|
RGD1561667
|
similar to putative protein kinase |
| chr9_-_65790347 | 15.62 |
ENSRNOT00000028506
|
AABR07067812.1
|
|
| chr4_-_176294997 | 15.33 |
ENSRNOT00000015112
ENSRNOT00000051461 ENSRNOT00000000026 ENSRNOT00000039877 ENSRNOT00000049303 |
Slc21a4
|
kidney specific organic anion transporter |
| chr10_+_59894340 | 14.17 |
ENSRNOT00000080446
|
Spata22
|
spermatogenesis associated 22 |
| chr7_-_145048283 | 12.78 |
ENSRNOT00000055275
|
Gtsf1
|
gametocyte specific factor 1 |
| chr18_-_58423196 | 12.71 |
ENSRNOT00000025556
|
Piezo2
|
piezo-type mechanosensitive ion channel component 2 |
| chr7_-_54855557 | 12.43 |
ENSRNOT00000039475
|
Glipr1l1
|
GLI pathogenesis-related 1 like 1 |
| chr16_-_7336335 | 12.29 |
ENSRNOT00000044991
|
Phf7
|
PHD finger protein 7 |
| chr14_-_2934571 | 11.99 |
ENSRNOT00000049772
|
Ube2d4
|
ubiquitin-conjugating enzyme E2D 4 (putative) |
| chr13_-_56462834 | 11.91 |
ENSRNOT00000032122
|
Crb1
|
crumbs 1, cell polarity complex component |
| chr14_+_89253373 | 11.83 |
ENSRNOT00000035922
|
LOC688553
|
hypothetical protein LOC688553 |
| chr4_-_163157744 | 11.83 |
ENSRNOT00000089712
|
Clec12b
|
C-type lectin domain family 12, member B |
| chr1_+_101474334 | 11.61 |
ENSRNOT00000064245
|
Tulp2
|
tubby-like protein 2 |
| chr10_+_73279119 | 11.47 |
ENSRNOT00000004698
|
Tbx2
|
T-box 2 |
| chr2_+_92574038 | 11.45 |
ENSRNOT00000089422
|
tGap1
|
GTPase activating protein testicular GAP1 |
| chr10_+_71202456 | 11.35 |
ENSRNOT00000076893
|
Hnf1b
|
HNF1 homeobox B |
| chr17_-_78499881 | 11.30 |
ENSRNOT00000079260
|
Fam107b
|
family with sequence similarity 107, member B |
| chr10_+_111031414 | 11.21 |
ENSRNOT00000074372
|
Ptchd3
|
patched domain containing 3 |
| chr8_-_17696989 | 11.07 |
ENSRNOT00000083752
|
AABR07069336.1
|
|
| chr6_+_127766470 | 10.96 |
ENSRNOT00000013138
|
Serpina5
|
serpin family A member 5 |
| chr13_-_36022197 | 10.93 |
ENSRNOT00000091280
|
Cfap221
|
cilia and flagella associated protein 221 |
| chr14_+_113968563 | 10.65 |
ENSRNOT00000006085
|
Clhc1
|
clathrin heavy chain linker domain containing 1 |
| chr1_+_189969336 | 10.55 |
ENSRNOT00000073255
ENSRNOT00000071302 ENSRNOT00000055063 |
Abca14
|
ATP-binding cassette, subfamily A (ABC1), member 14 |
| chr18_-_45380730 | 10.42 |
ENSRNOT00000037904
|
Pudp
|
pseudouridine 5'-phosphatase |
| chr7_+_20262680 | 10.40 |
ENSRNOT00000046378
|
LOC300308
|
similar to hypothetical protein 4930509O22 |
| chr7_-_45185690 | 10.39 |
ENSRNOT00000071306
|
Lrriq1
|
leucine-rich repeats and IQ motif containing 1 |
| chr8_-_115274165 | 10.33 |
ENSRNOT00000056386
|
LOC102550160
|
IQ domain-containing protein F5-like |
| chr2_-_238369692 | 10.30 |
ENSRNOT00000041583
|
Arhgef38
|
Rho guanine nucleotide exchange factor 38 |
| chrX_+_115721251 | 10.27 |
ENSRNOT00000060090
|
Trpc5os
|
TRPC5 opposite strand |
| chr7_-_15483834 | 9.84 |
ENSRNOT00000057608
|
Morc2b
|
microrchidia 2B |
| chrX_+_43745604 | 9.83 |
ENSRNOT00000040825
|
LOC100362173
|
rCG36365-like |
| chr14_-_84662143 | 9.81 |
ENSRNOT00000057529
ENSRNOT00000080078 |
Hormad2
|
HORMA domain containing 2 |
| chr2_+_93758919 | 9.78 |
ENSRNOT00000077782
|
Fabp12
|
fatty acid binding protein 12 |
| chr3_+_75906945 | 9.75 |
ENSRNOT00000047110
|
Olr586
|
olfactory receptor 586 |
| chr9_-_63291350 | 9.60 |
ENSRNOT00000058831
|
Hsfy2
|
heat shock transcription factor, Y linked 2 |
| chr6_+_30038777 | 9.57 |
ENSRNOT00000072340
|
Fam228b
|
family with sequence similarity 228, member B |
| chr11_+_88095170 | 9.29 |
ENSRNOT00000041557
|
Ccdc116
|
coiled-coil domain containing 116 |
| chr1_+_222907159 | 9.26 |
ENSRNOT00000032123
|
Hrasls5
|
HRAS-like suppressor family, member 5 |
| chr3_-_113376751 | 9.15 |
ENSRNOT00000030019
|
Catsper2
|
cation channel, sperm associated 2 |
| chr14_+_13751231 | 9.08 |
ENSRNOT00000044244
|
Gk2
|
glycerol kinase 2 |
| chr14_+_97686121 | 8.94 |
ENSRNOT00000074877
|
Pom121l12
|
POM121 transmembrane nucleoporin-like 12 |
| chr10_-_107114271 | 8.93 |
ENSRNOT00000004035
|
Dnah17
|
dynein, axonemal, heavy chain 17 |
| chrY_+_506149 | 8.90 |
ENSRNOT00000086056
|
Kdm5d
|
lysine demethylase 5D |
| chr2_+_58448917 | 8.87 |
ENSRNOT00000082562
|
Ranbp3l
|
RAN binding protein 3-like |
| chr17_-_2423572 | 8.79 |
ENSRNOT00000024504
|
Spata31a5
|
SPATA31 subfamily A, member 5 |
| chr7_+_34402738 | 8.79 |
ENSRNOT00000030985
|
Ccdc38
|
coiled-coil domain containing 38 |
| chrX_+_110342718 | 8.74 |
ENSRNOT00000043861
|
AABR07040792.1
|
|
| chr14_-_37361798 | 8.73 |
ENSRNOT00000002980
|
Cwh43
|
cell wall biogenesis 43 C-terminal homolog |
| chr5_-_76261198 | 8.72 |
ENSRNOT00000087380
|
AABR07048387.1
|
|
| chr2_-_228665279 | 8.50 |
ENSRNOT00000055648
|
RGD1306519
|
similar to T-cell activation Rho GTPase-activating protein isoform b |
| chrX_+_16337102 | 8.49 |
ENSRNOT00000003954
|
Ccnb3
|
cyclin B3 |
| chr13_-_80862963 | 8.38 |
ENSRNOT00000004864
|
Fmo3
|
flavin containing monooxygenase 3 |
| chr3_-_8979889 | 8.38 |
ENSRNOT00000065128
|
Crat
|
carnitine O-acetyltransferase |
| chr10_+_86367596 | 8.36 |
ENSRNOT00000049070
ENSRNOT00000009114 ENSRNOT00000078744 |
Erbb2
|
erb-b2 receptor tyrosine kinase 2 |
| chr9_+_4731914 | 8.31 |
ENSRNOT00000061893
|
AABR07066201.1
|
|
| chrY_-_1238420 | 8.22 |
ENSRNOT00000092078
|
Ddx3
|
DEAD (Asp-Glu-Ala-Asp) box polypeptide 3 |
| chr11_+_88424414 | 8.21 |
ENSRNOT00000022328
|
Spag6l
|
sperm associated antigen 6-like |
| chrX_+_133227660 | 8.20 |
ENSRNOT00000004591
|
Actrt1
|
actin-related protein T1 |
| chrX_-_143558521 | 8.16 |
ENSRNOT00000056598
|
LOC688842
|
hypothetical protein LOC688842 |
| chr17_-_43504604 | 8.13 |
ENSRNOT00000083829
ENSRNOT00000066313 |
Slc17a1
|
solute carrier family 17 member 1 |
| chrY_+_914045 | 8.08 |
ENSRNOT00000088593
|
Eif2s3y
|
eukaryotic translation initiation factor 2, subunit 3, structural gene Y-linked |
| chr14_-_91996774 | 8.07 |
ENSRNOT00000005851
|
Ddc
|
dopa decarboxylase |
| chr20_+_5057701 | 8.06 |
ENSRNOT00000001119
|
Ly6g6c
|
lymphocyte antigen 6 complex, locus G6C |
| chr9_-_50820290 | 7.99 |
ENSRNOT00000050748
|
LOC102548013
|
uncharacterized LOC102548013 |
| chr2_-_137331140 | 7.95 |
ENSRNOT00000048546
|
LOC365791
|
similar to T-cell activation Rho GTPase-activating protein isoform b |
| chrX_-_65335987 | 7.90 |
ENSRNOT00000047128
|
AABR07038981.1
|
|
| chr20_+_20577561 | 7.82 |
ENSRNOT00000081113
|
Cdk1
|
cyclin-dependent kinase 1 |
| chr13_-_47331187 | 7.81 |
ENSRNOT00000035577
ENSRNOT00000049915 |
Zp3r
|
zona pellucida 3 receptor |
| chr18_+_68984051 | 7.76 |
ENSRNOT00000002969
|
Stard6
|
StAR-related lipid transfer domain containing 6 |
| chr2_-_127778202 | 7.74 |
ENSRNOT00000092191
ENSRNOT00000093683 |
LOC365778
|
similar to RIKEN cDNA 1700034I23 |
| chr6_-_55711146 | 7.70 |
ENSRNOT00000036996
|
Lrrc72
|
leucine rich repeat containing 72 |
| chr7_+_34744483 | 7.67 |
ENSRNOT00000007465
|
Usp44
|
ubiquitin specific peptidase 44 |
| chr3_-_46942966 | 7.59 |
ENSRNOT00000087439
|
Rbms1
|
RNA binding motif, single stranded interacting protein 1 |
| chrX_-_158261717 | 7.57 |
ENSRNOT00000086804
|
RGD1561558
|
similar to RIKEN cDNA 1700001F22 |
| chr3_-_11820549 | 7.53 |
ENSRNOT00000020660
|
Cfap157
|
cilia and flagella associated protein 157 |
| chrX_-_32095867 | 7.48 |
ENSRNOT00000049947
ENSRNOT00000080730 |
Ace2
|
angiotensin I converting enzyme 2 |
| chr18_-_26656879 | 7.43 |
ENSRNOT00000086729
|
Epb41l4a
|
erythrocyte membrane protein band 4.1 like 4A |
| chr1_+_16910069 | 7.42 |
ENSRNOT00000020015
|
Aldh8a1
|
aldehyde dehydrogenase 8 family, member A1 |
| chr16_+_19097391 | 7.38 |
ENSRNOT00000018018
|
Calr3
|
calreticulin 3 |
| chr1_+_221673590 | 7.29 |
ENSRNOT00000038016
|
Cdc42bpg
|
CDC42 binding protein kinase gamma |
| chr6_+_138432550 | 7.23 |
ENSRNOT00000056829
|
Adam6
|
a disintegrin and metallopeptidase domain 6 |
| chr13_-_71276497 | 7.18 |
ENSRNOT00000029773
|
Rgsl1
|
regulator of G-protein signaling like 1 |
| chr14_+_22553650 | 7.07 |
ENSRNOT00000092201
ENSRNOT00000002712 |
Ugt2b35
|
UDP glucuronosyltransferase 2 family, polypeptide B35 |
| chr8_-_16486419 | 7.03 |
ENSRNOT00000033223
|
LOC690235
|
similar to MAP/microtubule affinity-regulating kinase 4 (MAP/microtubule affinity-regulating kinase-like 1) |
| chr17_+_15429708 | 6.88 |
ENSRNOT00000093261
|
LOC679342
|
hypothetical protein LOC679342 |
| chrY_+_380382 | 6.73 |
ENSRNOT00000092110
|
Rbmy1j
|
RNA binding motif protein, Y-linked, family 1, member J |
| chr1_+_185356975 | 6.69 |
ENSRNOT00000086681
|
Plekha7
|
pleckstrin homology domain containing A7 |
| chr5_+_147257678 | 6.68 |
ENSRNOT00000066268
|
Rnf19b
|
ring finger protein 19B |
| chr7_+_95309928 | 6.61 |
ENSRNOT00000005887
|
Mtbp
|
MDM2 binding protein |
| chr17_+_14516566 | 6.58 |
ENSRNOT00000060660
ENSRNOT00000071469 |
LOC689569
|
similar to vitamin A-deficient testicular protein 11-like |
| chr10_-_35005287 | 6.55 |
ENSRNOT00000032386
|
LOC103689949
|
nedd4 binding protein 3 |
| chrY_+_184603 | 6.45 |
ENSRNOT00000077708
|
LOC103694540
|
zinc finger Y-chromosomal protein 2 |
| chr1_+_256035866 | 6.43 |
ENSRNOT00000079726
|
Kif11
|
kinesin family member 11 |
| chr11_+_45339366 | 6.42 |
ENSRNOT00000002241
|
Tmem30c
|
transmembrane protein 30C |
| chr1_-_62191818 | 6.39 |
ENSRNOT00000033187
|
AABR07001926.1
|
|
| chr6_+_93385457 | 6.29 |
ENSRNOT00000010300
|
Actr10
|
actin-related protein 10 homolog |
| chr4_-_28437676 | 6.25 |
ENSRNOT00000012995
|
Hepacam2
|
HEPACAM family member 2 |
| chr20_-_10013190 | 6.25 |
ENSRNOT00000084726
ENSRNOT00000089112 |
Rsph1
|
radial spoke head 1 homolog |
| chr9_+_4107246 | 6.21 |
ENSRNOT00000078212
|
AABR07066160.1
|
|
| chrX_+_97074710 | 6.14 |
ENSRNOT00000044379
|
RGD1561230
|
similar to RIKEN cDNA 4921511C20 gene |
| chr20_-_45126062 | 6.13 |
ENSRNOT00000000720
|
RGD1310495
|
similar to KIAA1919 protein |
| chr7_+_18668692 | 6.11 |
ENSRNOT00000009532
|
Kank3
|
KN motif and ankyrin repeat domains 3 |
| chr1_-_89539210 | 6.11 |
ENSRNOT00000077462
ENSRNOT00000028644 |
Hpn
|
hepsin |
| chr15_+_28319136 | 6.08 |
ENSRNOT00000048723
|
Tppp2
|
tubulin polymerization-promoting protein family member 2 |
| chr3_-_54593306 | 6.06 |
ENSRNOT00000087122
|
Stk39
|
serine threonine kinase 39 |
| chrX_+_15295473 | 6.04 |
ENSRNOT00000009295
|
LOC108348065
|
histone deacetylase 6 |
| chr10_-_54512169 | 5.95 |
ENSRNOT00000005066
|
Cfap52
|
cilia and flagella associated protein 52 |
| chrX_+_45614888 | 5.95 |
ENSRNOT00000058473
|
LOC100909677
|
uncharacterized LOC100909677 |
| chr6_+_122729874 | 5.88 |
ENSRNOT00000039509
ENSRNOT00000040440 |
Zc3h14
|
zinc finger CCCH type containing 14 |
| chr14_-_8548310 | 5.86 |
ENSRNOT00000092436
|
Arhgap24
|
Rho GTPase activating protein 24 |
| chr8_+_80965255 | 5.80 |
ENSRNOT00000079508
|
Wdr72
|
WD repeat domain 72 |
| chrX_-_100207974 | 5.79 |
ENSRNOT00000091859
|
AABR07040430.1
|
|
| chrX_+_63897664 | 5.77 |
ENSRNOT00000089271
|
LOC103694487
|
protein gar2-like |
| chr1_-_72941869 | 5.77 |
ENSRNOT00000032306
|
Eps8l1
|
EPS8-like 1 |
| chr16_-_68700296 | 5.76 |
ENSRNOT00000060162
|
AABR07026236.1
|
|
| chrX_-_106085878 | 5.72 |
ENSRNOT00000049735
|
Prame
|
preferentially expressed antigen in melanoma |
| chr7_-_107223047 | 5.66 |
ENSRNOT00000007250
ENSRNOT00000084875 |
Lrrc6
|
leucine rich repeat containing 6 |
| chr5_+_133864798 | 5.61 |
ENSRNOT00000091977
|
Tal1
|
TAL bHLH transcription factor 1, erythroid differentiation factor |
| chr16_+_69022792 | 5.58 |
ENSRNOT00000035985
|
Got1l1
|
glutamic-oxaloacetic transaminase 1-like 1 |
| chr8_+_119064351 | 5.57 |
ENSRNOT00000051211
|
Prss42
|
protease, serine, 42 |
| chr19_+_50246402 | 5.54 |
ENSRNOT00000018795
|
Hsd17b2
|
hydroxysteroid (17-beta) dehydrogenase 2 |
| chr7_+_3630950 | 5.49 |
ENSRNOT00000074535
|
LOC102546596
|
pre-mRNA-splicing factor CWC22 homolog |
| chr2_-_88553086 | 5.47 |
ENSRNOT00000042494
|
LOC361914
|
similar to solute carrier family 7 (cationic amino acid transporter, y+ system), member 12 |
| chr2_-_200762206 | 5.46 |
ENSRNOT00000068511
ENSRNOT00000086835 |
Hsd3b2
|
hydroxy-delta-5-steroid dehydrogenase, 3 beta- and steroid delta-isomerase 2 |
| chr7_-_107768072 | 5.36 |
ENSRNOT00000093189
|
Ndrg1
|
N-myc downstream regulated 1 |
| chr12_-_6078411 | 5.35 |
ENSRNOT00000001197
|
Rxfp2
|
relaxin/insulin-like family peptide receptor 2 |
| chr7_-_49250953 | 5.27 |
ENSRNOT00000066975
ENSRNOT00000082141 |
Acss3
|
acyl-CoA synthetase short-chain family member 3 |
| chr5_-_134638150 | 5.21 |
ENSRNOT00000013480
|
Tex38
|
testis expressed 38 |
| chr4_-_165195489 | 5.00 |
ENSRNOT00000079429
|
Klra5
|
killer cell lectin-like receptor, subfamily A, member 5 |
| chr2_-_137153551 | 5.00 |
ENSRNOT00000083443
|
AABR07010476.1
|
|
| chrX_-_156155014 | 4.93 |
ENSRNOT00000088637
|
LOC102552182
|
L antigen family member 3-like |
| chr7_-_124317379 | 4.92 |
ENSRNOT00000013398
|
Pacsin2
|
protein kinase C and casein kinase substrate in neurons 2 |
| chr3_+_138174054 | 4.92 |
ENSRNOT00000007946
|
Banf2
|
barrier to autointegration factor 2 |
| chr10_+_76320041 | 4.89 |
ENSRNOT00000037693
|
Coil
|
coilin |
| chr7_-_19088972 | 4.87 |
ENSRNOT00000049266
|
Vom2r57
|
vomeronasal 2 receptor, 57 |
| chr1_+_83933942 | 4.84 |
ENSRNOT00000068690
|
Cyp2f4
|
cytochrome P450, family 2, subfamily f, polypeptide 4 |
| chr6_+_8669722 | 4.83 |
ENSRNOT00000048550
|
Camkmt
|
calmodulin-lysine N-methyltransferase |
| chr14_-_21299068 | 4.79 |
ENSRNOT00000065778
|
Amtn
|
amelotin |
| chr20_+_44680449 | 4.76 |
ENSRNOT00000000728
|
Traf3ip2
|
Traf3 interacting protein 2 |
| chr8_+_116311078 | 4.76 |
ENSRNOT00000037363
|
Rassf1
|
Ras association domain family member 1 |
| chr16_+_39144972 | 4.73 |
ENSRNOT00000086728
|
Adam21
|
ADAM metallopeptidase domain 21 |
| chrX_-_139916883 | 4.73 |
ENSRNOT00000090442
|
Gpc3
|
glypican 3 |
| chrX_+_15396895 | 4.71 |
ENSRNOT00000064924
|
Hdac6
|
histone deacetylase 6 |
| chr18_-_15167311 | 4.69 |
ENSRNOT00000021061
|
Rnf138
|
ring finger protein 138 |
| chr3_-_72447801 | 4.66 |
ENSRNOT00000088815
|
P2rx3
|
purinergic receptor P2X 3 |
| chr5_+_74874306 | 4.64 |
ENSRNOT00000076918
|
Akap2
|
A-kinase anchoring protein 2 |
| chr5_+_59783890 | 4.62 |
ENSRNOT00000066277
|
Melk
|
maternal embryonic leucine zipper kinase |
| chr14_-_35581031 | 4.60 |
ENSRNOT00000003077
|
Pdgfra
|
platelet derived growth factor receptor alpha |
| chr14_+_37130743 | 4.60 |
ENSRNOT00000031756
|
Lrrc66
|
leucine rich repeat containing 66 |
| chr8_+_107508351 | 4.58 |
ENSRNOT00000081594
|
Cep70
|
centrosomal protein 70 |
| chr10_-_37099004 | 4.53 |
ENSRNOT00000075465
|
N4bp3
|
Nedd4 binding protein 3 |
| chr2_+_205714267 | 4.52 |
ENSRNOT00000056084
|
LOC102551064
|
glutamic acid-rich protein-like |
| chr7_-_33916338 | 4.52 |
ENSRNOT00000005492
|
Cfap54
|
cilia and flagella associated protein 54 |
| chr9_+_43830630 | 4.51 |
ENSRNOT00000084742
|
Cnga3
|
cyclic nucleotide gated channel alpha 3 |
| chr9_+_95398237 | 4.49 |
ENSRNOT00000025879
|
Trpm8
|
transient receptor potential cation channel, subfamily M, member 8 |
| chr9_+_38536920 | 4.42 |
ENSRNOT00000060452
|
Prim2
|
primase (DNA) subunit 2 |
| chr10_+_45297937 | 4.42 |
ENSRNOT00000066367
|
Trim17
|
tripartite motif-containing 17 |
| chr3_+_100373439 | 4.39 |
ENSRNOT00000085176
|
Kif18a
|
kinesin family member 18A |
| chr7_+_18068060 | 4.39 |
ENSRNOT00000065474
|
Vom1r107
|
vomeronasal 1 receptor 107 |
| chr12_+_24803686 | 4.37 |
ENSRNOT00000033499
|
Wbscr28
|
Williams-Beuren syndrome chromosome region 28 |
| chr20_-_2701815 | 4.36 |
ENSRNOT00000061950
|
Hspa1a
|
heat shock protein family A (Hsp70) member 1A |
| chr18_-_27374603 | 4.35 |
ENSRNOT00000027244
|
Nme5
|
NME/NM23 family member 5 |
| chr2_-_200762492 | 4.34 |
ENSRNOT00000056172
|
Hsd3b2
|
hydroxy-delta-5-steroid dehydrogenase, 3 beta- and steroid delta-isomerase 2 |
| chr1_-_126211439 | 4.31 |
ENSRNOT00000014988
|
Tjp1
|
tight junction protein 1 |
| chr1_-_274650363 | 4.29 |
ENSRNOT00000074341
|
Bbip1
|
BBSome interacting protein 1 |
| chr16_-_6404578 | 4.28 |
ENSRNOT00000051371
|
Cacna1d
|
calcium voltage-gated channel subunit alpha1 D |
| chr9_-_85528860 | 4.16 |
ENSRNOT00000063834
ENSRNOT00000088963 |
Wdfy1
|
WD repeat and FYVE domain containing 1 |
| chrX_-_43781586 | 4.12 |
ENSRNOT00000051551
|
Cldn34b
|
claudin 34B |
| chr1_-_89094530 | 4.04 |
ENSRNOT00000031873
|
Etv2
|
ets variant 2 |
| chr14_-_81638934 | 3.99 |
ENSRNOT00000018616
|
Fam193a
|
family with sequence similarity 193, member A |
| chr9_+_115916907 | 3.98 |
ENSRNOT00000023226
|
Lama1
|
laminin subunit alpha 1 |
| chr10_+_81592114 | 3.97 |
ENSRNOT00000072783
|
Mbtd1
|
mbt domain containing 1 |
| chr4_-_147756294 | 3.92 |
ENSRNOT00000014537
|
Mbd4
|
methyl-CpG binding domain 4 DNA glycosylase |
| chr9_-_38495126 | 3.92 |
ENSRNOT00000016933
ENSRNOT00000090385 |
Rab23
|
RAB23, member RAS oncogene family |
| chr1_-_7443863 | 3.88 |
ENSRNOT00000088558
|
Phactr2
|
phosphatase and actin regulator 2 |
| chr5_-_107857320 | 3.86 |
ENSRNOT00000008898
|
Cdkn2b
|
cyclin-dependent kinase inhibitor 2B |
| chrX_-_46653165 | 3.86 |
ENSRNOT00000058456
|
AABR07038349.1
|
|
| chr1_+_282638017 | 3.85 |
ENSRNOT00000079722
ENSRNOT00000082254 |
Ces2c
|
carboxylesterase 2C |
| chr9_+_95202632 | 3.84 |
ENSRNOT00000025652
|
Ugt1a5
|
UDP glucuronosyltransferase family 1 member A5 |
| chr8_-_68966108 | 3.84 |
ENSRNOT00000012155
|
Smad6
|
SMAD family member 6 |
| chr16_-_31301880 | 3.73 |
ENSRNOT00000084847
ENSRNOT00000083943 |
AABR07025272.1
|
|
| chr12_-_29952196 | 3.72 |
ENSRNOT00000086175
|
Tmem248
|
transmembrane protein 248 |
| chrX_+_152196129 | 3.72 |
ENSRNOT00000087679
|
Magea4
|
melanoma antigen, family A, 4 |
| chr4_-_164051812 | 3.64 |
ENSRNOT00000085719
|
AABR07062183.1
|
|
| chr18_+_84162467 | 3.62 |
ENSRNOT00000047841
|
RGD1559726
|
similar to melanoma antigen family A, 6 |
| chr18_+_35136132 | 3.61 |
ENSRNOT00000078731
|
Spink5
|
serine peptidase inhibitor, Kazal type 5 |
| chr3_+_134440195 | 3.60 |
ENSRNOT00000072928
|
AABR07054000.1
|
|
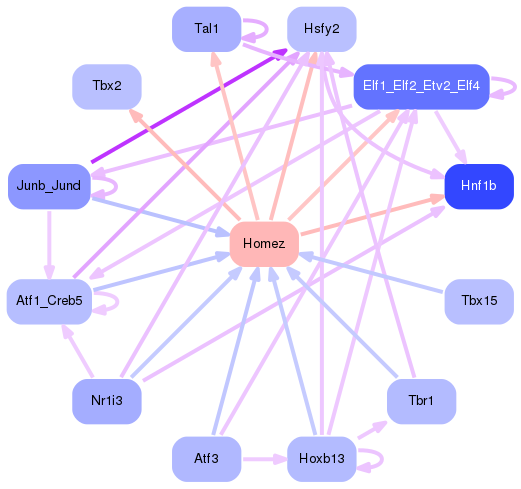
Network of associatons between targets according to the STRING database.

First level regulatory network of Homez
Gene Ontology Analysis
Gene overrepresentation in biological process category:
| Log-likelihood per target | Total log-likelihood | Term | Description |
|---|---|---|---|
| 14.3 | 42.8 | GO:0018924 | mandelate metabolic process(GO:0018924) |
| 6.0 | 17.9 | GO:0097498 | endothelial tube lumen extension(GO:0097498) |
| 5.8 | 17.5 | GO:0016598 | protein arginylation(GO:0016598) |
| 4.6 | 4.6 | GO:1904404 | response to formaldehyde(GO:1904404) |
| 3.8 | 15.3 | GO:0051958 | methotrexate transport(GO:0051958) |
| 3.8 | 11.5 | GO:1901220 | regulation of cardiac chamber morphogenesis(GO:1901219) negative regulation of cardiac chamber morphogenesis(GO:1901220) |
| 3.8 | 11.4 | GO:1901146 | mesonephros morphogenesis(GO:0061206) mesonephric nephron development(GO:0061215) mesonephric nephron morphogenesis(GO:0061228) mesenchymal stem cell maintenance involved in mesonephric nephron morphogenesis(GO:0061235) regulation of mesenchymal cell apoptotic process involved in mesonephric nephron morphogenesis(GO:0061295) negative regulation of mesenchymal cell apoptotic process involved in mesonephric nephron morphogenesis(GO:0061296) mesenchymal cell apoptotic process involved in mesonephric nephron morphogenesis(GO:1901146) |
| 3.0 | 9.1 | GO:0046167 | glycerol-3-phosphate biosynthetic process(GO:0046167) |
| 3.0 | 12.0 | GO:0035519 | protein K29-linked ubiquitination(GO:0035519) |
| 2.8 | 8.5 | GO:0045799 | positive regulation of chromatin assembly or disassembly(GO:0045799) |
| 2.7 | 11.0 | GO:0061107 | seminal vesicle development(GO:0061107) |
| 2.6 | 15.9 | GO:0097500 | receptor localization to nonmotile primary cilium(GO:0097500) |
| 2.5 | 7.5 | GO:0003051 | angiotensin-mediated drinking behavior(GO:0003051) tryptophan transport(GO:0015827) positive regulation of gap junction assembly(GO:1903598) |
| 2.5 | 49.2 | GO:0035404 | histone-serine phosphorylation(GO:0035404) |
| 2.4 | 4.7 | GO:0072138 | mesenchymal cell proliferation involved in ureteric bud development(GO:0072138) |
| 2.2 | 6.6 | GO:0007089 | traversing start control point of mitotic cell cycle(GO:0007089) |
| 2.1 | 8.4 | GO:0019254 | carnitine metabolic process, CoA-linked(GO:0019254) |
| 2.0 | 6.1 | GO:0034769 | basement membrane disassembly(GO:0034769) |
| 2.0 | 14.2 | GO:0000711 | meiotic DNA repair synthesis(GO:0000711) |
| 2.0 | 6.1 | GO:2000681 | negative regulation of rubidium ion transport(GO:2000681) negative regulation of rubidium ion transmembrane transporter activity(GO:2000687) |
| 2.0 | 8.1 | GO:0052314 | phytoalexin metabolic process(GO:0052314) |
| 1.9 | 5.6 | GO:0006532 | aspartate biosynthetic process(GO:0006532) |
| 1.6 | 9.8 | GO:0034757 | negative regulation of iron ion transport(GO:0034757) |
| 1.6 | 4.8 | GO:0042197 | chlorinated hydrocarbon metabolic process(GO:0042196) halogenated hydrocarbon metabolic process(GO:0042197) |
| 1.6 | 4.8 | GO:0070175 | positive regulation of enamel mineralization(GO:0070175) |
| 1.6 | 4.7 | GO:1904054 | regulation of cholangiocyte proliferation(GO:1904054) positive regulation of cholangiocyte proliferation(GO:1904056) |
| 1.5 | 8.9 | GO:0002457 | T cell antigen processing and presentation(GO:0002457) |
| 1.5 | 4.4 | GO:0031439 | positive regulation of mRNA cleavage(GO:0031439) positive regulation of endoribonuclease activity(GO:1902380) positive regulation of mRNA endonucleolytic cleavage involved in unfolded protein response(GO:1904722) |
| 1.4 | 18.6 | GO:0006880 | intracellular sequestering of iron ion(GO:0006880) sequestering of iron ion(GO:0097577) |
| 1.4 | 25.9 | GO:1900004 | negative regulation of serine-type endopeptidase activity(GO:1900004) negative regulation of serine-type peptidase activity(GO:1902572) |
| 1.3 | 6.7 | GO:0045218 | zonula adherens maintenance(GO:0045218) |
| 1.3 | 7.8 | GO:0090166 | Golgi disassembly(GO:0090166) |
| 1.2 | 8.4 | GO:0033088 | negative regulation of immature T cell proliferation in thymus(GO:0033088) |
| 1.2 | 4.7 | GO:0007352 | zygotic specification of dorsal/ventral axis(GO:0007352) |
| 1.2 | 11.6 | GO:2000344 | positive regulation of acrosome reaction(GO:2000344) |
| 1.1 | 3.4 | GO:1903630 | regulation of aminoacyl-tRNA ligase activity(GO:1903630) |
| 1.1 | 9.8 | GO:0045144 | meiotic sister chromatid segregation(GO:0045144) meiotic sister chromatid cohesion(GO:0051177) |
| 1.1 | 3.3 | GO:0048003 | antigen processing and presentation of lipid antigen via MHC class Ib(GO:0048003) antigen processing and presentation, exogenous lipid antigen via MHC class Ib(GO:0048007) |
| 1.1 | 6.4 | GO:0046602 | regulation of mitotic centrosome separation(GO:0046602) |
| 1.0 | 4.0 | GO:2000382 | positive regulation of mesoderm development(GO:2000382) |
| 1.0 | 3.0 | GO:2000502 | negative regulation of natural killer cell chemotaxis(GO:2000502) |
| 1.0 | 2.9 | GO:0021524 | visceral motor neuron differentiation(GO:0021524) |
| 0.9 | 4.7 | GO:1904058 | positive regulation of sensory perception of pain(GO:1904058) |
| 0.9 | 7.4 | GO:0042904 | 9-cis-retinoic acid biosynthetic process(GO:0042904) 9-cis-retinoic acid metabolic process(GO:0042905) |
| 0.9 | 4.5 | GO:0050955 | thermoception(GO:0050955) |
| 0.9 | 7.8 | GO:0086046 | membrane depolarization during SA node cell action potential(GO:0086046) |
| 0.8 | 4.2 | GO:0034141 | positive regulation of toll-like receptor 3 signaling pathway(GO:0034141) |
| 0.8 | 4.9 | GO:0070836 | caveola assembly(GO:0070836) |
| 0.8 | 2.4 | GO:2000537 | immunoglobulin production in mucosal tissue(GO:0002426) T-helper 1 cell activation(GO:0035711) granzyme B production(GO:0071613) regulation of granzyme B production(GO:0071661) positive regulation of granzyme B production(GO:0071663) regulation of thymocyte migration(GO:2000410) regulation of B cell chemotaxis(GO:2000537) positive regulation of B cell chemotaxis(GO:2000538) |
| 0.8 | 3.1 | GO:0070494 | regulation of thrombin receptor signaling pathway(GO:0070494) negative regulation of thrombin receptor signaling pathway(GO:0070495) |
| 0.8 | 1.5 | GO:1901143 | insulin catabolic process(GO:1901143) |
| 0.7 | 5.8 | GO:1900029 | positive regulation of ruffle assembly(GO:1900029) |
| 0.7 | 8.3 | GO:1904667 | negative regulation of ubiquitin protein ligase activity(GO:1904667) |
| 0.7 | 12.7 | GO:0016339 | calcium-dependent cell-cell adhesion via plasma membrane cell adhesion molecules(GO:0016339) |
| 0.7 | 2.0 | GO:2001288 | positive regulation of caveolin-mediated endocytosis(GO:2001288) |
| 0.6 | 5.7 | GO:0048387 | negative regulation of retinoic acid receptor signaling pathway(GO:0048387) |
| 0.6 | 5.7 | GO:0060287 | epithelial cilium movement involved in determination of left/right asymmetry(GO:0060287) |
| 0.6 | 5.5 | GO:0006703 | estrogen biosynthetic process(GO:0006703) |
| 0.6 | 20.2 | GO:0007339 | binding of sperm to zona pellucida(GO:0007339) |
| 0.6 | 2.5 | GO:0019464 | glycine catabolic process(GO:0006546) glycine decarboxylation via glycine cleavage system(GO:0019464) |
| 0.6 | 2.4 | GO:0090234 | regulation of kinetochore assembly(GO:0090234) |
| 0.6 | 4.0 | GO:0061304 | retinal blood vessel morphogenesis(GO:0061304) |
| 0.6 | 5.7 | GO:0035021 | negative regulation of Rac protein signal transduction(GO:0035021) |
| 0.5 | 8.2 | GO:0007288 | sperm axoneme assembly(GO:0007288) |
| 0.5 | 3.7 | GO:0033504 | floor plate development(GO:0033504) |
| 0.5 | 9.4 | GO:0046415 | urate metabolic process(GO:0046415) |
| 0.5 | 5.4 | GO:0032287 | peripheral nervous system myelin maintenance(GO:0032287) |
| 0.5 | 2.4 | GO:0018879 | biphenyl metabolic process(GO:0018879) |
| 0.5 | 18.3 | GO:1901998 | toxin transport(GO:1901998) |
| 0.5 | 2.3 | GO:0075525 | viral translational termination-reinitiation(GO:0075525) |
| 0.5 | 10.9 | GO:0044458 | motile cilium assembly(GO:0044458) |
| 0.5 | 0.9 | GO:0015801 | aromatic amino acid transport(GO:0015801) |
| 0.4 | 1.8 | GO:0034240 | negative regulation of macrophage fusion(GO:0034240) |
| 0.4 | 1.3 | GO:0051105 | regulation of DNA ligation(GO:0051105) positive regulation of DNA ligation(GO:0051106) |
| 0.4 | 9.3 | GO:0046337 | phosphatidylethanolamine metabolic process(GO:0046337) |
| 0.4 | 3.8 | GO:0052697 | xenobiotic glucuronidation(GO:0052697) |
| 0.4 | 2.5 | GO:0071205 | protein localization to juxtaparanode region of axon(GO:0071205) |
| 0.4 | 2.0 | GO:2000327 | positive regulation of ligand-dependent nuclear receptor transcription coactivator activity(GO:2000327) |
| 0.4 | 1.2 | GO:2000686 | positive regulation of rubidium ion transport(GO:2000682) regulation of rubidium ion transmembrane transporter activity(GO:2000686) positive regulation of rubidium ion transmembrane transporter activity(GO:2000688) |
| 0.4 | 4.3 | GO:0006228 | UTP biosynthetic process(GO:0006228) |
| 0.4 | 1.2 | GO:1900039 | positive regulation of cellular response to hypoxia(GO:1900039) regulation of hypoxia-inducible factor-1alpha signaling pathway(GO:1902071) |
| 0.4 | 2.0 | GO:0006216 | cytidine catabolic process(GO:0006216) cytidine deamination(GO:0009972) cytidine metabolic process(GO:0046087) |
| 0.4 | 3.1 | GO:0071000 | response to magnetism(GO:0071000) |
| 0.4 | 15.5 | GO:0042462 | eye photoreceptor cell development(GO:0042462) |
| 0.4 | 6.7 | GO:0072643 | interferon-gamma secretion(GO:0072643) |
| 0.4 | 1.8 | GO:0070202 | regulation of establishment of protein localization to chromosome(GO:0070202) |
| 0.3 | 4.5 | GO:0060294 | cilium movement involved in cell motility(GO:0060294) |
| 0.3 | 1.7 | GO:0048619 | embryonic hindgut morphogenesis(GO:0048619) |
| 0.3 | 5.8 | GO:0070166 | enamel mineralization(GO:0070166) |
| 0.3 | 8.9 | GO:0045663 | positive regulation of myoblast differentiation(GO:0045663) |
| 0.3 | 7.5 | GO:0048240 | sperm capacitation(GO:0048240) |
| 0.3 | 5.2 | GO:0002230 | positive regulation of defense response to virus by host(GO:0002230) |
| 0.3 | 2.8 | GO:0010792 | DNA double-strand break processing involved in repair via single-strand annealing(GO:0010792) |
| 0.2 | 1.2 | GO:0044800 | fusion of virus membrane with host plasma membrane(GO:0019064) membrane fusion involved in viral entry into host cell(GO:0039663) multi-organism membrane fusion(GO:0044800) |
| 0.2 | 2.0 | GO:0006269 | DNA replication, synthesis of RNA primer(GO:0006269) |
| 0.2 | 3.9 | GO:0060253 | negative regulation of glial cell proliferation(GO:0060253) |
| 0.2 | 5.4 | GO:0001556 | oocyte maturation(GO:0001556) |
| 0.2 | 1.6 | GO:0035330 | regulation of hippo signaling(GO:0035330) |
| 0.2 | 4.8 | GO:0071157 | negative regulation of cell cycle arrest(GO:0071157) |
| 0.2 | 2.2 | GO:0006348 | chromatin silencing at telomere(GO:0006348) |
| 0.2 | 0.6 | GO:0032972 | regulation of muscle filament sliding speed(GO:0032972) |
| 0.2 | 3.9 | GO:0097094 | craniofacial suture morphogenesis(GO:0097094) |
| 0.2 | 2.1 | GO:0097264 | self proteolysis(GO:0097264) |
| 0.2 | 1.6 | GO:0018230 | peptidyl-L-cysteine S-palmitoylation(GO:0018230) peptidyl-S-diacylglycerol-L-cysteine biosynthetic process from peptidyl-cysteine(GO:0018231) |
| 0.2 | 3.7 | GO:0006020 | inositol metabolic process(GO:0006020) |
| 0.2 | 4.4 | GO:0072520 | seminiferous tubule development(GO:0072520) |
| 0.2 | 1.6 | GO:1901727 | positive regulation of histone deacetylase activity(GO:1901727) |
| 0.2 | 2.0 | GO:0016446 | somatic hypermutation of immunoglobulin genes(GO:0016446) |
| 0.2 | 7.8 | GO:0010501 | RNA secondary structure unwinding(GO:0010501) |
| 0.2 | 2.0 | GO:0098719 | sodium ion import across plasma membrane(GO:0098719) sodium ion import into cell(GO:1990118) |
| 0.2 | 1.7 | GO:0007096 | regulation of exit from mitosis(GO:0007096) |
| 0.2 | 1.1 | GO:2000825 | positive regulation of androgen receptor activity(GO:2000825) |
| 0.2 | 1.7 | GO:0000338 | protein deneddylation(GO:0000338) |
| 0.2 | 9.7 | GO:0000079 | regulation of cyclin-dependent protein serine/threonine kinase activity(GO:0000079) |
| 0.2 | 2.0 | GO:0051292 | nuclear pore complex assembly(GO:0051292) |
| 0.2 | 0.8 | GO:0010606 | positive regulation of cytoplasmic mRNA processing body assembly(GO:0010606) |
| 0.2 | 1.4 | GO:0051001 | negative regulation of nitric-oxide synthase activity(GO:0051001) |
| 0.1 | 5.0 | GO:0017144 | drug metabolic process(GO:0017144) |
| 0.1 | 2.6 | GO:0031424 | keratinization(GO:0031424) |
| 0.1 | 1.3 | GO:0042270 | protection from natural killer cell mediated cytotoxicity(GO:0042270) |
| 0.1 | 2.5 | GO:1990845 | adaptive thermogenesis(GO:1990845) |
| 0.1 | 7.8 | GO:0032233 | positive regulation of actin filament bundle assembly(GO:0032233) |
| 0.1 | 4.8 | GO:1902475 | L-alpha-amino acid transmembrane transport(GO:1902475) |
| 0.1 | 2.8 | GO:0060065 | uterus development(GO:0060065) |
| 0.1 | 4.6 | GO:0008631 | intrinsic apoptotic signaling pathway in response to oxidative stress(GO:0008631) |
| 0.1 | 13.2 | GO:0071260 | cellular response to mechanical stimulus(GO:0071260) |
| 0.1 | 0.3 | GO:0002462 | tolerance induction to nonself antigen(GO:0002462) |
| 0.1 | 0.8 | GO:0001865 | NK T cell differentiation(GO:0001865) |
| 0.1 | 0.7 | GO:2000020 | positive regulation of male gonad development(GO:2000020) |
| 0.1 | 2.8 | GO:0035458 | cellular response to interferon-beta(GO:0035458) |
| 0.1 | 3.0 | GO:0006270 | DNA replication initiation(GO:0006270) |
| 0.1 | 0.7 | GO:0046836 | glycolipid transport(GO:0046836) |
| 0.1 | 1.2 | GO:2000637 | positive regulation of gene silencing by miRNA(GO:2000637) |
| 0.1 | 0.5 | GO:0031508 | pericentric heterochromatin assembly(GO:0031508) |
| 0.1 | 12.2 | GO:0006413 | translational initiation(GO:0006413) |
| 0.1 | 0.7 | GO:0070417 | cellular response to cold(GO:0070417) |
| 0.1 | 1.9 | GO:0035886 | vascular smooth muscle cell differentiation(GO:0035886) histone H2A acetylation(GO:0043968) |
| 0.1 | 4.6 | GO:1904893 | negative regulation of JAK-STAT cascade(GO:0046426) negative regulation of STAT cascade(GO:1904893) |
| 0.1 | 1.5 | GO:0030497 | fatty acid elongation(GO:0030497) |
| 0.1 | 0.4 | GO:0090309 | positive regulation of methylation-dependent chromatin silencing(GO:0090309) |
| 0.1 | 6.5 | GO:0006405 | RNA export from nucleus(GO:0006405) |
| 0.1 | 2.2 | GO:0044342 | type B pancreatic cell proliferation(GO:0044342) |
| 0.1 | 1.6 | GO:0042730 | fibrinolysis(GO:0042730) |
| 0.1 | 3.2 | GO:0048662 | negative regulation of smooth muscle cell proliferation(GO:0048662) |
| 0.1 | 1.1 | GO:1904293 | negative regulation of ERAD pathway(GO:1904293) |
| 0.1 | 1.7 | GO:0071539 | protein localization to centrosome(GO:0071539) |
| 0.1 | 5.0 | GO:0030101 | natural killer cell activation(GO:0030101) |
| 0.1 | 2.4 | GO:0006890 | retrograde vesicle-mediated transport, Golgi to ER(GO:0006890) |
| 0.1 | 0.6 | GO:0002430 | complement receptor mediated signaling pathway(GO:0002430) |
| 0.1 | 0.2 | GO:1904976 | cellular response to bleomycin(GO:1904976) |
| 0.1 | 1.8 | GO:0051642 | centrosome localization(GO:0051642) |
| 0.1 | 0.5 | GO:1900244 | positive regulation of synaptic vesicle endocytosis(GO:1900244) positive regulation of synaptic vesicle recycling(GO:1903423) |
| 0.1 | 0.5 | GO:0006620 | posttranslational protein targeting to membrane(GO:0006620) |
| 0.1 | 3.3 | GO:0051865 | protein autoubiquitination(GO:0051865) |
| 0.1 | 2.7 | GO:0007628 | adult walking behavior(GO:0007628) |
| 0.1 | 1.3 | GO:0007099 | centriole replication(GO:0007099) |
| 0.1 | 1.5 | GO:0015936 | coenzyme A metabolic process(GO:0015936) |
| 0.1 | 5.1 | GO:0007229 | integrin-mediated signaling pathway(GO:0007229) |
| 0.1 | 24.6 | GO:0007283 | spermatogenesis(GO:0007283) |
| 0.1 | 1.1 | GO:0032469 | endoplasmic reticulum calcium ion homeostasis(GO:0032469) |
| 0.1 | 1.7 | GO:0006623 | protein targeting to vacuole(GO:0006623) |
| 0.1 | 1.4 | GO:0070534 | protein K63-linked ubiquitination(GO:0070534) |
| 0.1 | 4.9 | GO:0031532 | actin cytoskeleton reorganization(GO:0031532) |
| 0.0 | 1.1 | GO:0061003 | positive regulation of dendritic spine morphogenesis(GO:0061003) |
| 0.0 | 1.6 | GO:0006506 | GPI anchor biosynthetic process(GO:0006506) |
| 0.0 | 0.8 | GO:0001696 | gastric acid secretion(GO:0001696) |
| 0.0 | 1.8 | GO:0032543 | mitochondrial translation(GO:0032543) |
| 0.0 | 0.1 | GO:0035973 | aggrephagy(GO:0035973) |
| 0.0 | 0.1 | GO:0006421 | asparaginyl-tRNA aminoacylation(GO:0006421) |
| 0.0 | 1.2 | GO:1901099 | negative regulation of signal transduction in absence of ligand(GO:1901099) negative regulation of extrinsic apoptotic signaling pathway in absence of ligand(GO:2001240) |
| 0.0 | 4.1 | GO:0031032 | actomyosin structure organization(GO:0031032) |
| 0.0 | 5.0 | GO:0006457 | protein folding(GO:0006457) |
| 0.0 | 0.3 | GO:0000722 | telomere maintenance via recombination(GO:0000722) |
| 0.0 | 2.3 | GO:0060349 | bone morphogenesis(GO:0060349) |
| 0.0 | 0.1 | GO:0032430 | positive regulation of phospholipase A2 activity(GO:0032430) |
| 0.0 | 2.9 | GO:1902476 | chloride transmembrane transport(GO:1902476) |
| 0.0 | 0.5 | GO:0006825 | copper ion transport(GO:0006825) |
| 0.0 | 0.2 | GO:0006265 | DNA topological change(GO:0006265) |
| 0.0 | 0.9 | GO:0001541 | ovarian follicle development(GO:0001541) |
| 0.0 | 0.5 | GO:0051973 | positive regulation of telomerase activity(GO:0051973) |
| 0.0 | 0.0 | GO:2000574 | regulation of microtubule motor activity(GO:2000574) |
| 0.0 | 0.1 | GO:0046504 | ether lipid biosynthetic process(GO:0008611) glycerol ether biosynthetic process(GO:0046504) ether biosynthetic process(GO:1901503) |
| 0.0 | 0.1 | GO:0032785 | negative regulation of DNA-templated transcription, elongation(GO:0032785) |
| 0.0 | 0.1 | GO:0009235 | cobalamin metabolic process(GO:0009235) |
| 0.0 | 0.1 | GO:0006488 | dolichol-linked oligosaccharide biosynthetic process(GO:0006488) |
| 0.0 | 0.1 | GO:0061462 | protein localization to lysosome(GO:0061462) |
Gene overrepresentation in cellular component category:
| Log-likelihood per target | Total log-likelihood | Term | Description |
|---|---|---|---|
| 4.2 | 16.6 | GO:0034774 | secretory granule lumen(GO:0034774) |
| 2.7 | 49.2 | GO:0031588 | nucleotide-activated protein kinase complex(GO:0031588) |
| 2.6 | 7.8 | GO:0097125 | cyclin B1-CDK1 complex(GO:0097125) |
| 1.6 | 8.2 | GO:1990716 | axonemal central apparatus(GO:1990716) |
| 1.6 | 11.0 | GO:0031094 | platelet dense tubular network(GO:0031094) |
| 1.3 | 9.2 | GO:0036128 | CatSper complex(GO:0036128) |
| 1.0 | 8.1 | GO:0005850 | eukaryotic translation initiation factor 2 complex(GO:0005850) |
| 1.0 | 4.0 | GO:0005606 | laminin-1 complex(GO:0005606) |
| 0.9 | 8.9 | GO:0044613 | nuclear pore central transport channel(GO:0044613) nuclear pore nuclear basket(GO:0044615) |
| 0.8 | 6.7 | GO:0044194 | cytolytic granule(GO:0044194) |
| 0.8 | 2.5 | GO:0005960 | glycine cleavage complex(GO:0005960) |
| 0.8 | 6.3 | GO:0005869 | dynactin complex(GO:0005869) |
| 0.7 | 3.0 | GO:0044299 | C-fiber(GO:0044299) |
| 0.7 | 4.9 | GO:0001674 | female germ cell nucleus(GO:0001674) |
| 0.7 | 8.4 | GO:0043219 | lateral loop(GO:0043219) |
| 0.7 | 2.6 | GO:0005851 | eukaryotic translation initiation factor 2B complex(GO:0005851) |
| 0.6 | 7.8 | GO:1990454 | L-type voltage-gated calcium channel complex(GO:1990454) |
| 0.6 | 6.7 | GO:0005915 | zonula adherens(GO:0005915) |
| 0.6 | 3.6 | GO:0097209 | epidermal lamellar body(GO:0097209) |
| 0.6 | 6.3 | GO:0072687 | meiotic spindle(GO:0072687) |
| 0.5 | 1.6 | GO:0097543 | ciliary inversin compartment(GO:0097543) |
| 0.5 | 4.4 | GO:0005828 | kinetochore microtubule(GO:0005828) |
| 0.5 | 1.9 | GO:0032777 | Piccolo NuA4 histone acetyltransferase complex(GO:0032777) |
| 0.4 | 11.2 | GO:0097225 | sperm midpiece(GO:0097225) |
| 0.4 | 4.3 | GO:0034464 | BBSome(GO:0034464) |
| 0.4 | 4.5 | GO:0017071 | intracellular cyclic nucleotide activated cation channel complex(GO:0017071) |
| 0.4 | 17.9 | GO:0032154 | cleavage furrow(GO:0032154) cell surface furrow(GO:0097610) |
| 0.3 | 4.3 | GO:0046581 | intercellular canaliculus(GO:0046581) |
| 0.3 | 43.4 | GO:0001669 | acrosomal vesicle(GO:0001669) |
| 0.3 | 2.3 | GO:0071541 | eukaryotic translation initiation factor 3 complex, eIF3m(GO:0071541) |
| 0.3 | 46.9 | GO:0005777 | peroxisome(GO:0005777) microbody(GO:0042579) |
| 0.3 | 4.7 | GO:0005639 | integral component of nuclear inner membrane(GO:0005639) intrinsic component of nuclear inner membrane(GO:0031229) |
| 0.3 | 13.6 | GO:0030286 | dynein complex(GO:0030286) |
| 0.3 | 3.6 | GO:0017119 | Golgi transport complex(GO:0017119) |
| 0.2 | 2.0 | GO:0005658 | alpha DNA polymerase:primase complex(GO:0005658) |
| 0.2 | 2.4 | GO:0031616 | spindle pole centrosome(GO:0031616) |
| 0.2 | 0.9 | GO:0071144 | SMAD2-SMAD3 protein complex(GO:0071144) |
| 0.2 | 10.3 | GO:0055038 | recycling endosome membrane(GO:0055038) |
| 0.2 | 2.9 | GO:0030123 | AP-3 adaptor complex(GO:0030123) |
| 0.2 | 2.1 | GO:0042555 | MCM complex(GO:0042555) |
| 0.2 | 9.8 | GO:0000795 | synaptonemal complex(GO:0000795) |
| 0.2 | 0.8 | GO:0030015 | CCR4-NOT core complex(GO:0030015) |
| 0.2 | 4.8 | GO:0005605 | basal lamina(GO:0005605) |
| 0.2 | 2.5 | GO:0044224 | juxtaparanode region of axon(GO:0044224) |
| 0.2 | 1.4 | GO:0031466 | Cul5-RING ubiquitin ligase complex(GO:0031466) |
| 0.2 | 17.7 | GO:0005902 | microvillus(GO:0005902) |
| 0.2 | 0.6 | GO:1990584 | cardiac Troponin complex(GO:1990584) |
| 0.2 | 2.7 | GO:0005845 | mRNA cap binding complex(GO:0005845) |
| 0.2 | 2.0 | GO:0030014 | CCR4-NOT complex(GO:0030014) |
| 0.1 | 1.2 | GO:0032156 | septin cytoskeleton(GO:0032156) |
| 0.1 | 1.6 | GO:0002178 | palmitoyltransferase complex(GO:0002178) |
| 0.1 | 5.1 | GO:0035861 | site of double-strand break(GO:0035861) |
| 0.1 | 18.3 | GO:0005923 | bicellular tight junction(GO:0005923) |
| 0.1 | 0.7 | GO:0016035 | zeta DNA polymerase complex(GO:0016035) |
| 0.1 | 7.4 | GO:0036126 | sperm flagellum(GO:0036126) |
| 0.1 | 5.8 | GO:0046658 | anchored component of plasma membrane(GO:0046658) |
| 0.1 | 2.6 | GO:0030057 | desmosome(GO:0030057) |
| 0.1 | 6.4 | GO:0005876 | spindle microtubule(GO:0005876) |
| 0.1 | 4.4 | GO:1904115 | axon cytoplasm(GO:1904115) |
| 0.1 | 3.4 | GO:0032587 | ruffle membrane(GO:0032587) |
| 0.1 | 11.6 | GO:0005814 | centriole(GO:0005814) |
| 0.1 | 2.3 | GO:0005686 | U2 snRNP(GO:0005686) |
| 0.1 | 1.9 | GO:0032420 | stereocilium(GO:0032420) |
| 0.1 | 1.7 | GO:0034451 | centriolar satellite(GO:0034451) |
| 0.1 | 0.8 | GO:0000808 | origin recognition complex(GO:0000808) nuclear origin of replication recognition complex(GO:0005664) |
| 0.1 | 0.2 | GO:0070939 | Dsl1p complex(GO:0070939) |
| 0.1 | 3.2 | GO:0008180 | COP9 signalosome(GO:0008180) |
| 0.1 | 32.9 | GO:0005813 | centrosome(GO:0005813) |
| 0.1 | 21.6 | GO:0016323 | basolateral plasma membrane(GO:0016323) |
| 0.1 | 0.1 | GO:0098871 | postsynaptic actin cytoskeleton(GO:0098871) postsynaptic cytoskeleton(GO:0099571) |
| 0.1 | 6.6 | GO:0000776 | kinetochore(GO:0000776) |
| 0.1 | 2.0 | GO:0035145 | exon-exon junction complex(GO:0035145) |
| 0.1 | 23.7 | GO:0016607 | nuclear speck(GO:0016607) |
| 0.1 | 0.5 | GO:0030130 | clathrin coat of trans-Golgi network vesicle(GO:0030130) |
| 0.1 | 0.3 | GO:0071004 | U2-type prespliceosome(GO:0071004) |
| 0.0 | 1.9 | GO:0015030 | Cajal body(GO:0015030) |
| 0.0 | 0.9 | GO:0005665 | DNA-directed RNA polymerase II, core complex(GO:0005665) |
| 0.0 | 1.6 | GO:0030496 | midbody(GO:0030496) |
| 0.0 | 1.8 | GO:0010494 | cytoplasmic stress granule(GO:0010494) |
| 0.0 | 14.4 | GO:0005667 | transcription factor complex(GO:0005667) |
| 0.0 | 2.9 | GO:0016605 | PML body(GO:0016605) |
| 0.0 | 0.1 | GO:0032044 | DSIF complex(GO:0032044) |
| 0.0 | 1.6 | GO:0030120 | vesicle coat(GO:0030120) |
| 0.0 | 5.6 | GO:0030659 | cytoplasmic vesicle membrane(GO:0030659) |
| 0.0 | 0.5 | GO:0005721 | pericentric heterochromatin(GO:0005721) |
| 0.0 | 4.3 | GO:0008021 | synaptic vesicle(GO:0008021) |
| 0.0 | 0.5 | GO:0005614 | interstitial matrix(GO:0005614) |
| 0.0 | 2.7 | GO:0005815 | microtubule organizing center(GO:0005815) |
| 0.0 | 0.1 | GO:1990124 | messenger ribonucleoprotein complex(GO:1990124) |
| 0.0 | 0.5 | GO:0005697 | telomerase holoenzyme complex(GO:0005697) |
| 0.0 | 4.6 | GO:0005938 | cell cortex(GO:0005938) |
| 0.0 | 4.8 | GO:0005929 | cilium(GO:0005929) |
| 0.0 | 0.3 | GO:0043240 | Fanconi anaemia nuclear complex(GO:0043240) |
| 0.0 | 1.9 | GO:0035770 | ribonucleoprotein granule(GO:0035770) |
| 0.0 | 3.5 | GO:0031965 | nuclear membrane(GO:0031965) |
| 0.0 | 2.1 | GO:0043204 | perikaryon(GO:0043204) |
| 0.0 | 0.8 | GO:0043195 | terminal bouton(GO:0043195) |
| 0.0 | 11.0 | GO:0005856 | cytoskeleton(GO:0005856) |
Gene overrepresentation in molecular function category:
| Log-likelihood per target | Total log-likelihood | Term | Description |
|---|---|---|---|
| 14.3 | 42.8 | GO:0052853 | very-long-chain-(S)-2-hydroxy-acid oxidase activity(GO:0052852) long-chain-(S)-2-hydroxy-long-chain-acid oxidase activity(GO:0052853) medium-chain-(S)-2-hydroxy-acid oxidase activity(GO:0052854) |
| 3.8 | 15.3 | GO:0015350 | methotrexate transporter activity(GO:0015350) |
| 3.3 | 49.2 | GO:0004679 | AMP-activated protein kinase activity(GO:0004679) |
| 3.3 | 9.8 | GO:0004769 | steroid delta-isomerase activity(GO:0004769) |
| 3.0 | 9.1 | GO:0004370 | glycerol kinase activity(GO:0004370) |
| 2.7 | 11.0 | GO:0032190 | acrosin binding(GO:0032190) |
| 2.7 | 8.1 | GO:0004058 | aromatic-L-amino-acid decarboxylase activity(GO:0004058) L-dopa decarboxylase activity(GO:0036468) |
| 1.9 | 7.5 | GO:0008241 | peptidyl-dipeptidase activity(GO:0008241) |
| 1.9 | 5.6 | GO:0004069 | L-aspartate:2-oxoglutarate aminotransferase activity(GO:0004069) |
| 1.7 | 8.4 | GO:0001042 | RNA polymerase I core binding(GO:0001042) |
| 1.6 | 4.7 | GO:0042903 | tubulin deacetylase activity(GO:0042903) |
| 1.5 | 4.6 | GO:0005017 | platelet-derived growth factor-activated receptor activity(GO:0005017) |
| 1.5 | 4.4 | GO:0031249 | denatured protein binding(GO:0031249) |
| 1.4 | 12.7 | GO:0022833 | mechanically-gated ion channel activity(GO:0008381) mechanically gated channel activity(GO:0022833) |
| 1.3 | 3.9 | GO:0008263 | pyrimidine-specific mismatch base pair DNA N-glycosylase activity(GO:0008263) |
| 1.3 | 7.8 | GO:0086059 | voltage-gated calcium channel activity involved SA node cell action potential(GO:0086059) |
| 1.3 | 3.8 | GO:0070698 | type I activin receptor binding(GO:0070698) |
| 1.1 | 8.5 | GO:0016413 | O-acetyltransferase activity(GO:0016413) |
| 1.0 | 3.9 | GO:0047619 | acylcarnitine hydrolase activity(GO:0047619) |
| 0.9 | 18.6 | GO:0008199 | ferric iron binding(GO:0008199) |
| 0.9 | 3.7 | GO:0000829 | inositol heptakisphosphate kinase activity(GO:0000829) |
| 0.8 | 7.4 | GO:0001758 | retinal dehydrogenase activity(GO:0001758) |
| 0.8 | 5.5 | GO:0047035 | testosterone dehydrogenase (NAD+) activity(GO:0047035) |
| 0.7 | 8.4 | GO:0004499 | N,N-dimethylaniline monooxygenase activity(GO:0004499) |
| 0.7 | 8.9 | GO:0032453 | histone demethylase activity (H3-K4 specific)(GO:0032453) |
| 0.7 | 8.1 | GO:0005436 | sodium:phosphate symporter activity(GO:0005436) |
| 0.7 | 2.6 | GO:0019784 | NEDD8-specific protease activity(GO:0019784) |
| 0.6 | 4.4 | GO:0003896 | DNA primase activity(GO:0003896) |
| 0.6 | 2.5 | GO:0017077 | oxidative phosphorylation uncoupler activity(GO:0017077) |
| 0.6 | 2.3 | GO:0008309 | double-stranded DNA exodeoxyribonuclease activity(GO:0008309) |
| 0.5 | 2.2 | GO:0051377 | mannose-ethanolamine phosphotransferase activity(GO:0051377) |
| 0.5 | 4.3 | GO:0071253 | connexin binding(GO:0071253) |
| 0.5 | 5.8 | GO:0042608 | T cell receptor binding(GO:0042608) |
| 0.5 | 4.7 | GO:0004931 | extracellular ATP-gated cation channel activity(GO:0004931) ATP-gated ion channel activity(GO:0035381) |
| 0.5 | 6.1 | GO:0070008 | serine-type exopeptidase activity(GO:0070008) |
| 0.5 | 3.0 | GO:0031727 | CCR2 chemokine receptor binding(GO:0031727) |
| 0.5 | 1.5 | GO:0102345 | 3-hydroxy-behenoyl-CoA dehydratase activity(GO:0102344) 3-hydroxy-lignoceroyl-CoA dehydratase activity(GO:0102345) |
| 0.4 | 8.9 | GO:0017056 | structural constituent of nuclear pore(GO:0017056) |
| 0.4 | 4.0 | GO:0043208 | glycosphingolipid binding(GO:0043208) |
| 0.4 | 7.8 | GO:0035173 | histone kinase activity(GO:0035173) |
| 0.4 | 1.2 | GO:0033906 | hyaluronoglucuronidase activity(GO:0033906) |
| 0.4 | 2.4 | GO:0033142 | progesterone receptor binding(GO:0033142) |
| 0.4 | 13.1 | GO:0061631 | ubiquitin conjugating enzyme activity(GO:0061631) |
| 0.4 | 5.4 | GO:0016500 | protein-hormone receptor activity(GO:0016500) |
| 0.4 | 4.5 | GO:0005223 | intracellular cGMP activated cation channel activity(GO:0005223) |
| 0.4 | 1.1 | GO:0001605 | adrenomedullin receptor activity(GO:0001605) |
| 0.4 | 5.1 | GO:0004861 | cyclin-dependent protein serine/threonine kinase inhibitor activity(GO:0004861) |
| 0.3 | 2.0 | GO:0019871 | sodium channel inhibitor activity(GO:0019871) |
| 0.3 | 2.0 | GO:0004126 | cytidine deaminase activity(GO:0004126) |
| 0.3 | 9.2 | GO:0005248 | voltage-gated sodium channel activity(GO:0005248) |
| 0.3 | 3.6 | GO:0003796 | lysozyme activity(GO:0003796) |
| 0.3 | 7.4 | GO:0044183 | protein binding involved in protein folding(GO:0044183) |
| 0.3 | 3.5 | GO:0070097 | delta-catenin binding(GO:0070097) |
| 0.3 | 32.9 | GO:0004222 | metalloendopeptidase activity(GO:0004222) |
| 0.2 | 7.6 | GO:0015020 | glucuronosyltransferase activity(GO:0015020) |
| 0.2 | 4.9 | GO:0070300 | phosphatidic acid binding(GO:0070300) |
| 0.2 | 15.8 | GO:0003743 | translation initiation factor activity(GO:0003743) |
| 0.2 | 8.5 | GO:0031624 | ubiquitin conjugating enzyme binding(GO:0031624) |
| 0.2 | 4.3 | GO:0004550 | nucleoside diphosphate kinase activity(GO:0004550) |
| 0.2 | 0.9 | GO:0030618 | transforming growth factor beta receptor, pathway-specific cytoplasmic mediator activity(GO:0030618) |
| 0.2 | 4.7 | GO:0043395 | heparan sulfate proteoglycan binding(GO:0043395) |
| 0.2 | 2.0 | GO:0015386 | potassium:proton antiporter activity(GO:0015386) |
| 0.2 | 4.4 | GO:0051010 | microtubule plus-end binding(GO:0051010) |
| 0.2 | 0.8 | GO:0001226 | RNA polymerase II transcription corepressor binding(GO:0001226) |
| 0.2 | 4.8 | GO:0019825 | oxygen binding(GO:0019825) |
| 0.2 | 1.4 | GO:0016421 | CoA carboxylase activity(GO:0016421) |
| 0.2 | 8.5 | GO:0070888 | E-box binding(GO:0070888) |
| 0.2 | 5.4 | GO:0043015 | gamma-tubulin binding(GO:0043015) |
| 0.2 | 0.6 | GO:0030172 | troponin C binding(GO:0030172) |
| 0.2 | 1.2 | GO:0002151 | G-quadruplex RNA binding(GO:0002151) |
| 0.2 | 1.2 | GO:0015143 | urate transmembrane transporter activity(GO:0015143) salt transmembrane transporter activity(GO:1901702) |
| 0.2 | 0.9 | GO:0015173 | aromatic amino acid transmembrane transporter activity(GO:0015173) |
| 0.1 | 1.8 | GO:0031730 | CCR5 chemokine receptor binding(GO:0031730) |
| 0.1 | 2.9 | GO:0005229 | intracellular calcium activated chloride channel activity(GO:0005229) |
| 0.1 | 0.3 | GO:0050253 | retinyl-palmitate esterase activity(GO:0050253) |
| 0.1 | 2.0 | GO:0004535 | poly(A)-specific ribonuclease activity(GO:0004535) |
| 0.1 | 2.4 | GO:0015643 | toxic substance binding(GO:0015643) |
| 0.1 | 0.5 | GO:0016724 | ferroxidase activity(GO:0004322) oxidoreductase activity, oxidizing metal ions, oxygen as acceptor(GO:0016724) |
| 0.1 | 0.5 | GO:0070052 | collagen V binding(GO:0070052) |
| 0.1 | 2.5 | GO:0016594 | glycine binding(GO:0016594) |
| 0.1 | 0.9 | GO:0001055 | RNA polymerase II activity(GO:0001055) |
| 0.1 | 3.9 | GO:0042974 | retinoic acid receptor binding(GO:0042974) |
| 0.1 | 5.4 | GO:0004715 | non-membrane spanning protein tyrosine kinase activity(GO:0004715) |
| 0.1 | 9.3 | GO:0046332 | SMAD binding(GO:0046332) |
| 0.1 | 3.3 | GO:0030742 | GTP-dependent protein binding(GO:0030742) |
| 0.1 | 2.6 | GO:0004693 | cyclin-dependent protein serine/threonine kinase activity(GO:0004693) |
| 0.1 | 2.8 | GO:0004864 | protein phosphatase inhibitor activity(GO:0004864) |
| 0.1 | 1.0 | GO:0004875 | complement receptor activity(GO:0004875) |
| 0.1 | 1.9 | GO:0043274 | phospholipase binding(GO:0043274) |
| 0.1 | 7.9 | GO:0005200 | structural constituent of cytoskeleton(GO:0005200) |
| 0.1 | 5.1 | GO:0017022 | myosin binding(GO:0017022) |
| 0.1 | 0.7 | GO:0008432 | JUN kinase binding(GO:0008432) |
| 0.1 | 10.2 | GO:0042626 | ATPase activity, coupled to transmembrane movement of substances(GO:0042626) |
| 0.1 | 7.2 | GO:0004867 | serine-type endopeptidase inhibitor activity(GO:0004867) |
| 0.1 | 0.2 | GO:0044378 | non-sequence-specific DNA binding, bending(GO:0044378) |
| 0.1 | 0.3 | GO:0050733 | RS domain binding(GO:0050733) |
| 0.1 | 1.4 | GO:0030276 | clathrin binding(GO:0030276) |
| 0.1 | 0.5 | GO:0003720 | double-stranded telomeric DNA binding(GO:0003691) telomerase activity(GO:0003720) RNA-directed DNA polymerase activity(GO:0003964) |
| 0.1 | 0.8 | GO:0003688 | DNA replication origin binding(GO:0003688) |
| 0.1 | 7.6 | GO:0001078 | transcriptional repressor activity, RNA polymerase II core promoter proximal region sequence-specific binding(GO:0001078) |
| 0.1 | 4.9 | GO:0003705 | transcription factor activity, RNA polymerase II distal enhancer sequence-specific binding(GO:0003705) |
| 0.1 | 4.3 | GO:0003777 | microtubule motor activity(GO:0003777) |
| 0.0 | 21.3 | GO:0004674 | protein serine/threonine kinase activity(GO:0004674) |
| 0.0 | 1.6 | GO:0019707 | protein-cysteine S-palmitoyltransferase activity(GO:0019706) protein-cysteine S-acyltransferase activity(GO:0019707) |
| 0.0 | 0.5 | GO:0070513 | death domain binding(GO:0070513) |
| 0.0 | 12.6 | GO:0005096 | GTPase activator activity(GO:0005096) |
| 0.0 | 1.3 | GO:0008408 | 3'-5' exonuclease activity(GO:0008408) |
| 0.0 | 4.1 | GO:0036459 | thiol-dependent ubiquitinyl hydrolase activity(GO:0036459) |
| 0.0 | 0.1 | GO:0003831 | beta-N-acetylglucosaminylglycopeptide beta-1,4-galactosyltransferase activity(GO:0003831) |
| 0.0 | 0.7 | GO:0030371 | translation repressor activity(GO:0030371) |
| 0.0 | 2.4 | GO:0004860 | protein kinase inhibitor activity(GO:0004860) |
| 0.0 | 1.1 | GO:0030374 | ligand-dependent nuclear receptor transcription coactivator activity(GO:0030374) |
| 0.0 | 0.1 | GO:0051032 | nucleic acid transmembrane transporter activity(GO:0051032) RNA transmembrane transporter activity(GO:0051033) |
| 0.0 | 3.1 | GO:0004386 | helicase activity(GO:0004386) |
| 0.0 | 0.2 | GO:0004128 | cytochrome-b5 reductase activity, acting on NAD(P)H(GO:0004128) |
| 0.0 | 1.8 | GO:0008013 | beta-catenin binding(GO:0008013) |
| 0.0 | 13.3 | GO:0008289 | lipid binding(GO:0008289) |
| 0.0 | 2.0 | GO:0005516 | calmodulin binding(GO:0005516) |
| 0.0 | 3.8 | GO:0003924 | GTPase activity(GO:0003924) |
| 0.0 | 0.4 | GO:1990841 | promoter-specific chromatin binding(GO:1990841) |
Gene overrepresentation in curated gene sets: canonical pathways category:
| Log-likelihood per target | Total log-likelihood | Term | Description |
|---|---|---|---|
| 0.8 | 7.8 | SA G2 AND M PHASES | Cdc25 activates the cdc2/cyclin B complex to induce the G2/M transition. |
| 0.4 | 8.4 | PID ERBB NETWORK PATHWAY | ErbB receptor signaling network |
| 0.3 | 21.9 | PID AJDISS 2PATHWAY | Posttranslational regulation of adherens junction stability and dissassembly |
| 0.2 | 4.0 | PID INTEGRIN4 PATHWAY | Alpha6 beta4 integrin-ligand interactions |
| 0.2 | 11.1 | PID HNF3B PATHWAY | FOXA2 and FOXA3 transcription factor networks |
| 0.2 | 6.7 | PID ECADHERIN STABILIZATION PATHWAY | Stabilization and expansion of the E-cadherin adherens junction |
| 0.2 | 4.5 | PID CONE PATHWAY | Visual signal transduction: Cones |
| 0.2 | 4.3 | PID ECADHERIN NASCENT AJ PATHWAY | E-cadherin signaling in the nascent adherens junction |
| 0.1 | 3.2 | PID HEDGEHOG 2PATHWAY | Signaling events mediated by the Hedgehog family |
| 0.1 | 1.8 | ST INTERFERON GAMMA PATHWAY | Interferon gamma pathway. |
| 0.1 | 9.4 | PID MYC REPRESS PATHWAY | Validated targets of C-MYC transcriptional repression |
| 0.1 | 1.3 | PID DNA PK PATHWAY | DNA-PK pathway in nonhomologous end joining |
| 0.1 | 3.5 | PID BARD1 PATHWAY | BARD1 signaling events |
| 0.1 | 2.8 | PID HDAC CLASSIII PATHWAY | Signaling events mediated by HDAC Class III |
| 0.1 | 3.9 | PID HEDGEHOG GLI PATHWAY | Hedgehog signaling events mediated by Gli proteins |
| 0.1 | 3.0 | PID IL23 PATHWAY | IL23-mediated signaling events |
| 0.1 | 4.6 | PID ATF2 PATHWAY | ATF-2 transcription factor network |
| 0.1 | 3.8 | PID P53 REGULATION PATHWAY | p53 pathway |
| 0.1 | 2.4 | PID AURORA A PATHWAY | Aurora A signaling |
| 0.1 | 3.5 | PID BMP PATHWAY | BMP receptor signaling |
| 0.1 | 0.9 | PID AR NONGENOMIC PATHWAY | Nongenotropic Androgen signaling |
| 0.1 | 4.1 | PID TCR PATHWAY | TCR signaling in naïve CD4+ T cells |
| 0.1 | 2.4 | PID TGFBR PATHWAY | TGF-beta receptor signaling |
| 0.1 | 8.4 | NABA ECM AFFILIATED | Genes encoding proteins affiliated structurally or functionally to extracellular matrix proteins |
| 0.1 | 13.0 | NABA ECM REGULATORS | Genes encoding enzymes and their regulators involved in the remodeling of the extracellular matrix |
| 0.0 | 1.1 | PID ERBB1 INTERNALIZATION PATHWAY | Internalization of ErbB1 |
| 0.0 | 1.6 | PID TAP63 PATHWAY | Validated transcriptional targets of TAp63 isoforms |
| 0.0 | 2.1 | PID E2F PATHWAY | E2F transcription factor network |
| 0.0 | 1.0 | PID AP1 PATHWAY | AP-1 transcription factor network |
| 0.0 | 0.5 | PID HIV NEF PATHWAY | HIV-1 Nef: Negative effector of Fas and TNF-alpha |
| 0.0 | 0.4 | PID WNT NONCANONICAL PATHWAY | Noncanonical Wnt signaling pathway |
| 0.0 | 0.5 | PID AR TF PATHWAY | Regulation of Androgen receptor activity |
| 0.0 | 0.5 | PID DELTA NP63 PATHWAY | Validated transcriptional targets of deltaNp63 isoforms |
| 0.0 | 0.2 | PID CIRCADIAN PATHWAY | Circadian rhythm pathway |
Gene overrepresentation in curated gene sets: REACTOME pathways category:
| Log-likelihood per target | Total log-likelihood | Term | Description |
|---|---|---|---|
| 0.8 | 9.8 | REACTOME ANDROGEN BIOSYNTHESIS | Genes involved in Androgen biosynthesis |
| 0.7 | 8.6 | REACTOME E2F ENABLED INHIBITION OF PRE REPLICATION COMPLEX FORMATION | Genes involved in E2F-enabled inhibition of pre-replication complex formation |
| 0.5 | 8.1 | REACTOME DOWNREGULATION OF ERBB2 ERBB3 SIGNALING | Genes involved in Downregulation of ERBB2:ERBB3 signaling |
| 0.4 | 6.6 | REACTOME AMINE DERIVED HORMONES | Genes involved in Amine-derived hormones |
| 0.4 | 8.5 | REACTOME PEROXISOMAL LIPID METABOLISM | Genes involved in Peroxisomal lipid metabolism |
| 0.4 | 7.8 | REACTOME STEROID HORMONES | Genes involved in Steroid hormones |
| 0.3 | 11.4 | REACTOME REGULATION OF BETA CELL DEVELOPMENT | Genes involved in Regulation of beta-cell development |
| 0.3 | 4.3 | REACTOME APOPTOTIC CLEAVAGE OF CELL ADHESION PROTEINS | Genes involved in Apoptotic cleavage of cell adhesion proteins |
| 0.3 | 3.9 | REACTOME BASE FREE SUGAR PHOSPHATE REMOVAL VIA THE SINGLE NUCLEOTIDE REPLACEMENT PATHWAY | Genes involved in Base-free sugar-phosphate removal via the single-nucleotide replacement pathway |
| 0.3 | 10.8 | REACTOME PHASE1 FUNCTIONALIZATION OF COMPOUNDS | Genes involved in Phase 1 - Functionalization of compounds |
| 0.3 | 4.4 | REACTOME INHIBITION OF REPLICATION INITIATION OF DAMAGED DNA BY RB1 E2F1 | Genes involved in Inhibition of replication initiation of damaged DNA by RB1/E2F1 |
| 0.3 | 4.1 | REACTOME COMMON PATHWAY | Genes involved in Common Pathway |
| 0.2 | 4.6 | REACTOME REGULATION OF INSULIN LIKE GROWTH FACTOR IGF ACTIVITY BY INSULIN LIKE GROWTH FACTOR BINDING PROTEINS IGFBPS | Genes involved in Regulation of Insulin-like Growth Factor (IGF) Activity by Insulin-like Growth Factor Binding Proteins (IGFBPs) |
| 0.2 | 4.1 | REACTOME HS GAG DEGRADATION | Genes involved in HS-GAG degradation |
| 0.2 | 2.1 | REACTOME UNWINDING OF DNA | Genes involved in Unwinding of DNA |
| 0.2 | 4.7 | REACTOME SMAD2 SMAD3 SMAD4 HETEROTRIMER REGULATES TRANSCRIPTION | Genes involved in SMAD2/SMAD3:SMAD4 heterotrimer regulates transcription |
| 0.2 | 3.8 | REACTOME SIGNALING BY BMP | Genes involved in Signaling by BMP |
| 0.1 | 1.2 | REACTOME IRAK2 MEDIATED ACTIVATION OF TAK1 COMPLEX UPON TLR7 8 OR 9 STIMULATION | Genes involved in IRAK2 mediated activation of TAK1 complex upon TLR7/8 or 9 stimulation |
| 0.1 | 1.8 | REACTOME IL 6 SIGNALING | Genes involved in Interleukin-6 signaling |
| 0.1 | 1.3 | REACTOME REGULATION OF INSULIN SECRETION BY ACETYLCHOLINE | Genes involved in Regulation of Insulin Secretion by Acetylcholine |
| 0.1 | 2.8 | REACTOME DEADENYLATION OF MRNA | Genes involved in Deadenylation of mRNA |
| 0.1 | 1.2 | REACTOME HYALURONAN UPTAKE AND DEGRADATION | Genes involved in Hyaluronan uptake and degradation |
| 0.1 | 5.4 | REACTOME CHEMOKINE RECEPTORS BIND CHEMOKINES | Genes involved in Chemokine receptors bind chemokines |
| 0.1 | 2.6 | REACTOME ELONGATION ARREST AND RECOVERY | Genes involved in Elongation arrest and recovery |
| 0.1 | 1.7 | REACTOME ABCA TRANSPORTERS IN LIPID HOMEOSTASIS | Genes involved in ABCA transporters in lipid homeostasis |
| 0.1 | 1.7 | REACTOME GLUCURONIDATION | Genes involved in Glucuronidation |
| 0.1 | 1.6 | REACTOME SYNTHESIS OF GLYCOSYLPHOSPHATIDYLINOSITOL GPI | Genes involved in Synthesis of glycosylphosphatidylinositol (GPI) |
| 0.1 | 3.1 | REACTOME SEMA4D IN SEMAPHORIN SIGNALING | Genes involved in Sema4D in semaphorin signaling |
| 0.1 | 4.2 | REACTOME AMINO ACID AND OLIGOPEPTIDE SLC TRANSPORTERS | Genes involved in Amino acid and oligopeptide SLC transporters |
| 0.1 | 1.4 | REACTOME ENOS ACTIVATION AND REGULATION | Genes involved in eNOS activation and regulation |
| 0.1 | 1.0 | REACTOME FACILITATIVE NA INDEPENDENT GLUCOSE TRANSPORTERS | Genes involved in Facilitative Na+-independent glucose transporters |
| 0.1 | 4.6 | REACTOME LOSS OF NLP FROM MITOTIC CENTROSOMES | Genes involved in Loss of Nlp from mitotic centrosomes |
| 0.1 | 1.5 | REACTOME MRNA SPLICING MINOR PATHWAY | Genes involved in mRNA Splicing - Minor Pathway |
| 0.0 | 1.1 | REACTOME NEGATIVE REGULATORS OF RIG I MDA5 SIGNALING | Genes involved in Negative regulators of RIG-I/MDA5 signaling |
| 0.0 | 4.0 | REACTOME INTEGRIN CELL SURFACE INTERACTIONS | Genes involved in Integrin cell surface interactions |
| 0.0 | 2.7 | REACTOME ANTIVIRAL MECHANISM BY IFN STIMULATED GENES | Genes involved in Antiviral mechanism by IFN-stimulated genes |
| 0.0 | 3.2 | REACTOME MITOTIC PROMETAPHASE | Genes involved in Mitotic Prometaphase |
| 0.0 | 2.0 | REACTOME TRANSPORT OF INORGANIC CATIONS ANIONS AND AMINO ACIDS OLIGOPEPTIDES | Genes involved in Transport of inorganic cations/anions and amino acids/oligopeptides |
| 0.0 | 1.0 | REACTOME PYRIMIDINE METABOLISM | Genes involved in Pyrimidine metabolism |
| 0.0 | 1.6 | REACTOME GOLGI ASSOCIATED VESICLE BIOGENESIS | Genes involved in Golgi Associated Vesicle Biogenesis |
| 0.0 | 0.8 | REACTOME BIOSYNTHESIS OF THE N GLYCAN PRECURSOR DOLICHOL LIPID LINKED OLIGOSACCHARIDE LLO AND TRANSFER TO A NASCENT PROTEIN | Genes involved in Biosynthesis of the N-glycan precursor (dolichol lipid-linked oligosaccharide, LLO) and transfer to a nascent protein |
| 0.0 | 0.8 | REACTOME APOPTOTIC CLEAVAGE OF CELLULAR PROTEINS | Genes involved in Apoptotic cleavage of cellular proteins |
| 0.0 | 1.2 | REACTOME DOWNSTREAM SIGNAL TRANSDUCTION | Genes involved in Downstream signal transduction |
| 0.0 | 1.6 | REACTOME G ALPHA S SIGNALLING EVENTS | Genes involved in G alpha (s) signalling events |
| 0.0 | 0.5 | REACTOME IRON UPTAKE AND TRANSPORT | Genes involved in Iron uptake and transport |
| 0.0 | 0.3 | REACTOME FANCONI ANEMIA PATHWAY | Genes involved in Fanconi Anemia pathway |