Project
GSE53960: rat RNA-Seq transcriptomic Bodymap
Navigation
Downloads
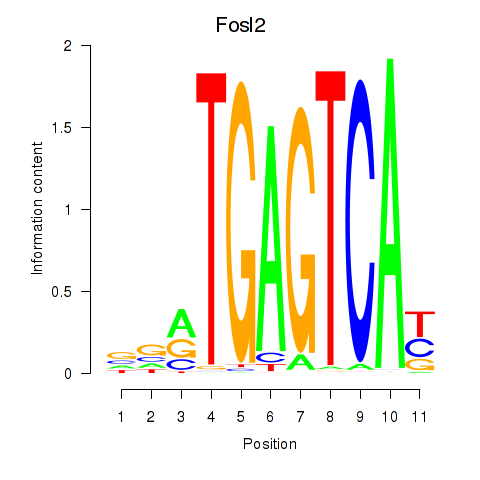
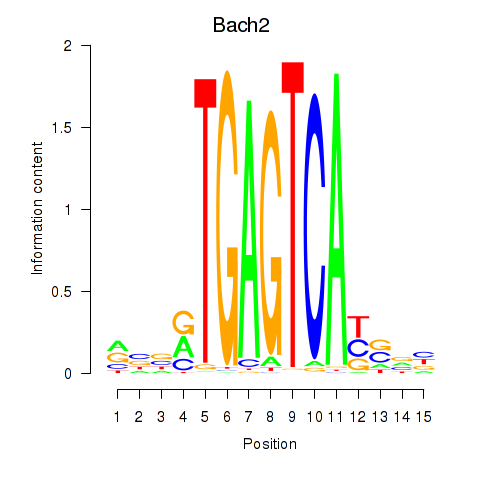
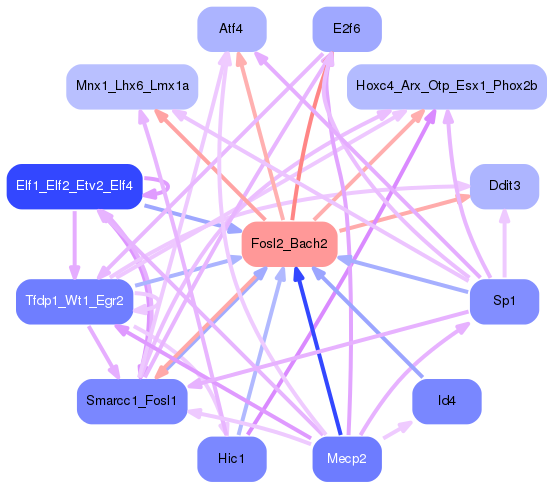
Results for Fosl2_Bach2
Z-value: 1.42
Motif logo
Transcription factors associated with Fosl2_Bach2
| Gene Symbol | Gene ID | Gene Info |
|---|---|---|
|
Fosl2
|
ENSRNOG00000052357 | FOS like 2, AP-1 transcription factor subunit |
|
Bach2
|
ENSRNOG00000006170 | BTB domain and CNC homolog 2 |
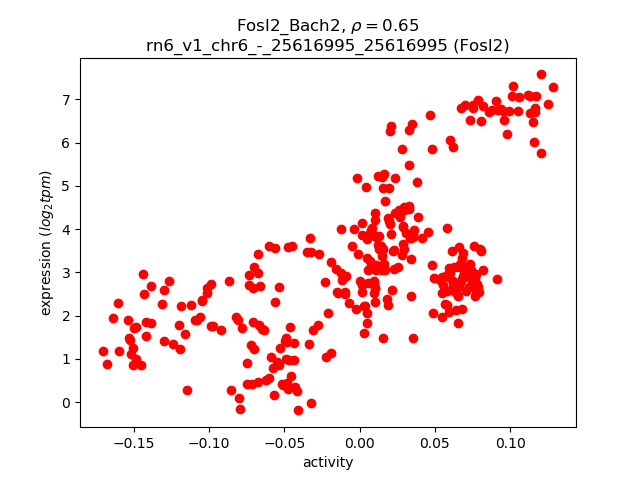
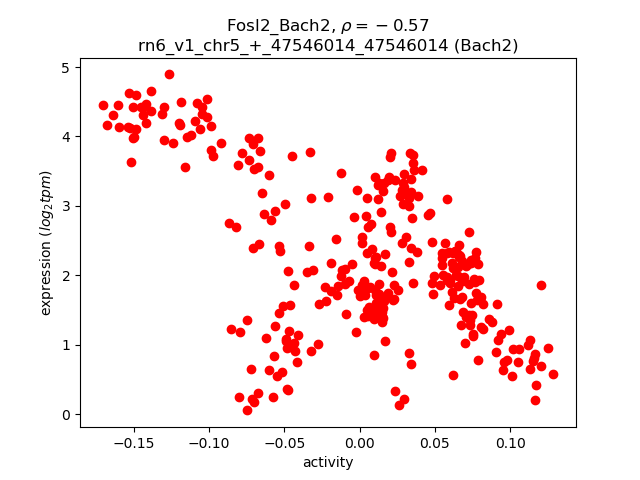
Activity-expression correlation:
| Gene | Promoter | Pearson corr. coef. | P-value | Plot |
|---|---|---|---|---|
| Fosl2 | rn6_v1_chr6_-_25616995_25616995 | 0.65 | 2.8e-40 | Click! |
| Bach2 | rn6_v1_chr5_+_47546014_47546014 | -0.57 | 2.4e-29 | Click! |
Activity profile of Fosl2_Bach2 motif
Sorted Z-values of Fosl2_Bach2 motif
| Promoter | Log-likelihood | Transcript | Gene | Gene Info |
|---|---|---|---|---|
| chr19_-_9777465 | 79.64 |
ENSRNOT00000017413
|
Ndrg4
|
NDRG family member 4 |
| chr1_-_198232344 | 72.77 |
ENSRNOT00000080988
|
Aldoa
|
aldolase, fructose-bisphosphate A |
| chr7_+_59200918 | 64.67 |
ENSRNOT00000085073
|
Ptprr
|
protein tyrosine phosphatase, receptor type, R |
| chr3_+_152552822 | 62.09 |
ENSRNOT00000089719
|
Epb41l1
|
erythrocyte membrane protein band 4.1-like 1 |
| chr1_+_105284753 | 61.54 |
ENSRNOT00000041950
|
Slc6a5
|
solute carrier family 6 member 5 |
| chrX_-_142248369 | 60.73 |
ENSRNOT00000091330
|
Fgf13
|
fibroblast growth factor 13 |
| chr9_+_38297322 | 44.89 |
ENSRNOT00000078157
ENSRNOT00000088824 |
Bend6
|
BEN domain containing 6 |
| chr13_-_73819896 | 41.52 |
ENSRNOT00000036392
|
Fam163a
|
family with sequence similarity 163, member A |
| chr16_-_81880502 | 41.51 |
ENSRNOT00000079096
|
Mcf2l
|
MCF.2 cell line derived transforming sequence-like |
| chr1_-_42587666 | 41.40 |
ENSRNOT00000083225
ENSRNOT00000025355 |
Rgs17
|
regulator of G-protein signaling 17 |
| chr7_+_3355116 | 39.61 |
ENSRNOT00000030453
ENSRNOT00000061657 |
Itga7
|
integrin subunit alpha 7 |
| chr20_+_5008508 | 38.75 |
ENSRNOT00000001153
|
Vwa7
|
von Willebrand factor A domain containing 7 |
| chr17_+_13670520 | 37.74 |
ENSRNOT00000019442
|
Shc3
|
SHC adaptor protein 3 |
| chr10_-_82229140 | 36.91 |
ENSRNOT00000004400
|
Epn3
|
epsin 3 |
| chr16_-_10941414 | 36.49 |
ENSRNOT00000086627
ENSRNOT00000085414 ENSRNOT00000081631 ENSRNOT00000087521 ENSRNOT00000083623 |
Ldb3
|
LIM domain binding 3 |
| chr15_-_77736892 | 35.75 |
ENSRNOT00000057924
|
Pcdh9
|
protocadherin 9 |
| chr1_-_100671074 | 35.35 |
ENSRNOT00000027132
|
Myh14
|
myosin heavy chain 14 |
| chr10_-_104575890 | 35.30 |
ENSRNOT00000050223
|
H3f3b
|
H3 histone family member 3B |
| chr9_-_19613360 | 34.35 |
ENSRNOT00000029593
|
Rcan2
|
regulator of calcineurin 2 |
| chr13_+_89826254 | 33.40 |
ENSRNOT00000006141
|
F11r
|
F11 receptor |
| chr1_+_220335254 | 32.99 |
ENSRNOT00000072261
|
Rin1
|
Ras and Rab interactor 1 |
| chr5_+_164796185 | 32.60 |
ENSRNOT00000010779
|
Nppb
|
natriuretic peptide B |
| chr1_+_89008117 | 30.83 |
ENSRNOT00000028401
|
Hspb6
|
heat shock protein family B (small) member 6 |
| chrX_-_31968152 | 30.74 |
ENSRNOT00000004884
|
Pir
|
pirin |
| chr2_+_144861455 | 30.56 |
ENSRNOT00000093284
ENSRNOT00000019748 ENSRNOT00000072110 |
Dclk1
|
doublecortin-like kinase 1 |
| chr1_+_79989019 | 30.44 |
ENSRNOT00000020428
|
Dmpk
|
dystrophia myotonica-protein kinase |
| chrX_+_17171605 | 30.43 |
ENSRNOT00000048236
|
Nudt10
|
nudix (nucleoside diphosphate linked moiety X)-type motif 10 |
| chr4_-_157294047 | 30.01 |
ENSRNOT00000005601
|
Eno2
|
enolase 2 |
| chr1_+_20332371 | 29.85 |
ENSRNOT00000037259
|
Tmem200a
|
transmembrane protein 200A |
| chr6_+_50528823 | 28.74 |
ENSRNOT00000008321
|
Lamb1
|
laminin subunit beta 1 |
| chr1_+_220428481 | 28.69 |
ENSRNOT00000027335
|
LOC108348044
|
ras and Rab interactor 1 |
| chr9_+_20251521 | 28.59 |
ENSRNOT00000005535
|
LOC100911625
|
gamma-enolase-like |
| chr3_+_124515978 | 28.58 |
ENSRNOT00000028881
|
Prnp
|
prion protein |
| chr9_+_118586179 | 27.92 |
ENSRNOT00000022351
|
Dlgap1
|
DLG associated protein 1 |
| chr2_-_227207584 | 27.20 |
ENSRNOT00000065361
ENSRNOT00000080215 |
Myoz2
|
myozenin 2 |
| chr8_-_59226597 | 25.82 |
ENSRNOT00000088208
|
Acsbg1
|
acyl-CoA synthetase bubblegum family member 1 |
| chr2_+_225310624 | 25.03 |
ENSRNOT00000015836
|
F3
|
coagulation factor III, tissue factor |
| chr4_-_155690869 | 24.77 |
ENSRNOT00000012216
|
C3ar1
|
complement C3a receptor 1 |
| chr10_-_51669297 | 23.74 |
ENSRNOT00000071595
|
Arhgap44
|
Rho GTPase activating protein 44 |
| chr10_+_55712043 | 23.41 |
ENSRNOT00000010141
|
Aloxe3
|
arachidonate lipoxygenase 3 |
| chr3_-_105512939 | 23.03 |
ENSRNOT00000011773
|
Actc1
|
actin, alpha, cardiac muscle 1 |
| chr10_-_56624526 | 22.21 |
ENSRNOT00000024973
|
Acadvl
|
acyl-CoA dehydrogenase, very long chain |
| chr2_+_240495371 | 22.05 |
ENSRNOT00000031425
|
Slc9b2
|
solute carrier family 9 member B2 |
| chr12_-_2568382 | 21.99 |
ENSRNOT00000035142
|
Lrrc8e
|
leucine rich repeat containing 8 family, member E |
| chr10_+_46018659 | 21.62 |
ENSRNOT00000040865
ENSRNOT00000004357 |
Mprip
|
myosin phosphatase Rho interacting protein |
| chr4_-_62860446 | 21.42 |
ENSRNOT00000015752
|
Fam180a
|
family with sequence similarity 180, member A |
| chr8_+_55178289 | 21.16 |
ENSRNOT00000059127
|
Cryab
|
crystallin, alpha B |
| chr15_-_61564695 | 20.96 |
ENSRNOT00000068216
|
Rgcc
|
regulator of cell cycle |
| chr16_+_23317953 | 20.68 |
ENSRNOT00000075287
|
AABR07024972.1
|
|
| chr20_+_25990656 | 20.45 |
ENSRNOT00000081254
|
Lrrtm3
|
leucine rich repeat transmembrane neuronal 3 |
| chr9_-_49950093 | 20.09 |
ENSRNOT00000023014
|
Fhl2
|
four and a half LIM domains 2 |
| chr2_-_45518502 | 19.78 |
ENSRNOT00000014627
|
Hspb3
|
heat shock protein family B (small) member 3 |
| chr17_-_87826421 | 19.73 |
ENSRNOT00000068156
|
Arhgap21
|
Rho GTPase activating protein 21 |
| chr8_-_94368834 | 19.51 |
ENSRNOT00000078977
|
Me1
|
malic enzyme 1 |
| chr10_-_85084850 | 19.07 |
ENSRNOT00000012462
|
Tbkbp1
|
TBK1 binding protein 1 |
| chr1_-_31122093 | 18.96 |
ENSRNOT00000016712
|
NEWGENE_1307525
|
SOGA family member 3 |
| chr13_+_100980574 | 18.81 |
ENSRNOT00000067005
ENSRNOT00000004649 |
Capn8
|
calpain 8 |
| chr1_+_199941161 | 18.29 |
ENSRNOT00000027616
|
Bag3
|
Bcl2-associated athanogene 3 |
| chr5_+_169181418 | 18.24 |
ENSRNOT00000004508
|
Klhl21
|
kelch-like family member 21 |
| chr20_+_25990304 | 18.19 |
ENSRNOT00000033980
|
Lrrtm3
|
leucine rich repeat transmembrane neuronal 3 |
| chr6_+_42092467 | 18.03 |
ENSRNOT00000060499
|
E2f6
|
E2F transcription factor 6 |
| chr17_-_84488480 | 17.80 |
ENSRNOT00000000158
ENSRNOT00000075983 |
Nebl
|
nebulette |
| chr13_-_88061108 | 17.63 |
ENSRNOT00000003774
|
Rgs4
|
regulator of G-protein signaling 4 |
| chr1_+_84293102 | 17.23 |
ENSRNOT00000028468
|
Sertad1
|
SERTA domain containing 1 |
| chr1_-_170318935 | 17.20 |
ENSRNOT00000024119
|
Prkcdbp
|
protein kinase C, delta binding protein |
| chr13_-_100928811 | 17.03 |
ENSRNOT00000045326
|
Capn2
|
calpain 2 |
| chr20_+_12658065 | 16.48 |
ENSRNOT00000072951
ENSRNOT00000001679 |
Col6a1
|
collagen type VI alpha 1 chain |
| chr10_-_71382058 | 16.37 |
ENSRNOT00000043148
|
Dusp14
|
dual specificity phosphatase 14 |
| chr8_+_65611570 | 15.62 |
ENSRNOT00000017147
|
Larp6
|
La ribonucleoprotein domain family, member 6 |
| chr12_+_48292273 | 15.62 |
ENSRNOT00000000874
|
Svop
|
SV2 related protein |
| chrX_-_15627235 | 15.59 |
ENSRNOT00000013369
|
Wdr45
|
WD repeat domain 45 |
| chr2_-_149417212 | 15.30 |
ENSRNOT00000018573
|
Gpr87
|
G protein-coupled receptor 87 |
| chr2_-_187863503 | 14.96 |
ENSRNOT00000093036
ENSRNOT00000026705 ENSRNOT00000082174 |
Lmna
|
lamin A/C |
| chr2_-_53811134 | 14.78 |
ENSRNOT00000020925
|
Fbxo4
|
F-box protein 4 |
| chr3_-_29984201 | 14.50 |
ENSRNOT00000006350
|
Zeb2
|
zinc finger E-box binding homeobox 2 |
| chr7_-_124041594 | 14.35 |
ENSRNOT00000064700
|
Cyb5r3
|
cytochrome b5 reductase 3 |
| chr1_-_89560469 | 14.27 |
ENSRNOT00000079091
|
Scn1b
|
sodium voltage-gated channel beta subunit 1 |
| chr3_-_10602672 | 14.26 |
ENSRNOT00000011648
|
Ncs1
|
neuronal calcium sensor 1 |
| chr2_-_26135340 | 14.18 |
ENSRNOT00000074626
|
F2r
|
coagulation factor II (thrombin) receptor |
| chr10_-_34333305 | 14.05 |
ENSRNOT00000071365
|
Olr1384
|
olfactory receptor gene Olr1384 |
| chr1_+_114258719 | 13.86 |
ENSRNOT00000088459
ENSRNOT00000016376 |
Cyfip1
|
cytoplasmic FMR1 interacting protein 1 |
| chr18_+_56364620 | 13.69 |
ENSRNOT00000068535
ENSRNOT00000086033 |
Pdgfrb
|
platelet derived growth factor receptor beta |
| chr14_-_10395047 | 13.63 |
ENSRNOT00000002936
|
Gpat3
|
glycerol-3-phosphate acyltransferase 3 |
| chr15_-_44860604 | 13.58 |
ENSRNOT00000018637
|
Nefm
|
neurofilament medium |
| chr4_+_44573264 | 13.47 |
ENSRNOT00000080271
|
Cav2
|
caveolin 2 |
| chr4_+_118655728 | 13.37 |
ENSRNOT00000043082
|
Aak1
|
AP2 associated kinase 1 |
| chr4_-_39102807 | 13.11 |
ENSRNOT00000052063
|
Thsd7a
|
thrombospondin type 1 domain containing 7A |
| chr7_-_93280009 | 13.08 |
ENSRNOT00000064877
|
Samd12
|
sterile alpha motif domain containing 12 |
| chrX_+_69730242 | 13.03 |
ENSRNOT00000075980
ENSRNOT00000076425 |
Eda
|
ectodysplasin-A |
| chr14_+_104250617 | 12.96 |
ENSRNOT00000079874
|
Spred2
|
sprouty-related, EVH1 domain containing 2 |
| chr7_-_11353713 | 12.92 |
ENSRNOT00000061132
|
Zfr2
|
zinc finger RNA binding protein 2 |
| chr20_-_25826658 | 12.73 |
ENSRNOT00000057950
ENSRNOT00000084660 |
Ctnna3
|
catenin alpha 3 |
| chr20_+_3556975 | 12.68 |
ENSRNOT00000089417
|
Ddr1
|
discoidin domain receptor tyrosine kinase 1 |
| chr3_-_149905944 | 12.68 |
ENSRNOT00000021715
|
Snta1
|
syntrophin, alpha 1 |
| chr8_-_49038169 | 12.55 |
ENSRNOT00000047303
|
Phldb1
|
pleckstrin homology-like domain, family B, member 1 |
| chr12_-_17519954 | 12.42 |
ENSRNOT00000089418
|
Sun1
|
Sad1 and UNC84 domain containing 1 |
| chr10_+_91187593 | 12.41 |
ENSRNOT00000004163
|
Acbd4
|
acyl-CoA binding domain containing 4 |
| chr4_-_98305173 | 12.30 |
ENSRNOT00000010151
|
Il23r
|
interleukin 23 receptor |
| chr5_+_120340646 | 12.15 |
ENSRNOT00000086259
ENSRNOT00000086539 |
Dnajc6
|
DnaJ heat shock protein family (Hsp40) member C6 |
| chr13_+_89480058 | 12.09 |
ENSRNOT00000050804
|
Cfap126
|
cilia and flagella associated protein 126 |
| chr2_+_22909569 | 12.09 |
ENSRNOT00000073871
|
Homer1
|
homer scaffolding protein 1 |
| chr2_-_186480278 | 12.08 |
ENSRNOT00000031743
|
Kirrel
|
kin of IRRE like (Drosophila) |
| chr2_-_28799266 | 12.05 |
ENSRNOT00000089293
|
Tmem171
|
transmembrane protein 171 |
| chr3_-_164055561 | 11.89 |
ENSRNOT00000064849
|
B4galt5
|
beta-1,4-galactosyltransferase 5 |
| chrX_+_43625169 | 11.87 |
ENSRNOT00000086311
|
Sat1
|
spermidine/spermine N1-acetyl transferase 1 |
| chrM_+_7919 | 11.86 |
ENSRNOT00000046108
|
Mt-atp6
|
mitochondrially encoded ATP synthase 6 |
| chr8_+_69971778 | 11.86 |
ENSRNOT00000058007
ENSRNOT00000037941 ENSRNOT00000050649 |
Megf11
|
multiple EGF-like-domains 11 |
| chr14_+_89314176 | 11.58 |
ENSRNOT00000006765
|
Upp1
|
uridine phosphorylase 1 |
| chr13_+_87986240 | 11.58 |
ENSRNOT00000003705
|
Rgs5
|
regulator of G-protein signaling 5 |
| chr2_-_187854363 | 11.35 |
ENSRNOT00000092993
|
Lmna
|
lamin A/C |
| chr18_+_15467870 | 11.11 |
ENSRNOT00000091696
|
B4galt6
|
beta-1,4-galactosyltransferase 6 |
| chr2_-_171196395 | 10.91 |
ENSRNOT00000013279
|
Bche
|
butyrylcholinesterase |
| chr10_+_104582955 | 10.66 |
ENSRNOT00000009733
|
Unk
|
unkempt family zinc finger |
| chr3_-_15433252 | 10.66 |
ENSRNOT00000008817
|
Lhx6
|
LIM homeobox 6 |
| chr9_-_27447877 | 10.49 |
ENSRNOT00000085195
|
Gsta1
|
glutathione S-transferase alpha 1 |
| chr8_-_128249538 | 10.43 |
ENSRNOT00000082892
|
Scn5a
|
sodium voltage-gated channel alpha subunit 5 |
| chr10_+_15672382 | 10.38 |
ENSRNOT00000027965
|
Rhbdf1
|
rhomboid 5 homolog 1 |
| chr1_+_25174456 | 10.16 |
ENSRNOT00000092830
|
Clvs2
|
clavesin 2 |
| chr17_+_10537365 | 10.12 |
ENSRNOT00000023651
|
Cltb
|
clathrin, light chain B |
| chr2_-_200003443 | 10.10 |
ENSRNOT00000024900
ENSRNOT00000088041 |
Pde4dip
|
phosphodiesterase 4D interacting protein |
| chr18_+_81821127 | 10.07 |
ENSRNOT00000058199
|
Fbxo15
|
F-box protein 15 |
| chr11_+_87435185 | 10.02 |
ENSRNOT00000002558
|
P2rx6
|
purinergic receptor P2X 6 |
| chr1_+_212359177 | 9.99 |
ENSRNOT00000046314
|
Zfp511
|
zinc finger protein 511 |
| chr4_-_145454834 | 9.97 |
ENSRNOT00000013154
ENSRNOT00000056493 |
Prrt3
|
proline-rich transmembrane protein 3 |
| chr4_+_33638709 | 9.93 |
ENSRNOT00000009888
ENSRNOT00000034719 ENSRNOT00000052333 |
Tac1
|
tachykinin, precursor 1 |
| chr2_+_187322416 | 9.77 |
ENSRNOT00000025183
|
Crabp2
|
cellular retinoic acid binding protein 2 |
| chr17_-_35037076 | 9.61 |
ENSRNOT00000090946
|
Dusp22
|
dual specificity phosphatase 22 |
| chrM_+_7758 | 9.57 |
ENSRNOT00000046201
|
Mt-atp8
|
mitochondrially encoded ATP synthase 8 |
| chr1_-_101514547 | 9.55 |
ENSRNOT00000079633
|
Ppp1r15a
|
protein phosphatase 1, regulatory subunit 15A |
| chr12_+_48598647 | 9.48 |
ENSRNOT00000000889
|
Tmem119
|
transmembrane protein 119 |
| chr7_-_72328128 | 9.48 |
ENSRNOT00000008227
|
Tspyl5
|
TSPY-like 5 |
| chr18_-_6782757 | 9.18 |
ENSRNOT00000068150
|
Aqp4
|
aquaporin 4 |
| chr9_-_37231291 | 9.17 |
ENSRNOT00000016237
|
Ptp4a1
|
protein tyrosine phosphatase type IVA, member 1 |
| chr14_+_34727915 | 9.17 |
ENSRNOT00000085089
|
Kdr
|
kinase insert domain receptor |
| chr1_+_220826560 | 9.12 |
ENSRNOT00000027891
|
Fosl1
|
FOS like 1, AP-1 transcription factor subunit |
| chr8_+_5676665 | 9.07 |
ENSRNOT00000012310
|
Mmp3
|
matrix metallopeptidase 3 |
| chr8_-_104593625 | 8.93 |
ENSRNOT00000016625
|
Zbtb38
|
zinc finger and BTB domain containing 38 |
| chr13_+_84474319 | 8.92 |
ENSRNOT00000031367
ENSRNOT00000072244 ENSRNOT00000072897 ENSRNOT00000064168 ENSRNOT00000074954 ENSRNOT00000073696 |
Ildr2
|
immunoglobulin-like domain containing receptor 2 |
| chr1_-_87191588 | 8.83 |
ENSRNOT00000027998
|
LOC100361913
|
rCG54286-like |
| chr4_+_168615890 | 8.75 |
ENSRNOT00000009324
|
Crebl2
|
cAMP responsive element binding protein-like 2 |
| chr11_+_46179940 | 8.62 |
ENSRNOT00000088152
|
Tfg
|
Trk-fused gene |
| chr7_+_70580198 | 8.54 |
ENSRNOT00000083472
ENSRNOT00000008941 |
Ddit3
|
DNA-damage inducible transcript 3 |
| chr14_+_34727623 | 8.50 |
ENSRNOT00000071405
ENSRNOT00000090183 |
Kdr
|
kinase insert domain receptor |
| chrX_+_65566047 | 8.41 |
ENSRNOT00000092103
|
Heph
|
hephaestin |
| chr2_-_197860699 | 8.32 |
ENSRNOT00000028740
|
Ecm1
|
extracellular matrix protein 1 |
| chr5_+_28395296 | 8.29 |
ENSRNOT00000009375
|
Tmem55a
|
transmembrane protein 55A |
| chr9_+_20951260 | 8.28 |
ENSRNOT00000016906
|
Adgrf4
|
adhesion G protein-coupled receptor F4 |
| chr10_+_35857797 | 8.23 |
ENSRNOT00000004517
|
Cby3
|
chibby family member 3 |
| chr8_+_65733400 | 8.23 |
ENSRNOT00000089126
|
Uaca
|
uveal autoantigen with coiled-coil domains and ankyrin repeats |
| chr17_+_9109731 | 8.16 |
ENSRNOT00000016009
|
Cxcl14
|
C-X-C motif chemokine ligand 14 |
| chr18_+_27923572 | 8.16 |
ENSRNOT00000008041
|
Ctnna1
|
catenin alpha 1 |
| chr8_+_119228612 | 8.14 |
ENSRNOT00000078439
ENSRNOT00000043737 |
Lrrc2
|
leucine rich repeat containing 2 |
| chr5_+_140870140 | 8.12 |
ENSRNOT00000074347
|
Hpcal4
|
hippocalcin-like 4 |
| chr18_-_27749235 | 8.04 |
ENSRNOT00000026696
|
Hspa9
|
heat shock protein family A member 9 |
| chr7_+_144647587 | 7.89 |
ENSRNOT00000022398
|
Hoxc4
|
homeo box C4 |
| chr9_+_82436458 | 7.85 |
ENSRNOT00000026467
ENSRNOT00000081958 |
Dnajb2
|
DnaJ heat shock protein family (Hsp40) member B2 |
| chr19_+_41968705 | 7.83 |
ENSRNOT00000020365
|
Ist1
|
IST1, ESCRT-III associated factor |
| chr14_+_23166633 | 7.66 |
ENSRNOT00000060109
|
Tmprss11g
|
transmembrane protease, serine 11G |
| chr13_-_95348913 | 7.58 |
ENSRNOT00000057879
|
Akt3
|
AKT serine/threonine kinase 3 |
| chr2_-_178297172 | 7.57 |
ENSRNOT00000038543
|
Fnip2
|
folliculin interacting protein 2 |
| chr6_+_64224861 | 7.46 |
ENSRNOT00000093159
ENSRNOT00000093664 |
Pnpla8
|
patatin-like phospholipase domain containing 8 |
| chr15_+_28295368 | 7.43 |
ENSRNOT00000013786
|
Slc39a2
|
solute carrier family 39 member 2 |
| chr2_+_211337271 | 7.34 |
ENSRNOT00000045155
|
Cox6b1
|
cytochrome c oxidase subunit 6B1 |
| chr1_+_238843338 | 7.33 |
ENSRNOT00000024583
|
Zfand5
|
zinc finger AN1-type containing 5 |
| chr3_-_29993715 | 7.28 |
ENSRNOT00000085801
|
Zeb2
|
zinc finger E-box binding homeobox 2 |
| chr7_+_121480723 | 7.24 |
ENSRNOT00000065304
|
Atf4
|
activating transcription factor 4 |
| chr5_+_143027977 | 7.18 |
ENSRNOT00000012702
|
Gnl2
|
G protein nucleolar 2 |
| chr5_+_156613741 | 7.12 |
ENSRNOT00000076031
|
Sh2d5
|
SH2 domain containing 5 |
| chr3_-_81911197 | 7.09 |
ENSRNOT00000066526
|
Prdm11
|
PR/SET domain 11 |
| chr6_+_135610743 | 7.04 |
ENSRNOT00000010906
|
Traf3
|
Tnf receptor-associated factor 3 |
| chr1_-_222734184 | 6.97 |
ENSRNOT00000049812
ENSRNOT00000028785 |
Rtn3
|
reticulon 3 |
| chr2_+_46980976 | 6.94 |
ENSRNOT00000083668
ENSRNOT00000082990 |
Mocs2
|
molybdenum cofactor synthesis 2 |
| chr4_-_166869399 | 6.93 |
ENSRNOT00000007521
|
Tas2r121
|
taste receptor, type 2, member 121 |
| chr19_+_41631715 | 6.92 |
ENSRNOT00000022749
|
Chst4
|
carbohydrate sulfotransferase 4 |
| chr9_+_27402381 | 6.88 |
ENSRNOT00000077372
|
Gsta3
|
glutathione S-transferase alpha 3 |
| chr6_+_92057807 | 6.84 |
ENSRNOT00000006509
|
Atp5s
|
ATP synthase, H+ transporting, mitochondrial Fo complex, subunit s (factor B) |
| chr17_-_10208360 | 6.78 |
ENSRNOT00000087397
|
Unc5a
|
unc-5 netrin receptor A |
| chr1_+_89215266 | 6.72 |
ENSRNOT00000093612
ENSRNOT00000084799 |
Dmkn
|
dermokine |
| chr2_-_113345577 | 6.72 |
ENSRNOT00000034096
|
Fndc3b
|
fibronectin type III domain containing 3B |
| chr6_+_136330383 | 6.66 |
ENSRNOT00000093106
ENSRNOT00000092774 ENSRNOT00000065281 ENSRNOT00000015935 |
Klc1
|
kinesin light chain 1 |
| chr8_-_39551700 | 6.63 |
ENSRNOT00000091894
ENSRNOT00000076025 |
Pknox2
|
PBX/knotted 1 homeobox 2 |
| chr2_+_203200427 | 6.60 |
ENSRNOT00000020566
|
Vtcn1
|
V-set domain containing T cell activation inhibitor 1 |
| chr11_+_68198709 | 6.53 |
ENSRNOT00000003048
|
Dirc2
|
disrupted in renal carcinoma 2 |
| chr6_-_71199110 | 6.52 |
ENSRNOT00000081883
|
Prkd1
|
protein kinase D1 |
| chr4_+_97657671 | 6.51 |
ENSRNOT00000075400
|
Gng12
|
G protein subunit gamma 12 |
| chrX_+_18489597 | 6.51 |
ENSRNOT00000059744
|
LOC681355
|
similar to potassium channel tetramerisation domain containing 12b |
| chrX_-_15587419 | 6.46 |
ENSRNOT00000012829
|
Tfe3
|
transcription factor binding to IGHM enhancer 3 |
| chr14_-_22009300 | 6.45 |
ENSRNOT00000088491
ENSRNOT00000087923 |
Csn1s1
|
casein alpha s1 |
| chr9_+_62291405 | 6.39 |
ENSRNOT00000051463
|
Plcl1
|
phospholipase C-like 1 |
| chrX_+_111798233 | 6.36 |
ENSRNOT00000078582
|
Prps1
|
phosphoribosyl pyrophosphate synthetase 1 |
| chr3_+_48082935 | 6.35 |
ENSRNOT00000087711
ENSRNOT00000067545 |
Slc4a10
|
solute carrier family 4 member 10 |
| chr1_+_218466289 | 6.33 |
ENSRNOT00000017948
|
Mrgprf
|
MAS related GPR family member F |
| chr3_+_2648885 | 6.24 |
ENSRNOT00000020339
|
Abca2
|
ATP binding cassette subfamily A member 2 |
| chr5_-_141242131 | 6.09 |
ENSRNOT00000081482
|
Macf1
|
microtubule-actin crosslinking factor 1 |
| chr16_-_14382641 | 5.99 |
ENSRNOT00000018723
|
Ghitm
|
growth hormone inducible transmembrane protein |
| chr1_-_169040725 | 5.97 |
ENSRNOT00000046616
|
Olr130
|
olfactory receptor 130 |
| chr3_-_71893600 | 5.97 |
ENSRNOT00000006787
ENSRNOT00000057685 |
Tfpi
|
tissue factor pathway inhibitor |
| chr2_-_33025271 | 5.84 |
ENSRNOT00000074941
|
NEWGENE_1310139
|
microtubule associated serine/threonine kinase family member 4 |
| chr3_-_92242318 | 5.81 |
ENSRNOT00000007018
|
Trim44
|
tripartite motif-containing 44 |
| chr11_-_84047497 | 5.73 |
ENSRNOT00000088821
ENSRNOT00000058092 |
Ap2m1
|
adaptor-related protein complex 2, mu 1 subunit |
Network of associatons between targets according to the STRING database.

First level regulatory network of Fosl2_Bach2
Gene Ontology Analysis
Gene overrepresentation in biological process category:
| Log-likelihood per target | Total log-likelihood | Term | Description |
|---|---|---|---|
| 16.2 | 64.7 | GO:0038128 | ERBB2 signaling pathway(GO:0038128) |
| 12.3 | 61.5 | GO:0036233 | glycine import(GO:0036233) |
| 9.6 | 28.7 | GO:0021812 | neuronal-glial interaction involved in cerebral cortex radial glia guided migration(GO:0021812) |
| 9.0 | 27.1 | GO:1904178 | sterol regulatory element binding protein import into nucleus(GO:0035105) negative regulation of adipose tissue development(GO:1904178) |
| 8.8 | 79.6 | GO:2001135 | regulation of endocytic recycling(GO:2001135) |
| 8.7 | 60.7 | GO:0045196 | establishment or maintenance of neuroblast polarity(GO:0045196) establishment of neuroblast polarity(GO:0045200) |
| 8.3 | 25.0 | GO:0002541 | activation of plasma proteins involved in acute inflammatory response(GO:0002541) |
| 8.3 | 24.8 | GO:0002462 | tolerance induction to nonself antigen(GO:0002462) |
| 7.6 | 30.3 | GO:1901911 | diadenosine polyphosphate catabolic process(GO:0015961) diphosphoinositol polyphosphate metabolic process(GO:0071543) diadenosine pentaphosphate metabolic process(GO:1901906) diadenosine pentaphosphate catabolic process(GO:1901907) diadenosine hexaphosphate metabolic process(GO:1901908) diadenosine hexaphosphate catabolic process(GO:1901909) adenosine 5'-(hexahydrogen pentaphosphate) metabolic process(GO:1901910) adenosine 5'-(hexahydrogen pentaphosphate) catabolic process(GO:1901911) |
| 7.3 | 21.8 | GO:1902748 | positive regulation of lens fiber cell differentiation(GO:1902748) |
| 7.1 | 35.3 | GO:0031508 | pericentric heterochromatin assembly(GO:0031508) regulation of chromosome condensation(GO:0060623) |
| 7.0 | 21.0 | GO:0003330 | regulation of extracellular matrix constituent secretion(GO:0003330) positive regulation of extracellular matrix constituent secretion(GO:0003331) |
| 6.8 | 13.6 | GO:0033693 | neurofilament bundle assembly(GO:0033693) |
| 6.5 | 58.6 | GO:0061718 | NADH regeneration(GO:0006735) canonical glycolysis(GO:0061621) glucose catabolic process to pyruvate(GO:0061718) |
| 6.1 | 30.4 | GO:0014722 | regulation of skeletal muscle contraction by calcium ion signaling(GO:0014722) |
| 6.1 | 72.8 | GO:0030388 | fructose 1,6-bisphosphate metabolic process(GO:0030388) |
| 5.9 | 23.7 | GO:0098886 | modification of dendritic spine(GO:0098886) |
| 5.9 | 17.8 | GO:0071691 | cardiac muscle thin filament assembly(GO:0071691) |
| 5.8 | 23.0 | GO:0030240 | skeletal muscle thin filament assembly(GO:0030240) |
| 5.5 | 22.1 | GO:2001206 | positive regulation of osteoclast development(GO:2001206) |
| 5.2 | 25.8 | GO:0001552 | ovarian follicle atresia(GO:0001552) |
| 5.1 | 15.4 | GO:0030473 | nucleokinesis involved in cell motility in cerebral cortex radial glia guided migration(GO:0021817) nuclear migration along microtubule(GO:0030473) nuclear matrix anchoring at nuclear membrane(GO:0090292) |
| 4.9 | 19.7 | GO:0051684 | maintenance of Golgi location(GO:0051684) |
| 4.8 | 28.6 | GO:1900272 | negative regulation of calcineurin-NFAT signaling cascade(GO:0070885) negative regulation of long-term synaptic potentiation(GO:1900272) negative regulation of dendritic spine maintenance(GO:1902951) |
| 4.7 | 9.5 | GO:1903012 | positive regulation of bone development(GO:1903012) |
| 4.7 | 14.2 | GO:0099553 | trans-synaptic signaling by lipid, modulating synaptic transmission(GO:0099552) trans-synaptic signaling by endocannabinoid, modulating synaptic transmission(GO:0099553) |
| 4.7 | 23.4 | GO:0051122 | hepoxilin metabolic process(GO:0051121) hepoxilin biosynthetic process(GO:0051122) |
| 4.7 | 32.6 | GO:0007168 | receptor guanylyl cyclase signaling pathway(GO:0007168) |
| 4.6 | 13.9 | GO:1903422 | negative regulation of synaptic vesicle recycling(GO:1903422) |
| 4.6 | 13.7 | GO:0038091 | VEGF-activated platelet-derived growth factor receptor signaling pathway(GO:0038086) positive regulation of cell proliferation by VEGF-activated platelet derived growth factor receptor signaling pathway(GO:0038091) |
| 4.5 | 13.5 | GO:0019065 | receptor-mediated endocytosis of virus by host cell(GO:0019065) endocytosis involved in viral entry into host cell(GO:0075509) |
| 4.3 | 13.0 | GO:0061152 | trachea submucosa development(GO:0061152) trachea gland development(GO:0061153) |
| 4.1 | 24.7 | GO:0086047 | membrane depolarization during Purkinje myocyte cell action potential(GO:0086047) |
| 3.6 | 10.9 | GO:0014016 | neuroblast differentiation(GO:0014016) |
| 3.6 | 7.2 | GO:1990737 | response to manganese-induced endoplasmic reticulum stress(GO:1990737) |
| 3.5 | 27.9 | GO:0070842 | aggresome assembly(GO:0070842) |
| 3.5 | 41.8 | GO:1902993 | positive regulation of beta-amyloid formation(GO:1902004) positive regulation of amyloid precursor protein catabolic process(GO:1902993) |
| 3.5 | 24.2 | GO:0038033 | positive regulation of endothelial cell chemotaxis by VEGF-activated vascular endothelial growth factor receptor signaling pathway(GO:0038033) |
| 3.2 | 9.5 | GO:0072703 | regulation of endoplasmic reticulum stress-induced eIF2 alpha phosphorylation(GO:0060734) response to methyl methanesulfonate(GO:0072702) cellular response to methyl methanesulfonate(GO:0072703) response to environmental enrichment(GO:0090648) positive regulation of peptidyl-serine dephosphorylation(GO:1902310) |
| 3.0 | 33.0 | GO:0031914 | negative regulation of synaptic plasticity(GO:0031914) |
| 3.0 | 11.9 | GO:0032919 | spermine acetylation(GO:0032919) |
| 2.9 | 11.5 | GO:0072318 | clathrin coat disassembly(GO:0072318) |
| 2.8 | 22.2 | GO:0042760 | very long-chain fatty acid catabolic process(GO:0042760) |
| 2.7 | 8.2 | GO:2001045 | negative regulation of integrin-mediated signaling pathway(GO:2001045) |
| 2.7 | 21.6 | GO:0035509 | negative regulation of myosin-light-chain-phosphatase activity(GO:0035509) |
| 2.7 | 8.0 | GO:1902037 | negative regulation of hematopoietic stem cell differentiation(GO:1902037) |
| 2.6 | 15.8 | GO:0016185 | synaptic vesicle budding from presynaptic endocytic zone membrane(GO:0016185) |
| 2.6 | 7.9 | GO:1990790 | response to glial cell derived neurotrophic factor(GO:1990790) cellular response to glial cell derived neurotrophic factor(GO:1990792) |
| 2.6 | 7.7 | GO:1903336 | negative regulation of vacuolar transport(GO:1903336) |
| 2.5 | 34.4 | GO:0007614 | short-term memory(GO:0007614) |
| 2.3 | 9.2 | GO:0060354 | negative regulation of cell adhesion molecule production(GO:0060354) |
| 2.3 | 6.9 | GO:0046223 | toxin catabolic process(GO:0009407) mycotoxin catabolic process(GO:0043387) aflatoxin catabolic process(GO:0046223) secondary metabolite catabolic process(GO:0090487) organic heteropentacyclic compound catabolic process(GO:1901377) |
| 2.3 | 9.1 | GO:0007296 | vitellogenesis(GO:0007296) |
| 2.1 | 6.4 | GO:0034418 | urate biosynthetic process(GO:0034418) |
| 2.1 | 17.0 | GO:0035726 | common myeloid progenitor cell proliferation(GO:0035726) |
| 2.1 | 21.2 | GO:0032463 | negative regulation of protein homooligomerization(GO:0032463) |
| 2.1 | 6.2 | GO:0032380 | regulation of intracellular lipid transport(GO:0032377) regulation of intracellular sterol transport(GO:0032380) regulation of intracellular cholesterol transport(GO:0032383) |
| 2.0 | 62.1 | GO:0030866 | cortical actin cytoskeleton organization(GO:0030866) |
| 2.0 | 9.9 | GO:2000851 | positive regulation of saliva secretion(GO:0046878) positive regulation of glucocorticoid secretion(GO:2000851) |
| 2.0 | 3.9 | GO:1900186 | negative regulation of clathrin-mediated endocytosis(GO:1900186) |
| 2.0 | 19.5 | GO:1902031 | regulation of NADP metabolic process(GO:1902031) |
| 1.9 | 11.6 | GO:0010138 | pyrimidine ribonucleotide salvage(GO:0010138) pyrimidine nucleotide salvage(GO:0032262) UMP salvage(GO:0044206) |
| 1.9 | 35.8 | GO:0090557 | establishment of endothelial intestinal barrier(GO:0090557) |
| 1.9 | 7.5 | GO:0046338 | phosphatidylethanolamine catabolic process(GO:0046338) |
| 1.8 | 12.7 | GO:1902083 | negative regulation of peptidyl-cysteine S-nitrosylation(GO:1902083) |
| 1.7 | 6.9 | GO:0042339 | keratan sulfate metabolic process(GO:0042339) |
| 1.7 | 8.5 | GO:0071500 | cellular response to nitrosative stress(GO:0071500) |
| 1.6 | 12.7 | GO:0086073 | bundle of His cell-Purkinje myocyte adhesion involved in cell communication(GO:0086073) |
| 1.6 | 4.7 | GO:0061741 | vacuolar transmembrane transport(GO:0034486) chaperone-mediated protein transport involved in chaperone-mediated autophagy(GO:0061741) negative regulation of complement-dependent cytotoxicity(GO:1903660) |
| 1.5 | 13.6 | GO:0016024 | CDP-diacylglycerol biosynthetic process(GO:0016024) |
| 1.4 | 20.1 | GO:0055015 | ventricular cardiac muscle cell development(GO:0055015) |
| 1.4 | 2.9 | GO:0051695 | actin filament uncapping(GO:0051695) |
| 1.4 | 41.4 | GO:0035025 | positive regulation of Rho protein signal transduction(GO:0035025) |
| 1.4 | 15.7 | GO:0061302 | smooth muscle cell-matrix adhesion(GO:0061302) |
| 1.4 | 5.7 | GO:0051692 | cellular oligosaccharide catabolic process(GO:0051692) |
| 1.4 | 40.9 | GO:0071625 | vocalization behavior(GO:0071625) |
| 1.4 | 15.3 | GO:0035589 | G-protein coupled purinergic nucleotide receptor signaling pathway(GO:0035589) |
| 1.4 | 4.1 | GO:1901526 | positive regulation of macromitophagy(GO:1901526) positive regulation of mitophagy in response to mitochondrial depolarization(GO:1904925) |
| 1.4 | 8.2 | GO:2000503 | positive regulation of natural killer cell chemotaxis(GO:2000503) |
| 1.4 | 44.9 | GO:0045746 | negative regulation of Notch signaling pathway(GO:0045746) |
| 1.3 | 6.7 | GO:0035617 | stress granule disassembly(GO:0035617) |
| 1.3 | 4.0 | GO:0006421 | asparaginyl-tRNA aminoacylation(GO:0006421) |
| 1.3 | 10.5 | GO:0043651 | linoleic acid metabolic process(GO:0043651) |
| 1.3 | 2.6 | GO:0043988 | histone H3-S28 phosphorylation(GO:0043988) |
| 1.3 | 3.9 | GO:0045541 | negative regulation of cholesterol biosynthetic process(GO:0045541) negative regulation of cholesterol metabolic process(GO:0090206) |
| 1.3 | 45.9 | GO:0010664 | negative regulation of striated muscle cell apoptotic process(GO:0010664) |
| 1.3 | 3.8 | GO:0071431 | tRNA export from nucleus(GO:0006409) tRNA-containing ribonucleoprotein complex export from nucleus(GO:0071431) |
| 1.2 | 65.4 | GO:0030239 | myofibril assembly(GO:0030239) |
| 1.2 | 17.0 | GO:0016540 | protein autoprocessing(GO:0016540) |
| 1.2 | 3.6 | GO:0061732 | mitochondrial acetyl-CoA biosynthetic process from pyruvate(GO:0061732) |
| 1.2 | 10.7 | GO:1904936 | cerebral cortex GABAergic interneuron migration(GO:0021853) interneuron migration(GO:1904936) |
| 1.1 | 6.8 | GO:0033564 | anterior/posterior axon guidance(GO:0033564) |
| 1.1 | 29.3 | GO:0000188 | inactivation of MAPK activity(GO:0000188) |
| 1.1 | 7.8 | GO:0009838 | abscission(GO:0009838) |
| 1.1 | 3.4 | GO:1903553 | positive regulation of extracellular exosome assembly(GO:1903553) |
| 1.1 | 19.6 | GO:0048875 | chemical homeostasis within a tissue(GO:0048875) |
| 1.1 | 4.3 | GO:1905150 | regulation of voltage-gated sodium channel activity(GO:1905150) |
| 1.1 | 10.7 | GO:2000766 | negative regulation of cytoplasmic translation(GO:2000766) |
| 1.0 | 9.1 | GO:0010727 | negative regulation of hydrogen peroxide metabolic process(GO:0010727) |
| 1.0 | 14.1 | GO:0002138 | retinoic acid biosynthetic process(GO:0002138) diterpenoid biosynthetic process(GO:0016102) |
| 1.0 | 5.0 | GO:0009115 | xanthine catabolic process(GO:0009115) |
| 1.0 | 4.0 | GO:0090370 | negative regulation of cholesterol efflux(GO:0090370) |
| 1.0 | 7.0 | GO:0071787 | endoplasmic reticulum tubular network assembly(GO:0071787) |
| 1.0 | 7.8 | GO:0090086 | negative regulation of protein deubiquitination(GO:0090086) |
| 1.0 | 12.5 | GO:2001197 | regulation of basement membrane assembly involved in embryonic body morphogenesis(GO:1904259) positive regulation of basement membrane assembly involved in embryonic body morphogenesis(GO:1904261) basement membrane assembly involved in embryonic body morphogenesis(GO:2001197) |
| 0.9 | 6.6 | GO:0072602 | interleukin-4 secretion(GO:0072602) |
| 0.9 | 30.6 | GO:0021952 | central nervous system projection neuron axonogenesis(GO:0021952) |
| 0.9 | 1.8 | GO:0018171 | peptidyl-cysteine oxidation(GO:0018171) |
| 0.9 | 7.0 | GO:0008063 | Toll signaling pathway(GO:0008063) |
| 0.8 | 6.7 | GO:0060510 | Type II pneumocyte differentiation(GO:0060510) |
| 0.8 | 30.7 | GO:0030224 | monocyte differentiation(GO:0030224) |
| 0.8 | 3.8 | GO:0019563 | glycerol catabolic process(GO:0019563) |
| 0.8 | 6.1 | GO:0006620 | posttranslational protein targeting to membrane(GO:0006620) |
| 0.7 | 16.5 | GO:0070208 | protein heterotrimerization(GO:0070208) |
| 0.7 | 11.1 | GO:0006688 | glycosphingolipid biosynthetic process(GO:0006688) |
| 0.7 | 21.4 | GO:0015985 | energy coupled proton transport, down electrochemical gradient(GO:0015985) ATP synthesis coupled proton transport(GO:0015986) |
| 0.7 | 5.0 | GO:0045162 | clustering of voltage-gated sodium channels(GO:0045162) |
| 0.7 | 8.4 | GO:0035590 | purinergic nucleotide receptor signaling pathway(GO:0035590) |
| 0.7 | 29.2 | GO:0045744 | negative regulation of G-protein coupled receptor protein signaling pathway(GO:0045744) |
| 0.7 | 5.4 | GO:1901524 | regulation of macromitophagy(GO:1901524) negative regulation of macromitophagy(GO:1901525) |
| 0.7 | 2.7 | GO:0003199 | endocardial cushion to mesenchymal transition involved in heart valve formation(GO:0003199) |
| 0.7 | 17.0 | GO:0010842 | retina layer formation(GO:0010842) |
| 0.6 | 9.6 | GO:0002710 | negative regulation of T cell mediated immunity(GO:0002710) |
| 0.6 | 0.6 | GO:0038089 | positive regulation of cell migration by vascular endothelial growth factor signaling pathway(GO:0038089) |
| 0.6 | 6.9 | GO:0006777 | Mo-molybdopterin cofactor biosynthetic process(GO:0006777) Mo-molybdopterin cofactor metabolic process(GO:0019720) |
| 0.6 | 4.4 | GO:0044828 | negative regulation by host of viral genome replication(GO:0044828) |
| 0.6 | 13.4 | GO:2000369 | regulation of clathrin-mediated endocytosis(GO:2000369) |
| 0.6 | 2.3 | GO:0090625 | siRNA loading onto RISC involved in RNA interference(GO:0035087) mRNA cleavage involved in gene silencing by siRNA(GO:0090625) |
| 0.6 | 17.7 | GO:0034629 | cellular protein complex localization(GO:0034629) |
| 0.5 | 5.8 | GO:0032060 | bleb assembly(GO:0032060) |
| 0.5 | 8.3 | GO:0002827 | positive regulation of T-helper 1 type immune response(GO:0002827) |
| 0.5 | 3.6 | GO:0051388 | positive regulation of neurotrophin TRK receptor signaling pathway(GO:0051388) |
| 0.5 | 2.4 | GO:0009181 | purine nucleoside diphosphate catabolic process(GO:0009137) purine ribonucleoside diphosphate catabolic process(GO:0009181) |
| 0.5 | 1.4 | GO:2000661 | positive regulation of interleukin-1-mediated signaling pathway(GO:2000661) |
| 0.5 | 3.2 | GO:0010529 | regulation of transposition(GO:0010528) negative regulation of transposition(GO:0010529) spongiotrophoblast cell proliferation(GO:0060720) cell proliferation involved in embryonic placenta development(GO:0060722) |
| 0.4 | 7.6 | GO:0045793 | positive regulation of cell size(GO:0045793) |
| 0.4 | 3.4 | GO:0070886 | positive regulation of calcineurin-NFAT signaling cascade(GO:0070886) |
| 0.4 | 6.3 | GO:0021860 | pyramidal neuron development(GO:0021860) |
| 0.4 | 8.4 | GO:0006825 | copper ion transport(GO:0006825) |
| 0.4 | 4.3 | GO:0034374 | low-density lipoprotein particle remodeling(GO:0034374) |
| 0.4 | 1.9 | GO:0061635 | regulation of protein complex stability(GO:0061635) |
| 0.4 | 7.3 | GO:0048745 | smooth muscle tissue development(GO:0048745) |
| 0.4 | 2.6 | GO:0097210 | response to gonadotropin-releasing hormone(GO:0097210) cellular response to gonadotropin-releasing hormone(GO:0097211) |
| 0.4 | 35.2 | GO:0035249 | synaptic transmission, glutamatergic(GO:0035249) |
| 0.4 | 4.4 | GO:2000811 | negative regulation of anoikis(GO:2000811) |
| 0.4 | 14.3 | GO:0006695 | cholesterol biosynthetic process(GO:0006695) |
| 0.3 | 5.2 | GO:0036092 | phosphatidylinositol-3-phosphate biosynthetic process(GO:0036092) |
| 0.3 | 3.4 | GO:0071850 | mitotic cell cycle arrest(GO:0071850) |
| 0.3 | 1.6 | GO:0000066 | mitochondrial ornithine transport(GO:0000066) |
| 0.3 | 0.3 | GO:0003273 | cell migration involved in endocardial cushion formation(GO:0003273) |
| 0.3 | 6.4 | GO:0032228 | regulation of synaptic transmission, GABAergic(GO:0032228) |
| 0.3 | 9.5 | GO:0071480 | cellular response to gamma radiation(GO:0071480) |
| 0.3 | 8.3 | GO:0046856 | phosphatidylinositol dephosphorylation(GO:0046856) |
| 0.3 | 2.9 | GO:0061469 | regulation of type B pancreatic cell proliferation(GO:0061469) |
| 0.3 | 1.6 | GO:0051694 | pointed-end actin filament capping(GO:0051694) |
| 0.3 | 2.3 | GO:0007406 | negative regulation of neuroblast proliferation(GO:0007406) |
| 0.3 | 12.1 | GO:0007588 | excretion(GO:0007588) |
| 0.2 | 6.9 | GO:0001580 | detection of chemical stimulus involved in sensory perception of bitter taste(GO:0001580) |
| 0.2 | 42.4 | GO:0007519 | skeletal muscle tissue development(GO:0007519) |
| 0.2 | 5.4 | GO:0015991 | ATP hydrolysis coupled proton transport(GO:0015991) |
| 0.2 | 2.3 | GO:0071985 | multivesicular body sorting pathway(GO:0071985) |
| 0.2 | 2.4 | GO:0050872 | white fat cell differentiation(GO:0050872) |
| 0.2 | 18.8 | GO:0035335 | peptidyl-tyrosine dephosphorylation(GO:0035335) |
| 0.2 | 1.7 | GO:0060717 | chorion development(GO:0060717) |
| 0.2 | 10.1 | GO:0045600 | positive regulation of fat cell differentiation(GO:0045600) |
| 0.2 | 1.5 | GO:0006703 | estrogen biosynthetic process(GO:0006703) |
| 0.2 | 3.1 | GO:0043248 | proteasome assembly(GO:0043248) |
| 0.2 | 2.5 | GO:0001542 | ovulation from ovarian follicle(GO:0001542) |
| 0.2 | 10.2 | GO:0007040 | lysosome organization(GO:0007040) lytic vacuole organization(GO:0080171) |
| 0.2 | 2.3 | GO:0032825 | positive regulation of natural killer cell differentiation(GO:0032825) |
| 0.2 | 7.3 | GO:0021762 | substantia nigra development(GO:0021762) |
| 0.2 | 6.5 | GO:0045670 | regulation of osteoclast differentiation(GO:0045670) |
| 0.2 | 4.7 | GO:0071353 | cellular response to interleukin-4(GO:0071353) |
| 0.2 | 8.3 | GO:0001938 | positive regulation of endothelial cell proliferation(GO:0001938) |
| 0.2 | 11.3 | GO:0045921 | positive regulation of exocytosis(GO:0045921) |
| 0.1 | 4.0 | GO:0071577 | zinc II ion transmembrane transport(GO:0071577) |
| 0.1 | 1.0 | GO:0034454 | microtubule anchoring at centrosome(GO:0034454) |
| 0.1 | 3.8 | GO:0033344 | cholesterol efflux(GO:0033344) |
| 0.1 | 15.3 | GO:0030308 | negative regulation of cell growth(GO:0030308) |
| 0.1 | 0.5 | GO:1902036 | regulation of hematopoietic stem cell differentiation(GO:1902036) |
| 0.1 | 6.5 | GO:0008277 | regulation of G-protein coupled receptor protein signaling pathway(GO:0008277) |
| 0.1 | 4.7 | GO:0000266 | mitochondrial fission(GO:0000266) |
| 0.1 | 0.2 | GO:0038163 | thrombopoietin-mediated signaling pathway(GO:0038163) |
| 0.1 | 39.5 | GO:0030900 | forebrain development(GO:0030900) |
| 0.1 | 11.8 | GO:0007586 | digestion(GO:0007586) |
| 0.1 | 4.3 | GO:0001578 | microtubule bundle formation(GO:0001578) |
| 0.1 | 3.4 | GO:0045598 | regulation of fat cell differentiation(GO:0045598) |
| 0.1 | 3.2 | GO:0008631 | intrinsic apoptotic signaling pathway in response to oxidative stress(GO:0008631) |
| 0.1 | 1.0 | GO:0015747 | urate transport(GO:0015747) |
| 0.1 | 44.0 | GO:0043547 | positive regulation of GTPase activity(GO:0043547) |
| 0.1 | 2.5 | GO:0010107 | potassium ion import(GO:0010107) |
| 0.1 | 0.3 | GO:0007221 | positive regulation of transcription of Notch receptor target(GO:0007221) |
| 0.1 | 12.1 | GO:0044782 | cilium organization(GO:0044782) |
| 0.1 | 11.7 | GO:0009749 | response to glucose(GO:0009749) |
| 0.1 | 6.8 | GO:0015992 | proton transport(GO:0015992) |
| 0.1 | 3.3 | GO:0051965 | positive regulation of synapse assembly(GO:0051965) |
| 0.1 | 1.4 | GO:0006301 | postreplication repair(GO:0006301) |
| 0.1 | 0.3 | GO:0060394 | negative regulation of pathway-restricted SMAD protein phosphorylation(GO:0060394) |
| 0.1 | 0.2 | GO:1903575 | cornified envelope assembly(GO:1903575) |
| 0.0 | 0.3 | GO:0061450 | nail development(GO:0035878) trophoblast cell migration(GO:0061450) |
| 0.0 | 1.7 | GO:0051438 | regulation of ubiquitin-protein transferase activity(GO:0051438) |
| 0.0 | 0.9 | GO:0000301 | retrograde transport, vesicle recycling within Golgi(GO:0000301) |
| 0.0 | 49.4 | GO:0007608 | sensory perception of smell(GO:0007608) |
| 0.0 | 0.3 | GO:0061298 | retina vasculature development in camera-type eye(GO:0061298) |
| 0.0 | 2.0 | GO:0030433 | ER-associated ubiquitin-dependent protein catabolic process(GO:0030433) |
| 0.0 | 0.2 | GO:0043162 | ubiquitin-dependent protein catabolic process via the multivesicular body sorting pathway(GO:0043162) |
| 0.0 | 2.9 | GO:0007606 | sensory perception of chemical stimulus(GO:0007606) |
| 0.0 | 3.1 | GO:0071804 | cellular potassium ion transport(GO:0071804) potassium ion transmembrane transport(GO:0071805) |
| 0.0 | 2.2 | GO:0007018 | microtubule-based movement(GO:0007018) |
| 0.0 | 0.4 | GO:0030204 | chondroitin sulfate metabolic process(GO:0030204) |
| 0.0 | 0.2 | GO:1990126 | retrograde transport, endosome to plasma membrane(GO:1990126) |
Gene overrepresentation in cellular component category:
| Log-likelihood per target | Total log-likelihood | Term | Description |
|---|---|---|---|
| 9.8 | 58.6 | GO:0000015 | phosphopyruvate hydratase complex(GO:0000015) |
| 8.8 | 35.4 | GO:0097513 | myosin II filament(GO:0097513) |
| 7.9 | 39.6 | GO:0005927 | muscle tendon junction(GO:0005927) |
| 7.2 | 28.7 | GO:0043259 | laminin-1 complex(GO:0005606) laminin-10 complex(GO:0043259) |
| 4.4 | 35.3 | GO:0001740 | Barr body(GO:0001740) |
| 4.3 | 72.8 | GO:0035686 | sperm fibrous sheath(GO:0035686) |
| 3.4 | 27.1 | GO:0005638 | lamin filament(GO:0005638) |
| 3.3 | 33.4 | GO:0036057 | filtration diaphragm(GO:0036056) slit diaphragm(GO:0036057) |
| 2.8 | 8.5 | GO:1990622 | CHOP-C/EBP complex(GO:0036488) CHOP-ATF3 complex(GO:1990622) |
| 2.6 | 18.2 | GO:0005827 | polar microtubule(GO:0005827) |
| 2.4 | 7.2 | GO:1990037 | Lewy body core(GO:1990037) ATF4-CREB1 transcription factor complex(GO:1990589) ATF1-ATF4 transcription factor complex(GO:1990590) |
| 2.4 | 21.2 | GO:0097512 | cardiac myofibril(GO:0097512) |
| 2.2 | 17.7 | GO:0097443 | sorting endosome(GO:0097443) |
| 2.0 | 14.2 | GO:0031094 | platelet dense tubular network(GO:0031094) |
| 1.9 | 28.3 | GO:0045263 | proton-transporting ATP synthase complex, coupling factor F(o)(GO:0045263) |
| 1.7 | 21.9 | GO:0031143 | pseudopodium(GO:0031143) |
| 1.6 | 8.2 | GO:0043293 | apoptosome(GO:0043293) |
| 1.5 | 13.9 | GO:0031209 | SCAR complex(GO:0031209) |
| 1.5 | 16.7 | GO:0097418 | neurofibrillary tangle(GO:0097418) |
| 1.3 | 25.5 | GO:0005639 | integral component of nuclear inner membrane(GO:0005639) intrinsic component of nuclear inner membrane(GO:0031229) |
| 1.3 | 13.4 | GO:0071439 | clathrin complex(GO:0071439) |
| 1.3 | 24.7 | GO:0001518 | voltage-gated sodium channel complex(GO:0001518) |
| 1.3 | 3.8 | GO:0098837 | postsynaptic recycling endosome(GO:0098837) |
| 1.3 | 6.4 | GO:0002189 | ribose phosphate diphosphokinase complex(GO:0002189) |
| 1.2 | 156.7 | GO:0031674 | I band(GO:0031674) |
| 1.1 | 18.2 | GO:0031045 | dense core granule(GO:0031045) |
| 1.1 | 7.8 | GO:0090543 | Flemming body(GO:0090543) |
| 1.1 | 10.9 | GO:0005641 | nuclear envelope lumen(GO:0005641) |
| 1.1 | 30.4 | GO:0031307 | integral component of mitochondrial outer membrane(GO:0031307) |
| 1.1 | 6.3 | GO:0097441 | basilar dendrite(GO:0097441) |
| 1.0 | 22.1 | GO:0097228 | sperm principal piece(GO:0097228) |
| 0.9 | 84.0 | GO:0044291 | cell-cell contact zone(GO:0044291) |
| 0.9 | 4.7 | GO:0034751 | aryl hydrocarbon receptor complex(GO:0034751) |
| 0.9 | 13.0 | GO:0043202 | lysosomal lumen(GO:0043202) |
| 0.8 | 13.2 | GO:0030132 | clathrin coat of coated pit(GO:0030132) |
| 0.8 | 36.9 | GO:0005905 | clathrin-coated pit(GO:0005905) |
| 0.8 | 12.5 | GO:0045180 | basal cortex(GO:0045180) |
| 0.8 | 3.8 | GO:0009331 | glycerol-3-phosphate dehydrogenase complex(GO:0009331) |
| 0.7 | 9.5 | GO:0000164 | protein phosphatase type 1 complex(GO:0000164) |
| 0.7 | 15.6 | GO:0019013 | viral nucleocapsid(GO:0019013) |
| 0.7 | 13.0 | GO:0070971 | endoplasmic reticulum exit site(GO:0070971) |
| 0.6 | 29.8 | GO:0046658 | anchored component of plasma membrane(GO:0046658) |
| 0.6 | 7.0 | GO:0035631 | CD40 receptor complex(GO:0035631) |
| 0.6 | 13.5 | GO:0002080 | acrosomal membrane(GO:0002080) |
| 0.6 | 30.2 | GO:0042645 | nucleoid(GO:0009295) mitochondrial nucleoid(GO:0042645) |
| 0.6 | 18.0 | GO:0044665 | MLL1/2 complex(GO:0044665) MLL1 complex(GO:0071339) |
| 0.5 | 6.7 | GO:0035253 | ciliary rootlet(GO:0035253) |
| 0.5 | 161.1 | GO:0014069 | postsynaptic density(GO:0014069) |
| 0.5 | 54.7 | GO:0045211 | postsynaptic membrane(GO:0045211) |
| 0.5 | 5.4 | GO:0033180 | proton-transporting V-type ATPase, V1 domain(GO:0033180) |
| 0.4 | 8.8 | GO:0043034 | costamere(GO:0043034) |
| 0.4 | 9.2 | GO:0005838 | proteasome regulatory particle(GO:0005838) |
| 0.4 | 2.3 | GO:0032585 | multivesicular body membrane(GO:0032585) |
| 0.4 | 12.1 | GO:0043198 | dendritic shaft(GO:0043198) |
| 0.3 | 42.5 | GO:0031234 | extrinsic component of cytoplasmic side of plasma membrane(GO:0031234) |
| 0.3 | 5.6 | GO:0060076 | excitatory synapse(GO:0060076) |
| 0.3 | 22.4 | GO:0019005 | SCF ubiquitin ligase complex(GO:0019005) |
| 0.3 | 2.3 | GO:0035068 | micro-ribonucleoprotein complex(GO:0035068) |
| 0.3 | 1.9 | GO:0044754 | autolysosome(GO:0044754) |
| 0.3 | 2.9 | GO:0044352 | pinosome(GO:0044352) macropinosome(GO:0044354) |
| 0.3 | 0.3 | GO:0097413 | Lewy body(GO:0097413) |
| 0.3 | 3.6 | GO:0005796 | Golgi lumen(GO:0005796) |
| 0.3 | 9.2 | GO:0046930 | pore complex(GO:0046930) |
| 0.3 | 4.1 | GO:0045259 | proton-transporting ATP synthase complex(GO:0045259) |
| 0.3 | 64.7 | GO:0031253 | cell projection membrane(GO:0031253) |
| 0.3 | 14.4 | GO:0099501 | synaptic vesicle membrane(GO:0030672) exocytic vesicle membrane(GO:0099501) |
| 0.2 | 5.2 | GO:0005942 | phosphatidylinositol 3-kinase complex(GO:0005942) |
| 0.2 | 6.5 | GO:0000421 | autophagosome membrane(GO:0000421) |
| 0.2 | 19.6 | GO:0042383 | sarcolemma(GO:0042383) |
| 0.2 | 5.4 | GO:0098827 | endoplasmic reticulum tubular network(GO:0071782) endoplasmic reticulum subcompartment(GO:0098827) |
| 0.2 | 10.7 | GO:0005844 | polysome(GO:0005844) |
| 0.2 | 9.9 | GO:0030136 | clathrin-coated vesicle(GO:0030136) |
| 0.2 | 3.3 | GO:0030131 | clathrin adaptor complex(GO:0030131) |
| 0.2 | 11.7 | GO:0030016 | myofibril(GO:0030016) |
| 0.2 | 3.3 | GO:0042588 | zymogen granule(GO:0042588) |
| 0.2 | 4.9 | GO:0042734 | presynaptic membrane(GO:0042734) |
| 0.2 | 27.0 | GO:0042579 | peroxisome(GO:0005777) microbody(GO:0042579) |
| 0.2 | 0.9 | GO:0022624 | proteasome accessory complex(GO:0022624) |
| 0.2 | 2.4 | GO:0035102 | PRC1 complex(GO:0035102) |
| 0.2 | 4.2 | GO:0005771 | multivesicular body(GO:0005771) |
| 0.2 | 8.3 | GO:0031902 | late endosome membrane(GO:0031902) |
| 0.1 | 6.6 | GO:0045171 | intercellular bridge(GO:0045171) |
| 0.1 | 3.6 | GO:0031304 | intrinsic component of mitochondrial inner membrane(GO:0031304) integral component of mitochondrial inner membrane(GO:0031305) |
| 0.1 | 1.4 | GO:0031462 | Cul2-RING ubiquitin ligase complex(GO:0031462) |
| 0.1 | 5.4 | GO:0097517 | stress fiber(GO:0001725) contractile actin filament bundle(GO:0097517) |
| 0.1 | 37.5 | GO:0005743 | mitochondrial inner membrane(GO:0005743) |
| 0.1 | 12.1 | GO:0036064 | ciliary basal body(GO:0036064) |
| 0.1 | 4.7 | GO:0030658 | transport vesicle membrane(GO:0030658) |
| 0.1 | 12.2 | GO:0031227 | intrinsic component of endoplasmic reticulum membrane(GO:0031227) |
| 0.1 | 5.8 | GO:0048770 | melanosome(GO:0042470) pigment granule(GO:0048770) |
| 0.1 | 7.7 | GO:0019898 | extrinsic component of membrane(GO:0019898) |
| 0.1 | 2.2 | GO:0005868 | cytoplasmic dynein complex(GO:0005868) |
| 0.1 | 26.1 | GO:0030425 | dendrite(GO:0030425) |
| 0.1 | 26.9 | GO:0000139 | Golgi membrane(GO:0000139) |
| 0.1 | 25.6 | GO:0016607 | nuclear speck(GO:0016607) |
| 0.1 | 2.3 | GO:0009898 | cytoplasmic side of plasma membrane(GO:0009898) |
| 0.1 | 5.0 | GO:0005581 | collagen trimer(GO:0005581) |
| 0.1 | 6.7 | GO:0010008 | endosome membrane(GO:0010008) |
| 0.1 | 4.5 | GO:0030659 | cytoplasmic vesicle membrane(GO:0030659) |
| 0.1 | 3.8 | GO:0016363 | nuclear matrix(GO:0016363) |
| 0.0 | 16.1 | GO:0005813 | centrosome(GO:0005813) |
| 0.0 | 18.9 | GO:0005789 | endoplasmic reticulum membrane(GO:0005789) |
| 0.0 | 0.9 | GO:0005669 | transcription factor TFIID complex(GO:0005669) |
| 0.0 | 0.3 | GO:0080008 | Cul4-RING E3 ubiquitin ligase complex(GO:0080008) |
| 0.0 | 6.9 | GO:0005794 | Golgi apparatus(GO:0005794) |
Gene overrepresentation in molecular function category:
| Log-likelihood per target | Total log-likelihood | Term | Description |
|---|---|---|---|
| 20.5 | 61.5 | GO:0005294 | neutral L-amino acid secondary active transmembrane transporter activity(GO:0005294) |
| 10.4 | 72.8 | GO:0004332 | fructose-bisphosphate aldolase activity(GO:0004332) |
| 9.8 | 58.6 | GO:0004634 | phosphopyruvate hydratase activity(GO:0004634) |
| 8.6 | 34.4 | GO:0008597 | calcium-dependent protein serine/threonine phosphatase regulator activity(GO:0008597) |
| 7.6 | 30.3 | GO:0008486 | endopolyphosphatase activity(GO:0000298) diphosphoinositol-polyphosphate diphosphatase activity(GO:0008486) bis(5'-adenosyl)-hexaphosphatase activity(GO:0034431) bis(5'-adenosyl)-pentaphosphatase activity(GO:0034432) |
| 7.4 | 22.2 | GO:0004466 | long-chain-acyl-CoA dehydrogenase activity(GO:0004466) |
| 7.1 | 28.6 | GO:1903135 | cupric ion binding(GO:1903135) |
| 6.5 | 19.5 | GO:0008948 | oxaloacetate decarboxylase activity(GO:0008948) |
| 5.4 | 27.2 | GO:0051373 | FATZ binding(GO:0051373) |
| 4.9 | 24.7 | GO:0086062 | voltage-gated sodium channel activity involved in Purkinje myocyte action potential(GO:0086062) |
| 4.6 | 13.7 | GO:0005017 | platelet-derived growth factor-activated receptor activity(GO:0005017) |
| 4.0 | 11.9 | GO:0019809 | spermidine binding(GO:0019809) |
| 3.6 | 10.9 | GO:0003990 | acetylcholinesterase activity(GO:0003990) |
| 3.6 | 14.3 | GO:0008427 | calcium-dependent protein kinase inhibitor activity(GO:0008427) |
| 3.5 | 17.7 | GO:0038085 | vascular endothelial growth factor binding(GO:0038085) |
| 3.5 | 14.1 | GO:0015057 | thrombin receptor activity(GO:0015057) |
| 3.2 | 28.7 | GO:0043208 | glycosphingolipid binding(GO:0043208) |
| 3.1 | 12.3 | GO:0005143 | interleukin-12 receptor binding(GO:0005143) |
| 2.8 | 11.1 | GO:0008489 | UDP-galactose:glucosylceramide beta-1,4-galactosyltransferase activity(GO:0008489) |
| 2.6 | 25.8 | GO:0031957 | very long-chain fatty acid-CoA ligase activity(GO:0031957) |
| 2.6 | 36.0 | GO:0030898 | actin-dependent ATPase activity(GO:0030898) |
| 2.5 | 10.1 | GO:0032050 | clathrin heavy chain binding(GO:0032050) |
| 2.4 | 4.8 | GO:0050253 | retinyl-palmitate esterase activity(GO:0050253) |
| 2.4 | 12.1 | GO:0031802 | type 5 metabotropic glutamate receptor binding(GO:0031802) |
| 2.4 | 14.3 | GO:0004128 | cytochrome-b5 reductase activity, acting on NAD(P)H(GO:0004128) |
| 2.3 | 36.5 | GO:0051371 | muscle alpha-actinin binding(GO:0051371) |
| 2.3 | 13.6 | GO:0004366 | glycerol-3-phosphate O-acyltransferase activity(GO:0004366) |
| 2.3 | 24.8 | GO:0004875 | complement receptor activity(GO:0004875) |
| 2.2 | 15.7 | GO:0038062 | protein tyrosine kinase collagen receptor activity(GO:0038062) |
| 2.1 | 27.9 | GO:0098919 | structural constituent of postsynaptic specialization(GO:0098879) structural constituent of postsynaptic density(GO:0098919) |
| 2.1 | 8.3 | GO:0005134 | interleukin-2 receptor binding(GO:0005134) |
| 2.0 | 22.1 | GO:0015385 | sodium:proton antiporter activity(GO:0015385) |
| 2.0 | 17.7 | GO:0086080 | protein binding involved in heterotypic cell-cell adhesion(GO:0086080) |
| 1.9 | 54.1 | GO:0016702 | oxidoreductase activity, acting on single donors with incorporation of molecular oxygen, incorporation of two atoms of oxygen(GO:0016702) |
| 1.9 | 42.2 | GO:0005212 | structural constituent of eye lens(GO:0005212) |
| 1.9 | 13.0 | GO:0005173 | stem cell factor receptor binding(GO:0005173) |
| 1.8 | 18.3 | GO:0000774 | adenyl-nucleotide exchange factor activity(GO:0000774) |
| 1.8 | 5.4 | GO:0005135 | erythropoietin receptor binding(GO:0005128) interleukin-3 receptor binding(GO:0005135) |
| 1.8 | 10.7 | GO:1990715 | mRNA CDS binding(GO:1990715) |
| 1.7 | 73.4 | GO:0017080 | sodium channel regulator activity(GO:0017080) |
| 1.7 | 22.0 | GO:0005225 | volume-sensitive anion channel activity(GO:0005225) |
| 1.7 | 11.7 | GO:0042030 | ATPase inhibitor activity(GO:0042030) |
| 1.7 | 41.5 | GO:0005545 | 1-phosphatidylinositol binding(GO:0005545) |
| 1.7 | 8.3 | GO:0034597 | phosphatidylinositol-4,5-bisphosphate 4-phosphatase activity(GO:0034597) |
| 1.6 | 4.7 | GO:0002134 | UTP binding(GO:0002134) sulfonylurea receptor binding(GO:0017098) pyrimidine ribonucleoside binding(GO:0032551) |
| 1.5 | 36.2 | GO:0004198 | calcium-dependent cysteine-type endopeptidase activity(GO:0004198) |
| 1.5 | 16.5 | GO:0048407 | platelet-derived growth factor binding(GO:0048407) |
| 1.5 | 16.1 | GO:0000340 | RNA 7-methylguanosine cap binding(GO:0000340) |
| 1.4 | 5.7 | GO:0052796 | exo-alpha-(2->3)-sialidase activity(GO:0052794) exo-alpha-(2->6)-sialidase activity(GO:0052795) exo-alpha-(2->8)-sialidase activity(GO:0052796) |
| 1.4 | 8.4 | GO:0004322 | ferroxidase activity(GO:0004322) oxidoreductase activity, oxidizing metal ions, oxygen as acceptor(GO:0016724) |
| 1.4 | 36.7 | GO:0008157 | protein phosphatase 1 binding(GO:0008157) |
| 1.4 | 6.8 | GO:0005042 | netrin receptor activity(GO:0005042) |
| 1.3 | 43.0 | GO:0070412 | R-SMAD binding(GO:0070412) |
| 1.3 | 44.9 | GO:0001106 | RNA polymerase II transcription corepressor activity(GO:0001106) |
| 1.3 | 3.8 | GO:0052591 | sn-glycerol-3-phosphate:ubiquinone oxidoreductase activity(GO:0052590) sn-glycerol-3-phosphate:ubiquinone-8 oxidoreductase activity(GO:0052591) |
| 1.3 | 15.3 | GO:0045028 | G-protein coupled nucleotide receptor activity(GO:0001608) G-protein coupled purinergic nucleotide receptor activity(GO:0045028) |
| 1.2 | 15.8 | GO:0043522 | leucine zipper domain binding(GO:0043522) |
| 1.2 | 6.9 | GO:0001517 | N-acetylglucosamine 6-O-sulfotransferase activity(GO:0001517) |
| 1.1 | 19.4 | GO:0005523 | tropomyosin binding(GO:0005523) |
| 1.1 | 10.0 | GO:0004931 | extracellular ATP-gated cation channel activity(GO:0004931) ATP-gated ion channel activity(GO:0035381) |
| 1.1 | 4.4 | GO:0033149 | FFAT motif binding(GO:0033149) |
| 1.1 | 25.8 | GO:0051428 | peptide hormone receptor binding(GO:0051428) |
| 1.0 | 35.3 | GO:0031492 | nucleosomal DNA binding(GO:0031492) |
| 1.0 | 13.5 | GO:0031748 | D1 dopamine receptor binding(GO:0031748) |
| 1.0 | 13.4 | GO:0035612 | AP-2 adaptor complex binding(GO:0035612) |
| 1.0 | 16.4 | GO:0017017 | MAP kinase tyrosine/serine/threonine phosphatase activity(GO:0017017) |
| 1.0 | 4.0 | GO:0032558 | adenyl deoxyribonucleotide binding(GO:0032558) |
| 1.0 | 5.0 | GO:0004031 | aldehyde oxidase activity(GO:0004031) xanthine dehydrogenase activity(GO:0004854) oxidoreductase activity, acting on the aldehyde or oxo group of donors, oxygen as acceptor(GO:0016623) oxidoreductase activity, acting on CH or CH2 groups, NAD or NADP as acceptor(GO:0016726) |
| 0.9 | 7.5 | GO:0047499 | calcium-independent phospholipase A2 activity(GO:0047499) |
| 0.9 | 37.4 | GO:0001784 | phosphotyrosine binding(GO:0001784) |
| 0.9 | 15.4 | GO:0005521 | lamin binding(GO:0005521) |
| 0.9 | 8.2 | GO:0045295 | gamma-catenin binding(GO:0045295) |
| 0.9 | 3.6 | GO:0005163 | nerve growth factor receptor binding(GO:0005163) |
| 0.9 | 93.1 | GO:0004725 | protein tyrosine phosphatase activity(GO:0004725) |
| 0.9 | 2.6 | GO:0016520 | growth hormone-releasing hormone receptor activity(GO:0016520) |
| 0.8 | 5.8 | GO:0047035 | testosterone dehydrogenase (NAD+) activity(GO:0047035) |
| 0.8 | 9.8 | GO:0019841 | retinol binding(GO:0019841) |
| 0.8 | 6.4 | GO:0004749 | ribose phosphate diphosphokinase activity(GO:0004749) |
| 0.8 | 3.9 | GO:0004784 | superoxide dismutase activity(GO:0004784) oxidoreductase activity, acting on superoxide radicals as acceptor(GO:0016721) |
| 0.8 | 5.4 | GO:0016286 | small conductance calcium-activated potassium channel activity(GO:0016286) |
| 0.8 | 13.0 | GO:0005123 | death receptor binding(GO:0005123) |
| 0.7 | 3.7 | GO:0038132 | neuregulin binding(GO:0038132) |
| 0.7 | 3.6 | GO:0050833 | pyruvate transmembrane transporter activity(GO:0050833) |
| 0.7 | 13.0 | GO:0043295 | glutathione binding(GO:0043295) |
| 0.7 | 9.2 | GO:0015250 | water channel activity(GO:0015250) |
| 0.6 | 6.9 | GO:0016783 | sulfurtransferase activity(GO:0016783) |
| 0.6 | 13.7 | GO:0080025 | phosphatidylinositol-3,5-bisphosphate binding(GO:0080025) |
| 0.6 | 1.8 | GO:0031766 | galanin receptor binding(GO:0031763) type 2 galanin receptor binding(GO:0031765) type 3 galanin receptor binding(GO:0031766) |
| 0.6 | 3.4 | GO:0048030 | disaccharide binding(GO:0048030) |
| 0.6 | 3.4 | GO:0045545 | syndecan binding(GO:0045545) |
| 0.5 | 150.3 | GO:0005096 | GTPase activator activity(GO:0005096) |
| 0.5 | 37.4 | GO:0017022 | myosin binding(GO:0017022) |
| 0.5 | 9.6 | GO:0060590 | ATPase activator activity(GO:0001671) ATPase regulator activity(GO:0060590) |
| 0.5 | 30.4 | GO:0019888 | protein phosphatase regulator activity(GO:0019888) |
| 0.5 | 1.5 | GO:0003844 | 1,4-alpha-glucan branching enzyme activity(GO:0003844) |
| 0.5 | 6.9 | GO:0033038 | bitter taste receptor activity(GO:0033038) |
| 0.5 | 2.4 | GO:0047631 | adenosine-diphosphatase activity(GO:0043262) ADP-ribose diphosphatase activity(GO:0047631) |
| 0.5 | 12.4 | GO:0000062 | fatty-acyl-CoA binding(GO:0000062) |
| 0.5 | 1.4 | GO:0004909 | interleukin-1, Type I, activating receptor activity(GO:0004909) |
| 0.5 | 6.4 | GO:0070679 | inositol 1,4,5 trisphosphate binding(GO:0070679) |
| 0.4 | 8.9 | GO:0008327 | methyl-CpG binding(GO:0008327) |
| 0.4 | 1.8 | GO:0016972 | thiol oxidase activity(GO:0016972) |
| 0.4 | 4.5 | GO:0042301 | phosphate ion binding(GO:0042301) |
| 0.4 | 44.0 | GO:0005178 | integrin binding(GO:0005178) |
| 0.4 | 7.9 | GO:0071837 | HMG box domain binding(GO:0071837) |
| 0.4 | 34.5 | GO:0004860 | protein kinase inhibitor activity(GO:0004860) |
| 0.4 | 5.2 | GO:0016805 | dipeptidase activity(GO:0016805) |
| 0.4 | 3.3 | GO:0047498 | calcium-dependent phospholipase A2 activity(GO:0047498) |
| 0.4 | 4.7 | GO:0005041 | low-density lipoprotein receptor activity(GO:0005041) |
| 0.3 | 6.5 | GO:0004697 | protein kinase C activity(GO:0004697) |
| 0.3 | 8.0 | GO:0017134 | fibroblast growth factor binding(GO:0017134) |
| 0.3 | 29.1 | GO:0005200 | structural constituent of cytoskeleton(GO:0005200) |
| 0.3 | 34.2 | GO:0015078 | hydrogen ion transmembrane transporter activity(GO:0015078) |
| 0.3 | 36.4 | GO:0030165 | PDZ domain binding(GO:0030165) |
| 0.3 | 4.8 | GO:0050750 | low-density lipoprotein particle receptor binding(GO:0050750) |
| 0.2 | 8.2 | GO:0008009 | chemokine activity(GO:0008009) |
| 0.2 | 8.1 | GO:0005246 | calcium channel regulator activity(GO:0005246) |
| 0.2 | 3.1 | GO:0051787 | misfolded protein binding(GO:0051787) |
| 0.2 | 23.7 | GO:0002020 | protease binding(GO:0002020) |
| 0.2 | 2.5 | GO:0022820 | potassium:chloride symporter activity(GO:0015379) potassium ion symporter activity(GO:0022820) |
| 0.2 | 4.2 | GO:0001530 | lipopolysaccharide binding(GO:0001530) |
| 0.2 | 1.6 | GO:0000064 | L-ornithine transmembrane transporter activity(GO:0000064) |
| 0.2 | 3.5 | GO:0051537 | 2 iron, 2 sulfur cluster binding(GO:0051537) |
| 0.2 | 9.5 | GO:0005080 | protein kinase C binding(GO:0005080) |
| 0.2 | 4.0 | GO:0004190 | aspartic-type endopeptidase activity(GO:0004190) |
| 0.2 | 4.0 | GO:0005385 | zinc ion transmembrane transporter activity(GO:0005385) |
| 0.1 | 2.5 | GO:0005242 | inward rectifier potassium channel activity(GO:0005242) |
| 0.1 | 7.6 | GO:0016763 | transferase activity, transferring pentosyl groups(GO:0016763) |
| 0.1 | 1.6 | GO:0031210 | phosphatidylcholine binding(GO:0031210) |
| 0.1 | 2.8 | GO:0042975 | peroxisome proliferator activated receptor binding(GO:0042975) |
| 0.1 | 3.8 | GO:0015932 | nucleobase-containing compound transmembrane transporter activity(GO:0015932) |
| 0.1 | 1.4 | GO:0004622 | lysophospholipase activity(GO:0004622) |
| 0.1 | 0.5 | GO:0004694 | eukaryotic translation initiation factor 2alpha kinase activity(GO:0004694) |
| 0.1 | 16.3 | GO:0061630 | ubiquitin protein ligase activity(GO:0061630) |
| 0.1 | 6.7 | GO:0003777 | microtubule motor activity(GO:0003777) |
| 0.1 | 6.7 | GO:0019838 | growth factor binding(GO:0019838) |
| 0.1 | 1.6 | GO:0071855 | neuropeptide receptor binding(GO:0071855) |
| 0.1 | 0.4 | GO:0004415 | hyalurononglucosaminidase activity(GO:0004415) |
| 0.1 | 2.2 | GO:0003774 | motor activity(GO:0003774) |
| 0.1 | 1.3 | GO:0004364 | glutathione transferase activity(GO:0004364) |
| 0.0 | 2.5 | GO:0004197 | cysteine-type endopeptidase activity(GO:0004197) |
| 0.0 | 46.1 | GO:0004984 | olfactory receptor activity(GO:0004984) |
| 0.0 | 0.3 | GO:0004602 | glutathione peroxidase activity(GO:0004602) |
| 0.0 | 2.9 | GO:0016503 | pheromone receptor activity(GO:0016503) |
| 0.0 | 5.3 | GO:0008017 | microtubule binding(GO:0008017) |
| 0.0 | 3.0 | GO:0047485 | protein N-terminus binding(GO:0047485) |
| 0.0 | 2.4 | GO:0003697 | single-stranded DNA binding(GO:0003697) |
| 0.0 | 1.6 | GO:0042626 | ATPase activity, coupled to transmembrane movement of substances(GO:0042626) |
| 0.0 | 0.2 | GO:0032266 | phosphatidylinositol-3-phosphate binding(GO:0032266) |
| 0.0 | 0.5 | GO:0004869 | cysteine-type endopeptidase inhibitor activity(GO:0004869) |
Gene overrepresentation in curated gene sets: canonical pathways category:
| Log-likelihood per target | Total log-likelihood | Term | Description |
|---|---|---|---|
| 3.0 | 6.0 | PID SYNDECAN 4 PATHWAY | Syndecan-4-mediated signaling events |
| 1.6 | 17.7 | PID VEGF VEGFR PATHWAY | VEGF and VEGFR signaling network |
| 1.5 | 55.3 | PID NECTIN PATHWAY | Nectin adhesion pathway |
| 1.2 | 38.8 | PID CDC42 REG PATHWAY | Regulation of CDC42 activity |
| 1.2 | 43.5 | PID TCR CALCIUM PATHWAY | Calcium signaling in the CD4+ TCR pathway |
| 1.0 | 50.7 | PID ARF6 TRAFFICKING PATHWAY | Arf6 trafficking events |
| 1.0 | 12.7 | PID P38 GAMMA DELTA PATHWAY | Signaling mediated by p38-gamma and p38-delta |
| 1.0 | 13.5 | PID SYNDECAN 2 PATHWAY | Syndecan-2-mediated signaling events |
| 1.0 | 72.5 | PID HIF1 TFPATHWAY | HIF-1-alpha transcription factor network |
| 0.9 | 7.6 | SA TRKA RECEPTOR | The TrkA receptor binds nerve growth factor to activate MAP kinase pathways and promote cell growth. |
| 0.8 | 30.5 | PID PI3K PLC TRK PATHWAY | Trk receptor signaling mediated by PI3K and PLC-gamma |
| 0.8 | 20.1 | PID HDAC CLASSIII PATHWAY | Signaling events mediated by HDAC Class III |
| 0.8 | 28.6 | PID GLYPICAN 1PATHWAY | Glypican 1 network |
| 0.8 | 15.8 | PID ARF 3PATHWAY | Arf1 pathway |
| 0.7 | 10.3 | PID IL23 PATHWAY | IL23-mediated signaling events |
| 0.7 | 39.7 | PID TRKR PATHWAY | Neurotrophic factor-mediated Trk receptor signaling |
| 0.7 | 17.0 | PID FAK PATHWAY | Signaling events mediated by focal adhesion kinase |
| 0.7 | 27.5 | PID RAS PATHWAY | Regulation of Ras family activation |
| 0.7 | 11.9 | PID INTEGRIN A9B1 PATHWAY | Alpha9 beta1 integrin signaling events |
| 0.7 | 7.2 | PID FRA PATHWAY | Validated transcriptional targets of AP1 family members Fra1 and Fra2 |
| 0.7 | 9.2 | PID PRL SIGNALING EVENTS PATHWAY | Signaling events mediated by PRL |
| 0.6 | 17.2 | PID NEPHRIN NEPH1 PATHWAY | Nephrin/Neph1 signaling in the kidney podocyte |
| 0.6 | 7.3 | PID FOXO PATHWAY | FoxO family signaling |
| 0.6 | 6.5 | PID IGF1 PATHWAY | IGF1 pathway |
| 0.6 | 6.8 | PID NETRIN PATHWAY | Netrin-mediated signaling events |
| 0.5 | 8.8 | PID ERBB2 ERBB3 PATHWAY | ErbB2/ErbB3 signaling events |
| 0.5 | 22.2 | PID HNF3B PATHWAY | FOXA2 and FOXA3 transcription factor networks |
| 0.4 | 27.0 | PID CASPASE PATHWAY | Caspase cascade in apoptosis |
| 0.4 | 3.4 | PID IL5 PATHWAY | IL5-mediated signaling events |
| 0.4 | 13.0 | PID KIT PATHWAY | Signaling events mediated by Stem cell factor receptor (c-Kit) |
| 0.4 | 7.0 | ST ERK1 ERK2 MAPK PATHWAY | ERK1/ERK2 MAPK Pathway |
| 0.3 | 14.5 | PID P38 ALPHA BETA DOWNSTREAM PATHWAY | Signaling mediated by p38-alpha and p38-beta |
| 0.3 | 24.5 | PID E2F PATHWAY | E2F transcription factor network |
| 0.3 | 16.5 | NABA COLLAGENS | Genes encoding collagen proteins |
| 0.3 | 11.0 | PID P75 NTR PATHWAY | p75(NTR)-mediated signaling |
| 0.3 | 11.5 | PID HNF3A PATHWAY | FOXA1 transcription factor network |
| 0.3 | 4.8 | ST P38 MAPK PATHWAY | p38 MAPK Pathway |
| 0.3 | 0.3 | PID INTEGRIN4 PATHWAY | Alpha6 beta4 integrin-ligand interactions |
| 0.3 | 9.5 | PID TGFBR PATHWAY | TGF-beta receptor signaling |
| 0.2 | 2.8 | PID ERB GENOMIC PATHWAY | Validated nuclear estrogen receptor beta network |
| 0.2 | 4.7 | PID VEGFR1 2 PATHWAY | Signaling events mediated by VEGFR1 and VEGFR2 |
| 0.2 | 37.5 | NABA ECM GLYCOPROTEINS | Genes encoding structural ECM glycoproteins |
| 0.2 | 5.9 | ST FAS SIGNALING PATHWAY | Fas Signaling Pathway |
| 0.1 | 2.4 | PID AP1 PATHWAY | AP-1 transcription factor network |
| 0.1 | 4.7 | NABA PROTEOGLYCANS | Genes encoding proteoglycans |
| 0.1 | 3.1 | PID MYC REPRESS PATHWAY | Validated targets of C-MYC transcriptional repression |
| 0.1 | 1.5 | PID THROMBIN PAR1 PATHWAY | PAR1-mediated thrombin signaling events |
| 0.1 | 1.5 | PID ECADHERIN STABILIZATION PATHWAY | Stabilization and expansion of the E-cadherin adherens junction |
| 0.1 | 2.4 | PID PLK1 PATHWAY | PLK1 signaling events |
| 0.0 | 0.5 | PID TCPTP PATHWAY | Signaling events mediated by TCPTP |
| 0.0 | 0.5 | PID WNT SIGNALING PATHWAY | Wnt signaling network |
| 0.0 | 4.2 | NABA SECRETED FACTORS | Genes encoding secreted soluble factors |
| 0.0 | 2.1 | NABA ECM AFFILIATED | Genes encoding proteins affiliated structurally or functionally to extracellular matrix proteins |
Gene overrepresentation in curated gene sets: REACTOME pathways category:
| Log-likelihood per target | Total log-likelihood | Term | Description |
|---|---|---|---|
| 2.7 | 61.5 | REACTOME NA CL DEPENDENT NEUROTRANSMITTER TRANSPORTERS | Genes involved in Na+/Cl- dependent neurotransmitter transporters |
| 2.6 | 102.8 | REACTOME GLYCOLYSIS | Genes involved in Glycolysis |
| 2.1 | 32.2 | REACTOME SIGNAL ATTENUATION | Genes involved in Signal attenuation |
| 1.9 | 65.2 | REACTOME TRAFFICKING OF AMPA RECEPTORS | Genes involved in Trafficking of AMPA receptors |
| 1.8 | 33.4 | REACTOME TGF BETA RECEPTOR SIGNALING IN EMT EPITHELIAL TO MESENCHYMAL TRANSITION | Genes involved in TGF-beta receptor signaling in EMT (epithelial to mesenchymal transition) |
| 1.6 | 22.2 | REACTOME MITOCHONDRIAL FATTY ACID BETA OXIDATION | Genes involved in Mitochondrial Fatty Acid Beta-Oxidation |
| 1.5 | 17.7 | REACTOME VEGF LIGAND RECEPTOR INTERACTIONS | Genes involved in VEGF ligand-receptor interactions |
| 1.4 | 10.1 | REACTOME GAP JUNCTION DEGRADATION | Genes involved in Gap junction degradation |
| 1.4 | 15.8 | REACTOME ACTIVATION OF CHAPERONE GENES BY ATF6 ALPHA | Genes involved in Activation of Chaperone Genes by ATF6-alpha |
| 1.4 | 23.0 | REACTOME N GLYCAN ANTENNAE ELONGATION | Genes involved in N-Glycan antennae elongation |
| 1.3 | 65.5 | REACTOME G ALPHA Z SIGNALLING EVENTS | Genes involved in G alpha (z) signalling events |
| 1.2 | 16.4 | REACTOME DOWNREGULATION OF ERBB2 ERBB3 SIGNALING | Genes involved in Downregulation of ERBB2:ERBB3 signaling |
| 1.1 | 35.4 | REACTOME SEMA4D INDUCED CELL MIGRATION AND GROWTH CONE COLLAPSE | Genes involved in Sema4D induced cell migration and growth-cone collapse |
| 1.0 | 45.1 | REACTOME NCAM1 INTERACTIONS | Genes involved in NCAM1 interactions |
| 1.0 | 14.1 | REACTOME THROMBIN SIGNALLING THROUGH PROTEINASE ACTIVATED RECEPTORS PARS | Genes involved in Thrombin signalling through proteinase activated receptors (PARs) |
| 1.0 | 9.5 | REACTOME P75NTR RECRUITS SIGNALLING COMPLEXES | Genes involved in p75NTR recruits signalling complexes |
| 0.9 | 11.6 | REACTOME PYRIMIDINE CATABOLISM | Genes involved in Pyrimidine catabolism |
| 0.9 | 21.7 | REACTOME RNA POL I PROMOTER OPENING | Genes involved in RNA Polymerase I Promoter Opening |
| 0.8 | 25.0 | REACTOME GLUTATHIONE CONJUGATION | Genes involved in Glutathione conjugation |
| 0.8 | 3.3 | REACTOME ADP SIGNALLING THROUGH P2RY1 | Genes involved in ADP signalling through P2Y purinoceptor 1 |
| 0.8 | 10.9 | REACTOME SYNTHESIS SECRETION AND DEACYLATION OF GHRELIN | Genes involved in Synthesis, Secretion, and Deacylation of Ghrelin |
| 0.8 | 9.2 | REACTOME PASSIVE TRANSPORT BY AQUAPORINS | Genes involved in Passive Transport by Aquaporins |
| 0.7 | 26.5 | REACTOME FORMATION OF FIBRIN CLOT CLOTTING CASCADE | Genes involved in Formation of Fibrin Clot (Clotting Cascade) |
| 0.7 | 27.1 | REACTOME MEIOTIC SYNAPSIS | Genes involved in Meiotic Synapsis |
| 0.7 | 11.9 | REACTOME METABOLISM OF POLYAMINES | Genes involved in Metabolism of polyamines |
| 0.6 | 57.0 | REACTOME L1CAM INTERACTIONS | Genes involved in L1CAM interactions |
| 0.6 | 11.5 | REACTOME LYSOSOME VESICLE BIOGENESIS | Genes involved in Lysosome Vesicle Biogenesis |
| 0.5 | 6.8 | REACTOME ROLE OF DCC IN REGULATING APOPTOSIS | Genes involved in Role of DCC in regulating apoptosis |
| 0.5 | 11.8 | REACTOME ACYL CHAIN REMODELLING OF PE | Genes involved in Acyl chain remodelling of PE |
| 0.5 | 9.5 | REACTOME DOWNREGULATION OF TGF BETA RECEPTOR SIGNALING | Genes involved in Downregulation of TGF-beta receptor signaling |
| 0.4 | 12.4 | REACTOME METAL ION SLC TRANSPORTERS | Genes involved in Metal ion SLC transporters |
| 0.4 | 4.7 | REACTOME THE NLRP3 INFLAMMASOME | Genes involved in The NLRP3 inflammasome |
| 0.3 | 5.2 | REACTOME IL 7 SIGNALING | Genes involved in Interleukin-7 signaling |
| 0.3 | 6.2 | REACTOME ABCA TRANSPORTERS IN LIPID HOMEOSTASIS | Genes involved in ABCA transporters in lipid homeostasis |
| 0.3 | 5.4 | REACTOME POST CHAPERONIN TUBULIN FOLDING PATHWAY | Genes involved in Post-chaperonin tubulin folding pathway |
| 0.3 | 8.2 | REACTOME ADHERENS JUNCTIONS INTERACTIONS | Genes involved in Adherens junctions interactions |
| 0.3 | 30.2 | REACTOME PPARA ACTIVATES GENE EXPRESSION | Genes involved in PPARA Activates Gene Expression |
| 0.2 | 2.4 | REACTOME HORMONE SENSITIVE LIPASE HSL MEDIATED TRIACYLGLYCEROL HYDROLYSIS | Genes involved in Hormone-sensitive lipase (HSL)-mediated triacylglycerol hydrolysis |
| 0.2 | 2.6 | REACTOME HORMONE LIGAND BINDING RECEPTORS | Genes involved in Hormone ligand-binding receptors |
| 0.2 | 4.3 | REACTOME SULFUR AMINO ACID METABOLISM | Genes involved in Sulfur amino acid metabolism |
| 0.2 | 6.7 | REACTOME KINESINS | Genes involved in Kinesins |
| 0.2 | 1.6 | REACTOME SYNTHESIS SECRETION AND INACTIVATION OF GLP1 | Genes involved in Synthesis, Secretion, and Inactivation of Glucagon-like Peptide-1 (GLP-1) |
| 0.2 | 13.7 | REACTOME DOWNSTREAM SIGNAL TRANSDUCTION | Genes involved in Downstream signal transduction |
| 0.2 | 4.5 | REACTOME CASPASE MEDIATED CLEAVAGE OF CYTOSKELETAL PROTEINS | Genes involved in Caspase-mediated cleavage of cytoskeletal proteins |
| 0.2 | 23.5 | REACTOME SIGNALING BY RHO GTPASES | Genes involved in Signaling by Rho GTPases |
| 0.2 | 8.0 | REACTOME MITOCHONDRIAL PROTEIN IMPORT | Genes involved in Mitochondrial Protein Import |
| 0.1 | 5.7 | REACTOME GLYCOSPHINGOLIPID METABOLISM | Genes involved in Glycosphingolipid metabolism |
| 0.1 | 6.1 | REACTOME VIF MEDIATED DEGRADATION OF APOBEC3G | Genes involved in Vif-mediated degradation of APOBEC3G |
| 0.1 | 7.3 | REACTOME RESPIRATORY ELECTRON TRANSPORT | Genes involved in Respiratory electron transport |
| 0.1 | 2.5 | REACTOME INWARDLY RECTIFYING K CHANNELS | Genes involved in Inwardly rectifying K+ channels |
| 0.1 | 1.0 | REACTOME ORGANIC CATION ANION ZWITTERION TRANSPORT | Genes involved in Organic cation/anion/zwitterion transport |
| 0.1 | 5.4 | REACTOME METABOLISM OF VITAMINS AND COFACTORS | Genes involved in Metabolism of vitamins and cofactors |
| 0.1 | 3.2 | REACTOME PYRUVATE METABOLISM AND CITRIC ACID TCA CYCLE | Genes involved in Pyruvate metabolism and Citric Acid (TCA) cycle |
| 0.1 | 0.9 | REACTOME SIGNALING BY FGFR1 FUSION MUTANTS | Genes involved in Signaling by FGFR1 fusion mutants |
| 0.1 | 9.5 | REACTOME GASTRIN CREB SIGNALLING PATHWAY VIA PKC AND MAPK | Genes involved in Gastrin-CREB signalling pathway via PKC and MAPK |
| 0.1 | 11.5 | REACTOME ANTIGEN PROCESSING UBIQUITINATION PROTEASOME DEGRADATION | Genes involved in Antigen processing: Ubiquitination & Proteasome degradation |
| 0.1 | 3.8 | REACTOME FATTY ACID TRIACYLGLYCEROL AND KETONE BODY METABOLISM | Genes involved in Fatty acid, triacylglycerol, and ketone body metabolism |
| 0.0 | 0.5 | REACTOME APOPTOTIC CLEAVAGE OF CELL ADHESION PROTEINS | Genes involved in Apoptotic cleavage of cell adhesion proteins |
| 0.0 | 1.5 | REACTOME GLUCOSE METABOLISM | Genes involved in Glucose metabolism |
| 0.0 | 0.3 | REACTOME PURINE CATABOLISM | Genes involved in Purine catabolism |
| 0.0 | 0.4 | REACTOME ACTIVATION OF IRF3 IRF7 MEDIATED BY TBK1 IKK EPSILON | Genes involved in Activation of IRF3/IRF7 mediated by TBK1/IKK epsilon |
| 0.0 | 2.2 | REACTOME LOSS OF NLP FROM MITOTIC CENTROSOMES | Genes involved in Loss of Nlp from mitotic centrosomes |
| 0.0 | 0.5 | REACTOME ANTIVIRAL MECHANISM BY IFN STIMULATED GENES | Genes involved in Antiviral mechanism by IFN-stimulated genes |
| 0.0 | 0.2 | REACTOME PLATELET AGGREGATION PLUG FORMATION | Genes involved in Platelet Aggregation (Plug Formation) |
| 0.0 | 0.3 | REACTOME INTEGRIN CELL SURFACE INTERACTIONS | Genes involved in Integrin cell surface interactions |