Project
GSE53960: rat RNA-Seq transcriptomic Bodymap
Navigation
Downloads
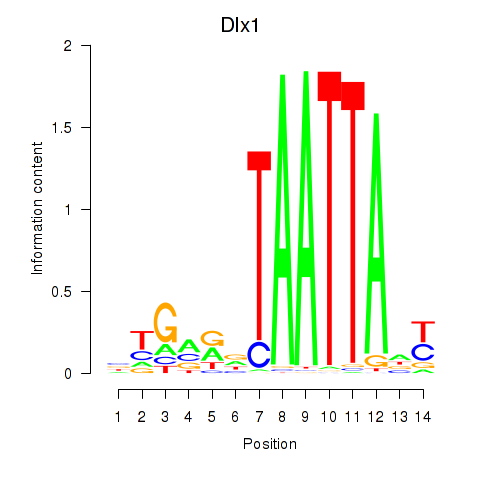
Results for Dlx1
Z-value: 1.48
Motif logo
Transcription factors associated with Dlx1
| Gene Symbol | Gene ID | Gene Info |
|---|---|---|
|
Dlx1
|
ENSRNOG00000001520 | distal-less homeobox 1 |
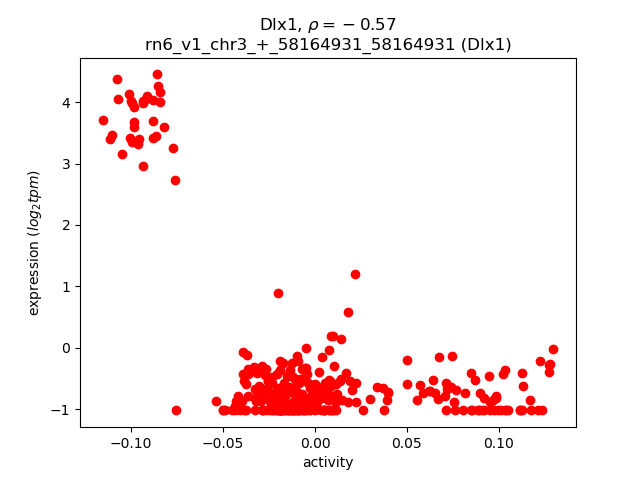
Activity-expression correlation:
| Gene | Promoter | Pearson corr. coef. | P-value | Plot |
|---|---|---|---|---|
| Dlx1 | rn6_v1_chr3_+_58164931_58164931 | -0.57 | 2.2e-28 | Click! |
Activity profile of Dlx1 motif
Sorted Z-values of Dlx1 motif
| Promoter | Log-likelihood | Transcript | Gene | Gene Info |
|---|---|---|---|---|
| chr2_-_216348194 | 83.83 |
ENSRNOT00000087839
|
LOC103689940
|
pancreatic alpha-amylase-like |
| chr2_-_216382244 | 71.50 |
ENSRNOT00000086695
ENSRNOT00000087259 |
LOC103689940
|
pancreatic alpha-amylase-like |
| chr11_+_85532526 | 66.86 |
ENSRNOT00000036565
|
AABR07034730.2
|
|
| chr3_-_16999720 | 58.80 |
ENSRNOT00000074382
|
RGD1563231
|
similar to immunoglobulin kappa-chain VK-1 |
| chr4_-_163049084 | 58.30 |
ENSRNOT00000091644
|
Cd69
|
Cd69 molecule |
| chr6_-_142903440 | 57.57 |
ENSRNOT00000075707
|
AABR07065823.2
|
|
| chr3_+_19045214 | 55.75 |
ENSRNOT00000070878
|
AABR07051670.1
|
|
| chr18_+_55666027 | 55.36 |
ENSRNOT00000045950
|
RGD1305184
|
similar to CDNA sequence BC023105 |
| chr10_-_34242985 | 50.99 |
ENSRNOT00000046438
|
RGD1559575
|
similar to novel protein |
| chr10_-_56506446 | 50.98 |
ENSRNOT00000021357
|
Acap1
|
ArfGAP with coiled-coil, ankyrin repeat and PH domains 1 |
| chr9_-_23493081 | 45.97 |
ENSRNOT00000072144
|
Rhag
|
Rh-associated glycoprotein |
| chr13_+_48426820 | 45.88 |
ENSRNOT00000048391
|
Ctse
|
cathepsin E |
| chr3_+_18970574 | 45.35 |
ENSRNOT00000088394
|
AABR07051665.1
|
|
| chr13_+_82369493 | 44.97 |
ENSRNOT00000003733
|
Sell
|
selectin L |
| chr6_-_143195445 | 44.88 |
ENSRNOT00000078672
|
AABR07065837.1
|
|
| chr3_+_16753703 | 44.16 |
ENSRNOT00000077741
|
AABR07051548.2
|
|
| chrX_+_78372257 | 42.97 |
ENSRNOT00000046164
|
Gpr174
|
G protein-coupled receptor 174 |
| chr4_+_98481520 | 40.53 |
ENSRNOT00000078381
ENSRNOT00000048493 |
AABR07060886.1
|
|
| chr3_+_72395218 | 40.35 |
ENSRNOT00000057616
|
Prg3
|
proteoglycan 3, pro eosinophil major basic protein 2 |
| chr3_-_160802433 | 38.13 |
ENSRNOT00000076191
|
Slpi
|
secretory leukocyte peptidase inhibitor |
| chr3_+_16846412 | 37.37 |
ENSRNOT00000074266
|
AABR07051551.1
|
|
| chr18_+_55463308 | 36.90 |
ENSRNOT00000073388
|
LOC100910979
|
interferon-inducible GTPase 1-like |
| chr4_+_93791054 | 36.84 |
ENSRNOT00000042300
|
AABR07060788.1
|
|
| chr18_+_55505993 | 35.96 |
ENSRNOT00000043736
|
RGD1309362
|
similar to interferon-inducible GTPase |
| chr7_-_18793289 | 35.63 |
ENSRNOT00000036375
|
AABR07056026.1
|
|
| chr3_+_17889972 | 35.46 |
ENSRNOT00000073021
|
AABR07051611.1
|
|
| chr18_+_55391388 | 34.90 |
ENSRNOT00000071612
|
LOC100910934
|
interferon-inducible GTPase 1-like |
| chr3_+_20303979 | 33.60 |
ENSRNOT00000058331
|
AABR07051730.1
|
|
| chr11_+_85561460 | 33.29 |
ENSRNOT00000075455
|
AABR07072262.1
|
|
| chr3_-_20695952 | 33.20 |
ENSRNOT00000072306
|
AABR07051746.1
|
|
| chr3_+_20375699 | 33.04 |
ENSRNOT00000088492
|
AABR07051731.1
|
|
| chr16_-_31301880 | 32.71 |
ENSRNOT00000084847
ENSRNOT00000083943 |
AABR07025272.1
|
|
| chr3_-_20419417 | 32.65 |
ENSRNOT00000077772
|
AABR07051733.3
|
|
| chr6_-_139911839 | 32.64 |
ENSRNOT00000077113
ENSRNOT00000084547 |
AABR07065714.1
|
|
| chr4_+_69386698 | 32.51 |
ENSRNOT00000091655
|
Trbv13-2
|
T cell receptor beta, variable 13-2 |
| chr6_-_140880070 | 32.30 |
ENSRNOT00000073779
|
LOC691828
|
uncharacterized LOC691828 |
| chr13_+_48427038 | 32.20 |
ENSRNOT00000009241
|
Ctse
|
cathepsin E |
| chr4_-_164453171 | 31.67 |
ENSRNOT00000077539
ENSRNOT00000083610 ENSRNOT00000079975 |
Ly49s6
|
Ly49 stimulatory receptor 6 |
| chr4_-_167202106 | 31.64 |
ENSRNOT00000038581
|
Tas2r140
|
taste receptor, type 2, member 140 |
| chr6_-_141147264 | 31.14 |
ENSRNOT00000042900
|
LOC100361105
|
Igh protein-like |
| chr4_+_93959152 | 31.10 |
ENSRNOT00000058437
|
AABR07060795.1
|
|
| chr7_-_107392972 | 30.82 |
ENSRNOT00000093425
|
Tmem71
|
transmembrane protein 71 |
| chr4_+_101687327 | 30.50 |
ENSRNOT00000082501
|
AABR07060957.1
|
|
| chr2_+_187447501 | 30.04 |
ENSRNOT00000038589
|
Iqgap3
|
IQ motif containing GTPase activating protein 3 |
| chr1_-_227932603 | 29.86 |
ENSRNOT00000033795
|
Ms4a6a
|
membrane spanning 4-domains A6A |
| chr8_-_114617466 | 29.79 |
ENSRNOT00000082992
ENSRNOT00000038160 |
Col6a5
|
collagen type VI alpha 5 chain |
| chr6_+_139405966 | 29.01 |
ENSRNOT00000088974
|
AABR07065693.3
|
|
| chr15_-_59215803 | 28.87 |
ENSRNOT00000032301
|
Lacc1
|
laccase domain containing 1 |
| chr3_-_148057523 | 28.52 |
ENSRNOT00000055408
|
Defb24
|
defensin beta 24 |
| chr14_+_5928737 | 28.46 |
ENSRNOT00000071877
ENSRNOT00000040985 ENSRNOT00000074889 |
Mpa2l
|
macrophage activation 2 like |
| chr2_+_223121410 | 28.34 |
ENSRNOT00000087559
|
AABR07013116.1
|
|
| chr8_-_104155775 | 28.30 |
ENSRNOT00000042885
|
LOC102550734
|
60S ribosomal protein L31-like |
| chr3_+_19174027 | 27.79 |
ENSRNOT00000074445
|
AABR07051678.1
|
|
| chr20_-_1339488 | 27.75 |
ENSRNOT00000041074
|
RT1-M2
|
RT1 class Ib, locus M2 |
| chr4_+_102665529 | 27.73 |
ENSRNOT00000082333
|
AABR07061005.1
|
|
| chr4_+_22898527 | 27.53 |
ENSRNOT00000072455
ENSRNOT00000076123 |
Dbf4
|
DBF4 zinc finger |
| chr6_-_138852571 | 27.11 |
ENSRNOT00000081803
|
AABR07065656.8
|
|
| chr4_+_102262007 | 26.79 |
ENSRNOT00000079328
|
AABR07060992.2
|
|
| chr19_+_3325893 | 26.73 |
ENSRNOT00000048879
|
RGD1565617
|
similar to Ig variable region, light chain |
| chr4_-_163463718 | 26.73 |
ENSRNOT00000085671
|
Klrc1
|
killer cell lectin like receptor C1 |
| chr2_+_88217188 | 26.65 |
ENSRNOT00000014267
|
Car1
|
carbonic anhydrase I |
| chr15_-_28081465 | 26.43 |
ENSRNOT00000033739
|
Rnase6
|
ribonuclease, RNase A family, 6 |
| chr3_-_20479999 | 26.42 |
ENSRNOT00000050573
|
AABR07051733.2
|
|
| chr14_-_5859581 | 26.11 |
ENSRNOT00000052308
|
AABR07014241.1
|
|
| chr3_-_19320915 | 25.68 |
ENSRNOT00000043673
|
RGD1565617
|
similar to Ig variable region, light chain |
| chr8_+_2604962 | 25.38 |
ENSRNOT00000009993
|
Casp1
|
caspase 1 |
| chr3_-_153114520 | 24.70 |
ENSRNOT00000008254
|
Dsn1
|
DSN1 homolog, MIS12 kinetochore complex component |
| chr6_-_141291347 | 24.38 |
ENSRNOT00000008333
|
AABR07065789.1
|
|
| chr6_-_143206772 | 24.35 |
ENSRNOT00000073713
|
AABR07065839.1
|
|
| chr4_+_101949285 | 23.71 |
ENSRNOT00000058446
|
AABR07060963.3
|
|
| chr3_-_166993940 | 23.61 |
ENSRNOT00000034669
|
Zfp217
|
zinc finger protein 217 |
| chr9_+_92681078 | 23.29 |
ENSRNOT00000034152
|
Sp100
|
SP100 nuclear antigen |
| chr4_-_163762434 | 23.06 |
ENSRNOT00000081854
|
Ly49si1
|
immunoreceptor Ly49si1 |
| chr6_-_139747737 | 23.03 |
ENSRNOT00000090626
|
AABR07065705.3
|
|
| chr17_+_24416651 | 23.02 |
ENSRNOT00000024458
|
Cd83
|
CD83 molecule |
| chr3_-_94808861 | 22.99 |
ENSRNOT00000038464
|
Prrg4
|
proline rich and Gla domain 4 |
| chr3_+_16571602 | 22.85 |
ENSRNOT00000048351
|
LOC100361705
|
rCG64259-like |
| chr3_-_166994286 | 22.78 |
ENSRNOT00000081593
|
Zfp217
|
zinc finger protein 217 |
| chr4_-_164211819 | 22.24 |
ENSRNOT00000084796
|
LOC497796
|
hypothetical protein LOC497796 |
| chr10_-_110232843 | 22.16 |
ENSRNOT00000054934
|
Cd7
|
Cd7 molecule |
| chrX_-_135250519 | 21.99 |
ENSRNOT00000044487
|
Elf4
|
E74 like ETS transcription factor 4 |
| chr20_+_4020317 | 21.94 |
ENSRNOT00000000526
|
RT1-DOb
|
RT1 class II, locus DOb |
| chr2_-_173668555 | 21.44 |
ENSRNOT00000013452
|
Serpini2
|
serpin family I member 2 |
| chr15_+_32828165 | 21.34 |
ENSRNOT00000060253
|
AABR07017902.1
|
|
| chr1_-_252461461 | 21.33 |
ENSRNOT00000026093
|
Ankrd22
|
ankyrin repeat domain 22 |
| chr20_+_4106189 | 21.26 |
ENSRNOT00000042571
|
RT1-Db2
|
RT1 class II, locus Db2 |
| chr14_-_21299068 | 21.18 |
ENSRNOT00000065778
|
Amtn
|
amelotin |
| chr2_+_240396152 | 21.13 |
ENSRNOT00000034565
|
Cenpe
|
centromere protein E |
| chr17_-_12669573 | 21.10 |
ENSRNOT00000016942
ENSRNOT00000041726 |
Syk
|
spleen associated tyrosine kinase |
| chr20_+_3155652 | 21.09 |
ENSRNOT00000042882
|
RT1-S2
|
RT1 class Ib, locus S2 |
| chr1_-_189182306 | 21.05 |
ENSRNOT00000021249
|
Gp2
|
glycoprotein 2 |
| chr4_+_14001761 | 21.02 |
ENSRNOT00000076519
|
Cd36
|
CD36 molecule |
| chr4_-_163849618 | 20.79 |
ENSRNOT00000086363
ENSRNOT00000077637 |
Ly49si1
|
immunoreceptor Ly49si1 |
| chr13_-_50916982 | 20.78 |
ENSRNOT00000004408
|
Btg2
|
BTG anti-proliferation factor 2 |
| chr6_-_142353308 | 20.76 |
ENSRNOT00000066416
|
AABR07065814.2
|
|
| chr11_-_43022565 | 20.75 |
ENSRNOT00000002285
|
Riox2
|
ribosomal oxygenase 2 |
| chr8_-_133128290 | 20.49 |
ENSRNOT00000008783
|
Ccr1l1
|
chemokine (C-C motif) receptor 1-like 1 |
| chr17_-_28191436 | 20.47 |
ENSRNOT00000000149
|
Ly86
|
lymphocyte antigen 86 |
| chr3_-_16753987 | 20.29 |
ENSRNOT00000091257
|
AABR07051548.1
|
|
| chr14_+_1937041 | 20.26 |
ENSRNOT00000000040
|
Tmed11
|
transmembrane emp24 protein transport domain containing 11 |
| chr6_-_143702033 | 20.23 |
ENSRNOT00000051410
|
AABR07065886.1
|
|
| chr3_+_20163337 | 20.18 |
ENSRNOT00000075136
|
AABR07051726.1
|
|
| chr2_+_80269661 | 19.98 |
ENSRNOT00000015975
|
AABR07008940.1
|
|
| chr9_-_95362014 | 19.95 |
ENSRNOT00000051065
|
Hjurp
|
Holliday junction recognition protein |
| chr3_+_19366370 | 19.85 |
ENSRNOT00000086557
|
AABR07051689.1
|
|
| chr2_+_206342066 | 19.84 |
ENSRNOT00000026556
|
Ptpn22
|
protein tyrosine phosphatase, non-receptor type 22 |
| chr3_+_16817051 | 19.83 |
ENSRNOT00000071666
|
AABR07051550.1
|
|
| chr14_+_44889287 | 19.76 |
ENSRNOT00000091312
ENSRNOT00000032273 |
Tmem156
|
transmembrane protein 156 |
| chr7_-_143324536 | 19.75 |
ENSRNOT00000011644
|
Krt5
|
keratin 5 |
| chr7_-_107385528 | 19.63 |
ENSRNOT00000093352
|
Tmem71
|
transmembrane protein 71 |
| chr4_+_102794168 | 19.63 |
ENSRNOT00000048400
|
AABR07061022.1
|
|
| chr6_-_142372031 | 19.62 |
ENSRNOT00000063929
|
AABR07065814.3
|
|
| chr6_-_125723732 | 19.57 |
ENSRNOT00000084815
|
Fbln5
|
fibulin 5 |
| chr3_-_153001309 | 19.43 |
ENSRNOT00000027581
|
Sla2
|
Src-like-adaptor 2 |
| chr11_-_14304603 | 19.34 |
ENSRNOT00000040202
ENSRNOT00000082143 |
Samsn1
|
SAM domain, SH3 domain and nuclear localization signals, 1 |
| chr5_-_151459037 | 19.23 |
ENSRNOT00000064472
ENSRNOT00000087836 |
Sytl1
|
synaptotagmin-like 1 |
| chr8_+_22559098 | 19.00 |
ENSRNOT00000041091
|
LOC691141
|
hypothetical protein LOC691141 |
| chr1_+_22332090 | 18.78 |
ENSRNOT00000091252
|
AABR07000663.1
|
trace amine-associated receptor 8c (Taar8c), mRNA |
| chr5_+_24410863 | 18.76 |
ENSRNOT00000010591
|
Tp53inp1
|
tumor protein p53 inducible nuclear protein 1 |
| chr6_-_142585188 | 18.68 |
ENSRNOT00000067437
|
AABR07065815.1
|
|
| chr14_+_76732650 | 18.61 |
ENSRNOT00000088197
|
Clnk
|
cytokine-dependent hematopoietic cell linker |
| chr4_-_164406146 | 18.60 |
ENSRNOT00000090110
|
Klra22
|
killer cell lectin-like receptor subfamily A, member 22 |
| chr1_+_196095214 | 18.52 |
ENSRNOT00000080741
|
LOC691716
|
similar to ribosomal protein S15a |
| chr11_+_85042348 | 18.50 |
ENSRNOT00000042220
|
AABR07034718.1
|
|
| chr10_+_34277993 | 18.34 |
ENSRNOT00000055872
ENSRNOT00000003343 |
Ifi47
|
interferon gamma inducible protein 47 |
| chr10_-_67401836 | 18.16 |
ENSRNOT00000073071
|
Crlf3
|
cytokine receptor-like factor 3 |
| chr13_+_82438697 | 18.14 |
ENSRNOT00000003759
|
Selp
|
selectin P |
| chr4_+_101531378 | 18.12 |
ENSRNOT00000087546
|
AABR07060944.1
|
|
| chr9_+_71915421 | 17.99 |
ENSRNOT00000020447
|
Pikfyve
|
phosphoinositide kinase, FYVE-type zinc finger containing |
| chr9_+_67774150 | 17.94 |
ENSRNOT00000091060
|
Icos
|
inducible T-cell co-stimulator |
| chr16_+_2634603 | 17.94 |
ENSRNOT00000019113
|
Hesx1
|
HESX homeobox 1 |
| chr4_-_163954817 | 17.79 |
ENSRNOT00000079951
|
Ly49si3
|
immunoreceptor Ly49si3 |
| chr2_-_149432106 | 17.64 |
ENSRNOT00000051027
|
P2ry13
|
purinergic receptor P2Y13 |
| chr1_+_15834779 | 17.54 |
ENSRNOT00000079069
ENSRNOT00000083012 |
Bclaf1
|
BCL2-associated transcription factor 1 |
| chr15_-_29446332 | 17.51 |
ENSRNOT00000082901
|
AABR07017634.1
|
|
| chr10_-_29026002 | 17.31 |
ENSRNOT00000005070
|
Pttg1
|
pituitary tumor-transforming 1 |
| chr4_-_103761881 | 17.18 |
ENSRNOT00000084103
|
AABR07061087.1
|
|
| chr11_-_28900376 | 17.08 |
ENSRNOT00000061606
|
Krtap16-5
|
keratin associated protein 16-5 |
| chr2_-_60657712 | 17.05 |
ENSRNOT00000040348
|
Rai14
|
retinoic acid induced 14 |
| chr1_+_227240383 | 16.99 |
ENSRNOT00000074127
|
Ms4a6e
|
membrane spanning 4-domains A6E |
| chr3_+_18787606 | 16.86 |
ENSRNOT00000090508
|
AABR07051658.1
|
|
| chr4_+_162077188 | 16.82 |
ENSRNOT00000090431
|
LOC100910725
|
C-type lectin domain family 2 member D-related protein-like |
| chr10_-_90307658 | 16.67 |
ENSRNOT00000092102
|
Slc4a1
|
solute carrier family 4 member 1 |
| chr16_+_29674793 | 16.53 |
ENSRNOT00000059724
|
Anxa10
|
annexin A10 |
| chr10_-_87564327 | 16.42 |
ENSRNOT00000064760
ENSRNOT00000068237 |
LOC680160
|
similar to keratin associated protein 4-7 |
| chr6_-_138764901 | 16.31 |
ENSRNOT00000075175
|
AABR07065651.2
|
|
| chrX_+_105011489 | 16.28 |
ENSRNOT00000085068
|
Arl13a
|
ADP ribosylation factor like GTPase 13A |
| chr20_+_3176107 | 16.26 |
ENSRNOT00000001036
|
RT1-S3
|
RT1 class Ib, locus S3 |
| chr3_+_17139670 | 16.25 |
ENSRNOT00000073316
|
AABR07051564.1
|
|
| chr15_+_61826937 | 16.12 |
ENSRNOT00000084005
ENSRNOT00000079417 |
Elf1
|
E74-like factor 1 |
| chr9_+_91001828 | 16.05 |
ENSRNOT00000080956
|
AABR07068214.1
|
|
| chr4_+_169147243 | 16.04 |
ENSRNOT00000011580
|
Emp1
|
epithelial membrane protein 1 |
| chr1_+_141767940 | 15.96 |
ENSRNOT00000064034
|
Zfp710
|
zinc finger protein 710 |
| chr10_-_56270640 | 15.91 |
ENSRNOT00000056918
|
Cd68
|
Cd68 molecule |
| chr4_-_164049599 | 15.91 |
ENSRNOT00000078267
|
AABR07062183.1
|
|
| chr5_+_126668689 | 15.75 |
ENSRNOT00000036072
|
Cyb5rl
|
cytochrome b5 reductase-like |
| chr11_+_31539016 | 15.66 |
ENSRNOT00000072856
|
Ifnar2
|
interferon alpha and beta receptor subunit 2 |
| chr1_-_198450047 | 15.53 |
ENSRNOT00000027360
|
Mvp
|
major vault protein |
| chr1_+_201660042 | 15.52 |
ENSRNOT00000093289
ENSRNOT00000054910 |
Dmbt1
|
deleted in malignant brain tumors 1 |
| chr4_+_93888502 | 15.45 |
ENSRNOT00000090783
|
AABR07060792.1
|
|
| chr1_+_86938138 | 15.44 |
ENSRNOT00000075601
|
Ccer2
|
coiled-coil glutamate-rich protein 2 |
| chr18_+_16330615 | 15.26 |
ENSRNOT00000049689
|
RGD1559877
|
similar to 60S ribosomal protein L29 (P23) |
| chr9_+_65614142 | 15.19 |
ENSRNOT00000016613
|
Casp8
|
caspase 8 |
| chr1_+_253221812 | 15.05 |
ENSRNOT00000085880
ENSRNOT00000054753 |
Kif20b
|
kinesin family member 20B |
| chr2_-_182846061 | 15.02 |
ENSRNOT00000013025
|
Tlr2
|
toll-like receptor 2 |
| chr4_-_162230859 | 14.97 |
ENSRNOT00000042872
|
LOC689757
|
similar to osteoclast inhibitory lectin |
| chrX_-_157200981 | 14.96 |
ENSRNOT00000087364
|
AABR07071935.1
|
|
| chr1_-_99587205 | 14.83 |
ENSRNOT00000048947
|
Siglec8
|
sialic acid binding Ig-like lectin 8 |
| chr3_+_17180411 | 14.80 |
ENSRNOT00000058260
|
AABR07051565.1
|
|
| chr6_-_140215907 | 14.78 |
ENSRNOT00000086370
|
AABR07065750.1
|
|
| chr8_+_22368745 | 14.71 |
ENSRNOT00000049973
|
Slc44a2
|
solute carrier family 44 member 2 |
| chr20_+_3246739 | 14.71 |
ENSRNOT00000061299
|
RT1-T24-2
|
RT1 class I, locus T24, gene 2 |
| chr10_+_31880918 | 14.68 |
ENSRNOT00000059448
|
Timd4
|
T-cell immunoglobulin and mucin domain containing 4 |
| chr10_+_69412017 | 14.64 |
ENSRNOT00000009448
|
Ccl2
|
C-C motif chemokine ligand 2 |
| chr11_+_88131960 | 14.58 |
ENSRNOT00000046664
|
RGD1308065
|
hypothetical LOC287935 |
| chr5_-_12172009 | 14.49 |
ENSRNOT00000061903
|
Pcmtd1
|
protein-L-isoaspartate (D-aspartate) O-methyltransferase domain containing 1 |
| chr9_-_82345262 | 14.43 |
ENSRNOT00000024975
|
Cnppd1
|
cyclin Pas1/PHO80 domain containing 1 |
| chr4_+_169161585 | 14.35 |
ENSRNOT00000079785
|
Emp1
|
epithelial membrane protein 1 |
| chr13_-_83457888 | 14.18 |
ENSRNOT00000076289
ENSRNOT00000004065 |
Sft2d2
|
SFT2 domain containing 2 |
| chr16_+_90613870 | 14.16 |
ENSRNOT00000079334
|
Shcbp1
|
SHC binding and spindle associated 1 |
| chr7_+_140608434 | 14.14 |
ENSRNOT00000001163
|
AC114446.1
|
|
| chr4_-_163810403 | 14.08 |
ENSRNOT00000079704
|
AABR07062170.1
|
|
| chr1_-_43638161 | 13.93 |
ENSRNOT00000024460
|
Ipcef1
|
interaction protein for cytohesin exchange factors 1 |
| chr20_-_6257604 | 13.88 |
ENSRNOT00000092489
|
Stk38
|
serine/threonine kinase 38 |
| chr7_+_16404755 | 13.86 |
ENSRNOT00000044977
|
LOC108349290
|
olfactory receptor 6C70-like |
| chr1_-_189181901 | 13.70 |
ENSRNOT00000092022
|
Gp2
|
glycoprotein 2 |
| chr4_-_70659252 | 13.70 |
ENSRNOT00000048049
|
Try10
|
trypsin 10 |
| chr5_+_50381244 | 13.62 |
ENSRNOT00000012385
|
Cga
|
glycoprotein hormones, alpha polypeptide |
| chr14_-_21252538 | 13.58 |
ENSRNOT00000005003
|
Ambn
|
ameloblastin |
| chr18_+_79773608 | 13.53 |
ENSRNOT00000088484
|
Zfp516
|
zinc finger protein 516 |
| chr4_-_164691405 | 13.42 |
ENSRNOT00000090979
ENSRNOT00000091932 ENSRNOT00000078219 |
Ly49s4
Ly49i2
|
Ly49 stimulatory receptor 4 Ly49 inhibitory receptor 2 |
| chr10_-_56962161 | 13.41 |
ENSRNOT00000026038
|
Alox15
|
arachidonate 15-lipoxygenase |
| chr10_+_55626741 | 13.36 |
ENSRNOT00000008492
|
Aurkb
|
aurora kinase B |
| chr13_-_91735361 | 13.33 |
ENSRNOT00000058090
|
Fcer1a
|
Fc fragment of IgE receptor Ia |
| chr3_+_18805220 | 13.30 |
ENSRNOT00000071216
|
Igkv4-86
|
immunoglobulin kappa variable 4-86 |
| chr8_+_22648323 | 13.20 |
ENSRNOT00000013165
|
Smarca4
|
SWI/SNF related, matrix associated, actin dependent regulator of chromatin, subfamily a, member 4 |
| chr13_-_99101208 | 13.05 |
ENSRNOT00000004329
|
H3f3a
|
H3 histone family member 3A |
| chr17_+_25082056 | 13.04 |
ENSRNOT00000037041
|
AABR07027339.1
|
|
| chr7_+_144865608 | 13.04 |
ENSRNOT00000091596
ENSRNOT00000055285 |
Hnrnpa1
|
heterogeneous nuclear ribonucleoprotein A1 |
| chr13_+_89386023 | 13.04 |
ENSRNOT00000086223
|
Fcgr3a
|
Fc fragment of IgG receptor IIIa |
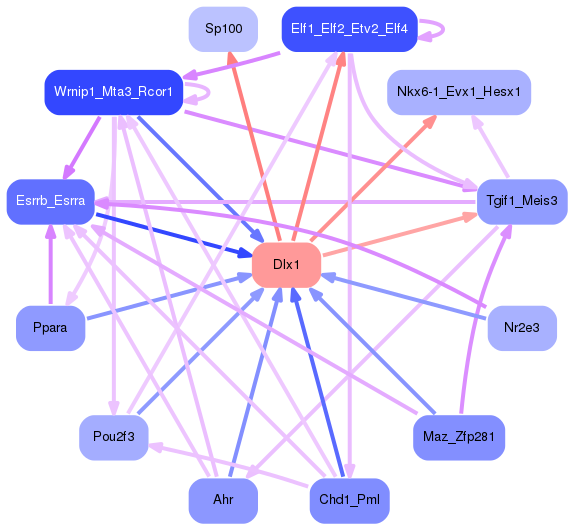
Network of associatons between targets according to the STRING database.

First level regulatory network of Dlx1
Gene Ontology Analysis
Gene overrepresentation in biological process category:
| Log-likelihood per target | Total log-likelihood | Term | Description |
|---|---|---|---|
| 13.5 | 40.4 | GO:0045575 | basophil activation(GO:0045575) |
| 11.5 | 34.4 | GO:0045425 | positive regulation of interleukin-3 production(GO:0032752) interleukin-3 biosynthetic process(GO:0042223) regulation of interleukin-3 biosynthetic process(GO:0045399) positive regulation of interleukin-3 biosynthetic process(GO:0045401) positive regulation of granulocyte macrophage colony-stimulating factor biosynthetic process(GO:0045425) |
| 8.7 | 34.8 | GO:0002386 | immune response in mucosal-associated lymphoid tissue(GO:0002386) |
| 7.8 | 23.3 | GO:1902044 | regulation of Fas signaling pathway(GO:1902044) |
| 7.3 | 66.0 | GO:0070543 | response to linoleic acid(GO:0070543) |
| 7.3 | 21.9 | GO:0002581 | negative regulation of antigen processing and presentation of peptide or polysaccharide antigen via MHC class II(GO:0002581) |
| 7.3 | 21.8 | GO:0070175 | positive regulation of enamel mineralization(GO:0070175) |
| 7.2 | 36.1 | GO:2000566 | positive regulation of CD8-positive, alpha-beta T cell proliferation(GO:2000566) |
| 6.6 | 6.6 | GO:0032672 | regulation of interleukin-3 production(GO:0032672) |
| 6.6 | 46.0 | GO:0015670 | carbon dioxide transport(GO:0015670) |
| 6.3 | 25.4 | GO:0050717 | positive regulation of interleukin-1 alpha secretion(GO:0050717) |
| 6.3 | 18.8 | GO:0036446 | myofibroblast differentiation(GO:0036446) response to methyl methanesulfonate(GO:0072702) cellular response to methyl methanesulfonate(GO:0072703) regulation of myofibroblast differentiation(GO:1904760) |
| 5.5 | 16.4 | GO:0098507 | polynucleotide 5' dephosphorylation(GO:0098507) |
| 5.5 | 32.9 | GO:1902101 | positive regulation of mitotic metaphase/anaphase transition(GO:0045842) positive regulation of mitotic sister chromatid separation(GO:1901970) positive regulation of metaphase/anaphase transition of cell cycle(GO:1902101) |
| 5.2 | 78.1 | GO:0016540 | protein autoprocessing(GO:0016540) |
| 5.0 | 15.1 | GO:0033123 | positive regulation of purine nucleotide catabolic process(GO:0033123) |
| 5.0 | 15.1 | GO:1902412 | regulation of mitotic cytokinesis(GO:1902412) |
| 5.0 | 15.0 | GO:0042496 | central nervous system myelin formation(GO:0032289) positive regulation of interleukin-18 production(GO:0032741) detection of diacyl bacterial lipopeptide(GO:0042496) detection of bacterial lipopeptide(GO:0070340) |
| 5.0 | 20.0 | GO:0061641 | CENP-A containing nucleosome assembly(GO:0034080) CENP-A containing chromatin organization(GO:0061641) |
| 4.9 | 14.8 | GO:0060101 | negative regulation of phagocytosis, engulfment(GO:0060101) |
| 4.9 | 14.6 | GO:2000502 | negative regulation of natural killer cell chemotaxis(GO:2000502) |
| 4.4 | 13.2 | GO:1902659 | regulation of glucose mediated signaling pathway(GO:1902659) |
| 4.3 | 12.8 | GO:1903595 | pancreatic amylase secretion(GO:0036395) regulation of pancreatic amylase secretion(GO:1902276) positive regulation of histamine secretion by mast cell(GO:1903595) |
| 4.2 | 16.7 | GO:0010037 | response to carbon dioxide(GO:0010037) |
| 4.2 | 153.9 | GO:0035458 | cellular response to interferon-beta(GO:0035458) |
| 4.1 | 56.8 | GO:0001867 | complement activation, lectin pathway(GO:0001867) |
| 4.0 | 24.3 | GO:0001866 | NK T cell proliferation(GO:0001866) |
| 3.7 | 37.1 | GO:0048251 | elastic fiber assembly(GO:0048251) |
| 3.6 | 10.8 | GO:2000424 | regulation of eosinophil chemotaxis(GO:2000422) positive regulation of eosinophil chemotaxis(GO:2000424) |
| 3.6 | 10.8 | GO:1902167 | positive regulation of intrinsic apoptotic signaling pathway in response to DNA damage by p53 class mediator(GO:1902167) |
| 3.4 | 20.5 | GO:0031666 | positive regulation of lipopolysaccharide-mediated signaling pathway(GO:0031666) |
| 3.3 | 23.0 | GO:0032713 | negative regulation of interleukin-4 production(GO:0032713) |
| 3.3 | 13.0 | GO:1903936 | cellular response to sodium arsenite(GO:1903936) |
| 3.2 | 9.5 | GO:0072344 | rescue of stalled ribosome(GO:0072344) |
| 3.2 | 15.8 | GO:0060623 | regulation of chromosome condensation(GO:0060623) |
| 3.1 | 15.6 | GO:0060478 | acrosomal vesicle exocytosis(GO:0060478) |
| 3.0 | 11.8 | GO:0032661 | regulation of interleukin-18 production(GO:0032661) |
| 2.9 | 11.7 | GO:1900245 | positive regulation of MDA-5 signaling pathway(GO:1900245) |
| 2.9 | 11.5 | GO:0043988 | histone H3-S28 phosphorylation(GO:0043988) |
| 2.8 | 16.6 | GO:1901898 | negative regulation of relaxation of cardiac muscle(GO:1901898) |
| 2.7 | 13.4 | GO:0051122 | hepoxilin metabolic process(GO:0051121) hepoxilin biosynthetic process(GO:0051122) |
| 2.6 | 7.8 | GO:0060383 | positive regulation of DNA strand elongation(GO:0060383) |
| 2.6 | 18.0 | GO:0030916 | otic vesicle formation(GO:0030916) |
| 2.5 | 24.5 | GO:0070544 | histone H3-K36 demethylation(GO:0070544) |
| 2.3 | 6.9 | GO:2000464 | positive regulation of astrocyte chemotaxis(GO:2000464) |
| 2.3 | 6.8 | GO:1901726 | negative regulation of histone deacetylase activity(GO:1901726) |
| 2.2 | 11.1 | GO:0061743 | motor learning(GO:0061743) |
| 2.2 | 6.5 | GO:2000259 | activation of membrane attack complex(GO:0001905) regulation of activation of membrane attack complex(GO:0001969) positive regulation of complement activation(GO:0045917) positive regulation of protein activation cascade(GO:2000259) |
| 2.1 | 8.6 | GO:1900170 | negative regulation of glucocorticoid mediated signaling pathway(GO:1900170) |
| 2.1 | 4.3 | GO:0060003 | copper ion export(GO:0060003) |
| 2.1 | 16.8 | GO:0042270 | protection from natural killer cell mediated cytotoxicity(GO:0042270) |
| 2.1 | 16.7 | GO:0010606 | positive regulation of cytoplasmic mRNA processing body assembly(GO:0010606) |
| 2.0 | 10.2 | GO:0019371 | cyclooxygenase pathway(GO:0019371) |
| 2.0 | 22.4 | GO:0002430 | complement receptor mediated signaling pathway(GO:0002430) |
| 2.0 | 4.0 | GO:0000294 | nuclear-transcribed mRNA catabolic process, endonucleolytic cleavage-dependent decay(GO:0000294) |
| 2.0 | 12.1 | GO:2000483 | negative regulation of interleukin-8 secretion(GO:2000483) |
| 1.9 | 11.7 | GO:0031087 | deadenylation-independent decapping of nuclear-transcribed mRNA(GO:0031087) |
| 1.9 | 5.8 | GO:0009099 | branched-chain amino acid biosynthetic process(GO:0009082) leucine biosynthetic process(GO:0009098) valine biosynthetic process(GO:0009099) |
| 1.9 | 3.8 | GO:2000328 | regulation of T-helper 17 cell lineage commitment(GO:2000328) |
| 1.9 | 20.8 | GO:0060211 | regulation of nuclear-transcribed mRNA poly(A) tail shortening(GO:0060211) positive regulation of nuclear-transcribed mRNA poly(A) tail shortening(GO:0060213) |
| 1.9 | 9.4 | GO:0031119 | tRNA pseudouridine synthesis(GO:0031119) |
| 1.9 | 22.2 | GO:0033601 | positive regulation of mammary gland epithelial cell proliferation(GO:0033601) |
| 1.8 | 9.1 | GO:0060327 | cytoplasmic actin-based contraction involved in cell motility(GO:0060327) |
| 1.8 | 25.4 | GO:0038094 | Fc-gamma receptor signaling pathway(GO:0038094) |
| 1.8 | 7.1 | GO:0071802 | negative regulation of podosome assembly(GO:0071802) |
| 1.7 | 10.3 | GO:0061737 | leukotriene signaling pathway(GO:0061737) |
| 1.6 | 6.5 | GO:0097680 | double-strand break repair via classical nonhomologous end joining(GO:0097680) |
| 1.6 | 4.9 | GO:1904976 | cellular response to bleomycin(GO:1904976) |
| 1.6 | 26.1 | GO:0032060 | bleb assembly(GO:0032060) |
| 1.6 | 4.9 | GO:0060488 | orthogonal dichotomous subdivision of terminal units involved in lung branching morphogenesis(GO:0060488) planar dichotomous subdivision of terminal units involved in lung branching morphogenesis(GO:0060489) lateral sprouting involved in lung morphogenesis(GO:0060490) |
| 1.6 | 4.8 | GO:0006933 | negative regulation of cell adhesion involved in substrate-bound cell migration(GO:0006933) |
| 1.6 | 4.8 | GO:0060435 | branchiomeric skeletal muscle development(GO:0014707) bronchiole development(GO:0060435) |
| 1.6 | 15.7 | GO:0035456 | response to interferon-beta(GO:0035456) |
| 1.6 | 15.5 | GO:0031953 | negative regulation of protein autophosphorylation(GO:0031953) |
| 1.5 | 4.5 | GO:0006663 | platelet activating factor biosynthetic process(GO:0006663) |
| 1.5 | 19.4 | GO:0050849 | negative regulation of calcium-mediated signaling(GO:0050849) |
| 1.5 | 14.9 | GO:0090070 | positive regulation of ribosome biogenesis(GO:0090070) positive regulation of rRNA processing(GO:2000234) |
| 1.5 | 20.5 | GO:0090026 | positive regulation of monocyte chemotaxis(GO:0090026) |
| 1.4 | 8.6 | GO:0043305 | negative regulation of mast cell degranulation(GO:0043305) |
| 1.4 | 4.3 | GO:0018199 | peptidyl-glutamine modification(GO:0018199) |
| 1.4 | 4.3 | GO:0002540 | leukotriene production involved in inflammatory response(GO:0002540) |
| 1.4 | 7.0 | GO:1900194 | negative regulation of oocyte maturation(GO:1900194) |
| 1.4 | 9.6 | GO:0000459 | exonucleolytic trimming involved in rRNA processing(GO:0000459) exonucleolytic trimming to generate mature 3'-end of 5.8S rRNA from tricistronic rRNA transcript (SSU-rRNA, 5.8S rRNA, LSU-rRNA)(GO:0000467) |
| 1.3 | 6.6 | GO:0010032 | meiotic chromosome condensation(GO:0010032) |
| 1.3 | 8.0 | GO:0071460 | cellular response to cell-matrix adhesion(GO:0071460) |
| 1.3 | 4.0 | GO:0014908 | myotube differentiation involved in skeletal muscle regeneration(GO:0014908) |
| 1.3 | 5.3 | GO:0009181 | purine nucleoside diphosphate catabolic process(GO:0009137) purine ribonucleoside diphosphate catabolic process(GO:0009181) |
| 1.3 | 6.5 | GO:0038145 | macrophage colony-stimulating factor signaling pathway(GO:0038145) |
| 1.3 | 18.1 | GO:0033623 | regulation of integrin activation(GO:0033623) |
| 1.3 | 5.2 | GO:2000354 | regulation of ovarian follicle development(GO:2000354) |
| 1.3 | 6.4 | GO:0032020 | ISG15-protein conjugation(GO:0032020) |
| 1.3 | 10.0 | GO:0031848 | protection from non-homologous end joining at telomere(GO:0031848) |
| 1.2 | 7.5 | GO:0042908 | xenobiotic transport(GO:0042908) |
| 1.2 | 9.9 | GO:0097264 | self proteolysis(GO:0097264) |
| 1.2 | 3.7 | GO:0032910 | transforming growth factor beta3 production(GO:0032907) regulation of transforming growth factor beta3 production(GO:0032910) positive regulation of transforming growth factor beta3 production(GO:0032916) |
| 1.2 | 9.8 | GO:0048387 | negative regulation of retinoic acid receptor signaling pathway(GO:0048387) |
| 1.2 | 20.7 | GO:0006590 | thyroid hormone generation(GO:0006590) |
| 1.2 | 3.5 | GO:1901367 | response to L-cysteine(GO:1901367) |
| 1.2 | 15.2 | GO:0036462 | TRAIL-activated apoptotic signaling pathway(GO:0036462) |
| 1.2 | 12.8 | GO:0045059 | positive thymic T cell selection(GO:0045059) |
| 1.2 | 4.7 | GO:1903334 | positive regulation of protein folding(GO:1903334) |
| 1.2 | 9.3 | GO:0051136 | regulation of NK T cell differentiation(GO:0051136) |
| 1.1 | 16.1 | GO:0002517 | T cell tolerance induction(GO:0002517) |
| 1.1 | 5.7 | GO:0035617 | stress granule disassembly(GO:0035617) |
| 1.1 | 37.1 | GO:0019731 | antibacterial humoral response(GO:0019731) |
| 1.1 | 5.6 | GO:0035188 | blastocyst hatching(GO:0001835) hatching(GO:0035188) organism emergence from protective structure(GO:0071684) |
| 1.1 | 40.5 | GO:0002474 | antigen processing and presentation of peptide antigen via MHC class I(GO:0002474) |
| 1.0 | 6.2 | GO:0002729 | positive regulation of natural killer cell cytokine production(GO:0002729) |
| 1.0 | 5.1 | GO:0010571 | positive regulation of nuclear cell cycle DNA replication(GO:0010571) |
| 1.0 | 21.3 | GO:0002504 | antigen processing and presentation of peptide or polysaccharide antigen via MHC class II(GO:0002504) |
| 1.0 | 19.8 | GO:0001833 | inner cell mass cell proliferation(GO:0001833) |
| 1.0 | 4.8 | GO:0006311 | meiotic gene conversion(GO:0006311) gene conversion(GO:0035822) |
| 1.0 | 11.6 | GO:0014029 | neural crest formation(GO:0014029) |
| 1.0 | 9.6 | GO:1900017 | positive regulation of cytokine production involved in inflammatory response(GO:1900017) |
| 0.9 | 7.4 | GO:0061087 | positive regulation of histone H3-K27 methylation(GO:0061087) |
| 0.9 | 9.0 | GO:0016266 | O-glycan processing(GO:0016266) |
| 0.9 | 4.4 | GO:1903251 | multi-ciliated epithelial cell differentiation(GO:1903251) |
| 0.9 | 2.6 | GO:0042222 | interleukin-1 biosynthetic process(GO:0042222) thymocyte migration(GO:0072679) |
| 0.9 | 5.2 | GO:0031584 | activation of phospholipase D activity(GO:0031584) |
| 0.8 | 6.8 | GO:0000395 | mRNA 5'-splice site recognition(GO:0000395) |
| 0.8 | 1.7 | GO:0044565 | dendritic cell proliferation(GO:0044565) |
| 0.8 | 16.1 | GO:0050860 | negative regulation of T cell receptor signaling pathway(GO:0050860) |
| 0.8 | 2.4 | GO:0039533 | regulation of MDA-5 signaling pathway(GO:0039533) negative regulation of MDA-5 signaling pathway(GO:0039534) |
| 0.8 | 9.5 | GO:0035589 | G-protein coupled purinergic nucleotide receptor signaling pathway(GO:0035589) |
| 0.8 | 7.0 | GO:0032790 | ribosome disassembly(GO:0032790) |
| 0.8 | 28.7 | GO:0006730 | one-carbon metabolic process(GO:0006730) |
| 0.8 | 2.3 | GO:0006438 | valyl-tRNA aminoacylation(GO:0006438) |
| 0.8 | 36.8 | GO:0050830 | defense response to Gram-positive bacterium(GO:0050830) |
| 0.7 | 2.2 | GO:1902963 | regulation of aspartic-type endopeptidase activity involved in amyloid precursor protein catabolic process(GO:1902959) positive regulation of aspartic-type endopeptidase activity involved in amyloid precursor protein catabolic process(GO:1902961) regulation of metalloendopeptidase activity involved in amyloid precursor protein catabolic process(GO:1902962) negative regulation of metalloendopeptidase activity involved in amyloid precursor protein catabolic process(GO:1902963) regulation of aspartic-type peptidase activity(GO:1905245) positive regulation of aspartic-type peptidase activity(GO:1905247) |
| 0.7 | 6.0 | GO:0051694 | pointed-end actin filament capping(GO:0051694) |
| 0.7 | 1.5 | GO:0071393 | cellular response to progesterone stimulus(GO:0071393) |
| 0.7 | 3.7 | GO:0000270 | peptidoglycan metabolic process(GO:0000270) peptidoglycan catabolic process(GO:0009253) |
| 0.7 | 2.9 | GO:0032962 | positive regulation of inositol trisphosphate biosynthetic process(GO:0032962) |
| 0.7 | 4.3 | GO:0014732 | skeletal muscle atrophy(GO:0014732) |
| 0.7 | 12.2 | GO:0048026 | positive regulation of mRNA splicing, via spliceosome(GO:0048026) |
| 0.7 | 7.8 | GO:0032674 | regulation of interleukin-5 production(GO:0032674) |
| 0.7 | 2.8 | GO:0055005 | ventricular cardiac myofibril assembly(GO:0055005) |
| 0.7 | 4.2 | GO:1902035 | positive regulation of hematopoietic stem cell proliferation(GO:1902035) |
| 0.7 | 19.3 | GO:0002820 | negative regulation of adaptive immune response(GO:0002820) |
| 0.7 | 17.9 | GO:0007064 | mitotic sister chromatid cohesion(GO:0007064) |
| 0.7 | 4.1 | GO:0006681 | galactosylceramide metabolic process(GO:0006681) |
| 0.7 | 3.9 | GO:0097039 | protein linear polyubiquitination(GO:0097039) |
| 0.6 | 10.4 | GO:0036092 | phosphatidylinositol-3-phosphate biosynthetic process(GO:0036092) |
| 0.6 | 4.5 | GO:1904749 | regulation of protein localization to nucleolus(GO:1904749) |
| 0.6 | 1.3 | GO:0051660 | establishment of centrosome localization(GO:0051660) |
| 0.6 | 1.9 | GO:0003220 | left ventricular cardiac muscle tissue morphogenesis(GO:0003220) cell proliferation involved in heart valve morphogenesis(GO:0003249) regulation of cell proliferation involved in heart valve morphogenesis(GO:0003250) gonad morphogenesis(GO:0035262) nephrogenic mesenchyme morphogenesis(GO:0072134) |
| 0.6 | 4.7 | GO:2000253 | positive regulation of feeding behavior(GO:2000253) |
| 0.6 | 8.3 | GO:0035634 | response to stilbenoid(GO:0035634) |
| 0.6 | 15.8 | GO:0031572 | mitotic G2 DNA damage checkpoint(GO:0007095) G2 DNA damage checkpoint(GO:0031572) |
| 0.6 | 1.8 | GO:1901873 | negative regulation of cellular respiration(GO:1901856) regulation of post-translational protein modification(GO:1901873) negative regulation of ATP biosynthetic process(GO:2001170) |
| 0.6 | 18.0 | GO:0046854 | phosphatidylinositol phosphorylation(GO:0046854) |
| 0.6 | 2.8 | GO:1903401 | L-lysine transmembrane transport(GO:1903401) |
| 0.6 | 8.9 | GO:0002675 | positive regulation of acute inflammatory response(GO:0002675) |
| 0.5 | 5.5 | GO:2000042 | negative regulation of double-strand break repair via homologous recombination(GO:2000042) |
| 0.5 | 23.4 | GO:0048873 | homeostasis of number of cells within a tissue(GO:0048873) |
| 0.5 | 4.3 | GO:0019388 | galactose catabolic process(GO:0019388) |
| 0.5 | 4.3 | GO:0008616 | queuosine biosynthetic process(GO:0008616) queuosine metabolic process(GO:0046116) |
| 0.5 | 18.2 | GO:0046427 | positive regulation of JAK-STAT cascade(GO:0046427) positive regulation of STAT cascade(GO:1904894) |
| 0.5 | 6.8 | GO:0010310 | regulation of hydrogen peroxide metabolic process(GO:0010310) |
| 0.5 | 3.7 | GO:2000389 | regulation of neutrophil extravasation(GO:2000389) |
| 0.5 | 1.5 | GO:0046356 | coenzyme A catabolic process(GO:0015938) nucleoside bisphosphate catabolic process(GO:0033869) ribonucleoside bisphosphate catabolic process(GO:0034031) purine nucleoside bisphosphate catabolic process(GO:0034034) acetyl-CoA catabolic process(GO:0046356) |
| 0.5 | 2.6 | GO:0032049 | cardiolipin biosynthetic process(GO:0032049) |
| 0.5 | 20.8 | GO:0043029 | T cell homeostasis(GO:0043029) |
| 0.5 | 5.1 | GO:0035562 | negative regulation of chromatin binding(GO:0035562) |
| 0.5 | 6.0 | GO:0006353 | DNA-templated transcription, termination(GO:0006353) |
| 0.5 | 4.5 | GO:0071028 | nuclear RNA surveillance(GO:0071027) nuclear mRNA surveillance(GO:0071028) |
| 0.5 | 4.9 | GO:0045647 | negative regulation of erythrocyte differentiation(GO:0045647) |
| 0.5 | 2.4 | GO:0000706 | meiotic DNA double-strand break processing(GO:0000706) |
| 0.5 | 5.4 | GO:0006337 | nucleosome disassembly(GO:0006337) |
| 0.4 | 0.9 | GO:0016078 | tRNA catabolic process(GO:0016078) |
| 0.4 | 2.2 | GO:0007197 | adenylate cyclase-inhibiting G-protein coupled acetylcholine receptor signaling pathway(GO:0007197) phospholipase C-activating G-protein coupled acetylcholine receptor signaling pathway(GO:0007207) |
| 0.4 | 6.8 | GO:0060218 | hematopoietic stem cell differentiation(GO:0060218) |
| 0.4 | 5.0 | GO:1900363 | regulation of mRNA polyadenylation(GO:1900363) |
| 0.4 | 11.8 | GO:0030866 | cortical actin cytoskeleton organization(GO:0030866) |
| 0.4 | 5.2 | GO:0051988 | regulation of attachment of spindle microtubules to kinetochore(GO:0051988) |
| 0.4 | 1.2 | GO:0090247 | cell motility involved in somitogenic axis elongation(GO:0090247) regulation of cell motility involved in somitogenic axis elongation(GO:0090249) |
| 0.4 | 1.9 | GO:0032252 | secretory granule localization(GO:0032252) |
| 0.4 | 1.5 | GO:0006564 | L-serine biosynthetic process(GO:0006564) |
| 0.4 | 6.7 | GO:0015695 | organic cation transport(GO:0015695) |
| 0.4 | 11.1 | GO:0033119 | negative regulation of RNA splicing(GO:0033119) |
| 0.4 | 0.7 | GO:0019883 | antigen processing and presentation of endogenous antigen(GO:0019883) |
| 0.4 | 5.7 | GO:0030150 | protein import into mitochondrial matrix(GO:0030150) |
| 0.4 | 2.1 | GO:0045086 | positive regulation of interleukin-2 biosynthetic process(GO:0045086) |
| 0.4 | 2.1 | GO:0030397 | membrane disassembly(GO:0030397) nuclear envelope disassembly(GO:0051081) |
| 0.4 | 6.0 | GO:0006825 | copper ion transport(GO:0006825) |
| 0.3 | 8.0 | GO:0046827 | positive regulation of protein export from nucleus(GO:0046827) |
| 0.3 | 1.0 | GO:0010034 | response to acetate(GO:0010034) |
| 0.3 | 1.7 | GO:0006432 | phenylalanyl-tRNA aminoacylation(GO:0006432) |
| 0.3 | 2.7 | GO:0040033 | miRNA mediated inhibition of translation(GO:0035278) negative regulation of translation, ncRNA-mediated(GO:0040033) regulation of translation, ncRNA-mediated(GO:0045974) |
| 0.3 | 1.9 | GO:0046836 | glycolipid transport(GO:0046836) |
| 0.3 | 10.3 | GO:0000387 | spliceosomal snRNP assembly(GO:0000387) |
| 0.3 | 2.5 | GO:0010835 | regulation of protein ADP-ribosylation(GO:0010835) |
| 0.3 | 13.5 | GO:0050873 | brown fat cell differentiation(GO:0050873) |
| 0.3 | 1.5 | GO:0010841 | positive regulation of circadian sleep/wake cycle, wakefulness(GO:0010841) |
| 0.3 | 3.3 | GO:0035520 | monoubiquitinated protein deubiquitination(GO:0035520) |
| 0.3 | 3.9 | GO:0001778 | plasma membrane repair(GO:0001778) |
| 0.3 | 1.2 | GO:1903758 | negative regulation of histone H4 acetylation(GO:0090241) regulation of transcription from RNA polymerase II promoter by histone modification(GO:1903756) negative regulation of transcription from RNA polymerase II promoter by histone modification(GO:1903758) |
| 0.3 | 0.9 | GO:2001201 | regulation of transforming growth factor-beta secretion(GO:2001201) |
| 0.3 | 8.4 | GO:0000028 | ribosomal small subunit assembly(GO:0000028) |
| 0.3 | 4.2 | GO:0046339 | diacylglycerol metabolic process(GO:0046339) |
| 0.3 | 1.7 | GO:0051001 | negative regulation of nitric-oxide synthase activity(GO:0051001) |
| 0.3 | 1.7 | GO:0000711 | meiotic DNA repair synthesis(GO:0000711) |
| 0.3 | 12.4 | GO:0033344 | cholesterol efflux(GO:0033344) |
| 0.3 | 4.8 | GO:0006895 | Golgi to endosome transport(GO:0006895) |
| 0.3 | 1.3 | GO:2000741 | positive regulation of mesenchymal stem cell differentiation(GO:2000741) |
| 0.3 | 8.4 | GO:0043044 | ATP-dependent chromatin remodeling(GO:0043044) |
| 0.3 | 6.4 | GO:0051443 | positive regulation of ubiquitin-protein transferase activity(GO:0051443) |
| 0.3 | 2.3 | GO:0009048 | dosage compensation by inactivation of X chromosome(GO:0009048) |
| 0.3 | 1.8 | GO:0061484 | hematopoietic stem cell homeostasis(GO:0061484) |
| 0.3 | 4.0 | GO:0001675 | acrosome assembly(GO:0001675) |
| 0.3 | 4.5 | GO:0010960 | magnesium ion homeostasis(GO:0010960) |
| 0.3 | 2.5 | GO:1904153 | negative regulation of protein exit from endoplasmic reticulum(GO:0070862) negative regulation of retrograde protein transport, ER to cytosol(GO:1904153) |
| 0.3 | 3.3 | GO:0042407 | cristae formation(GO:0042407) |
| 0.2 | 3.0 | GO:0048733 | sebaceous gland development(GO:0048733) |
| 0.2 | 2.5 | GO:1904177 | regulation of adipose tissue development(GO:1904177) |
| 0.2 | 15.9 | GO:0008543 | fibroblast growth factor receptor signaling pathway(GO:0008543) |
| 0.2 | 6.4 | GO:0035025 | positive regulation of Rho protein signal transduction(GO:0035025) |
| 0.2 | 5.2 | GO:0042119 | neutrophil activation(GO:0042119) |
| 0.2 | 4.4 | GO:0060216 | definitive hemopoiesis(GO:0060216) |
| 0.2 | 4.9 | GO:0000462 | maturation of SSU-rRNA from tricistronic rRNA transcript (SSU-rRNA, 5.8S rRNA, LSU-rRNA)(GO:0000462) |
| 0.2 | 0.9 | GO:0045839 | negative regulation of mitotic nuclear division(GO:0045839) |
| 0.2 | 11.2 | GO:0007004 | RNA-dependent DNA biosynthetic process(GO:0006278) telomere maintenance via telomerase(GO:0007004) |
| 0.2 | 2.1 | GO:0042118 | endothelial cell activation(GO:0042118) |
| 0.2 | 3.6 | GO:0043586 | tongue development(GO:0043586) |
| 0.2 | 1.1 | GO:0002726 | positive regulation of T cell cytokine production(GO:0002726) ripoptosome assembly(GO:0097343) ripoptosome assembly involved in necroptotic process(GO:1901026) |
| 0.2 | 1.5 | GO:0034983 | peptidyl-lysine deacetylation(GO:0034983) |
| 0.2 | 14.7 | GO:2001022 | positive regulation of response to DNA damage stimulus(GO:2001022) |
| 0.2 | 3.2 | GO:0060294 | cilium movement involved in cell motility(GO:0060294) |
| 0.2 | 1.0 | GO:0035948 | positive regulation of gluconeogenesis by positive regulation of transcription from RNA polymerase II promoter(GO:0035948) |
| 0.2 | 19.9 | GO:0090501 | RNA phosphodiester bond hydrolysis(GO:0090501) |
| 0.2 | 14.8 | GO:0043484 | regulation of RNA splicing(GO:0043484) |
| 0.2 | 10.2 | GO:0048791 | calcium ion-regulated exocytosis of neurotransmitter(GO:0048791) |
| 0.2 | 10.5 | GO:0000079 | regulation of cyclin-dependent protein serine/threonine kinase activity(GO:0000079) |
| 0.2 | 3.9 | GO:0071539 | protein localization to centrosome(GO:0071539) |
| 0.2 | 4.3 | GO:0019835 | cytolysis(GO:0019835) |
| 0.2 | 5.1 | GO:0045747 | positive regulation of Notch signaling pathway(GO:0045747) |
| 0.2 | 9.0 | GO:0002181 | cytoplasmic translation(GO:0002181) |
| 0.2 | 3.7 | GO:0000245 | spliceosomal complex assembly(GO:0000245) |
| 0.2 | 7.1 | GO:0051225 | spindle assembly(GO:0051225) |
| 0.2 | 1.2 | GO:0035855 | megakaryocyte development(GO:0035855) |
| 0.1 | 0.4 | GO:0061357 | positive regulation of Wnt protein secretion(GO:0061357) |
| 0.1 | 2.7 | GO:0031581 | hemidesmosome assembly(GO:0031581) |
| 0.1 | 1.6 | GO:0007342 | fusion of sperm to egg plasma membrane(GO:0007342) |
| 0.1 | 5.3 | GO:0019882 | antigen processing and presentation(GO:0019882) |
| 0.1 | 1.0 | GO:0033591 | response to L-ascorbic acid(GO:0033591) |
| 0.1 | 1.0 | GO:0060285 | cilium or flagellum-dependent cell motility(GO:0001539) cilium-dependent cell motility(GO:0060285) |
| 0.1 | 11.4 | GO:0007229 | integrin-mediated signaling pathway(GO:0007229) |
| 0.1 | 5.4 | GO:0006493 | protein O-linked glycosylation(GO:0006493) |
| 0.1 | 5.0 | GO:0007274 | neuromuscular synaptic transmission(GO:0007274) |
| 0.1 | 1.2 | GO:0048280 | vesicle fusion with Golgi apparatus(GO:0048280) |
| 0.1 | 4.0 | GO:0035825 | reciprocal meiotic recombination(GO:0007131) reciprocal DNA recombination(GO:0035825) |
| 0.1 | 1.4 | GO:0033539 | fatty acid beta-oxidation using acyl-CoA dehydrogenase(GO:0033539) |
| 0.1 | 1.6 | GO:0034389 | lipid particle organization(GO:0034389) |
| 0.1 | 0.7 | GO:0051151 | negative regulation of smooth muscle cell differentiation(GO:0051151) |
| 0.1 | 10.7 | GO:0000377 | RNA splicing, via transesterification reactions with bulged adenosine as nucleophile(GO:0000377) mRNA splicing, via spliceosome(GO:0000398) |
| 0.1 | 5.7 | GO:0045103 | intermediate filament-based process(GO:0045103) |
| 0.1 | 3.3 | GO:0036075 | endochondral ossification(GO:0001958) replacement ossification(GO:0036075) |
| 0.1 | 3.8 | GO:0001954 | positive regulation of cell-matrix adhesion(GO:0001954) |
| 0.1 | 6.1 | GO:0007040 | lysosome organization(GO:0007040) lytic vacuole organization(GO:0080171) |
| 0.1 | 2.0 | GO:0006613 | cotranslational protein targeting to membrane(GO:0006613) |
| 0.1 | 0.2 | GO:0060382 | regulation of DNA strand elongation(GO:0060382) |
| 0.1 | 3.2 | GO:0070527 | platelet aggregation(GO:0070527) |
| 0.1 | 12.8 | GO:0043123 | positive regulation of I-kappaB kinase/NF-kappaB signaling(GO:0043123) |
| 0.1 | 0.8 | GO:0046882 | negative regulation of follicle-stimulating hormone secretion(GO:0046882) |
| 0.1 | 3.2 | GO:0032008 | positive regulation of TOR signaling(GO:0032008) |
| 0.1 | 2.3 | GO:0060259 | regulation of feeding behavior(GO:0060259) |
| 0.1 | 3.0 | GO:1904659 | hexose transmembrane transport(GO:0035428) glucose transmembrane transport(GO:1904659) |
| 0.1 | 1.0 | GO:0036315 | cellular response to sterol(GO:0036315) |
| 0.1 | 18.3 | GO:0007059 | chromosome segregation(GO:0007059) |
| 0.1 | 0.3 | GO:0019730 | antimicrobial humoral response(GO:0019730) |
| 0.1 | 1.1 | GO:0034285 | response to sucrose(GO:0009744) response to disaccharide(GO:0034285) |
| 0.1 | 0.6 | GO:1903527 | positive regulation of membrane tubulation(GO:1903527) |
| 0.1 | 0.6 | GO:0051096 | regulation of helicase activity(GO:0051095) positive regulation of helicase activity(GO:0051096) |
| 0.1 | 1.3 | GO:0043248 | proteasome assembly(GO:0043248) |
| 0.1 | 0.7 | GO:0006283 | transcription-coupled nucleotide-excision repair(GO:0006283) |
| 0.1 | 11.2 | GO:0006479 | protein methylation(GO:0006479) protein alkylation(GO:0008213) |
| 0.1 | 0.7 | GO:0090043 | tubulin deacetylation(GO:0090042) regulation of tubulin deacetylation(GO:0090043) |
| 0.1 | 2.7 | GO:0006611 | protein export from nucleus(GO:0006611) |
| 0.1 | 2.1 | GO:0048384 | retinoic acid receptor signaling pathway(GO:0048384) |
| 0.1 | 3.0 | GO:0032088 | negative regulation of NF-kappaB transcription factor activity(GO:0032088) |
| 0.1 | 0.3 | GO:0048752 | semicircular canal morphogenesis(GO:0048752) |
| 0.1 | 4.1 | GO:0042273 | ribosomal large subunit biogenesis(GO:0042273) |
| 0.1 | 0.7 | GO:0046931 | pore complex assembly(GO:0046931) nuclear pore complex assembly(GO:0051292) |
| 0.1 | 1.2 | GO:0071108 | protein K48-linked deubiquitination(GO:0071108) |
| 0.1 | 2.7 | GO:0043966 | histone H3 acetylation(GO:0043966) |
| 0.1 | 1.1 | GO:0034204 | lipid translocation(GO:0034204) phospholipid translocation(GO:0045332) |
| 0.1 | 1.0 | GO:0006450 | regulation of translational fidelity(GO:0006450) |
| 0.1 | 6.2 | GO:0042113 | B cell activation(GO:0042113) |
| 0.1 | 0.4 | GO:0046834 | lipid phosphorylation(GO:0046834) |
| 0.0 | 2.7 | GO:0006367 | transcription initiation from RNA polymerase II promoter(GO:0006367) |
| 0.0 | 0.4 | GO:0009083 | branched-chain amino acid catabolic process(GO:0009083) |
| 0.0 | 0.3 | GO:0090214 | spongiotrophoblast layer developmental growth(GO:0090214) |
| 0.0 | 1.8 | GO:0051865 | protein autoubiquitination(GO:0051865) |
| 0.0 | 0.2 | GO:0060707 | trophoblast giant cell differentiation(GO:0060707) |
| 0.0 | 0.7 | GO:1900003 | regulation of serine-type endopeptidase activity(GO:1900003) negative regulation of serine-type endopeptidase activity(GO:1900004) regulation of serine-type peptidase activity(GO:1902571) negative regulation of serine-type peptidase activity(GO:1902572) |
| 0.0 | 19.6 | GO:0000122 | negative regulation of transcription from RNA polymerase II promoter(GO:0000122) |
| 0.0 | 0.8 | GO:0010172 | embryonic body morphogenesis(GO:0010172) |
| 0.0 | 2.8 | GO:0030901 | midbrain development(GO:0030901) |
| 0.0 | 0.4 | GO:0006515 | misfolded or incompletely synthesized protein catabolic process(GO:0006515) |
| 0.0 | 1.7 | GO:0031338 | regulation of vesicle fusion(GO:0031338) |
| 0.0 | 1.8 | GO:0042177 | negative regulation of protein catabolic process(GO:0042177) |
| 0.0 | 0.2 | GO:0019370 | leukotriene biosynthetic process(GO:0019370) |
| 0.0 | 0.9 | GO:0033138 | positive regulation of peptidyl-serine phosphorylation(GO:0033138) |
| 0.0 | 0.3 | GO:0007195 | adenylate cyclase-inhibiting dopamine receptor signaling pathway(GO:0007195) |
| 0.0 | 0.6 | GO:0002279 | mast cell activation involved in immune response(GO:0002279) mast cell mediated immunity(GO:0002448) mast cell degranulation(GO:0043303) |
| 0.0 | 2.5 | GO:0042787 | protein ubiquitination involved in ubiquitin-dependent protein catabolic process(GO:0042787) |
| 0.0 | 1.5 | GO:0008645 | hexose transport(GO:0008645) |
| 0.0 | 8.0 | GO:0030155 | regulation of cell adhesion(GO:0030155) |
| 0.0 | 0.3 | GO:0030970 | retrograde protein transport, ER to cytosol(GO:0030970) |
| 0.0 | 0.6 | GO:0043154 | negative regulation of cysteine-type endopeptidase activity involved in apoptotic process(GO:0043154) |
| 0.0 | 1.1 | GO:0030216 | keratinocyte differentiation(GO:0030216) |
| 0.0 | 0.1 | GO:0014886 | transition between slow and fast fiber(GO:0014886) |
Gene overrepresentation in cellular component category:
| Log-likelihood per target | Total log-likelihood | Term | Description |
|---|---|---|---|
| 6.2 | 24.7 | GO:0000444 | MIS12/MIND type complex(GO:0000444) |
| 6.2 | 30.8 | GO:0071953 | elastic fiber(GO:0071953) |
| 5.4 | 16.3 | GO:0032398 | MHC class Ib protein complex(GO:0032398) |
| 5.3 | 21.1 | GO:0019815 | B cell receptor complex(GO:0019815) |
| 5.1 | 25.4 | GO:0072558 | IPAF inflammasome complex(GO:0072557) NLRP1 inflammasome complex(GO:0072558) AIM2 inflammasome complex(GO:0097169) |
| 5.1 | 15.2 | GO:0030690 | Noc1p-Noc2p complex(GO:0030690) |
| 5.0 | 15.0 | GO:0035355 | Toll-like receptor 2-Toll-like receptor 6 protein complex(GO:0035355) |
| 4.5 | 18.1 | GO:0031092 | platelet alpha granule membrane(GO:0031092) |
| 4.3 | 13.0 | GO:1990826 | nucleoplasmic periphery of the nuclear pore complex(GO:1990826) |
| 3.7 | 14.6 | GO:0044299 | C-fiber(GO:0044299) |
| 3.5 | 24.6 | GO:0030870 | Mre11 complex(GO:0030870) |
| 3.3 | 16.7 | GO:0030015 | CCR4-NOT core complex(GO:0030015) |
| 3.2 | 47.7 | GO:1990023 | mitotic spindle midzone(GO:1990023) |
| 2.7 | 43.2 | GO:0042613 | MHC class II protein complex(GO:0042613) |
| 2.7 | 10.6 | GO:1990630 | IRE1-RACK1-PP2A complex(GO:1990630) |
| 2.4 | 12.2 | GO:0034455 | t-UTP complex(GO:0034455) |
| 2.3 | 9.1 | GO:0008282 | ATP-sensitive potassium channel complex(GO:0008282) |
| 2.2 | 6.5 | GO:1990682 | CSF1-CSF1R complex(GO:1990682) |
| 2.2 | 6.5 | GO:0032807 | DNA ligase IV complex(GO:0032807) |
| 2.0 | 11.7 | GO:0035189 | Rb-E2F complex(GO:0035189) |
| 1.9 | 5.8 | GO:0035577 | azurophil granule membrane(GO:0035577) |
| 1.9 | 7.6 | GO:0020005 | symbiont-containing vacuole membrane(GO:0020005) |
| 1.7 | 10.0 | GO:0070419 | nonhomologous end joining complex(GO:0070419) |
| 1.6 | 13.1 | GO:0001740 | Barr body(GO:0001740) |
| 1.6 | 4.9 | GO:0060187 | cell pole(GO:0060187) |
| 1.6 | 8.1 | GO:0044530 | supraspliceosomal complex(GO:0044530) |
| 1.5 | 19.9 | GO:0032593 | insulin-responsive compartment(GO:0032593) |
| 1.4 | 17.1 | GO:0071564 | npBAF complex(GO:0071564) |
| 1.3 | 5.2 | GO:0044307 | germinal vesicle(GO:0042585) dendritic branch(GO:0044307) |
| 1.3 | 5.2 | GO:1990005 | granular vesicle(GO:1990005) |
| 1.3 | 5.1 | GO:0036156 | inner dynein arm(GO:0036156) |
| 1.2 | 3.7 | GO:0071008 | U2-type post-mRNA release spliceosomal complex(GO:0071008) |
| 1.2 | 7.4 | GO:0030681 | nucleolar ribonuclease P complex(GO:0005655) ribonuclease P complex(GO:0030677) multimeric ribonuclease P complex(GO:0030681) |
| 1.2 | 3.7 | GO:1990589 | ATF4-CREB1 transcription factor complex(GO:1990589) |
| 1.2 | 25.7 | GO:0019013 | viral nucleocapsid(GO:0019013) |
| 1.2 | 8.5 | GO:0036128 | CatSper complex(GO:0036128) |
| 1.1 | 9.6 | GO:0071204 | histone pre-mRNA 3'end processing complex(GO:0071204) |
| 1.0 | 7.8 | GO:0070187 | telosome(GO:0070187) |
| 0.9 | 6.6 | GO:0000796 | condensin complex(GO:0000796) |
| 0.9 | 12.2 | GO:0000801 | central element(GO:0000801) |
| 0.9 | 4.4 | GO:0098536 | deuterosome(GO:0098536) |
| 0.8 | 12.7 | GO:0001931 | uropod(GO:0001931) cell trailing edge(GO:0031254) |
| 0.8 | 62.3 | GO:0045095 | keratin filament(GO:0045095) |
| 0.8 | 5.8 | GO:0097504 | Gemini of coiled bodies(GO:0097504) |
| 0.8 | 16.6 | GO:0005665 | DNA-directed RNA polymerase II, core complex(GO:0005665) |
| 0.8 | 15.5 | GO:0042589 | zymogen granule membrane(GO:0042589) |
| 0.8 | 4.9 | GO:0034388 | Pwp2p-containing subcomplex of 90S preribosome(GO:0034388) |
| 0.8 | 12.3 | GO:0005685 | U1 snRNP(GO:0005685) |
| 0.8 | 6.8 | GO:0019907 | cyclin-dependent protein kinase activating kinase holoenzyme complex(GO:0019907) |
| 0.8 | 11.3 | GO:0035102 | PRC1 complex(GO:0035102) |
| 0.7 | 6.8 | GO:0043020 | NADPH oxidase complex(GO:0043020) |
| 0.6 | 45.9 | GO:0000118 | histone deacetylase complex(GO:0000118) |
| 0.6 | 24.1 | GO:0019897 | extrinsic component of plasma membrane(GO:0019897) |
| 0.6 | 57.7 | GO:0022625 | cytosolic large ribosomal subunit(GO:0022625) |
| 0.6 | 5.7 | GO:0005744 | mitochondrial inner membrane presequence translocase complex(GO:0005744) |
| 0.6 | 4.5 | GO:0005736 | DNA-directed RNA polymerase I complex(GO:0005736) |
| 0.6 | 2.8 | GO:1990726 | Lsm1-7-Pat1 complex(GO:1990726) |
| 0.6 | 1.7 | GO:0009328 | phenylalanine-tRNA ligase complex(GO:0009328) |
| 0.5 | 181.5 | GO:0009897 | external side of plasma membrane(GO:0009897) |
| 0.5 | 4.9 | GO:0031390 | Ctf18 RFC-like complex(GO:0031390) |
| 0.5 | 7.4 | GO:0035098 | ESC/E(Z) complex(GO:0035098) |
| 0.5 | 2.1 | GO:0097524 | sperm plasma membrane(GO:0097524) |
| 0.5 | 5.5 | GO:0005686 | U2 snRNP(GO:0005686) |
| 0.5 | 3.3 | GO:0061617 | MICOS complex(GO:0061617) |
| 0.5 | 9.3 | GO:0000930 | gamma-tubulin complex(GO:0000930) |
| 0.5 | 2.7 | GO:0005672 | transcription factor TFIIA complex(GO:0005672) |
| 0.5 | 2.7 | GO:0005608 | laminin-3 complex(GO:0005608) |
| 0.4 | 4.7 | GO:0005796 | Golgi lumen(GO:0005796) |
| 0.4 | 4.3 | GO:0005641 | nuclear envelope lumen(GO:0005641) |
| 0.4 | 4.0 | GO:0034663 | endoplasmic reticulum chaperone complex(GO:0034663) |
| 0.4 | 2.7 | GO:0035068 | micro-ribonucleoprotein complex(GO:0035068) |
| 0.4 | 1.9 | GO:0002189 | ribose phosphate diphosphokinase complex(GO:0002189) |
| 0.4 | 4.4 | GO:0033276 | transcription factor TFTC complex(GO:0033276) |
| 0.4 | 2.2 | GO:0071598 | neuronal ribonucleoprotein granule(GO:0071598) |
| 0.4 | 5.7 | GO:0005845 | mRNA cap binding complex(GO:0005845) |
| 0.3 | 21.8 | GO:0016328 | lateral plasma membrane(GO:0016328) |
| 0.3 | 7.0 | GO:0005671 | Ada2/Gcn5/Ada3 transcription activator complex(GO:0005671) |
| 0.3 | 1.9 | GO:0032444 | activin responsive factor complex(GO:0032444) |
| 0.3 | 3.7 | GO:0042581 | specific granule(GO:0042581) |
| 0.3 | 3.3 | GO:0042405 | nuclear inclusion body(GO:0042405) |
| 0.3 | 20.8 | GO:0022627 | cytosolic small ribosomal subunit(GO:0022627) |
| 0.3 | 17.1 | GO:0000777 | condensed chromosome kinetochore(GO:0000777) |
| 0.3 | 4.5 | GO:0005751 | mitochondrial respiratory chain complex IV(GO:0005751) |
| 0.3 | 20.4 | GO:0005811 | lipid particle(GO:0005811) |
| 0.3 | 4.0 | GO:0030122 | AP-2 adaptor complex(GO:0030122) |
| 0.3 | 7.1 | GO:0001772 | immunological synapse(GO:0001772) |
| 0.2 | 7.2 | GO:0034451 | centriolar satellite(GO:0034451) |
| 0.2 | 7.8 | GO:0009925 | basal plasma membrane(GO:0009925) |
| 0.2 | 0.7 | GO:1990836 | lysosomal matrix(GO:1990836) |
| 0.2 | 6.2 | GO:0032588 | trans-Golgi network membrane(GO:0032588) |
| 0.2 | 3.9 | GO:0097038 | perinuclear endoplasmic reticulum(GO:0097038) |
| 0.2 | 2.4 | GO:0030688 | preribosome, small subunit precursor(GO:0030688) |
| 0.2 | 14.6 | GO:0031225 | anchored component of membrane(GO:0031225) |
| 0.2 | 4.5 | GO:0005605 | basal lamina(GO:0005605) |
| 0.2 | 40.9 | GO:0009898 | cytoplasmic side of plasma membrane(GO:0009898) |
| 0.2 | 2.3 | GO:0044666 | MLL3/4 complex(GO:0044666) |
| 0.2 | 0.7 | GO:0034274 | Atg12-Atg5-Atg16 complex(GO:0034274) |
| 0.2 | 4.8 | GO:0080008 | Cul4-RING E3 ubiquitin ligase complex(GO:0080008) |
| 0.2 | 0.8 | GO:0035061 | interchromatin granule(GO:0035061) |
| 0.2 | 10.5 | GO:0005581 | collagen trimer(GO:0005581) |
| 0.2 | 1.7 | GO:0043205 | microfibril(GO:0001527) fibril(GO:0043205) |
| 0.1 | 12.2 | GO:0005776 | autophagosome(GO:0005776) |
| 0.1 | 1.0 | GO:0000124 | SAGA complex(GO:0000124) |
| 0.1 | 5.7 | GO:0010494 | cytoplasmic stress granule(GO:0010494) |
| 0.1 | 1.3 | GO:0097539 | ciliary transition fiber(GO:0097539) |
| 0.1 | 2.0 | GO:0045334 | clathrin-coated endocytic vesicle(GO:0045334) |
| 0.1 | 1.0 | GO:0000275 | mitochondrial proton-transporting ATP synthase complex, catalytic core F(1)(GO:0000275) proton-transporting ATP synthase complex, catalytic core F(1)(GO:0045261) |
| 0.1 | 4.6 | GO:0016235 | aggresome(GO:0016235) |
| 0.1 | 0.9 | GO:0005964 | phosphorylase kinase complex(GO:0005964) |
| 0.1 | 8.9 | GO:0005902 | microvillus(GO:0005902) |
| 0.1 | 0.3 | GO:1990707 | subtelomeric heterochromatin(GO:1990421) nuclear subtelomeric heterochromatin(GO:1990707) |
| 0.1 | 0.6 | GO:0071821 | FANCM-MHF complex(GO:0071821) |
| 0.1 | 0.3 | GO:0000839 | Hrd1p ubiquitin ligase ERAD-L complex(GO:0000839) |
| 0.1 | 0.5 | GO:0033588 | Elongator holoenzyme complex(GO:0033588) |
| 0.1 | 3.1 | GO:0005881 | cytoplasmic microtubule(GO:0005881) |
| 0.1 | 0.7 | GO:0008385 | IkappaB kinase complex(GO:0008385) |
| 0.1 | 0.4 | GO:0005947 | mitochondrial alpha-ketoglutarate dehydrogenase complex(GO:0005947) |
| 0.1 | 6.8 | GO:0071013 | catalytic step 2 spliceosome(GO:0071013) |
| 0.1 | 19.4 | GO:0098852 | lysosomal membrane(GO:0005765) lytic vacuole membrane(GO:0098852) |
| 0.1 | 3.1 | GO:0005891 | voltage-gated calcium channel complex(GO:0005891) |
| 0.1 | 6.3 | GO:0000792 | heterochromatin(GO:0000792) |
| 0.1 | 2.0 | GO:0002080 | acrosomal membrane(GO:0002080) |
| 0.1 | 3.2 | GO:0031201 | SNARE complex(GO:0031201) |
| 0.1 | 1.3 | GO:0000800 | lateral element(GO:0000800) |
| 0.1 | 2.5 | GO:0015030 | Cajal body(GO:0015030) |
| 0.1 | 3.1 | GO:0005876 | spindle microtubule(GO:0005876) |
| 0.1 | 1.1 | GO:0030140 | trans-Golgi network transport vesicle(GO:0030140) |
| 0.1 | 22.1 | GO:0005667 | transcription factor complex(GO:0005667) |
| 0.1 | 0.9 | GO:0031229 | integral component of nuclear inner membrane(GO:0005639) intrinsic component of nuclear inner membrane(GO:0031229) |
| 0.1 | 2.9 | GO:0005871 | kinesin complex(GO:0005871) |
| 0.1 | 9.3 | GO:0005840 | ribosome(GO:0005840) |
| 0.1 | 1.4 | GO:0030992 | intraciliary transport particle B(GO:0030992) |
| 0.0 | 33.6 | GO:0005773 | vacuole(GO:0005773) |
| 0.0 | 1.2 | GO:0000159 | protein phosphatase type 2A complex(GO:0000159) |
| 0.0 | 1.0 | GO:0002102 | podosome(GO:0002102) |
| 0.0 | 2.1 | GO:0016363 | nuclear matrix(GO:0016363) |
| 0.0 | 2.5 | GO:0001669 | acrosomal vesicle(GO:0001669) |
| 0.0 | 1.0 | GO:0017053 | transcriptional repressor complex(GO:0017053) |
| 0.0 | 0.5 | GO:0001533 | cornified envelope(GO:0001533) |
| 0.0 | 1.8 | GO:0001650 | fibrillar center(GO:0001650) |
| 0.0 | 0.2 | GO:0032040 | small-subunit processome(GO:0032040) |
Gene overrepresentation in molecular function category:
| Log-likelihood per target | Total log-likelihood | Term | Description |
|---|---|---|---|
| 51.8 | 155.3 | GO:0004556 | alpha-amylase activity(GO:0004556) |
| 5.7 | 46.0 | GO:0022840 | leak channel activity(GO:0022840) narrow pore channel activity(GO:0022842) |
| 5.5 | 16.4 | GO:0004651 | polynucleotide 5'-phosphatase activity(GO:0004651) |
| 5.2 | 15.7 | GO:0019961 | interferon binding(GO:0019961) |
| 5.1 | 25.4 | GO:0019770 | IgG receptor activity(GO:0019770) |
| 5.1 | 20.3 | GO:0004719 | protein-L-isoaspartate (D-aspartate) O-methyltransferase activity(GO:0004719) |
| 5.0 | 15.0 | GO:0042498 | diacyl lipopeptide binding(GO:0042498) |
| 5.0 | 30.0 | GO:0032027 | myosin light chain binding(GO:0032027) |
| 4.9 | 24.5 | GO:0051864 | histone demethylase activity (H3-K36 specific)(GO:0051864) |
| 4.5 | 18.1 | GO:0042806 | fucose binding(GO:0042806) |
| 4.5 | 31.6 | GO:0004064 | arylesterase activity(GO:0004064) |
| 4.2 | 21.0 | GO:0070892 | lipoteichoic acid receptor activity(GO:0070892) |
| 4.2 | 16.7 | GO:0001226 | RNA polymerase II transcription corepressor binding(GO:0001226) |
| 3.8 | 15.2 | GO:0035877 | death effector domain binding(GO:0035877) |
| 3.6 | 21.5 | GO:0031727 | CCR2 chemokine receptor binding(GO:0031727) |
| 3.5 | 10.4 | GO:0016316 | phosphatidylinositol-3,4-bisphosphate 4-phosphatase activity(GO:0016316) |
| 3.4 | 13.6 | GO:0030021 | extracellular matrix structural constituent conferring compression resistance(GO:0030021) structural constituent of tooth enamel(GO:0030345) |
| 3.4 | 13.4 | GO:0004052 | arachidonate 12-lipoxygenase activity(GO:0004052) |
| 3.3 | 13.3 | GO:0019767 | IgE receptor activity(GO:0019767) |
| 3.2 | 12.9 | GO:0005087 | Ran guanyl-nucleotide exchange factor activity(GO:0005087) |
| 3.0 | 9.1 | GO:0008281 | sulfonylurea receptor activity(GO:0008281) |
| 3.0 | 23.6 | GO:0070087 | chromo shadow domain binding(GO:0070087) |
| 2.8 | 25.4 | GO:0097200 | cysteine-type endopeptidase activity involved in execution phase of apoptosis(GO:0097200) |
| 2.8 | 45.1 | GO:0045125 | bioactive lipid receptor activity(GO:0045125) |
| 2.7 | 16.3 | GO:0030881 | beta-2-microglobulin binding(GO:0030881) |
| 2.6 | 67.2 | GO:0004190 | aspartic-type endopeptidase activity(GO:0004190) |
| 2.6 | 7.8 | GO:0001847 | opsonin receptor activity(GO:0001847) |
| 2.4 | 12.2 | GO:1990932 | 5.8S rRNA binding(GO:1990932) |
| 2.4 | 16.8 | GO:0046703 | natural killer cell lectin-like receptor binding(GO:0046703) |
| 2.3 | 11.7 | GO:0061676 | importin-alpha family protein binding(GO:0061676) |
| 2.3 | 21.1 | GO:0043515 | kinetochore binding(GO:0043515) |
| 2.3 | 21.1 | GO:0004716 | receptor signaling protein tyrosine kinase activity(GO:0004716) |
| 2.2 | 18.0 | GO:0016308 | 1-phosphatidylinositol-4-phosphate 5-kinase activity(GO:0016308) |
| 2.1 | 20.8 | GO:0098505 | G-rich strand telomeric DNA binding(GO:0098505) |
| 2.1 | 10.3 | GO:0004974 | leukotriene receptor activity(GO:0004974) |
| 2.1 | 26.7 | GO:1990405 | protein antigen binding(GO:1990405) |
| 2.0 | 46.9 | GO:0051861 | glycolipid binding(GO:0051861) |
| 1.9 | 5.8 | GO:0004084 | branched-chain-amino-acid transaminase activity(GO:0004084) L-leucine transaminase activity(GO:0052654) L-valine transaminase activity(GO:0052655) L-isoleucine transaminase activity(GO:0052656) |
| 1.9 | 7.6 | GO:0019002 | GMP binding(GO:0019002) |
| 1.9 | 13.1 | GO:0035375 | zymogen binding(GO:0035375) |
| 1.9 | 20.5 | GO:0016493 | C-C chemokine receptor activity(GO:0016493) |
| 1.8 | 5.5 | GO:0030620 | U2 snRNA binding(GO:0030620) |
| 1.8 | 8.8 | GO:0050309 | glucose-6-phosphatase activity(GO:0004346) sugar-terminal-phosphatase activity(GO:0050309) |
| 1.6 | 13.2 | GO:0001164 | RNA polymerase I regulatory region sequence-specific DNA binding(GO:0001163) RNA polymerase I CORE element sequence-specific DNA binding(GO:0001164) |
| 1.6 | 14.7 | GO:0004875 | complement receptor activity(GO:0004875) |
| 1.6 | 11.3 | GO:0070181 | small ribosomal subunit rRNA binding(GO:0070181) |
| 1.5 | 6.2 | GO:0005134 | interleukin-2 receptor binding(GO:0005134) |
| 1.5 | 16.9 | GO:0000014 | single-stranded DNA endodeoxyribonuclease activity(GO:0000014) |
| 1.4 | 4.3 | GO:0004051 | arachidonate 5-lipoxygenase activity(GO:0004051) |
| 1.4 | 38.2 | GO:0005070 | SH3/SH2 adaptor activity(GO:0005070) |
| 1.4 | 15.4 | GO:0004653 | polypeptide N-acetylgalactosaminyltransferase activity(GO:0004653) |
| 1.4 | 19.2 | GO:0042043 | neurexin family protein binding(GO:0042043) |
| 1.3 | 10.6 | GO:0030292 | protein tyrosine kinase inhibitor activity(GO:0030292) |
| 1.3 | 11.8 | GO:1990446 | U1 snRNA binding(GO:0030619) U1 snRNP binding(GO:1990446) |
| 1.3 | 9.0 | GO:0035252 | UDP-xylosyltransferase activity(GO:0035252) |
| 1.3 | 96.6 | GO:0003823 | antigen binding(GO:0003823) |
| 1.3 | 6.3 | GO:0004720 | protein-lysine 6-oxidase activity(GO:0004720) |
| 1.2 | 3.7 | GO:1990763 | arrestin family protein binding(GO:1990763) |
| 1.2 | 3.5 | GO:0003921 | GMP synthase activity(GO:0003921) GMP synthase (glutamine-hydrolyzing) activity(GO:0003922) |
| 1.1 | 6.8 | GO:0034647 | histone demethylase activity (H3-trimethyl-K4 specific)(GO:0034647) |
| 1.1 | 12.8 | GO:0019869 | chloride channel inhibitor activity(GO:0019869) |
| 1.1 | 5.3 | GO:0043262 | adenosine-diphosphatase activity(GO:0043262) |
| 1.0 | 14.3 | GO:0003688 | DNA replication origin binding(GO:0003688) |
| 0.9 | 15.1 | GO:0008574 | ATP-dependent microtubule motor activity, plus-end-directed(GO:0008574) |
| 0.9 | 16.6 | GO:0004115 | 3',5'-cyclic-AMP phosphodiesterase activity(GO:0004115) |
| 0.9 | 4.5 | GO:0009019 | tRNA (guanine-N1-)-methyltransferase activity(GO:0009019) |
| 0.9 | 4.5 | GO:0001054 | RNA polymerase I activity(GO:0001054) |
| 0.9 | 4.3 | GO:0043682 | copper-exporting ATPase activity(GO:0004008) copper-transporting ATPase activity(GO:0043682) |
| 0.9 | 128.1 | GO:0001078 | transcriptional repressor activity, RNA polymerase II core promoter proximal region sequence-specific binding(GO:0001078) |
| 0.9 | 2.6 | GO:0004605 | phosphatidate cytidylyltransferase activity(GO:0004605) |
| 0.8 | 7.5 | GO:0008559 | xenobiotic-transporting ATPase activity(GO:0008559) |
| 0.8 | 8.9 | GO:0008131 | primary amine oxidase activity(GO:0008131) |
| 0.8 | 2.4 | GO:0089720 | caspase binding(GO:0089720) |
| 0.8 | 9.5 | GO:0001608 | G-protein coupled nucleotide receptor activity(GO:0001608) G-protein coupled purinergic nucleotide receptor activity(GO:0045028) |
| 0.8 | 6.1 | GO:0004630 | phospholipase D activity(GO:0004630) |
| 0.8 | 2.3 | GO:0004832 | valine-tRNA ligase activity(GO:0004832) |
| 0.8 | 2.3 | GO:0004574 | oligo-1,6-glucosidase activity(GO:0004574) |
| 0.8 | 6.0 | GO:0001055 | RNA polymerase II activity(GO:0001055) |
| 0.7 | 18.7 | GO:0048027 | mRNA 5'-UTR binding(GO:0048027) |
| 0.7 | 7.4 | GO:0004526 | ribonuclease P activity(GO:0004526) |
| 0.7 | 3.7 | GO:0008745 | N-acetylmuramoyl-L-alanine amidase activity(GO:0008745) |
| 0.7 | 17.7 | GO:0005545 | 1-phosphatidylinositol binding(GO:0005545) |
| 0.7 | 6.5 | GO:0003909 | DNA ligase activity(GO:0003909) DNA ligase (ATP) activity(GO:0003910) |
| 0.7 | 218.2 | GO:0030246 | carbohydrate binding(GO:0030246) |
| 0.7 | 21.5 | GO:0031492 | nucleosomal DNA binding(GO:0031492) |
| 0.7 | 2.1 | GO:0005171 | hepatocyte growth factor receptor binding(GO:0005171) |
| 0.7 | 6.8 | GO:0016176 | superoxide-generating NADPH oxidase activator activity(GO:0016176) |
| 0.7 | 37.8 | GO:0005507 | copper ion binding(GO:0005507) |
| 0.7 | 2.6 | GO:0031731 | CCR6 chemokine receptor binding(GO:0031731) |
| 0.6 | 5.7 | GO:0015450 | protein channel activity(GO:0015266) P-P-bond-hydrolysis-driven protein transmembrane transporter activity(GO:0015450) |
| 0.6 | 9.4 | GO:0009982 | pseudouridine synthase activity(GO:0009982) |
| 0.6 | 12.4 | GO:0017127 | cholesterol transporter activity(GO:0017127) |
| 0.6 | 31.5 | GO:0001786 | phosphatidylserine binding(GO:0001786) |
| 0.6 | 13.9 | GO:0031435 | mitogen-activated protein kinase kinase kinase binding(GO:0031435) |
| 0.6 | 12.1 | GO:0015106 | bicarbonate transmembrane transporter activity(GO:0015106) |
| 0.6 | 2.9 | GO:0004614 | phosphoglucomutase activity(GO:0004614) |
| 0.6 | 2.3 | GO:0000293 | ferric-chelate reductase activity(GO:0000293) |
| 0.6 | 11.2 | GO:0003950 | NAD+ ADP-ribosyltransferase activity(GO:0003950) |
| 0.6 | 15.6 | GO:0042169 | SH2 domain binding(GO:0042169) |
| 0.6 | 2.2 | GO:0016907 | G-protein coupled acetylcholine receptor activity(GO:0016907) |
| 0.6 | 6.7 | GO:0005451 | monovalent cation:proton antiporter activity(GO:0005451) |
| 0.6 | 3.3 | GO:0061578 | Lys63-specific deubiquitinase activity(GO:0061578) |
| 0.6 | 9.4 | GO:0097602 | cullin family protein binding(GO:0097602) |
| 0.5 | 8.7 | GO:0019843 | rRNA binding(GO:0019843) |
| 0.5 | 4.3 | GO:0008479 | queuine tRNA-ribosyltransferase activity(GO:0008479) |
| 0.5 | 3.2 | GO:0000099 | sulfur amino acid transmembrane transporter activity(GO:0000099) |
| 0.5 | 2.0 | GO:0004487 | methylenetetrahydrofolate dehydrogenase (NAD+) activity(GO:0004487) |
| 0.5 | 4.0 | GO:0047134 | protein-disulfide reductase activity(GO:0047134) |
| 0.5 | 4.5 | GO:0047498 | calcium-dependent phospholipase A2 activity(GO:0047498) |
| 0.5 | 208.8 | GO:0005525 | GTP binding(GO:0005525) |
| 0.5 | 12.2 | GO:0043027 | cysteine-type endopeptidase inhibitor activity involved in apoptotic process(GO:0043027) |
| 0.5 | 2.4 | GO:0008823 | cupric reductase activity(GO:0008823) ferric-chelate reductase (NADPH) activity(GO:0052851) |
| 0.5 | 4.3 | GO:0016857 | racemase and epimerase activity, acting on carbohydrates and derivatives(GO:0016857) |
| 0.5 | 3.3 | GO:0004065 | arylsulfatase activity(GO:0004065) |
| 0.5 | 1.9 | GO:0043199 | sulfate binding(GO:0043199) |
| 0.5 | 2.8 | GO:0015189 | L-lysine transmembrane transporter activity(GO:0015189) |
| 0.5 | 5.1 | GO:0042609 | CD4 receptor binding(GO:0042609) |
| 0.5 | 48.7 | GO:0005178 | integrin binding(GO:0005178) |
| 0.5 | 17.4 | GO:0001784 | phosphotyrosine binding(GO:0001784) |
| 0.4 | 13.6 | GO:0030515 | snoRNA binding(GO:0030515) |
| 0.4 | 11.1 | GO:0001106 | RNA polymerase II transcription corepressor activity(GO:0001106) |
| 0.4 | 2.5 | GO:0008970 | phosphatidylcholine 1-acylhydrolase activity(GO:0008970) |
| 0.4 | 8.8 | GO:0032183 | SUMO binding(GO:0032183) |
| 0.4 | 11.1 | GO:0004129 | cytochrome-c oxidase activity(GO:0004129) heme-copper terminal oxidase activity(GO:0015002) oxidoreductase activity, acting on a heme group of donors, oxygen as acceptor(GO:0016676) |
| 0.4 | 4.4 | GO:0017162 | aryl hydrocarbon receptor binding(GO:0017162) |
| 0.3 | 19.9 | GO:0035064 | methylated histone binding(GO:0035064) |
| 0.3 | 7.1 | GO:0030676 | Rac guanyl-nucleotide exchange factor activity(GO:0030676) |
| 0.3 | 24.1 | GO:0033613 | activating transcription factor binding(GO:0033613) |
| 0.3 | 4.2 | GO:0004143 | diacylglycerol kinase activity(GO:0004143) |
| 0.3 | 78.8 | GO:0003735 | structural constituent of ribosome(GO:0003735) |
| 0.3 | 11.8 | GO:0004712 | protein serine/threonine/tyrosine kinase activity(GO:0004712) |
| 0.3 | 1.9 | GO:0004749 | ribose phosphate diphosphokinase activity(GO:0004749) |
| 0.3 | 3.0 | GO:0005412 | glucose:sodium symporter activity(GO:0005412) |
| 0.3 | 4.5 | GO:0008409 | 5'-3' exonuclease activity(GO:0008409) |
| 0.3 | 8.7 | GO:0003785 | actin monomer binding(GO:0003785) |
| 0.3 | 34.9 | GO:0042393 | histone binding(GO:0042393) |
| 0.3 | 26.4 | GO:0004540 | ribonuclease activity(GO:0004540) |
| 0.3 | 1.7 | GO:0004826 | phenylalanine-tRNA ligase activity(GO:0004826) |
| 0.3 | 15.0 | GO:0003743 | translation initiation factor activity(GO:0003743) |
| 0.3 | 2.1 | GO:0005007 | fibroblast growth factor-activated receptor activity(GO:0005007) |
| 0.3 | 5.2 | GO:0005520 | insulin-like growth factor binding(GO:0005520) |
| 0.3 | 30.0 | GO:0004867 | serine-type endopeptidase inhibitor activity(GO:0004867) |
| 0.2 | 4.0 | GO:0016864 | protein disulfide isomerase activity(GO:0003756) intramolecular oxidoreductase activity, transposing S-S bonds(GO:0016864) |
| 0.2 | 1.4 | GO:0048039 | ubiquinone binding(GO:0048039) |
| 0.2 | 0.4 | GO:0031852 | mu-type opioid receptor binding(GO:0031852) |
| 0.2 | 1.7 | GO:0035612 | AP-2 adaptor complex binding(GO:0035612) |
| 0.2 | 4.8 | GO:0070840 | dynein complex binding(GO:0070840) |
| 0.2 | 15.0 | GO:0016209 | antioxidant activity(GO:0016209) |
| 0.2 | 1.0 | GO:0043532 | angiostatin binding(GO:0043532) |
| 0.2 | 7.0 | GO:0004715 | non-membrane spanning protein tyrosine kinase activity(GO:0004715) |
| 0.2 | 1.5 | GO:0017151 | DEAD/H-box RNA helicase binding(GO:0017151) |
| 0.2 | 0.7 | GO:0008597 | calcium-dependent protein serine/threonine phosphatase regulator activity(GO:0008597) |
| 0.2 | 4.0 | GO:0042162 | telomeric DNA binding(GO:0042162) |
| 0.2 | 1.5 | GO:0031078 | histone deacetylase activity (H3-K14 specific)(GO:0031078) NAD-dependent histone deacetylase activity (H3-K14 specific)(GO:0032041) |
| 0.2 | 0.7 | GO:0019776 | Atg8 ligase activity(GO:0019776) |
| 0.2 | 5.7 | GO:0061631 | ubiquitin conjugating enzyme activity(GO:0061631) |
| 0.2 | 1.6 | GO:0086080 | protein binding involved in heterotypic cell-cell adhesion(GO:0086080) |
| 0.2 | 13.9 | GO:0004896 | cytokine receptor activity(GO:0004896) |
| 0.2 | 2.8 | GO:0017160 | Ral GTPase binding(GO:0017160) |
| 0.2 | 1.6 | GO:0008641 | small protein activating enzyme activity(GO:0008641) |
| 0.2 | 16.0 | GO:0017124 | SH3 domain binding(GO:0017124) |
| 0.2 | 0.8 | GO:0048185 | activin binding(GO:0048185) |
| 0.1 | 2.8 | GO:0000993 | RNA polymerase II core binding(GO:0000993) |
| 0.1 | 5.3 | GO:0005080 | protein kinase C binding(GO:0005080) |
| 0.1 | 9.0 | GO:0003777 | microtubule motor activity(GO:0003777) |
| 0.1 | 10.9 | GO:0036459 | thiol-dependent ubiquitinyl hydrolase activity(GO:0036459) |
| 0.1 | 2.7 | GO:0001103 | RNA polymerase II repressing transcription factor binding(GO:0001103) |
| 0.1 | 5.6 | GO:0032813 | tumor necrosis factor receptor superfamily binding(GO:0032813) |
| 0.1 | 0.9 | GO:0004689 | phosphorylase kinase activity(GO:0004689) |
| 0.1 | 4.3 | GO:0005160 | transforming growth factor beta receptor binding(GO:0005160) |
| 0.1 | 5.6 | GO:0019955 | cytokine binding(GO:0019955) |
| 0.1 | 2.7 | GO:0008536 | Ran GTPase binding(GO:0008536) |
| 0.1 | 1.3 | GO:0016805 | dipeptidase activity(GO:0016805) |
| 0.1 | 26.0 | GO:0001077 | transcriptional activator activity, RNA polymerase II core promoter proximal region sequence-specific binding(GO:0001077) |
| 0.1 | 1.9 | GO:0000146 | microfilament motor activity(GO:0000146) |
| 0.1 | 1.1 | GO:0015379 | potassium:chloride symporter activity(GO:0015379) potassium ion symporter activity(GO:0022820) |
| 0.1 | 1.0 | GO:0002161 | aminoacyl-tRNA editing activity(GO:0002161) |
| 0.1 | 0.4 | GO:0001729 | ceramide kinase activity(GO:0001729) |
| 0.1 | 5.8 | GO:0003697 | single-stranded DNA binding(GO:0003697) |
| 0.1 | 2.3 | GO:0071855 | neuropeptide receptor binding(GO:0071855) |
| 0.1 | 1.1 | GO:0004012 | phospholipid-translocating ATPase activity(GO:0004012) |
| 0.1 | 13.5 | GO:0004252 | serine-type endopeptidase activity(GO:0004252) |
| 0.1 | 3.3 | GO:0003725 | double-stranded RNA binding(GO:0003725) |
| 0.0 | 4.1 | GO:0004553 | hydrolase activity, hydrolyzing O-glycosyl compounds(GO:0004553) |
| 0.0 | 1.4 | GO:0030331 | estrogen receptor binding(GO:0030331) |
| 0.0 | 0.2 | GO:0036374 | gamma-glutamyltransferase activity(GO:0003840) glutathione hydrolase activity(GO:0036374) |
| 0.0 | 0.8 | GO:0004198 | calcium-dependent cysteine-type endopeptidase activity(GO:0004198) |
| 0.0 | 0.3 | GO:0001591 | dopamine neurotransmitter receptor activity, coupled via Gi/Go(GO:0001591) |
| 0.0 | 1.4 | GO:0097110 | scaffold protein binding(GO:0097110) |
| 0.0 | 0.5 | GO:0001594 | trace-amine receptor activity(GO:0001594) |
| 0.0 | 0.6 | GO:0043015 | gamma-tubulin binding(GO:0043015) |
| 0.0 | 0.6 | GO:0042923 | neuropeptide binding(GO:0042923) |
| 0.0 | 1.5 | GO:0051287 | NAD binding(GO:0051287) |
| 0.0 | 0.9 | GO:0001227 | transcriptional repressor activity, RNA polymerase II transcription regulatory region sequence-specific binding(GO:0001227) |
Gene overrepresentation in curated gene sets: canonical pathways category:
| Log-likelihood per target | Total log-likelihood | Term | Description |
|---|---|---|---|
| 3.2 | 58.0 | SA MMP CYTOKINE CONNECTION | Cytokines can induce activation of matrix metalloproteinases, which degrade extracellular matrix. |
| 1.7 | 5.2 | PID AR NONGENOMIC PATHWAY | Nongenotropic Androgen signaling |
| 1.4 | 63.5 | PID ARF6 PATHWAY | Arf6 signaling events |
| 1.4 | 15.2 | SA FAS SIGNALING | The TNF-type receptor Fas induces apoptosis on ligand binding. |
| 1.2 | 16.6 | PID DNA PK PATHWAY | DNA-PK pathway in nonhomologous end joining |
| 1.2 | 18.9 | PID ANTHRAX PATHWAY | Cellular roles of Anthrax toxin |
| 1.1 | 21.7 | PID NFKAPPAB ATYPICAL PATHWAY | Atypical NF-kappaB pathway |
| 1.1 | 8.6 | ST IL 13 PATHWAY | Interleukin 13 (IL-13) Pathway |
| 0.9 | 34.5 | NABA PROTEOGLYCANS | Genes encoding proteoglycans |
| 0.8 | 13.2 | PID ERB GENOMIC PATHWAY | Validated nuclear estrogen receptor beta network |
| 0.6 | 14.9 | PID TOLL ENDOGENOUS PATHWAY | Endogenous TLR signaling |
| 0.6 | 14.6 | PID GMCSF PATHWAY | GMCSF-mediated signaling events |
| 0.6 | 7.8 | PID IL5 PATHWAY | IL5-mediated signaling events |
| 0.6 | 7.8 | NABA BASEMENT MEMBRANES | Genes encoding structural components of basement membranes |
| 0.6 | 46.7 | PID RB 1PATHWAY | Regulation of retinoblastoma protein |
| 0.6 | 5.8 | PID ERBB1 INTERNALIZATION PATHWAY | Internalization of ErbB1 |
| 0.5 | 14.3 | PID SYNDECAN 2 PATHWAY | Syndecan-2-mediated signaling events |
| 0.5 | 4.8 | PID LIS1 PATHWAY | Lissencephaly gene (LIS1) in neuronal migration and development |
| 0.5 | 1.1 | PID TCR JNK PATHWAY | JNK signaling in the CD4+ TCR pathway |
| 0.5 | 10.1 | PID LPA4 PATHWAY | LPA4-mediated signaling events |
| 0.5 | 18.1 | PID AMB2 NEUTROPHILS PATHWAY | amb2 Integrin signaling |
| 0.5 | 11.5 | PID FOXM1 PATHWAY | FOXM1 transcription factor network |
| 0.5 | 12.7 | PID INTEGRIN2 PATHWAY | Beta2 integrin cell surface interactions |
| 0.5 | 14.9 | PID FCER1 PATHWAY | Fc-epsilon receptor I signaling in mast cells |
| 0.5 | 8.1 | PID UPA UPAR PATHWAY | Urokinase-type plasminogen activator (uPA) and uPAR-mediated signaling |
| 0.4 | 19.7 | ST FAS SIGNALING PATHWAY | Fas Signaling Pathway |
| 0.4 | 6.5 | SA B CELL RECEPTOR COMPLEXES | Antigen binding to B cell receptors activates protein tyrosine kinases, such as the Src family, which ultimate activate MAP kinases. |
| 0.4 | 24.8 | PID TELOMERASE PATHWAY | Regulation of Telomerase |
| 0.4 | 18.7 | PID PLK1 PATHWAY | PLK1 signaling events |
| 0.4 | 6.5 | PID PTP1B PATHWAY | Signaling events mediated by PTP1B |
| 0.4 | 21.1 | PID REG GR PATHWAY | Glucocorticoid receptor regulatory network |
| 0.4 | 17.6 | PID TCR PATHWAY | TCR signaling in naïve CD4+ T cells |
| 0.4 | 11.0 | ST WNT BETA CATENIN PATHWAY | Wnt/beta-catenin Pathway |
| 0.4 | 42.7 | PID P53 DOWNSTREAM PATHWAY | Direct p53 effectors |
| 0.4 | 11.7 | PID CDC42 REG PATHWAY | Regulation of CDC42 activity |
| 0.4 | 84.2 | NABA ECM REGULATORS | Genes encoding enzymes and their regulators involved in the remodeling of the extracellular matrix |
| 0.4 | 20.7 | PID AR PATHWAY | Coregulation of Androgen receptor activity |
| 0.3 | 7.1 | PID REELIN PATHWAY | Reelin signaling pathway |
| 0.3 | 12.9 | PID MET PATHWAY | Signaling events mediated by Hepatocyte Growth Factor Receptor (c-Met) |
| 0.3 | 59.2 | NABA ECM GLYCOPROTEINS | Genes encoding structural ECM glycoproteins |
| 0.3 | 5.9 | PID BARD1 PATHWAY | BARD1 signaling events |
| 0.3 | 4.8 | PID P38 MKK3 6PATHWAY | p38 MAPK signaling pathway |
| 0.2 | 3.9 | PID MYC PATHWAY | C-MYC pathway |
| 0.2 | 4.2 | PID INSULIN GLUCOSE PATHWAY | Insulin-mediated glucose transport |
| 0.2 | 6.9 | PID IL12 2PATHWAY | IL12-mediated signaling events |
| 0.2 | 7.5 | PID IL4 2PATHWAY | IL4-mediated signaling events |
| 0.2 | 3.8 | PID PI3KCI PATHWAY | Class I PI3K signaling events |
| 0.2 | 2.3 | PID SYNDECAN 3 PATHWAY | Syndecan-3-mediated signaling events |
| 0.2 | 2.3 | PID IL23 PATHWAY | IL23-mediated signaling events |
| 0.2 | 1.8 | SIG CD40PATHWAYMAP | Genes related to CD40 signaling |
| 0.2 | 3.9 | PID VEGFR1 2 PATHWAY | Signaling events mediated by VEGFR1 and VEGFR2 |
| 0.2 | 1.2 | PID INTEGRIN A4B1 PATHWAY | Alpha4 beta1 integrin signaling events |
| 0.2 | 8.1 | PID ERA GENOMIC PATHWAY | Validated nuclear estrogen receptor alpha network |
| 0.2 | 2.8 | PID TCR CALCIUM PATHWAY | Calcium signaling in the CD4+ TCR pathway |
| 0.2 | 2.8 | PID P38 ALPHA BETA DOWNSTREAM PATHWAY | Signaling mediated by p38-alpha and p38-beta |
| 0.1 | 6.3 | PID BETA CATENIN NUC PATHWAY | Regulation of nuclear beta catenin signaling and target gene transcription |
| 0.1 | 6.0 | PID HDAC CLASSI PATHWAY | Signaling events mediated by HDAC Class I |
| 0.1 | 0.5 | ST INTERFERON GAMMA PATHWAY | Interferon gamma pathway. |
| 0.1 | 0.9 | ST GAQ PATHWAY | G alpha q Pathway |
| 0.1 | 1.8 | PID FANCONI PATHWAY | Fanconi anemia pathway |
| 0.0 | 0.6 | PID FAK PATHWAY | Signaling events mediated by focal adhesion kinase |
| 0.0 | 0.7 | PID SMAD2 3NUCLEAR PATHWAY | Regulation of nuclear SMAD2/3 signaling |
| 0.0 | 0.5 | PID RAC1 PATHWAY | RAC1 signaling pathway |
| 0.0 | 0.3 | PID AURORA B PATHWAY | Aurora B signaling |
Gene overrepresentation in curated gene sets: REACTOME pathways category:
| Log-likelihood per target | Total log-likelihood | Term | Description |
|---|---|---|---|
| 3.8 | 15.0 | REACTOME BETA DEFENSINS | Genes involved in Beta defensins |
| 2.1 | 25.4 | REACTOME THE NLRP3 INFLAMMASOME | Genes involved in The NLRP3 inflammasome |
| 1.9 | 97.4 | REACTOME IMMUNOREGULATORY INTERACTIONS BETWEEN A LYMPHOID AND A NON LYMPHOID CELL | Genes involved in Immunoregulatory interactions between a Lymphoid and a non-Lymphoid cell |
| 1.9 | 26.7 | REACTOME SYNTHESIS OF PIPS AT THE EARLY ENDOSOME MEMBRANE | Genes involved in Synthesis of PIPs at the early endosome membrane |
| 1.7 | 18.3 | REACTOME HORMONE LIGAND BINDING RECEPTORS | Genes involved in Hormone ligand-binding receptors |
| 1.6 | 19.8 | REACTOME P2Y RECEPTORS | Genes involved in P2Y receptors |
| 1.4 | 15.2 | REACTOME NFKB ACTIVATION THROUGH FADD RIP1 PATHWAY MEDIATED BY CASPASE 8 AND10 | Genes involved in NF-kB activation through FADD/RIP-1 pathway mediated by caspase-8 and -10 |
| 1.4 | 6.9 | REACTOME BINDING AND ENTRY OF HIV VIRION | Genes involved in Binding and entry of HIV virion |
| 1.3 | 6.6 | REACTOME IKK COMPLEX RECRUITMENT MEDIATED BY RIP1 | Genes involved in IKK complex recruitment mediated by RIP1 |
| 1.3 | 27.6 | REACTOME REGULATION OF SIGNALING BY CBL | Genes involved in Regulation of signaling by CBL |
| 1.2 | 11.7 | REACTOME INHIBITION OF REPLICATION INITIATION OF DAMAGED DNA BY RB1 E2F1 | Genes involved in Inhibition of replication initiation of damaged DNA by RB1/E2F1 |
| 1.0 | 21.4 | REACTOME REGULATION OF IFNA SIGNALING | Genes involved in Regulation of IFNA signaling |
| 1.0 | 7.8 | REACTOME PACKAGING OF TELOMERE ENDS | Genes involved in Packaging Of Telomere Ends |
| 0.8 | 20.0 | REACTOME DEPOSITION OF NEW CENPA CONTAINING NUCLEOSOMES AT THE CENTROMERE | Genes involved in Deposition of New CENPA-containing Nucleosomes at the Centromere |
| 0.8 | 28.8 | REACTOME ACTIVATION OF THE PRE REPLICATIVE COMPLEX | Genes involved in Activation of the pre-replicative complex |
| 0.8 | 10.3 | REACTOME EICOSANOID LIGAND BINDING RECEPTORS | Genes involved in Eicosanoid ligand-binding receptors |
| 0.8 | 19.1 | REACTOME ANTIGEN PROCESSING CROSS PRESENTATION | Genes involved in Antigen processing-Cross presentation |
| 0.7 | 6.5 | REACTOME INTEGRATION OF PROVIRUS | Genes involved in Integration of provirus |
| 0.7 | 16.7 | REACTOME DEADENYLATION OF MRNA | Genes involved in Deadenylation of mRNA |
| 0.7 | 25.6 | REACTOME AMINE COMPOUND SLC TRANSPORTERS | Genes involved in Amine compound SLC transporters |
| 0.6 | 15.0 | REACTOME NEGATIVE REGULATORS OF RIG I MDA5 SIGNALING | Genes involved in Negative regulators of RIG-I/MDA5 signaling |
| 0.6 | 13.5 | REACTOME LYSOSOME VESICLE BIOGENESIS | Genes involved in Lysosome Vesicle Biogenesis |
| 0.5 | 13.5 | REACTOME DOWNREGULATION OF SMAD2 3 SMAD4 TRANSCRIPTIONAL ACTIVITY | Genes involved in Downregulation of SMAD2/3:SMAD4 transcriptional activity |
| 0.5 | 36.1 | REACTOME APC C CDH1 MEDIATED DEGRADATION OF CDC20 AND OTHER APC C CDH1 TARGETED PROTEINS IN LATE MITOSIS EARLY G1 | Genes involved in APC/C:Cdh1 mediated degradation of Cdc20 and other APC/C:Cdh1 targeted proteins in late mitosis/early G1 |
| 0.5 | 14.6 | REACTOME ACTIVATION OF GENES BY ATF4 | Genes involved in Activation of Genes by ATF4 |
| 0.5 | 13.1 | REACTOME RNA POL I PROMOTER OPENING | Genes involved in RNA Polymerase I Promoter Opening |
| 0.5 | 4.5 | REACTOME RNA POL I TRANSCRIPTION TERMINATION | Genes involved in RNA Polymerase I Transcription Termination |
| 0.5 | 55.8 | REACTOME MRNA SPLICING | Genes involved in mRNA Splicing |
| 0.4 | 18.3 | REACTOME INTERFERON GAMMA SIGNALING | Genes involved in Interferon gamma signaling |
| 0.4 | 7.0 | REACTOME ACYL CHAIN REMODELLING OF PS | Genes involved in Acyl chain remodelling of PS |
| 0.4 | 16.6 | REACTOME ABC FAMILY PROTEINS MEDIATED TRANSPORT | Genes involved in ABC-family proteins mediated transport |
| 0.4 | 40.4 | REACTOME PEPTIDE CHAIN ELONGATION | Genes involved in Peptide chain elongation |
| 0.4 | 10.3 | REACTOME MEIOTIC RECOMBINATION | Genes involved in Meiotic Recombination |
| 0.4 | 3.2 | REACTOME MTORC1 MEDIATED SIGNALLING | Genes involved in mTORC1-mediated signalling |
| 0.4 | 7.1 | REACTOME POST CHAPERONIN TUBULIN FOLDING PATHWAY | Genes involved in Post-chaperonin tubulin folding pathway |
| 0.4 | 2.3 | REACTOME DIGESTION OF DIETARY CARBOHYDRATE | Genes involved in Digestion of dietary carbohydrate |
| 0.4 | 1.5 | REACTOME PECAM1 INTERACTIONS | Genes involved in PECAM1 interactions |
| 0.3 | 16.1 | REACTOME COSTIMULATION BY THE CD28 FAMILY | Genes involved in Costimulation by the CD28 family |
| 0.3 | 31.2 | REACTOME RESPONSE TO ELEVATED PLATELET CYTOSOLIC CA2 | Genes involved in Response to elevated platelet cytosolic Ca2+ |
| 0.3 | 3.7 | REACTOME CREB PHOSPHORYLATION THROUGH THE ACTIVATION OF CAMKII | Genes involved in CREB phosphorylation through the activation of CaMKII |
| 0.3 | 16.8 | REACTOME PHASE1 FUNCTIONALIZATION OF COMPOUNDS | Genes involved in Phase 1 - Functionalization of compounds |
| 0.3 | 8.5 | REACTOME DARPP 32 EVENTS | Genes involved in DARPP-32 events |
| 0.3 | 3.3 | REACTOME THE ACTIVATION OF ARYLSULFATASES | Genes involved in The activation of arylsulfatases |
| 0.3 | 7.8 | REACTOME IL RECEPTOR SHC SIGNALING | Genes involved in Interleukin receptor SHC signaling |
| 0.3 | 5.8 | REACTOME BRANCHED CHAIN AMINO ACID CATABOLISM | Genes involved in Branched-chain amino acid catabolism |
| 0.3 | 2.7 | REACTOME REGULATORY RNA PATHWAYS | Genes involved in Regulatory RNA pathways |
| 0.3 | 3.5 | REACTOME PURINE RIBONUCLEOSIDE MONOPHOSPHATE BIOSYNTHESIS | Genes involved in Purine ribonucleoside monophosphate biosynthesis |
| 0.3 | 7.1 | REACTOME RNA POL II TRANSCRIPTION PRE INITIATION AND PROMOTER OPENING | Genes involved in RNA Polymerase II Transcription Pre-Initiation And Promoter Opening |
| 0.2 | 17.9 | REACTOME MITOTIC PROMETAPHASE | Genes involved in Mitotic Prometaphase |
| 0.2 | 5.0 | REACTOME MEIOSIS | Genes involved in Meiosis |
| 0.2 | 3.8 | REACTOME GLYCOGEN BREAKDOWN GLYCOGENOLYSIS | Genes involved in Glycogen breakdown (glycogenolysis) |
| 0.2 | 1.1 | REACTOME TRAF6 MEDIATED INDUCTION OF TAK1 COMPLEX | Genes involved in TRAF6 mediated induction of TAK1 complex |
| 0.1 | 2.8 | REACTOME ERK MAPK TARGETS | Genes involved in ERK/MAPK targets |
| 0.1 | 4.1 | REACTOME GLYCOSPHINGOLIPID METABOLISM | Genes involved in Glycosphingolipid metabolism |
| 0.1 | 6.7 | REACTOME MITOCHONDRIAL PROTEIN IMPORT | Genes involved in Mitochondrial Protein Import |
| 0.1 | 6.4 | REACTOME LOSS OF NLP FROM MITOTIC CENTROSOMES | Genes involved in Loss of Nlp from mitotic centrosomes |
| 0.1 | 3.6 | REACTOME METAL ION SLC TRANSPORTERS | Genes involved in Metal ion SLC transporters |
| 0.1 | 1.0 | REACTOME REGULATION OF APOPTOSIS | Genes involved in Regulation of Apoptosis |
| 0.1 | 8.6 | REACTOME NUCLEAR RECEPTOR TRANSCRIPTION PATHWAY | Genes involved in Nuclear Receptor transcription pathway |
| 0.1 | 1.7 | REACTOME ENOS ACTIVATION AND REGULATION | Genes involved in eNOS activation and regulation |
| 0.1 | 4.5 | REACTOME ANTIVIRAL MECHANISM BY IFN STIMULATED GENES | Genes involved in Antiviral mechanism by IFN-stimulated genes |
| 0.1 | 1.5 | REACTOME AMINO ACID SYNTHESIS AND INTERCONVERSION TRANSAMINATION | Genes involved in Amino acid synthesis and interconversion (transamination) |
| 0.1 | 2.0 | REACTOME SRP DEPENDENT COTRANSLATIONAL PROTEIN TARGETING TO MEMBRANE | Genes involved in SRP-dependent cotranslational protein targeting to membrane |
| 0.1 | 2.2 | REACTOME A TETRASACCHARIDE LINKER SEQUENCE IS REQUIRED FOR GAG SYNTHESIS | Genes involved in A tetrasaccharide linker sequence is required for GAG synthesis |
| 0.1 | 1.9 | REACTOME INSULIN SYNTHESIS AND PROCESSING | Genes involved in Insulin Synthesis and Processing |
| 0.1 | 2.5 | REACTOME ACTIVATION OF CHAPERONE GENES BY XBP1S | Genes involved in Activation of Chaperone Genes by XBP1(S) |
| 0.1 | 0.9 | REACTOME AMINE DERIVED HORMONES | Genes involved in Amine-derived hormones |
| 0.1 | 2.2 | REACTOME GOLGI ASSOCIATED VESICLE BIOGENESIS | Genes involved in Golgi Associated Vesicle Biogenesis |
| 0.1 | 2.6 | REACTOME CHEMOKINE RECEPTORS BIND CHEMOKINES | Genes involved in Chemokine receptors bind chemokines |
| 0.1 | 0.3 | REACTOME REGULATION OF KIT SIGNALING | Genes involved in Regulation of KIT signaling |
| 0.1 | 4.1 | REACTOME TRANSCRIPTIONAL REGULATION OF WHITE ADIPOCYTE DIFFERENTIATION | Genes involved in Transcriptional Regulation of White Adipocyte Differentiation |
| 0.0 | 1.5 | REACTOME NOTCH1 INTRACELLULAR DOMAIN REGULATES TRANSCRIPTION | Genes involved in NOTCH1 Intracellular Domain Regulates Transcription |
| 0.0 | 0.6 | REACTOME SIGNAL TRANSDUCTION BY L1 | Genes involved in Signal transduction by L1 |
| 0.0 | 0.3 | REACTOME PRE NOTCH PROCESSING IN GOLGI | Genes involved in Pre-NOTCH Processing in Golgi |
| 0.0 | 0.5 | REACTOME TRANSFERRIN ENDOCYTOSIS AND RECYCLING | Genes involved in Transferrin endocytosis and recycling |