Project
GSE49485: Hypoxia transcriptome sequencing of rat brain.
Navigation
Downloads
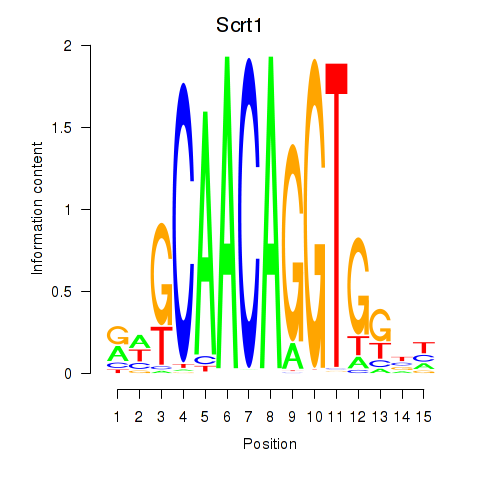
Results for Scrt1
Z-value: 0.43
Motif logo
Transcription factors associated with Scrt1
| Gene Symbol | Gene ID | Gene Info |
|---|---|---|
|
Scrt1
|
ENSRNOG00000025594 | scratch family transcriptional repressor 1 |
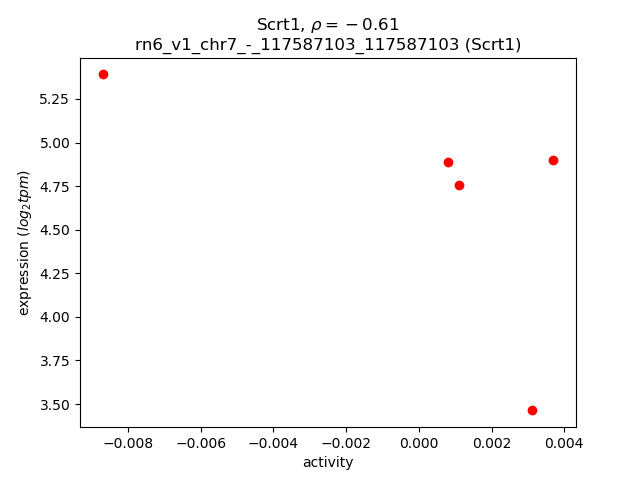
Activity-expression correlation:
| Gene | Promoter | Pearson corr. coef. | P-value | Plot |
|---|---|---|---|---|
| Scrt1 | rn6_v1_chr7_-_117587103_117587103 | -0.61 | 2.7e-01 | Click! |
Activity profile of Scrt1 motif
Sorted Z-values of Scrt1 motif
| Promoter | Log-likelihood | Transcript | Gene | Gene Info |
|---|---|---|---|---|
| chr1_-_15301998 | 0.26 |
ENSRNOT00000016400
|
Slc35d3
|
solute carrier family 35, member D3 |
| chr16_-_19942343 | 0.18 |
ENSRNOT00000087162
ENSRNOT00000091906 |
Bst2
|
bone marrow stromal cell antigen 2 |
| chr1_+_205842489 | 0.14 |
ENSRNOT00000081610
|
Fank1
|
fibronectin type 3 and ankyrin repeat domains 1 |
| chr1_+_53220397 | 0.13 |
ENSRNOT00000089989
|
AABR07001573.1
|
|
| chr10_+_90550147 | 0.12 |
ENSRNOT00000032944
|
Fzd2
|
frizzled class receptor 2 |
| chr1_-_82004538 | 0.12 |
ENSRNOT00000087572
|
Pou2f2
|
POU class 2 homeobox 2 |
| chr1_-_120893997 | 0.12 |
ENSRNOT00000081028
|
AABR07003933.1
|
|
| chr1_+_78820262 | 0.10 |
ENSRNOT00000022441
|
Gng8
|
G protein subunit gamma 8 |
| chr10_-_48860902 | 0.10 |
ENSRNOT00000004127
|
Cenpv
|
centromere protein V |
| chr17_-_9791781 | 0.09 |
ENSRNOT00000090536
|
Rgs14
|
regulator of G-protein signaling 14 |
| chr13_+_48644604 | 0.09 |
ENSRNOT00000084259
ENSRNOT00000073669 |
Rab29
|
RAB29, member RAS oncogene family |
| chr20_+_5050327 | 0.09 |
ENSRNOT00000083353
|
Ddah2
|
dimethylarginine dimethylaminohydrolase 2 |
| chr5_+_153197459 | 0.09 |
ENSRNOT00000023187
|
Rhd
|
Rh blood group, D antigen |
| chr17_-_66397653 | 0.09 |
ENSRNOT00000024098
|
Actn2
|
actinin alpha 2 |
| chr10_+_3225481 | 0.09 |
ENSRNOT00000093598
|
Ntan1
|
N-terminal asparagine amidase |
| chr17_-_9792007 | 0.09 |
ENSRNOT00000021596
|
Rgs14
|
regulator of G-protein signaling 14 |
| chr2_-_186333805 | 0.09 |
ENSRNOT00000022150
|
Cd1d1
|
CD1d1 molecule |
| chrX_+_106360393 | 0.08 |
ENSRNOT00000004260
|
Gprasp2
|
G protein-coupled receptor associated sorting protein 2 |
| chr9_+_12740885 | 0.08 |
ENSRNOT00000015210
|
Rftn1
|
raftlin lipid raft linker 1 |
| chr3_-_177205836 | 0.08 |
ENSRNOT00000034209
|
Lkaaear1
|
LKAAEAR motif containing 1 |
| chr14_-_18853315 | 0.08 |
ENSRNOT00000003794
|
Ppbp
|
pro-platelet basic protein |
| chr10_+_55138633 | 0.08 |
ENSRNOT00000057223
|
Mfsd6l
|
major facilitator superfamily domain containing 6-like |
| chr2_+_121165137 | 0.08 |
ENSRNOT00000016236
|
Sox2
|
SRY box 2 |
| chrX_-_106607352 | 0.08 |
ENSRNOT00000082858
|
AABR07040624.1
|
|
| chr12_+_2534212 | 0.08 |
ENSRNOT00000001399
|
Ctxn1
|
cortexin 1 |
| chr16_-_81583374 | 0.08 |
ENSRNOT00000092501
|
LOC103693999
|
transmembrane and coiled-coil domain-containing protein 3 |
| chr2_+_209766512 | 0.08 |
ENSRNOT00000092240
|
Kcna3
|
potassium voltage-gated channel subfamily A member 3 |
| chr9_-_14618013 | 0.08 |
ENSRNOT00000018351
|
Trem2
|
triggering receptor expressed on myeloid cells 2 |
| chr5_+_139038134 | 0.07 |
ENSRNOT00000078155
|
Hivep3
|
human immunodeficiency virus type I enhancer binding protein 3 |
| chr14_-_43143973 | 0.07 |
ENSRNOT00000003248
|
Uchl1
|
ubiquitin C-terminal hydrolase L1 |
| chr1_+_213766758 | 0.07 |
ENSRNOT00000005645
|
Ifitm1
|
interferon induced transmembrane protein 1 |
| chr2_-_256915563 | 0.07 |
ENSRNOT00000084873
ENSRNOT00000029990 |
Ifi44
|
interferon-induced protein 44 |
| chr20_+_8486265 | 0.07 |
ENSRNOT00000072213
|
LOC100909911
|
40S ribosomal protein S20-like |
| chr17_+_57074525 | 0.07 |
ENSRNOT00000020012
ENSRNOT00000074146 |
Crem
|
cAMP responsive element modulator |
| chr15_-_34693034 | 0.07 |
ENSRNOT00000083314
|
Mcpt8
|
mast cell protease 8 |
| chr1_-_89369960 | 0.07 |
ENSRNOT00000028545
|
Hamp
|
hepcidin antimicrobial peptide |
| chr3_-_16537433 | 0.07 |
ENSRNOT00000048523
|
AABR07051533.2
|
|
| chr7_+_99677290 | 0.07 |
ENSRNOT00000086039
ENSRNOT00000005376 |
Nsmce2
|
NSE2/MMS21 homolog, SMC5-SMC6 complex SUMO ligase |
| chr1_+_167320797 | 0.07 |
ENSRNOT00000076923
|
Pgap2
|
post-GPI attachment to proteins 2 |
| chr9_+_100511610 | 0.07 |
ENSRNOT00000033233
|
Ano7
|
anoctamin 7 |
| chr3_+_119776925 | 0.07 |
ENSRNOT00000018549
|
Dusp2
|
dual specificity phosphatase 2 |
| chr1_-_82120902 | 0.07 |
ENSRNOT00000027684
|
Erf
|
Ets2 repressor factor |
| chr3_+_138174054 | 0.07 |
ENSRNOT00000007946
|
Banf2
|
barrier to autointegration factor 2 |
| chr10_+_48773828 | 0.07 |
ENSRNOT00000004113
|
Pigl
|
phosphatidylinositol glycan anchor biosynthesis, class L |
| chr1_+_98398660 | 0.06 |
ENSRNOT00000047473
|
Cd33
|
CD33 molecule |
| chr1_-_255573377 | 0.06 |
ENSRNOT00000027780
|
Ubbp4
|
ubiquitin B pseudogene 4 |
| chr7_+_94130852 | 0.06 |
ENSRNOT00000011485
|
Mal2
|
mal, T-cell differentiation protein 2 |
| chr10_-_13898855 | 0.06 |
ENSRNOT00000004249
|
Rab26
|
RAB26, member RAS oncogene family |
| chr4_-_119591817 | 0.06 |
ENSRNOT00000048768
|
AC097129.1
|
|
| chr20_-_47306318 | 0.06 |
ENSRNOT00000075151
|
Nr2e1
|
nuclear receptor subfamily 2, group E, member 1 |
| chr3_+_117416345 | 0.06 |
ENSRNOT00000056054
|
Ctxn2
|
cortexin 2 |
| chr1_+_48077033 | 0.06 |
ENSRNOT00000020100
|
Mas1
|
MAS1 proto-oncogene, G protein-coupled receptor |
| chr2_+_208749996 | 0.06 |
ENSRNOT00000086321
|
Chia
|
chitinase, acidic |
| chr17_+_57075218 | 0.06 |
ENSRNOT00000089536
|
Crem
|
cAMP responsive element modulator |
| chr1_+_106896790 | 0.06 |
ENSRNOT00000042952
ENSRNOT00000064193 |
Ano5
|
anoctamin 5 |
| chr6_-_50846965 | 0.06 |
ENSRNOT00000087300
|
Slc26a4
|
solute carrier family 26 member 4 |
| chr18_-_79258570 | 0.06 |
ENSRNOT00000022401
|
Galr1
|
galanin receptor 1 |
| chr5_-_119564846 | 0.06 |
ENSRNOT00000012977
|
Cyp2j4
|
cytochrome P450, family 2, subfamily j, polypeptide 4 |
| chr3_-_8659102 | 0.06 |
ENSRNOT00000050908
|
Zdhhc12
|
zinc finger, DHHC-type containing 12 |
| chr5_-_68059933 | 0.06 |
ENSRNOT00000088716
|
Plppr1
|
phospholipid phosphatase related 1 |
| chr1_+_276659542 | 0.06 |
ENSRNOT00000019681
|
Tcf7l2
|
transcription factor 7 like 2 |
| chrX_-_25628272 | 0.06 |
ENSRNOT00000086414
|
Mid1
|
midline 1 |
| chrX_-_104814145 | 0.06 |
ENSRNOT00000004909
|
Sytl4
|
synaptotagmin-like 4 |
| chr4_-_168933079 | 0.06 |
ENSRNOT00000000025
|
Hebp1
|
heme binding protein 1 |
| chr3_+_147042944 | 0.06 |
ENSRNOT00000012608
|
Fkbp1a
|
FK506 binding protein 1a |
| chrX_-_23649466 | 0.06 |
ENSRNOT00000059431
|
Shroom2
|
shroom family member 2 |
| chr11_+_61661310 | 0.06 |
ENSRNOT00000093325
|
Zdhhc23
|
zinc finger, DHHC-type containing 23 |
| chr7_+_120273117 | 0.06 |
ENSRNOT00000014349
|
Galr3
|
galanin receptor 3 |
| chr5_+_27312928 | 0.06 |
ENSRNOT00000078102
|
Runx1t1
|
RUNX1 translocation partner 1 |
| chr2_-_198439454 | 0.06 |
ENSRNOT00000028780
|
Fcgr1a
|
Fc fragment of IgG receptor Ia |
| chr1_+_219243447 | 0.06 |
ENSRNOT00000024129
|
Tbx10
|
T-box 10 |
| chr2_-_189818224 | 0.06 |
ENSRNOT00000020575
|
Ints3
|
integrator complex subunit 3 |
| chr7_+_129812789 | 0.05 |
ENSRNOT00000006357
|
Creld2
|
cysteine-rich with EGF-like domains 2 |
| chr8_-_23130877 | 0.05 |
ENSRNOT00000019140
|
Elof1
|
elongation factor 1 homolog |
| chr10_+_43633035 | 0.05 |
ENSRNOT00000077764
|
Igtp
|
interferon gamma induced GTPase |
| chr10_+_59539405 | 0.05 |
ENSRNOT00000077107
|
Itgae
|
integrin subunit alpha E |
| chr1_-_166988062 | 0.05 |
ENSRNOT00000039564
|
Lrtomt
|
leucine rich transmembrane and O-methyltransferase domain containing |
| chr3_-_3295101 | 0.05 |
ENSRNOT00000051729
|
Sohlh1
|
spermatogenesis and oogenesis specific basic helix-loop-helix 1 |
| chr16_-_71125316 | 0.05 |
ENSRNOT00000020900
|
Plpp5
|
phospholipid phosphatase 5 |
| chr18_+_65285318 | 0.05 |
ENSRNOT00000020431
|
Tcf4
|
transcription factor 4 |
| chr1_-_20155960 | 0.05 |
ENSRNOT00000061389
|
Samd3
|
sterile alpha motif domain containing 3 |
| chr19_-_10976396 | 0.05 |
ENSRNOT00000073239
|
Nlrc5
|
NLR family, CARD domain containing 5 |
| chr8_+_56179816 | 0.05 |
ENSRNOT00000059078
|
Arhgap20
|
Rho GTPase activating protein 20 |
| chr3_-_113405829 | 0.05 |
ENSRNOT00000036823
|
Ell3
|
elongation factor for RNA polymerase II 3 |
| chr10_-_89374516 | 0.05 |
ENSRNOT00000028084
|
Vat1
|
vesicle amine transport 1 |
| chr7_+_12974169 | 0.05 |
ENSRNOT00000010555
|
C2cd4c
|
C2 calcium-dependent domain containing 4C |
| chr7_+_76980040 | 0.05 |
ENSRNOT00000050726
|
LOC108350501
|
40S ribosomal protein S29 |
| chr4_+_114760879 | 0.05 |
ENSRNOT00000090713
|
AC117925.2
|
|
| chr8_+_6811543 | 0.05 |
ENSRNOT00000008905
ENSRNOT00000042553 |
Trpc6
|
transient receptor potential cation channel, subfamily C, member 6 |
| chr5_+_152680407 | 0.05 |
ENSRNOT00000076864
|
Stmn1
|
stathmin 1 |
| chr2_+_28049217 | 0.05 |
ENSRNOT00000022144
|
Enc1
|
ectodermal-neural cortex 1 |
| chr2_+_208750356 | 0.05 |
ENSRNOT00000041562
|
Chia
|
chitinase, acidic |
| chr2_-_210874304 | 0.05 |
ENSRNOT00000088657
|
Ampd2
|
adenosine monophosphate deaminase 2 |
| chr13_-_36290531 | 0.05 |
ENSRNOT00000071388
|
Steap3
|
STEAP3 metalloreductase |
| chr10_-_97582188 | 0.05 |
ENSRNOT00000005076
|
Rgs9
|
regulator of G-protein signaling 9 |
| chr1_-_266830976 | 0.05 |
ENSRNOT00000027450
|
Pcgf6
|
polycomb group ring finger 6 |
| chr18_-_74478341 | 0.05 |
ENSRNOT00000074572
|
Slc14a1
|
solute carrier family 14 member 1 |
| chrX_+_17171605 | 0.05 |
ENSRNOT00000048236
|
Nudt10
|
nudix (nucleoside diphosphate linked moiety X)-type motif 10 |
| chr1_-_82003691 | 0.05 |
ENSRNOT00000084569
|
Pou2f2
|
POU class 2 homeobox 2 |
| chr5_+_161889342 | 0.05 |
ENSRNOT00000040481
|
LOC100362684
|
ribosomal protein S20-like |
| chr6_-_59950586 | 0.05 |
ENSRNOT00000005800
|
Arl4a
|
ADP-ribosylation factor like GTPase 4A |
| chr8_+_22947152 | 0.05 |
ENSRNOT00000016790
|
Plppr2
|
phospholipid phosphatase related 2 |
| chrX_+_17016778 | 0.05 |
ENSRNOT00000003989
|
Bmp15
|
bone morphogenetic protein 15 |
| chr2_+_225005019 | 0.04 |
ENSRNOT00000015579
|
Cnn3
|
calponin 3 |
| chr4_+_158243086 | 0.04 |
ENSRNOT00000032112
|
Ano2
|
anoctamin 2 |
| chr14_+_113202419 | 0.04 |
ENSRNOT00000004764
|
Efemp1
|
EGF-containing fibulin-like extracellular matrix protein 1 |
| chr3_-_147479472 | 0.04 |
ENSRNOT00000074295
|
Fam110a
|
family with sequence similarity 110, member A |
| chr6_+_115170865 | 0.04 |
ENSRNOT00000005671
|
Tshr
|
thyroid stimulating hormone receptor |
| chr4_+_165732643 | 0.04 |
ENSRNOT00000034403
|
LOC690326
|
hypothetical protein LOC690326 |
| chr2_-_149563905 | 0.04 |
ENSRNOT00000086186
|
Igsf10
|
immunoglobulin superfamily, member 10 |
| chr20_+_37876650 | 0.04 |
ENSRNOT00000001054
|
Gja1
|
gap junction protein, alpha 1 |
| chr16_+_6970342 | 0.04 |
ENSRNOT00000061294
ENSRNOT00000048344 |
Itih4
|
inter-alpha-trypsin inhibitor heavy chain family, member 4 |
| chr1_+_56242346 | 0.04 |
ENSRNOT00000019317
|
Smoc2
|
SPARC related modular calcium binding 2 |
| chr15_-_44411004 | 0.04 |
ENSRNOT00000031163
|
Cdca2
|
cell division cycle associated 2 |
| chr4_+_119225040 | 0.04 |
ENSRNOT00000012365
|
Bmp10
|
bone morphogenetic protein 10 |
| chr1_-_209749204 | 0.04 |
ENSRNOT00000073093
|
LOC100362342
|
rCG47764-like |
| chr13_-_99287887 | 0.04 |
ENSRNOT00000004780
|
Ephx1
|
epoxide hydrolase 1 |
| chr5_-_152458023 | 0.04 |
ENSRNOT00000031225
|
Cnksr1
|
connector enhancer of kinase suppressor of Ras 1 |
| chr13_-_42263024 | 0.04 |
ENSRNOT00000004741
|
Lypd1
|
Ly6/Plaur domain containing 1 |
| chr1_+_242959488 | 0.04 |
ENSRNOT00000015668
|
Dock8
|
dedicator of cytokinesis 8 |
| chr5_-_151895016 | 0.04 |
ENSRNOT00000081841
|
Pigv
|
phosphatidylinositol glycan anchor biosynthesis, class V |
| chr10_-_40419054 | 0.04 |
ENSRNOT00000039040
|
Ccdc69
|
coiled-coil domain containing 69 |
| chr8_-_128521109 | 0.04 |
ENSRNOT00000034025
|
Scn11a
|
sodium voltage-gated channel alpha subunit 11 |
| chr6_-_127534247 | 0.04 |
ENSRNOT00000012500
|
Serpina6
|
serpin family A member 6 |
| chr13_-_90832138 | 0.04 |
ENSRNOT00000010930
|
Igsf9
|
immunoglobulin superfamily, member 9 |
| chr2_+_252263386 | 0.04 |
ENSRNOT00000092913
ENSRNOT00000084034 ENSRNOT00000041186 ENSRNOT00000092931 |
Ssx2ip
|
SSX family member 2 interacting protein |
| chr3_+_22829817 | 0.04 |
ENSRNOT00000082561
|
Nek6
|
NIMA-related kinase 6 |
| chr2_-_142885604 | 0.04 |
ENSRNOT00000031487
|
Frem2
|
Fras1 related extracellular matrix protein 2 |
| chr12_-_9864791 | 0.04 |
ENSRNOT00000073026
|
Gtf3a
|
general transcription factor III A |
| chr6_+_27975417 | 0.04 |
ENSRNOT00000077830
|
Dtnb
|
dystrobrevin, beta |
| chr7_+_14891001 | 0.04 |
ENSRNOT00000041034
|
Cyp4f4
|
cytochrome P450, family 4, subfamily f, polypeptide 4 |
| chr1_-_198128857 | 0.04 |
ENSRNOT00000026496
|
Coro1a
|
coronin 1A |
| chr8_+_130350510 | 0.04 |
ENSRNOT00000073376
|
Ss18l2
|
SS18 like 2 |
| chr10_+_62981297 | 0.04 |
ENSRNOT00000031618
|
Efcab5
|
EF-hand calcium binding domain 5 |
| chr6_-_111329882 | 0.04 |
ENSRNOT00000074480
|
Ism2
|
isthmin 2 |
| chr5_+_58505500 | 0.04 |
ENSRNOT00000043216
|
Unc13b
|
unc-13 homolog B |
| chrX_+_111396995 | 0.04 |
ENSRNOT00000087634
|
Pih1d3
|
PIH1 domain containing 3 |
| chr1_-_265899958 | 0.04 |
ENSRNOT00000026013
|
Pitx3
|
paired-like homeodomain 3 |
| chr6_-_102272777 | 0.04 |
ENSRNOT00000014775
|
Pigh
|
phosphatidylinositol glycan anchor biosynthesis, class H |
| chr8_+_116754178 | 0.04 |
ENSRNOT00000068295
ENSRNOT00000084429 |
Uba7
|
ubiquitin-like modifier activating enzyme 7 |
| chr1_-_188101566 | 0.04 |
ENSRNOT00000092435
|
Syt17
|
synaptotagmin 17 |
| chr2_-_18927365 | 0.04 |
ENSRNOT00000045850
|
Xrcc4
|
X-ray repair cross complementing 4 |
| chr19_-_25261911 | 0.04 |
ENSRNOT00000045180
ENSRNOT00000009806 |
Cc2d1a
|
coiled-coil and C2 domain containing 1A |
| chr1_-_56967895 | 0.03 |
ENSRNOT00000085273
|
Phf10
|
PHD finger protein 10 |
| chr1_-_189199376 | 0.03 |
ENSRNOT00000021027
|
Umod
|
uromodulin |
| chr7_-_36597462 | 0.03 |
ENSRNOT00000066322
|
Mrpl42
|
mitochondrial ribosomal protein L42 |
| chr11_+_61661724 | 0.03 |
ENSRNOT00000079423
|
Zdhhc23
|
zinc finger, DHHC-type containing 23 |
| chr19_-_54174387 | 0.03 |
ENSRNOT00000058502
|
AC118833.1
|
|
| chr8_-_132910905 | 0.03 |
ENSRNOT00000008630
|
Fyco1
|
FYVE and coiled-coil domain containing 1 |
| chr9_-_17206994 | 0.03 |
ENSRNOT00000026195
|
Gtpbp2
|
GTP binding protein 2 |
| chr9_-_94250809 | 0.03 |
ENSRNOT00000026387
|
Ecel1
|
endothelin converting enzyme-like 1 |
| chr20_+_28572242 | 0.03 |
ENSRNOT00000072485
|
Sh3rf3
|
SH3 domain containing ring finger 3 |
| chr6_+_50725085 | 0.03 |
ENSRNOT00000009473
|
Slc26a3
|
solute carrier family 26 member 3 |
| chr20_+_55594676 | 0.03 |
ENSRNOT00000057010
|
Sim1
|
single-minded family bHLH transcription factor 1 |
| chr17_+_76079907 | 0.03 |
ENSRNOT00000092710
|
Proser2
|
proline and serine rich 2 |
| chr1_-_198267093 | 0.03 |
ENSRNOT00000047477
|
RGD1563217
|
similar to RIKEN cDNA 4930451I11 |
| chr1_-_80311043 | 0.03 |
ENSRNOT00000068092
|
Klc3
|
kinesin light chain 3 |
| chr7_+_59462456 | 0.03 |
ENSRNOT00000083834
|
AC136025.1
|
|
| chr17_-_76401249 | 0.03 |
ENSRNOT00000082669
|
Nudt5
|
nudix hydrolase 5 |
| chr12_+_22153983 | 0.03 |
ENSRNOT00000080775
ENSRNOT00000001894 |
Pcolce
|
procollagen C-endopeptidase enhancer |
| chr10_+_91710495 | 0.03 |
ENSRNOT00000033276
|
Rprml
|
reprimo-like |
| chr8_-_13290773 | 0.03 |
ENSRNOT00000012217
|
RGD1561795
|
similar to RIKEN cDNA 1700012B09 |
| chr12_+_48101673 | 0.03 |
ENSRNOT00000065060
|
Foxn4
|
forkhead box N4 |
| chr16_-_82439441 | 0.03 |
ENSRNOT00000040315
|
AABR07026539.1
|
|
| chr7_+_65005791 | 0.03 |
ENSRNOT00000005794
|
LOC100911956
|
protein LLP homolog |
| chr2_-_104958034 | 0.03 |
ENSRNOT00000080699
|
Gyg1
|
glycogenin 1 |
| chr19_+_52077501 | 0.03 |
ENSRNOT00000079240
|
Osgin1
|
oxidative stress induced growth inhibitor 1 |
| chr17_+_2690062 | 0.03 |
ENSRNOT00000024937
|
Olr1653
|
olfactory receptor 1653 |
| chr18_-_40254845 | 0.03 |
ENSRNOT00000004742
|
Ccdc112
|
coiled-coil domain containing 112 |
| chr10_+_89236256 | 0.03 |
ENSRNOT00000027957
|
Psme3
|
proteasome activator subunit 3 |
| chr1_+_221704493 | 0.03 |
ENSRNOT00000028592
|
Men1
|
menin 1 |
| chr9_-_14724093 | 0.03 |
ENSRNOT00000018500
|
Trem3
|
triggering receptor expressed on myeloid cells 3 |
| chr3_-_48604097 | 0.03 |
ENSRNOT00000009620
|
Ifih1
|
interferon induced with helicase C domain 1 |
| chr8_+_62341613 | 0.03 |
ENSRNOT00000066923
|
Scamp2
|
secretory carrier membrane protein 2 |
| chr4_-_132740938 | 0.03 |
ENSRNOT00000007185
|
Rybp
|
RING1 and YY1 binding protein |
| chr8_-_71050853 | 0.03 |
ENSRNOT00000073571
|
Ankdd1a
|
ankyrin repeat and death domain containing 1A |
| chr8_-_22874637 | 0.03 |
ENSRNOT00000064551
ENSRNOT00000090424 |
Dock6
|
dedicator of cytokinesis 6 |
| chr12_+_46042413 | 0.03 |
ENSRNOT00000046882
|
Ccdc60
|
coiled-coil domain containing 60 |
| chr13_-_61070599 | 0.03 |
ENSRNOT00000005251
|
Rgs1
|
regulator of G-protein signaling 1 |
| chr7_+_136037230 | 0.03 |
ENSRNOT00000071423
|
AABR07058745.1
|
|
| chr16_+_9235888 | 0.03 |
ENSRNOT00000027204
|
Lrrc18
|
leucine rich repeat containing 18 |
| chr7_+_143754892 | 0.03 |
ENSRNOT00000085896
|
Soat2
|
sterol O-acyltransferase 2 |
| chr12_-_41497610 | 0.03 |
ENSRNOT00000001860
|
Iqcd
|
IQ motif containing D |
| chr8_+_116657371 | 0.03 |
ENSRNOT00000024966
|
Mon1a
|
MON1 homolog A, secretory trafficking associated |
| chrX_+_16337102 | 0.03 |
ENSRNOT00000003954
|
Ccnb3
|
cyclin B3 |
| chr13_+_70157522 | 0.03 |
ENSRNOT00000036906
|
Apobec4
|
apolipoprotein B mRNA editing enzyme catalytic polypeptide like 4 |
| chr2_+_187697523 | 0.03 |
ENSRNOT00000026153
|
Glmp
|
glycosylated lysosomal membrane protein |
| chr6_+_55374984 | 0.03 |
ENSRNOT00000091682
|
Agr3
|
anterior gradient 3, protein disulphide isomerase family member |
| chr2_-_93641497 | 0.03 |
ENSRNOT00000013720
|
Chmp4c
|
charged multivesicular body protein 4C |
| chr10_-_14022452 | 0.03 |
ENSRNOT00000016554
|
Npw
|
neuropeptide W |
| chr14_+_37918652 | 0.03 |
ENSRNOT00000088441
|
Tec
|
tec protein tyrosine kinase |
| chr2_+_192253629 | 0.03 |
ENSRNOT00000016364
|
Pglyrp3
|
peptidoglycan recognition protein 3 |
| chr2_+_93520734 | 0.03 |
ENSRNOT00000083909
|
Snx16
|
sorting nexin 16 |
| chr2_+_237751654 | 0.03 |
ENSRNOT00000038827
|
Tbck
|
TBC1 domain containing kinase |
| chr1_-_79690434 | 0.03 |
ENSRNOT00000057986
ENSRNOT00000057988 |
LOC102557319
|
carcinoembryonic antigen-related cell adhesion molecule 3-like |
| chr10_-_11901765 | 0.03 |
ENSRNOT00000009936
ENSRNOT00000075238 |
Naa60
|
N(alpha)-acetyltransferase 60, NatF catalytic subunit |
| chr1_+_277689729 | 0.03 |
ENSRNOT00000051834
|
Vwa2
|
von Willebrand factor A domain containing 2 |
| chr7_+_13938302 | 0.02 |
ENSRNOT00000009643
|
Casp14
|
caspase 14 |
| chr1_+_216677373 | 0.02 |
ENSRNOT00000027925
|
Slc22a18
|
solute carrier family 22, member 18 |
| chr10_+_109904259 | 0.02 |
ENSRNOT00000073886
|
Rac3
|
ras-related C3 botulinum toxin substrate 3 (rho family, small GTP binding protein Rac3) |
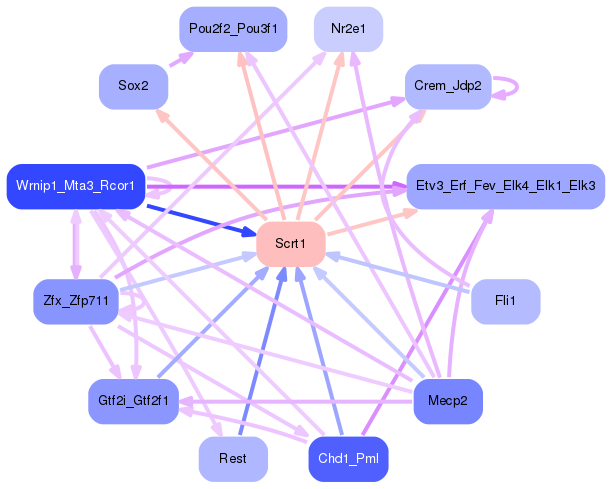
Network of associatons between targets according to the STRING database.

First level regulatory network of Scrt1
Gene Ontology Analysis
Gene overrepresentation in biological process category:
| Log-likelihood per target | Total log-likelihood | Term | Description |
|---|---|---|---|
| 0.1 | 0.2 | GO:0010070 | zygote asymmetric cell division(GO:0010070) |
| 0.1 | 0.2 | GO:0002731 | negative regulation of dendritic cell cytokine production(GO:0002731) regulation of intracellular transport of viral material(GO:1901252) |
| 0.1 | 0.2 | GO:0002380 | immunoglobulin secretion involved in immune response(GO:0002380) |
| 0.0 | 0.1 | GO:0007199 | G-protein coupled receptor signaling pathway coupled to cGMP nucleotide second messenger(GO:0007199) |
| 0.0 | 0.1 | GO:0051695 | actin filament uncapping(GO:0051695) |
| 0.0 | 0.1 | GO:0048007 | antigen processing and presentation of lipid antigen via MHC class Ib(GO:0048003) antigen processing and presentation, exogenous lipid antigen via MHC class Ib(GO:0048007) |
| 0.0 | 0.1 | GO:0019236 | response to pheromone(GO:0019236) |
| 0.0 | 0.1 | GO:0002585 | positive regulation of antigen processing and presentation of peptide antigen(GO:0002585) detection of peptidoglycan(GO:0032499) |
| 0.0 | 0.3 | GO:0070863 | positive regulation of protein exit from endoplasmic reticulum(GO:0070863) |
| 0.0 | 0.1 | GO:0006030 | chitin metabolic process(GO:0006030) chitin catabolic process(GO:0006032) |
| 0.0 | 0.1 | GO:0031508 | pericentric heterochromatin assembly(GO:0031508) |
| 0.0 | 0.1 | GO:0048619 | regulation of heparan sulfate proteoglycan biosynthetic process(GO:0010908) positive regulation of heparan sulfate proteoglycan biosynthetic process(GO:0010909) embryonic hindgut morphogenesis(GO:0048619) |
| 0.0 | 0.1 | GO:0030910 | olfactory placode formation(GO:0030910) olfactory placode development(GO:0071698) olfactory placode morphogenesis(GO:0071699) |
| 0.0 | 0.1 | GO:0001788 | antibody-dependent cellular cytotoxicity(GO:0001788) |
| 0.0 | 0.1 | GO:0034757 | negative regulation of iron ion transport(GO:0034757) negative regulation of iron ion transmembrane transport(GO:0034760) cellular response to bile acid(GO:1903413) |
| 0.0 | 0.1 | GO:0002457 | T cell antigen processing and presentation(GO:0002457) |
| 0.0 | 0.0 | GO:1902167 | positive regulation of intrinsic apoptotic signaling pathway in response to DNA damage by p53 class mediator(GO:1902167) |
| 0.0 | 0.1 | GO:0051464 | positive regulation of cortisol secretion(GO:0051464) |
| 0.0 | 0.0 | GO:1905225 | response to thyrotropin-releasing hormone(GO:1905225) |
| 0.0 | 0.0 | GO:0010643 | cell communication by chemical coupling(GO:0010643) |
| 0.0 | 0.1 | GO:0060332 | positive regulation of response to interferon-gamma(GO:0060332) positive regulation of interferon-gamma-mediated signaling pathway(GO:0060335) |
| 0.0 | 0.0 | GO:0070494 | regulation of thrombin receptor signaling pathway(GO:0070494) negative regulation of thrombin receptor signaling pathway(GO:0070495) |
| 0.0 | 0.0 | GO:0010499 | proteasomal ubiquitin-independent protein catabolic process(GO:0010499) |
| 0.0 | 0.0 | GO:1990790 | response to glial cell derived neurotrophic factor(GO:1990790) cellular response to glial cell derived neurotrophic factor(GO:1990792) |
| 0.0 | 0.1 | GO:0061589 | calcium activated phosphatidylserine scrambling(GO:0061589) |
| 0.0 | 0.0 | GO:1901906 | diadenosine polyphosphate catabolic process(GO:0015961) diphosphoinositol polyphosphate metabolic process(GO:0071543) diadenosine pentaphosphate metabolic process(GO:1901906) diadenosine pentaphosphate catabolic process(GO:1901907) diadenosine hexaphosphate metabolic process(GO:1901908) diadenosine hexaphosphate catabolic process(GO:1901909) adenosine 5'-(hexahydrogen pentaphosphate) metabolic process(GO:1901910) adenosine 5'-(hexahydrogen pentaphosphate) catabolic process(GO:1901911) |
| 0.0 | 0.1 | GO:1902101 | positive regulation of maintenance of mitotic sister chromatid cohesion(GO:0034184) positive regulation of mitotic metaphase/anaphase transition(GO:0045842) positive regulation of mitotic sister chromatid separation(GO:1901970) positive regulation of metaphase/anaphase transition of cell cycle(GO:1902101) |
| 0.0 | 0.1 | GO:0060164 | regulation of timing of neuron differentiation(GO:0060164) |
| 0.0 | 0.0 | GO:0019303 | D-ribose catabolic process(GO:0019303) |
| 0.0 | 0.0 | GO:0010133 | proline catabolic process to glutamate(GO:0010133) |
| 0.0 | 0.1 | GO:1903441 | protein localization to ciliary membrane(GO:1903441) |
Gene overrepresentation in cellular component category:
| Log-likelihood per target | Total log-likelihood | Term | Description |
|---|---|---|---|
| 0.0 | 0.1 | GO:1990907 | beta-catenin-TCF complex(GO:1990907) |
| 0.0 | 0.1 | GO:0020003 | symbiont-containing vacuole(GO:0020003) |
| 0.0 | 0.1 | GO:0070876 | SOSS complex(GO:0070876) |
| 0.0 | 0.0 | GO:0032807 | DNA ligase IV complex(GO:0032807) |
Gene overrepresentation in molecular function category:
| Log-likelihood per target | Total log-likelihood | Term | Description |
|---|---|---|---|
| 0.0 | 0.1 | GO:0016403 | dimethylargininase activity(GO:0016403) |
| 0.0 | 0.1 | GO:0071723 | lipopeptide binding(GO:0071723) |
| 0.0 | 0.1 | GO:0004568 | chitinase activity(GO:0004568) |
| 0.0 | 0.1 | GO:0031694 | alpha-2A adrenergic receptor binding(GO:0031694) |
| 0.0 | 0.1 | GO:0051373 | FATZ binding(GO:0051373) |
| 0.0 | 0.1 | GO:0001087 | transcription factor activity, sequence-specific DNA binding, RNA polymerase recruiting(GO:0001011) transcription factor activity, TFIIB-class binding(GO:0001087) |
| 0.0 | 0.1 | GO:0019002 | GMP binding(GO:0019002) |
| 0.0 | 0.1 | GO:0015111 | iodide transmembrane transporter activity(GO:0015111) |
| 0.0 | 0.1 | GO:0070891 | lipoteichoic acid binding(GO:0070891) |
| 0.0 | 0.1 | GO:0004966 | galanin receptor activity(GO:0004966) |
| 0.0 | 0.2 | GO:0008191 | metalloendopeptidase inhibitor activity(GO:0008191) |
| 0.0 | 0.0 | GO:0031433 | telethonin binding(GO:0031433) |
| 0.0 | 0.0 | GO:0003876 | AMP deaminase activity(GO:0003876) adenosine-phosphate deaminase activity(GO:0047623) |
| 0.0 | 0.0 | GO:0000293 | ferric-chelate reductase activity(GO:0000293) |
| 0.0 | 0.2 | GO:0005092 | GDP-dissociation inhibitor activity(GO:0005092) |
| 0.0 | 0.0 | GO:0034432 | endopolyphosphatase activity(GO:0000298) diphosphoinositol-polyphosphate diphosphatase activity(GO:0008486) bis(5'-adenosyl)-hexaphosphatase activity(GO:0034431) bis(5'-adenosyl)-pentaphosphatase activity(GO:0034432) |
| 0.0 | 0.1 | GO:0019770 | IgG receptor activity(GO:0019770) |
| 0.0 | 0.0 | GO:0005006 | epidermal growth factor-activated receptor activity(GO:0005006) |
| 0.0 | 0.0 | GO:0044715 | 8-oxo-dGDP phosphatase activity(GO:0044715) |
| 0.0 | 0.1 | GO:0001595 | angiotensin receptor activity(GO:0001595) |
| 0.0 | 0.0 | GO:0004657 | proline dehydrogenase activity(GO:0004657) |