Project
GSE49485: Hypoxia transcriptome sequencing of rat brain.
Navigation
Downloads
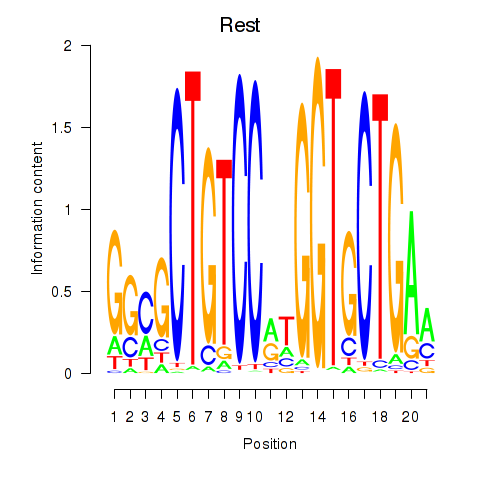
Results for Rest
Z-value: 0.90
Motif logo
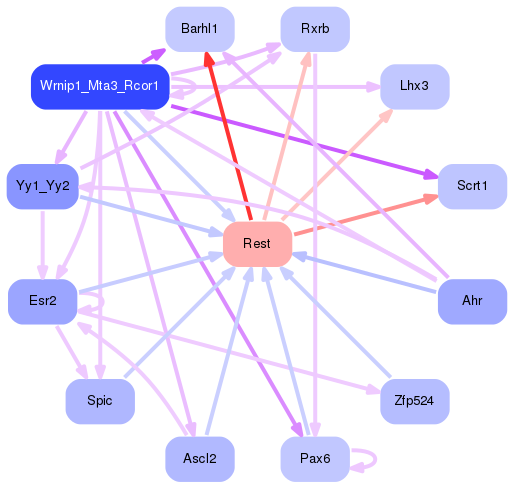
Transcription factors associated with Rest
| Gene Symbol | Gene ID | Gene Info |
|---|---|---|
|
Rest
|
ENSRNOG00000002074 | RE1-silencing transcription factor |
Activity-expression correlation:
| Gene | Promoter | Pearson corr. coef. | P-value | Plot |
|---|---|---|---|---|
| Rest | rn6_v1_chr14_-_33150509_33150509 | 0.60 | 2.9e-01 | Click! |
Activity profile of Rest motif
Sorted Z-values of Rest motif
| Promoter | Log-likelihood | Transcript | Gene | Gene Info |
|---|---|---|---|---|
| chr3_-_7498555 | 2.10 |
ENSRNOT00000017725
|
Barhl1
|
BarH-like homeobox 1 |
| chr10_-_40953651 | 0.84 |
ENSRNOT00000063889
|
Glra1
|
glycine receptor, alpha 1 |
| chr7_-_117587103 | 0.81 |
ENSRNOT00000035423
|
Scrt1
|
scratch family transcriptional repressor 1 |
| chr9_+_117795132 | 0.64 |
ENSRNOT00000086943
|
Akain1
|
A-kinase anchor inhibitor 1 |
| chr10_-_40953467 | 0.56 |
ENSRNOT00000092189
|
Glra1
|
glycine receptor, alpha 1 |
| chr8_-_68038533 | 0.52 |
ENSRNOT00000018756
|
Skor1
|
SKI family transcriptional corepressor 1 |
| chr1_+_105285419 | 0.47 |
ENSRNOT00000089693
|
Slc6a5
|
solute carrier family 6 member 5 |
| chr1_-_215536980 | 0.47 |
ENSRNOT00000027344
|
Ifitm10
|
interferon induced transmembrane protein 10 |
| chr1_+_106998623 | 0.46 |
ENSRNOT00000022383
|
Slc17a6
|
solute carrier family 17 member 6 |
| chr5_+_29538380 | 0.42 |
ENSRNOT00000010845
|
Calb1
|
calbindin 1 |
| chr1_+_193187972 | 0.35 |
ENSRNOT00000090172
ENSRNOT00000065342 |
Slc5a11
|
solute carrier family 5 member 11 |
| chr1_-_215536770 | 0.32 |
ENSRNOT00000078030
|
Ifitm10
|
interferon induced transmembrane protein 10 |
| chr8_+_130749838 | 0.29 |
ENSRNOT00000079273
|
Snrk
|
SNF related kinase |
| chr12_-_45801842 | 0.28 |
ENSRNOT00000078837
|
AABR07036513.1
|
|
| chr6_+_26602144 | 0.27 |
ENSRNOT00000008037
|
Ucn
|
urocortin |
| chr9_-_92291220 | 0.25 |
ENSRNOT00000093357
|
Dner
|
delta/notch-like EGF repeat containing |
| chr7_+_120067379 | 0.23 |
ENSRNOT00000011270
|
Cdc42ep1
|
CDC42 effector protein 1 |
| chr10_+_61403130 | 0.22 |
ENSRNOT00000092490
ENSRNOT00000077649 |
Ccdc92b
|
coiled-coil domain containing 92B |
| chr4_+_145238947 | 0.21 |
ENSRNOT00000067396
ENSRNOT00000091934 |
Cpne9
|
copine family member 9 |
| chr5_-_172809353 | 0.20 |
ENSRNOT00000022246
|
Gabrd
|
gamma-aminobutyric acid type A receptor delta subunit |
| chr10_+_14598014 | 0.17 |
ENSRNOT00000068336
|
Tsr3
|
TSR3, 20S rRNA accumulation |
| chr20_+_3827367 | 0.16 |
ENSRNOT00000079967
|
Rxrb
|
retinoid X receptor beta |
| chr20_+_5815837 | 0.16 |
ENSRNOT00000036999
|
Lhfpl5
|
lipoma HMGIC fusion partner-like 5 |
| chr16_-_75855745 | 0.16 |
ENSRNOT00000031291
|
Agpat5
|
1-acylglycerol-3-phosphate O-acyltransferase 5 |
| chr10_-_20622600 | 0.15 |
ENSRNOT00000020554
|
Fbll1
|
fibrillarin-like 1 |
| chr1_+_86938138 | 0.14 |
ENSRNOT00000075601
|
Ccer2
|
coiled-coil glutamate-rich protein 2 |
| chr5_+_154294806 | 0.14 |
ENSRNOT00000012853
|
Hmgcl
|
3-hydroxymethyl-3-methylglutaryl-CoA lyase |
| chr18_-_24182012 | 0.13 |
ENSRNOT00000023594
|
Syt4
|
synaptotagmin 4 |
| chr2_-_189096785 | 0.12 |
ENSRNOT00000028200
|
Chrnb2
|
cholinergic receptor nicotinic beta 2 subunit |
| chr3_+_151310598 | 0.12 |
ENSRNOT00000092194
|
Mmp24
|
matrix metallopeptidase 24 |
| chr13_-_111765944 | 0.12 |
ENSRNOT00000073041
|
Syt14
|
synaptotagmin 14 |
| chr6_+_137997335 | 0.12 |
ENSRNOT00000006872
|
Tmem121
|
transmembrane protein 121 |
| chr3_+_147643250 | 0.12 |
ENSRNOT00000000013
|
Tcf15
|
transcription factor 15 |
| chr8_-_62248013 | 0.12 |
ENSRNOT00000080012
ENSRNOT00000089602 |
Scamp5
|
secretory carrier membrane protein 5 |
| chr6_+_126434226 | 0.11 |
ENSRNOT00000090857
|
Chga
|
chromogranin A |
| chr3_+_125428260 | 0.10 |
ENSRNOT00000028892
|
Chgb
|
chromogranin B |
| chr10_-_13075864 | 0.10 |
ENSRNOT00000005220
|
Paqr4
|
progestin and adipoQ receptor family member 4 |
| chr3_-_3661810 | 0.10 |
ENSRNOT00000025047
|
Lhx3
|
LIM homeobox 3 |
| chr9_+_17216495 | 0.09 |
ENSRNOT00000026331
|
Mad2l1bp
|
MAD2L1 binding protein |
| chr9_+_86874685 | 0.09 |
ENSRNOT00000041337
|
NEWGENE_1305560
|
neuronal tyrosine-phosphorylated phosphoinositide-3-kinase adaptor 2 |
| chr3_-_176816114 | 0.09 |
ENSRNOT00000079262
ENSRNOT00000018697 |
Stmn3
|
stathmin 3 |
| chr7_-_58587787 | 0.09 |
ENSRNOT00000005814
|
Lgr5
|
leucine rich repeat containing G protein coupled receptor 5 |
| chr17_-_23923792 | 0.08 |
ENSRNOT00000018739
|
Gfod1
|
glucose-fructose oxidoreductase domain containing 1 |
| chr1_+_220322940 | 0.08 |
ENSRNOT00000074972
|
LOC108348085
|
beta-1,4-glucuronyltransferase 1 |
| chr1_-_225128740 | 0.07 |
ENSRNOT00000026897
|
Rom1
|
retinal outer segment membrane protein 1 |
| chr9_+_81656116 | 0.06 |
ENSRNOT00000083421
|
Slc11a1
|
solute carrier family 11 member 1 |
| chr12_+_41073824 | 0.06 |
ENSRNOT00000001844
|
Rph3a
|
rabphilin 3A |
| chr9_+_45605552 | 0.05 |
ENSRNOT00000059587
|
NMS
|
neuromedin S |
| chr3_-_80000091 | 0.05 |
ENSRNOT00000079394
|
Madd
|
MAP-kinase activating death domain |
| chr3_+_3310954 | 0.05 |
ENSRNOT00000061773
|
Kcnt1
|
potassium sodium-activated channel subfamily T member 1 |
| chr3_-_2534663 | 0.04 |
ENSRNOT00000049297
ENSRNOT00000044246 |
Grin1
|
glutamate ionotropic receptor NMDA type subunit 1 |
| chr10_+_90342051 | 0.03 |
ENSRNOT00000028487
|
Rundc3a
|
RUN domain containing 3A |
| chrX_+_156911345 | 0.03 |
ENSRNOT00000080945
|
L1cam
|
L1 cell adhesion molecule |
| chr6_+_147876237 | 0.03 |
ENSRNOT00000056649
|
Tmem196
|
transmembrane protein 196 |
| chr9_+_77834091 | 0.03 |
ENSRNOT00000033459
|
Vwc2l
|
von Willebrand factor C domain-containing protein 2-like |
| chr10_+_67862054 | 0.02 |
ENSRNOT00000031746
|
Cdk5r1
|
cyclin-dependent kinase 5 regulatory subunit 1 |
| chr6_+_147876557 | 0.02 |
ENSRNOT00000080090
|
Tmem196
|
transmembrane protein 196 |
| chr11_-_74315248 | 0.02 |
ENSRNOT00000002346
|
Hes1
|
hes family bHLH transcription factor 1 |
| chr3_-_2534375 | 0.01 |
ENSRNOT00000037725
|
Grin1
|
glutamate ionotropic receptor NMDA type subunit 1 |
| chr3_+_161433410 | 0.01 |
ENSRNOT00000024657
|
Slc12a5
|
solute carrier family 12 member 5 |
| chr5_+_145257714 | 0.01 |
ENSRNOT00000019214
|
Dlgap3
|
DLG associated protein 3 |
| chr6_-_137084739 | 0.01 |
ENSRNOT00000060943
|
Tmem179
|
transmembrane protein 179 |
| chr17_-_10766253 | 0.00 |
ENSRNOT00000000117
|
Cplx2
|
complexin 2 |
| chr1_+_84470829 | 0.00 |
ENSRNOT00000025472
|
Ttc9b
|
tetratricopeptide repeat domain 9B |
Network of associatons between targets according to the STRING database.

First level regulatory network of Rest
Gene Ontology Analysis
Gene overrepresentation in biological process category:
| Log-likelihood per target | Total log-likelihood | Term | Description |
|---|---|---|---|
| 0.2 | 1.4 | GO:0051970 | negative regulation of transmission of nerve impulse(GO:0051970) positive regulation of acrosome reaction(GO:2000344) |
| 0.1 | 0.4 | GO:0035502 | metanephric part of ureteric bud development(GO:0035502) |
| 0.1 | 0.5 | GO:0036233 | glycine import(GO:0036233) |
| 0.1 | 0.3 | GO:0060455 | gastric motility(GO:0035482) negative regulation of gastric acid secretion(GO:0060455) |
| 0.1 | 0.5 | GO:0098700 | neurotransmitter loading into synaptic vesicle(GO:0098700) |
| 0.1 | 0.2 | GO:0018364 | peptidyl-glutamine methylation(GO:0018364) |
| 0.0 | 0.1 | GO:0060084 | synaptic transmission involved in micturition(GO:0060084) |
| 0.0 | 0.1 | GO:1900738 | positive regulation of phospholipase C-activating G-protein coupled receptor signaling pathway(GO:1900738) |
| 0.0 | 0.1 | GO:0046951 | ketone body biosynthetic process(GO:0046951) |
| 0.0 | 0.1 | GO:0021526 | medial motor column neuron differentiation(GO:0021526) |
| 0.0 | 0.3 | GO:0007220 | Notch receptor processing(GO:0007220) |
| 0.0 | 0.1 | GO:2000301 | negative regulation of synaptic vesicle exocytosis(GO:2000301) |
| 0.0 | 0.1 | GO:2001013 | epithelial cell proliferation involved in renal tubule morphogenesis(GO:2001013) |
| 0.0 | 0.2 | GO:0031274 | positive regulation of pseudopodium assembly(GO:0031274) |
| 0.0 | 0.1 | GO:0055073 | cadmium ion homeostasis(GO:0055073) |
| 0.0 | 0.6 | GO:0010738 | regulation of protein kinase A signaling(GO:0010738) |
| 0.0 | 2.1 | GO:0030901 | midbrain development(GO:0030901) |
| 0.0 | 0.1 | GO:0021586 | pons maturation(GO:0021586) |
| 0.0 | 0.0 | GO:0036395 | amylase secretion(GO:0036394) pancreatic amylase secretion(GO:0036395) regulation of pancreatic amylase secretion(GO:1902276) |
| 0.0 | 0.8 | GO:2001222 | regulation of neuron migration(GO:2001222) |
| 0.0 | 0.5 | GO:0030514 | negative regulation of BMP signaling pathway(GO:0030514) |
| 0.0 | 0.4 | GO:0035428 | hexose transmembrane transport(GO:0035428) glucose transmembrane transport(GO:1904659) |
| 0.0 | 0.2 | GO:0060088 | auditory receptor cell stereocilium organization(GO:0060088) |
| 0.0 | 0.1 | GO:0044331 | cell-cell adhesion mediated by cadherin(GO:0044331) |
| 0.0 | 0.1 | GO:0045198 | establishment of epithelial cell apical/basal polarity(GO:0045198) |
Gene overrepresentation in cellular component category:
| Log-likelihood per target | Total log-likelihood | Term | Description |
|---|---|---|---|
| 0.0 | 1.1 | GO:0060077 | inhibitory synapse(GO:0060077) |
| 0.0 | 0.5 | GO:0098563 | integral component of synaptic vesicle membrane(GO:0030285) intrinsic component of synaptic vesicle membrane(GO:0098563) |
| 0.0 | 0.1 | GO:0070821 | tertiary granule membrane(GO:0070821) |
| 0.0 | 0.2 | GO:0031428 | box C/D snoRNP complex(GO:0031428) |
| 0.0 | 0.3 | GO:0043196 | varicosity(GO:0043196) |
| 0.0 | 0.3 | GO:0032588 | trans-Golgi network membrane(GO:0032588) |
| 0.0 | 0.2 | GO:1902711 | GABA-A receptor complex(GO:1902711) |
| 0.0 | 0.0 | GO:0044307 | dendritic branch(GO:0044307) |
| 0.0 | 0.2 | GO:0032426 | stereocilium tip(GO:0032426) |
Gene overrepresentation in molecular function category:
| Log-likelihood per target | Total log-likelihood | Term | Description |
|---|---|---|---|
| 0.5 | 1.4 | GO:0030977 | taurine binding(GO:0030977) |
| 0.2 | 0.5 | GO:0005294 | neutral L-amino acid secondary active transmembrane transporter activity(GO:0005294) |
| 0.1 | 0.4 | GO:0099510 | calcium ion binding involved in regulation of cytosolic calcium ion concentration(GO:0099510) |
| 0.1 | 0.3 | GO:0051431 | corticotropin-releasing hormone receptor 2 binding(GO:0051431) |
| 0.0 | 0.4 | GO:0005412 | glucose:sodium symporter activity(GO:0005412) |
| 0.0 | 0.1 | GO:0016833 | oxo-acid-lyase activity(GO:0016833) |
| 0.0 | 0.5 | GO:0005313 | L-glutamate transmembrane transporter activity(GO:0005313) |
| 0.0 | 0.2 | GO:0004886 | 9-cis retinoic acid receptor activity(GO:0004886) |
| 0.0 | 0.6 | GO:0034237 | protein kinase A regulatory subunit binding(GO:0034237) |
| 0.0 | 0.1 | GO:0030348 | syntaxin-3 binding(GO:0030348) |
| 0.0 | 0.2 | GO:0003841 | 1-acylglycerol-3-phosphate O-acyltransferase activity(GO:0003841) |
| 0.0 | 0.2 | GO:0008649 | rRNA methyltransferase activity(GO:0008649) |
| 0.0 | 0.2 | GO:0017049 | GTP-Rho binding(GO:0017049) |
| 0.0 | 0.3 | GO:0005112 | Notch binding(GO:0005112) |
Gene overrepresentation in curated gene sets: REACTOME pathways category:
| Log-likelihood per target | Total log-likelihood | Term | Description |
|---|---|---|---|
| 0.0 | 1.3 | REACTOME LIGAND GATED ION CHANNEL TRANSPORT | Genes involved in Ligand-gated ion channel transport |
| 0.0 | 0.5 | REACTOME NA CL DEPENDENT NEUROTRANSMITTER TRANSPORTERS | Genes involved in Na+/Cl- dependent neurotransmitter transporters |
| 0.0 | 0.1 | REACTOME HIGHLY CALCIUM PERMEABLE POSTSYNAPTIC NICOTINIC ACETYLCHOLINE RECEPTORS | Genes involved in Highly calcium permeable postsynaptic nicotinic acetylcholine receptors |