Project
GSE49485: Hypoxia transcriptome sequencing of rat brain.
Navigation
Downloads
Results for Prdm1
Z-value: 0.91
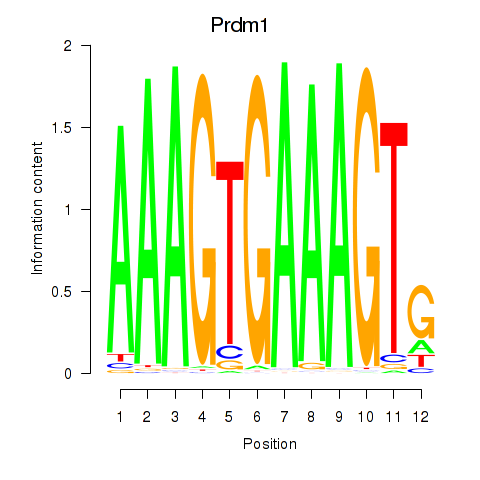
Motif logo
Transcription factors associated with Prdm1
| Gene Symbol | Gene ID | Gene Info |
|---|---|---|
|
Prdm1
|
ENSRNOG00000000323 | PR/SET domain 1 |
Activity-expression correlation:
| Gene | Promoter | Pearson corr. coef. | P-value | Plot |
|---|---|---|---|---|
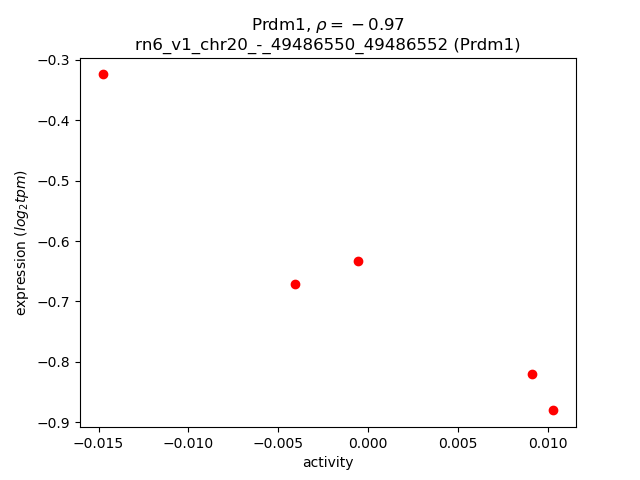
| Prdm1 | rn6_v1_chr20_-_49486550_49486552 | -0.97 | 6.0e-03 | Click! |
Activity profile of Prdm1 motif
Sorted Z-values of Prdm1 motif
| Promoter | Log-likelihood | Transcript | Gene | Gene Info |
|---|---|---|---|---|
| chr3_+_177397892 | 0.53 |
ENSRNOT00000078261
|
AABR07054983.1
|
|
| chr12_-_17186679 | 0.52 |
ENSRNOT00000001730
|
Uncx
|
UNC homeobox |
| chr5_+_161889342 | 0.33 |
ENSRNOT00000040481
|
LOC100362684
|
ribosomal protein S20-like |
| chr9_-_1012450 | 0.33 |
ENSRNOT00000051449
|
LOC100359951
|
ribosomal protein S20-like |
| chr7_+_124460358 | 0.31 |
ENSRNOT00000014089
|
Tspo
|
translocator protein |
| chr5_-_16706909 | 0.31 |
ENSRNOT00000011314
|
Rps20
|
ribosomal protein S20 |
| chr13_+_89480058 | 0.30 |
ENSRNOT00000050804
|
Cfap126
|
cilia and flagella associated protein 126 |
| chr3_-_7498555 | 0.30 |
ENSRNOT00000017725
|
Barhl1
|
BarH-like homeobox 1 |
| chr20_+_8484311 | 0.29 |
ENSRNOT00000050041
|
LOC100364116
|
ribosomal protein S20-like |
| chr2_+_29598344 | 0.28 |
ENSRNOT00000088580
ENSRNOT00000023286 |
Mrps27
|
mitochondrial ribosomal protein S27 |
| chr5_-_64789318 | 0.26 |
ENSRNOT00000078957
|
Mrpl50
|
mitochondrial ribosomal protein L50 |
| chr1_-_167347662 | 0.25 |
ENSRNOT00000027641
ENSRNOT00000076592 |
Rhog
|
ras homolog family member G |
| chr13_-_111474411 | 0.24 |
ENSRNOT00000072729
|
Hhat
|
hedgehog acyltransferase |
| chr3_-_40477754 | 0.24 |
ENSRNOT00000091168
|
AABR07052166.1
|
|
| chr11_+_64882288 | 0.24 |
ENSRNOT00000077727
|
Pla1a
|
phospholipase A1 member A |
| chr19_-_25914689 | 0.24 |
ENSRNOT00000091994
ENSRNOT00000039354 |
Nf1x
|
nuclear factor 1 X |
| chr6_-_77421286 | 0.23 |
ENSRNOT00000011453
|
Nkx2-1
|
NK2 homeobox 1 |
| chr9_-_94495333 | 0.23 |
ENSRNOT00000021507
|
Kcnj13
|
potassium voltage-gated channel subfamily J member 13 |
| chr16_-_40555576 | 0.23 |
ENSRNOT00000015529
|
Vegfc
|
vascular endothelial growth factor C |
| chr1_-_7801438 | 0.23 |
ENSRNOT00000022273
|
AABR07000276.1
|
|
| chr1_+_86972244 | 0.22 |
ENSRNOT00000036907
|
Rinl
|
Ras and Rab interactor-like |
| chr4_+_56549739 | 0.22 |
ENSRNOT00000084597
|
Hilpda
|
hypoxia inducible lipid droplet-associated |
| chr17_+_87020089 | 0.21 |
ENSRNOT00000043523
|
Rpl37-ps1
|
ribosomal protein L37, pseudogene 1 |
| chr20_+_2004052 | 0.21 |
ENSRNOT00000001008
|
Mog
|
myelin oligodendrocyte glycoprotein |
| chr10_-_19652898 | 0.20 |
ENSRNOT00000009648
|
Spdl1
|
spindle apparatus coiled-coil protein 1 |
| chr3_-_148493225 | 0.20 |
ENSRNOT00000012141
|
Pdrg1
|
p53 and DNA damage regulated 1 |
| chr3_+_22964230 | 0.20 |
ENSRNOT00000041813
|
LOC100362149
|
ribosomal protein S20-like |
| chr1_+_88620317 | 0.20 |
ENSRNOT00000075116
|
Cox7a1
|
cytochrome c oxidase subunit 7A1 |
| chr17_-_31411957 | 0.20 |
ENSRNOT00000060132
|
Psmg4
|
proteasome assembly chaperone 4 |
| chr5_+_135687538 | 0.20 |
ENSRNOT00000091664
|
AC126292.2
|
|
| chr1_-_88193346 | 0.19 |
ENSRNOT00000078600
|
LOC103690068
|
immortalization up-regulated protein-like |
| chr13_+_52588917 | 0.18 |
ENSRNOT00000011999
|
Phlda3
|
pleckstrin homology-like domain, family A, member 3 |
| chr11_-_37914983 | 0.18 |
ENSRNOT00000039876
|
Mx1
|
myxovirus (influenza virus) resistance 1 |
| chr4_+_28989115 | 0.17 |
ENSRNOT00000075326
|
Gng11
|
G protein subunit gamma 11 |
| chr3_-_80842916 | 0.17 |
ENSRNOT00000033978
|
Mdk
|
midkine |
| chr19_-_37912027 | 0.17 |
ENSRNOT00000026462
|
Psmb10
|
proteasome subunit beta 10 |
| chr13_-_102643223 | 0.17 |
ENSRNOT00000003155
|
Hlx
|
H2.0-like homeobox |
| chr1_-_1889236 | 0.17 |
ENSRNOT00000087944
|
AABR07000159.2
|
|
| chr5_-_59113773 | 0.16 |
ENSRNOT00000083129
|
AC121204.3
|
|
| chr7_+_79638046 | 0.16 |
ENSRNOT00000029419
|
Zfpm2
|
zinc finger protein, multitype 2 |
| chr15_-_34352673 | 0.16 |
ENSRNOT00000064916
|
Nedd8
|
neural precursor cell expressed, developmentally down-regulated 8 |
| chr2_-_196046311 | 0.16 |
ENSRNOT00000028484
|
Psmb4
|
proteasome subunit beta 4 |
| chr20_+_8486265 | 0.16 |
ENSRNOT00000072213
|
LOC100909911
|
40S ribosomal protein S20-like |
| chr9_-_11114843 | 0.16 |
ENSRNOT00000072031
|
Ebi3
|
Epstein-Barr virus induced 3 |
| chr5_-_12563429 | 0.16 |
ENSRNOT00000059625
|
St18
|
suppression of tumorigenicity 18 |
| chr12_-_40686249 | 0.16 |
ENSRNOT00000042264
|
LOC100909911
|
40S ribosomal protein S20-like |
| chr3_-_79728879 | 0.16 |
ENSRNOT00000012425
|
Ndufs3
|
NADH dehydrogenase (ubiquinone) Fe-S protein 3 |
| chr5_+_122508388 | 0.16 |
ENSRNOT00000038410
|
Tctex1d1
|
Tctex1 domain containing 1 |
| chr8_+_14060394 | 0.15 |
ENSRNOT00000014827
|
Smco4
|
single-pass membrane protein with coiled-coil domains 4 |
| chr1_-_214159157 | 0.15 |
ENSRNOT00000091292
ENSRNOT00000022241 |
Rnh1
|
ribonuclease/angiogenin inhibitor 1 |
| chr2_-_197991574 | 0.15 |
ENSRNOT00000085632
|
Ciart
|
circadian associated repressor of transcription |
| chr13_+_104284660 | 0.15 |
ENSRNOT00000005400
|
Dusp10
|
dual specificity phosphatase 10 |
| chr14_+_83560541 | 0.15 |
ENSRNOT00000057738
ENSRNOT00000085228 |
Pik3ip1
|
phosphoinositide-3-kinase interacting protein 1 |
| chr6_-_26544207 | 0.15 |
ENSRNOT00000030518
|
Snx17
|
sorting nexin 17 |
| chr6_-_26820959 | 0.15 |
ENSRNOT00000043572
|
Khk
|
ketohexokinase |
| chr3_-_44086006 | 0.14 |
ENSRNOT00000034449
ENSRNOT00000082604 |
Ermn
|
ermin |
| chr20_-_3166569 | 0.14 |
ENSRNOT00000091390
|
AABR07044362.1
|
|
| chrX_-_81866370 | 0.14 |
ENSRNOT00000042570
|
AABR07039651.1
|
|
| chr2_-_197991198 | 0.14 |
ENSRNOT00000056322
|
Ciart
|
circadian associated repressor of transcription |
| chr1_+_80056755 | 0.14 |
ENSRNOT00000021221
|
Snrpd2
|
small nuclear ribonucleoprotein D2 polypeptide |
| chr6_-_125590049 | 0.13 |
ENSRNOT00000006371
|
Tc2n
|
tandem C2 domains, nuclear |
| chr3_-_114235933 | 0.13 |
ENSRNOT00000023939
|
Duox2
|
dual oxidase 2 |
| chrX_-_123601100 | 0.13 |
ENSRNOT00000092546
ENSRNOT00000092301 |
Sept6
|
septin 6 |
| chr8_-_58647933 | 0.13 |
ENSRNOT00000038830
|
Tnfaip8l3
|
TNF alpha induced protein 8 like 3 |
| chr15_+_34256071 | 0.13 |
ENSRNOT00000025887
|
Psme1
|
proteasome activator subunit 1 |
| chr15_-_51855325 | 0.13 |
ENSRNOT00000011663
|
Pdlim2
|
PDZ and LIM domain 2 |
| chr2_+_1410934 | 0.13 |
ENSRNOT00000013625
ENSRNOT00000080222 |
Erap1
|
endoplasmic reticulum aminopeptidase 1 |
| chr20_+_5456235 | 0.12 |
ENSRNOT00000092555
|
Pfdn6
|
prefoldin subunit 6 |
| chr10_+_91187593 | 0.12 |
ENSRNOT00000004163
|
Acbd4
|
acyl-CoA binding domain containing 4 |
| chr6_+_72124417 | 0.12 |
ENSRNOT00000040548
|
Scfd1
|
sec1 family domain containing 1 |
| chr13_+_95985655 | 0.12 |
ENSRNOT00000090885
|
AABR07021863.1
|
|
| chr12_+_37829579 | 0.12 |
ENSRNOT00000084587
|
Pitpnm2
|
phosphatidylinositol transfer protein, membrane-associated 2 |
| chr5_+_129052043 | 0.12 |
ENSRNOT00000013459
|
LOC108348114
|
tetratricopeptide repeat protein 39A |
| chr13_+_99220510 | 0.12 |
ENSRNOT00000004519
|
Tmem63a
|
transmembrane protein 63a |
| chr4_+_31387420 | 0.12 |
ENSRNOT00000074048
|
LOC100912034
|
guanine nucleotide-binding protein G(I)/G(S)/G(O) subunit gamma-11-like |
| chr9_+_68414339 | 0.12 |
ENSRNOT00000040778
|
Pard3b
|
par-3 family cell polarity regulator beta |
| chr1_+_255040426 | 0.11 |
ENSRNOT00000092151
|
Pcgf5
|
polycomb group ring finger 5 |
| chr4_-_81968832 | 0.11 |
ENSRNOT00000016608
|
Skap2
|
src kinase associated phosphoprotein 2 |
| chr3_-_148057523 | 0.11 |
ENSRNOT00000055408
|
Defb24
|
defensin beta 24 |
| chr16_-_85305782 | 0.11 |
ENSRNOT00000067511
ENSRNOT00000076737 |
Tnfsf13b
|
tumor necrosis factor superfamily member 13b |
| chr7_+_2737765 | 0.11 |
ENSRNOT00000004895
|
Cnpy2
|
canopy FGF signaling regulator 2 |
| chr5_+_78428669 | 0.11 |
ENSRNOT00000080744
|
Rgs3
|
regulator of G-protein signaling 3 |
| chr10_-_81587858 | 0.11 |
ENSRNOT00000003582
|
Utp18
|
UTP18 small subunit processome component |
| chr18_+_87637608 | 0.11 |
ENSRNOT00000070851
|
LOC102550729
|
zinc finger protein 120-like |
| chr13_-_35933243 | 0.11 |
ENSRNOT00000039074
|
Tmem177
|
transmembrane protein 177 |
| chr17_-_2705123 | 0.10 |
ENSRNOT00000024940
|
Olr1652
|
olfactory receptor 1652 |
| chr17_+_43661222 | 0.10 |
ENSRNOT00000022881
ENSRNOT00000022809 ENSRNOT00000022810 |
Hfe
|
hemochromatosis |
| chr13_+_74410010 | 0.10 |
ENSRNOT00000079152
|
Angptl1
|
angiopoietin-like 1 |
| chr5_+_136669674 | 0.10 |
ENSRNOT00000048770
|
Slc6a9
|
solute carrier family 6 member 9 |
| chr13_+_91334004 | 0.10 |
ENSRNOT00000041384
|
LOC108352650
|
40S ribosomal protein S29 |
| chr2_+_52302170 | 0.10 |
ENSRNOT00000081157
|
Paip1
|
poly(A) binding protein interacting protein 1 |
| chr1_-_237910012 | 0.10 |
ENSRNOT00000023664
|
Anxa1
|
annexin A1 |
| chr10_+_108395860 | 0.10 |
ENSRNOT00000075796
|
Gaa
|
glucosidase, alpha, acid |
| chr1_+_128637049 | 0.10 |
ENSRNOT00000018639
|
Ttc23
|
tetratricopeptide repeat domain 23 |
| chr10_+_4953879 | 0.09 |
ENSRNOT00000003455
|
Tnp2
|
transition protein 2 |
| chr2_+_58462588 | 0.09 |
ENSRNOT00000083799
|
Nadk2
|
NAD kinase 2, mitochondrial |
| chr1_+_79894450 | 0.09 |
ENSRNOT00000057963
|
Nanos2
|
nanos C2HC-type zinc finger 2 |
| chr9_-_17693200 | 0.09 |
ENSRNOT00000026716
|
Mrpl14
|
mitochondrial ribosomal protein L14 |
| chr1_+_267618248 | 0.09 |
ENSRNOT00000017186
|
Gsto2
|
glutathione S-transferase omega 2 |
| chr20_+_13778178 | 0.09 |
ENSRNOT00000058314
|
Gstt4
|
glutathione S-transferase, theta 4 |
| chr1_-_222734184 | 0.09 |
ENSRNOT00000049812
ENSRNOT00000028785 |
Rtn3
|
reticulon 3 |
| chr1_-_234704792 | 0.09 |
ENSRNOT00000017405
|
Carnmt1
|
carnosine N-methyltransferase 1 |
| chr6_+_128048099 | 0.09 |
ENSRNOT00000084685
ENSRNOT00000087017 |
LOC500712
|
Ab1-233 |
| chrX_+_136476823 | 0.09 |
ENSRNOT00000093183
|
Arhgap36
|
Rho GTPase activating protein 36 |
| chr2_+_60920257 | 0.09 |
ENSRNOT00000025170
|
C1qtnf3
|
C1q and tumor necrosis factor related protein 3 |
| chr1_-_170933660 | 0.09 |
ENSRNOT00000045360
|
Olr219
|
olfactory receptor 219 |
| chr1_+_147713892 | 0.08 |
ENSRNOT00000092985
ENSRNOT00000054742 ENSRNOT00000074103 |
Cyp2c6v1
|
cytochrome P450, family 2, subfamily C, polypeptide 6, variant 1 |
| chr15_+_31243097 | 0.08 |
ENSRNOT00000042721
|
LOC100360891
|
RGD1359684 protein-like |
| chr6_-_98666007 | 0.08 |
ENSRNOT00000082695
|
AABR07064867.1
|
|
| chrX_-_20807216 | 0.08 |
ENSRNOT00000075757
|
Fam156b
|
family with sequence similarity 156, member B |
| chr1_-_218448813 | 0.08 |
ENSRNOT00000017914
ENSRNOT00000054857 |
Tpcn2
|
two pore segment channel 2 |
| chr9_-_84101172 | 0.08 |
ENSRNOT00000018652
|
Pax3
|
paired box 3 |
| chr2_-_235852708 | 0.08 |
ENSRNOT00000009046
ENSRNOT00000005772 |
Rpl34
|
ribosomal protein L34 |
| chr8_-_126495347 | 0.08 |
ENSRNOT00000013467
|
Cmc1
|
C-x(9)-C motif containing 1 |
| chr15_+_51065316 | 0.08 |
ENSRNOT00000020753
|
Nkx3-1
|
NK3 homeobox 1 |
| chr13_+_111890894 | 0.08 |
ENSRNOT00000007341
|
LOC100125367
|
hypothetical protein LOC100125367 |
| chr9_-_121972055 | 0.08 |
ENSRNOT00000089735
|
AABR07068851.1
|
clusterin-like protein 1 |
| chr6_-_98606109 | 0.08 |
ENSRNOT00000006860
|
Wdr89
|
WD repeat domain 89 |
| chr1_-_167347490 | 0.08 |
ENSRNOT00000076499
|
Rhog
|
ras homolog family member G |
| chr2_+_115739813 | 0.08 |
ENSRNOT00000085452
|
Slc7a14
|
solute carrier family 7, member 14 |
| chr10_+_74413989 | 0.07 |
ENSRNOT00000036098
|
Ska2
|
spindle and kinetochore associated complex subunit 2 |
| chr20_+_13817795 | 0.07 |
ENSRNOT00000036518
|
Gstt3
|
glutathione S-transferase, theta 3 |
| chr1_+_198089446 | 0.07 |
ENSRNOT00000026146
|
Sgf29
|
SAGA complex associated factor 29 |
| chr13_+_56015901 | 0.07 |
ENSRNOT00000043907
|
Dennd1b
|
DENN domain containing 1B |
| chr9_-_76768770 | 0.07 |
ENSRNOT00000087779
ENSRNOT00000057849 |
Ikzf2
|
IKAROS family zinc finger 2 |
| chr12_+_2180150 | 0.07 |
ENSRNOT00000001322
|
Stxbp2
|
syntaxin binding protein 2 |
| chrX_-_123707257 | 0.07 |
ENSRNOT00000064521
|
Rpl39
|
ribosomal protein L39 |
| chr18_-_1216379 | 0.07 |
ENSRNOT00000020537
ENSRNOT00000084613 |
Usp14
|
ubiquitin specific peptidase 14 |
| chr20_+_3990820 | 0.07 |
ENSRNOT00000000528
|
Psmb8
|
proteasome subunit beta 8 |
| chr17_+_78762991 | 0.07 |
ENSRNOT00000020924
|
Suv39h2
|
suppressor of variegation 3-9 homolog 2 |
| chr15_-_37826211 | 0.07 |
ENSRNOT00000064702
|
Eef1akmt1
|
eukaryotic translation elongation factor 1 alpha lysine methyltransferase 1 |
| chr17_-_15478343 | 0.07 |
ENSRNOT00000078029
|
Omd
|
osteomodulin |
| chr1_-_167093560 | 0.07 |
ENSRNOT00000027301
|
Il18bp
|
interleukin 18 binding protein |
| chr3_-_146317010 | 0.07 |
ENSRNOT00000088851
|
AABR07054286.1
|
|
| chr18_+_28361283 | 0.07 |
ENSRNOT00000026949
|
Matr3
|
matrin 3 |
| chr3_+_60026747 | 0.07 |
ENSRNOT00000081881
|
Scrn3
|
secernin 3 |
| chr4_+_90990088 | 0.07 |
ENSRNOT00000030320
|
Mmrn1
|
multimerin 1 |
| chr7_+_107695227 | 0.07 |
ENSRNOT00000009673
|
Wisp1
|
WNT1 inducible signaling pathway protein 1 |
| chr14_-_81339526 | 0.07 |
ENSRNOT00000015894
|
Grk4
|
G protein-coupled receptor kinase 4 |
| chr1_+_226634009 | 0.07 |
ENSRNOT00000028094
|
Cyb561a3
|
cytochrome b561 family, member A3 |
| chr7_+_59349745 | 0.07 |
ENSRNOT00000085334
|
Ptprb
|
protein tyrosine phosphatase, receptor type, B |
| chr16_+_75744786 | 0.06 |
ENSRNOT00000032368
|
Xkr5
|
XK related 5 |
| chr1_+_212578450 | 0.06 |
ENSRNOT00000064501
|
Paox
|
polyamine oxidase |
| chr18_+_51492196 | 0.06 |
ENSRNOT00000020570
|
Gramd3
|
GRAM domain containing 3 |
| chr6_+_100337226 | 0.06 |
ENSRNOT00000011220
|
Fut8
|
fucosyltransferase 8 |
| chr5_-_58950373 | 0.06 |
ENSRNOT00000060442
|
Cd72
|
Cd72 molecule |
| chr10_-_5251809 | 0.06 |
ENSRNOT00000085479
|
Ciita
|
class II, major histocompatibility complex, transactivator |
| chr13_-_109849632 | 0.06 |
ENSRNOT00000005085
|
Atf3
|
activating transcription factor 3 |
| chrX_+_105911925 | 0.06 |
ENSRNOT00000052422
|
LOC108348137
|
armadillo repeat-containing X-linked protein 1 |
| chr4_+_57926531 | 0.06 |
ENSRNOT00000013948
|
Cpa5
|
carboxypeptidase A5 |
| chr8_-_70509874 | 0.06 |
ENSRNOT00000041915
|
Hacd3
|
3-hydroxyacyl-CoA dehydratase 3 |
| chr16_-_48981980 | 0.06 |
ENSRNOT00000014235
|
Acsl1
|
acyl-CoA synthetase long-chain family member 1 |
| chr16_+_18690649 | 0.06 |
ENSRNOT00000015190
|
Mat1a
|
methionine adenosyltransferase 1A |
| chr4_-_99546488 | 0.06 |
ENSRNOT00000045279
|
Kdm3a
|
lysine demethylase 3A |
| chr2_+_243656579 | 0.06 |
ENSRNOT00000036993
|
Adh1
|
alcohol dehydrogenase 1 (class I) |
| chr9_+_98924134 | 0.06 |
ENSRNOT00000027597
|
Twist2
|
twist family bHLH transcription factor 2 |
| chr6_-_1534488 | 0.06 |
ENSRNOT00000006824
|
Cebpz
|
CCAAT/enhancer binding protein zeta |
| chr3_+_112228720 | 0.06 |
ENSRNOT00000079079
|
Capn3
|
calpain 3 |
| chr13_-_48927483 | 0.06 |
ENSRNOT00000010976
|
Cdk18
|
cyclin-dependent kinase 18 |
| chr2_+_208738132 | 0.06 |
ENSRNOT00000023972
|
AABR07012795.1
|
|
| chr6_+_56846789 | 0.06 |
ENSRNOT00000032108
|
Agmo
|
alkylglycerol monooxygenase |
| chrX_-_157286936 | 0.06 |
ENSRNOT00000078100
|
Atp2b3
|
ATPase plasma membrane Ca2+ transporting 3 |
| chr2_+_209097927 | 0.05 |
ENSRNOT00000023807
|
Dennd2d
|
DENN domain containing 2D |
| chr19_+_60017746 | 0.05 |
ENSRNOT00000042623
|
Pard3
|
par-3 family cell polarity regulator |
| chr2_-_88763733 | 0.05 |
ENSRNOT00000059424
|
LOC688389
|
similar to solute carrier family 7 (cationic amino acid transporter, y+ system), member 12 |
| chr4_-_21920651 | 0.05 |
ENSRNOT00000066211
|
Tmem243
|
transmembrane protein 243 |
| chr7_+_91384187 | 0.05 |
ENSRNOT00000005828
|
Utp23
|
UTP23, small subunit processome component |
| chr14_-_6541171 | 0.05 |
ENSRNOT00000042532
ENSRNOT00000087758 |
Abcg3l1
|
ATP-binding cassette, subfamily G (WHITE), member 3-like 1 |
| chr9_-_104467973 | 0.05 |
ENSRNOT00000026099
|
Slco6b1
|
solute carrier organic anion transporter family member 6B1 |
| chr13_+_48790951 | 0.05 |
ENSRNOT00000090233
|
Elk4
|
ELK4, ETS transcription factor |
| chrX_-_104932508 | 0.05 |
ENSRNOT00000075325
|
Nox1
|
NADPH oxidase 1 |
| chr16_+_18690246 | 0.05 |
ENSRNOT00000081484
|
Mat1a
|
methionine adenosyltransferase 1A |
| chr10_+_18636485 | 0.05 |
ENSRNOT00000039882
|
AABR07029262.1
|
|
| chr17_-_81002838 | 0.05 |
ENSRNOT00000089807
|
St8sia6
|
ST8 alpha-N-acetyl-neuraminide alpha-2,8-sialyltransferase 6 |
| chrX_+_31054394 | 0.05 |
ENSRNOT00000037439
|
LOC688526
|
similar to ribonucleic acid binding protein S1 |
| chr11_+_74057361 | 0.05 |
ENSRNOT00000048746
|
Cpn2
|
carboxypeptidase N subunit 2 |
| chr1_-_166677026 | 0.05 |
ENSRNOT00000026644
ENSRNOT00000076714 |
Art2b
|
ADP-ribosyltransferase 2b |
| chr2_-_257376756 | 0.05 |
ENSRNOT00000065811
|
Gipc2
|
GIPC PDZ domain containing family, member 2 |
| chr1_-_171997902 | 0.05 |
ENSRNOT00000045415
|
LOC499235
|
LRRGT00141 |
| chr1_+_41323194 | 0.05 |
ENSRNOT00000026350
|
Esr1
|
estrogen receptor 1 |
| chr1_+_229267916 | 0.05 |
ENSRNOT00000073717
ENSRNOT00000082670 ENSRNOT00000076941 |
LOC100910851
|
serine protease inhibitor Kazal-type 5-like |
| chr1_-_98570949 | 0.05 |
ENSRNOT00000033648
|
Siglec5
|
sialic acid binding Ig-like lectin 5 |
| chr2_+_189591780 | 0.05 |
ENSRNOT00000064752
|
Jtb
|
jumping translocation breakpoint |
| chr8_-_115179191 | 0.05 |
ENSRNOT00000017224
|
Parp3
|
poly (ADP-ribose) polymerase family, member 3 |
| chr3_-_60023913 | 0.05 |
ENSRNOT00000064662
|
Cir1
|
corepressor interacting with RBPJ, 1 |
| chr2_+_251634431 | 0.05 |
ENSRNOT00000045016
|
Ddah1
|
dimethylarginine dimethylaminohydrolase 1 |
| chr16_+_85305493 | 0.05 |
ENSRNOT00000088012
|
AABR07026596.2
|
|
| chr1_+_214009784 | 0.05 |
ENSRNOT00000026079
|
LOC100911730
|
CD151 antigen-like |
| chrX_+_20316893 | 0.05 |
ENSRNOT00000082177
|
Wnk3
|
WNK lysine deficient protein kinase 3 |
| chr7_-_23953002 | 0.05 |
ENSRNOT00000047587
|
RGD1563124
|
similar to 40S ribosomal protein S20 |
| chr4_-_161587222 | 0.05 |
ENSRNOT00000050834
|
Tead4
|
TEA domain transcription factor 4 |
| chr1_+_214009986 | 0.05 |
ENSRNOT00000089241
|
LOC100911730
|
CD151 antigen-like |
| chr3_+_28416954 | 0.04 |
ENSRNOT00000043533
|
Kynu
|
kynureninase |
| chr3_+_91191837 | 0.04 |
ENSRNOT00000006097
|
Rag2
|
recombination activating 2 |
| chr2_-_185444897 | 0.04 |
ENSRNOT00000016329
|
Rps3a
|
ribosomal protein S3a |
| chr2_+_3662763 | 0.04 |
ENSRNOT00000017828
|
Mctp1
|
multiple C2 and transmembrane domain containing 1 |
| chr20_-_1878126 | 0.04 |
ENSRNOT00000000995
|
Ubd
|
ubiquitin D |
| chr5_+_64789456 | 0.04 |
ENSRNOT00000009584
|
Zfp189
|
zinc finger protein 189 |
| chr18_+_35121967 | 0.04 |
ENSRNOT00000017522
|
Spink5
|
serine peptidase inhibitor, Kazal type 5 |
| chr2_-_235052464 | 0.04 |
ENSRNOT00000093512
|
LOC103691699
|
uncharacterized LOC103691699 |
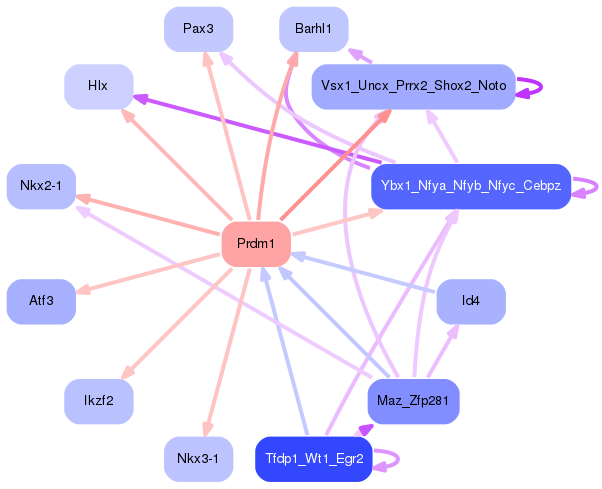
Network of associatons between targets according to the STRING database.

First level regulatory network of Prdm1
Gene Ontology Analysis
Gene overrepresentation in biological process category:
| Log-likelihood per target | Total log-likelihood | Term | Description |
|---|---|---|---|
| 0.1 | 0.2 | GO:1901492 | positive regulation of lymphangiogenesis(GO:1901492) |
| 0.1 | 0.2 | GO:0035425 | autocrine signaling(GO:0035425) |
| 0.1 | 0.5 | GO:0035726 | common myeloid progenitor cell proliferation(GO:0035726) |
| 0.1 | 0.3 | GO:0045629 | negative regulation of T-helper 2 cell differentiation(GO:0045629) |
| 0.1 | 0.3 | GO:0010266 | response to vitamin B1(GO:0010266) maintenance of protein location in mitochondrion(GO:0072656) |
| 0.0 | 0.1 | GO:0042335 | cuticle development(GO:0042335) |
| 0.0 | 0.2 | GO:2000195 | negative regulation of female gonad development(GO:2000195) |
| 0.0 | 0.2 | GO:0021759 | globus pallidus development(GO:0021759) Clara cell differentiation(GO:0060486) |
| 0.0 | 0.1 | GO:0045716 | positive regulation of low-density lipoprotein particle receptor biosynthetic process(GO:0045716) |
| 0.0 | 0.2 | GO:0030421 | defecation(GO:0030421) |
| 0.0 | 0.1 | GO:0002086 | diaphragm contraction(GO:0002086) |
| 0.0 | 0.1 | GO:0007290 | spermatid nucleus elongation(GO:0007290) |
| 0.0 | 0.1 | GO:0071899 | regulation of estrogen receptor binding(GO:0071898) negative regulation of estrogen receptor binding(GO:0071899) |
| 0.0 | 0.1 | GO:0098707 | ferrous iron import into cell(GO:0097460) ferrous iron import across plasma membrane(GO:0098707) |
| 0.0 | 0.1 | GO:0043553 | negative regulation of phosphatidylinositol 3-kinase activity(GO:0043553) |
| 0.0 | 0.1 | GO:1903070 | negative regulation of ER-associated ubiquitin-dependent protein catabolic process(GO:1903070) |
| 0.0 | 0.1 | GO:0006556 | S-adenosylmethionine biosynthetic process(GO:0006556) |
| 0.0 | 0.1 | GO:0006117 | acetaldehyde metabolic process(GO:0006117) |
| 0.0 | 0.1 | GO:1990091 | sodium-dependent self proteolysis(GO:1990091) |
| 0.0 | 0.1 | GO:0006741 | NADP biosynthetic process(GO:0006741) |
| 0.0 | 0.1 | GO:0036123 | histone H3-K9 dimethylation(GO:0036123) |
| 0.0 | 0.1 | GO:0071638 | negative regulation of monocyte chemotactic protein-1 production(GO:0071638) |
| 0.0 | 0.1 | GO:0019677 | NAD catabolic process(GO:0019677) |
| 0.0 | 0.1 | GO:0016098 | monoterpenoid metabolic process(GO:0016098) |
| 0.0 | 0.2 | GO:0021684 | cerebellar granular layer formation(GO:0021684) cerebellar granule cell differentiation(GO:0021707) |
| 0.0 | 0.0 | GO:1990375 | baculum development(GO:1990375) |
| 0.0 | 0.1 | GO:0044387 | negative regulation of protein kinase activity by regulation of protein phosphorylation(GO:0044387) |
| 0.0 | 0.1 | GO:0060594 | mammary gland specification(GO:0060594) |
| 0.0 | 0.1 | GO:0046368 | GDP-L-fucose metabolic process(GO:0046368) |
| 0.0 | 0.0 | GO:1990166 | protein localization to site of double-strand break(GO:1990166) |
| 0.0 | 0.1 | GO:0007341 | penetration of zona pellucida(GO:0007341) |
| 0.0 | 0.1 | GO:0030718 | germ-line stem cell population maintenance(GO:0030718) |
| 0.0 | 0.1 | GO:1903984 | positive regulation of TRAIL-activated apoptotic signaling pathway(GO:1903984) |
| 0.0 | 0.0 | GO:2000682 | positive regulation of rubidium ion transport(GO:2000682) positive regulation of rubidium ion transmembrane transporter activity(GO:2000688) |
| 0.0 | 0.1 | GO:0046726 | positive regulation by virus of viral protein levels in host cell(GO:0046726) |
| 0.0 | 0.1 | GO:0002778 | antimicrobial peptide production(GO:0002775) antibacterial peptide production(GO:0002778) regulation of antimicrobial peptide production(GO:0002784) regulation of antibacterial peptide production(GO:0002786) |
| 0.0 | 0.2 | GO:0034501 | protein localization to kinetochore(GO:0034501) |
| 0.0 | 0.1 | GO:0072592 | oxygen metabolic process(GO:0072592) |
| 0.0 | 0.0 | GO:0018199 | peptidyl-glutamine modification(GO:0018199) |
| 0.0 | 0.1 | GO:0008295 | spermidine biosynthetic process(GO:0008295) |
| 0.0 | 0.1 | GO:0071787 | endoplasmic reticulum tubular network assembly(GO:0071787) |
| 0.0 | 0.3 | GO:0045475 | locomotor rhythm(GO:0045475) |
| 0.0 | 0.1 | GO:0045341 | MHC class I biosynthetic process(GO:0045341) regulation of MHC class I biosynthetic process(GO:0045343) positive regulation of MHC class I biosynthetic process(GO:0045345) |
| 0.0 | 0.1 | GO:1902902 | negative regulation of autophagosome assembly(GO:1902902) |
| 0.0 | 0.2 | GO:0002862 | negative regulation of inflammatory response to antigenic stimulus(GO:0002862) |
| 0.0 | 0.2 | GO:0043248 | proteasome assembly(GO:0043248) |
| 0.0 | 0.0 | GO:0019805 | quinolinate biosynthetic process(GO:0019805) |
| 0.0 | 0.0 | GO:0002331 | pre-B cell allelic exclusion(GO:0002331) |
| 0.0 | 0.3 | GO:1900027 | regulation of ruffle assembly(GO:1900027) |
| 0.0 | 0.1 | GO:0002636 | positive regulation of germinal center formation(GO:0002636) B cell costimulation(GO:0031296) |
| 0.0 | 0.1 | GO:0001574 | ganglioside biosynthetic process(GO:0001574) |
| 0.0 | 0.1 | GO:0034285 | response to sucrose(GO:0009744) response to disaccharide(GO:0034285) |
Gene overrepresentation in cellular component category:
| Log-likelihood per target | Total log-likelihood | Term | Description |
|---|---|---|---|
| 0.1 | 0.2 | GO:0032173 | septin collar(GO:0032173) |
| 0.0 | 0.3 | GO:1990111 | spermatoproteasome complex(GO:1990111) |
| 0.0 | 0.1 | GO:0008537 | proteasome activator complex(GO:0008537) |
| 0.0 | 0.3 | GO:0016272 | prefoldin complex(GO:0016272) |
| 0.0 | 0.2 | GO:0033269 | internode region of axon(GO:0033269) |
| 0.0 | 0.1 | GO:1990622 | CHOP-ATF3 complex(GO:1990622) |
| 0.0 | 0.3 | GO:0000940 | condensed chromosome outer kinetochore(GO:0000940) |
| 0.0 | 0.1 | GO:0034388 | Pwp2p-containing subcomplex of 90S preribosome(GO:0034388) |
| 0.0 | 0.1 | GO:0034715 | pICln-Sm protein complex(GO:0034715) |
| 0.0 | 0.1 | GO:1990712 | HFE-transferrin receptor complex(GO:1990712) |
| 0.0 | 0.1 | GO:0031313 | extrinsic component of endosome membrane(GO:0031313) |
| 0.0 | 0.0 | GO:0097209 | epidermal lamellar body(GO:0097209) |
| 0.0 | 0.2 | GO:0002080 | acrosomal membrane(GO:0002080) |
Gene overrepresentation in molecular function category:
| Log-likelihood per target | Total log-likelihood | Term | Description |
|---|---|---|---|
| 0.0 | 0.2 | GO:0008970 | phosphatidylcholine 1-acylhydrolase activity(GO:0008970) |
| 0.0 | 0.1 | GO:0004478 | methionine adenosyltransferase activity(GO:0004478) |
| 0.0 | 0.1 | GO:0004574 | oligo-1,6-glucosidase activity(GO:0004574) |
| 0.0 | 0.2 | GO:0008503 | benzodiazepine receptor activity(GO:0008503) |
| 0.0 | 0.2 | GO:0008428 | ribonuclease inhibitor activity(GO:0008428) |
| 0.0 | 0.1 | GO:0019834 | phospholipase A2 inhibitor activity(GO:0019834) |
| 0.0 | 0.1 | GO:0008526 | phosphatidylinositol transporter activity(GO:0008526) |
| 0.0 | 0.1 | GO:0046592 | polyamine oxidase activity(GO:0046592) |
| 0.0 | 0.2 | GO:0001161 | intronic transcription regulatory region sequence-specific DNA binding(GO:0001161) |
| 0.0 | 0.1 | GO:0102344 | 3-hydroxy-behenoyl-CoA dehydratase activity(GO:0102344) 3-hydroxy-lignoceroyl-CoA dehydratase activity(GO:0102345) |
| 0.0 | 0.2 | GO:0005172 | vascular endothelial growth factor receptor binding(GO:0005172) |
| 0.0 | 0.1 | GO:0061133 | endopeptidase activator activity(GO:0061133) |
| 0.0 | 0.1 | GO:0005138 | interleukin-6 receptor binding(GO:0005138) |
| 0.0 | 0.1 | GO:0072345 | NAADP-sensitive calcium-release channel activity(GO:0072345) |
| 0.0 | 0.4 | GO:0070003 | threonine-type endopeptidase activity(GO:0004298) threonine-type peptidase activity(GO:0070003) |
| 0.0 | 0.0 | GO:0016403 | dimethylargininase activity(GO:0016403) |
| 0.0 | 0.0 | GO:0016823 | hydrolase activity, acting on acid carbon-carbon bonds(GO:0016822) hydrolase activity, acting on acid carbon-carbon bonds, in ketonic substances(GO:0016823) |
| 0.0 | 0.1 | GO:0003987 | acetate-CoA ligase activity(GO:0003987) |
| 0.0 | 0.1 | GO:0016174 | NAD(P)H oxidase activity(GO:0016174) |
| 0.0 | 0.1 | GO:0030881 | beta-2-microglobulin binding(GO:0030881) |
| 0.0 | 0.1 | GO:0030284 | estrogen receptor activity(GO:0030284) |
| 0.0 | 0.1 | GO:0030348 | syntaxin-3 binding(GO:0030348) |
| 0.0 | 0.2 | GO:0010314 | phosphatidylinositol-5-phosphate binding(GO:0010314) |
| 0.0 | 0.1 | GO:0008494 | translation activator activity(GO:0008494) |
| 0.0 | 0.1 | GO:1990446 | U1 snRNP binding(GO:1990446) |
| 0.0 | 0.1 | GO:0032036 | myosin heavy chain binding(GO:0032036) |
| 0.0 | 0.1 | GO:0015252 | hydrogen ion channel activity(GO:0015252) |
| 0.0 | 0.2 | GO:0005242 | inward rectifier potassium channel activity(GO:0005242) |
Gene overrepresentation in curated gene sets: canonical pathways category:
| Log-likelihood per target | Total log-likelihood | Term | Description |
|---|---|---|---|
| 0.0 | 0.2 | PID VEGF VEGFR PATHWAY | VEGF and VEGFR signaling network |
Gene overrepresentation in curated gene sets: REACTOME pathways category:
| Log-likelihood per target | Total log-likelihood | Term | Description |
|---|---|---|---|
| 0.0 | 0.2 | REACTOME VEGF LIGAND RECEPTOR INTERACTIONS | Genes involved in VEGF ligand-receptor interactions |
| 0.0 | 0.5 | REACTOME CROSS PRESENTATION OF SOLUBLE EXOGENOUS ANTIGENS ENDOSOMES | Genes involved in Cross-presentation of soluble exogenous antigens (endosomes) |