Project
GSE49485: Hypoxia transcriptome sequencing of rat brain.
Navigation
Downloads
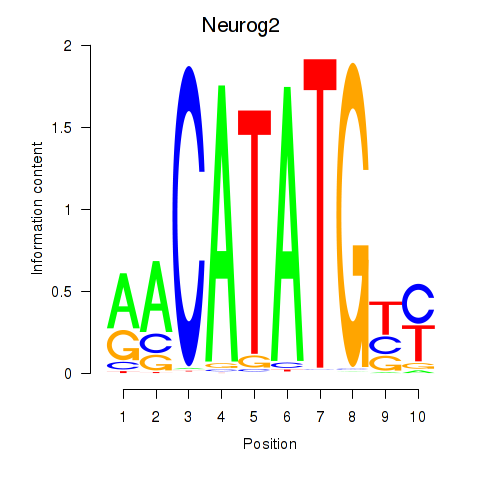
Results for Neurog2
Z-value: 0.54
Motif logo
Transcription factors associated with Neurog2
| Gene Symbol | Gene ID | Gene Info |
|---|---|---|
|
Neurog2
|
ENSRNOG00000010972 | neurogenin 2 |
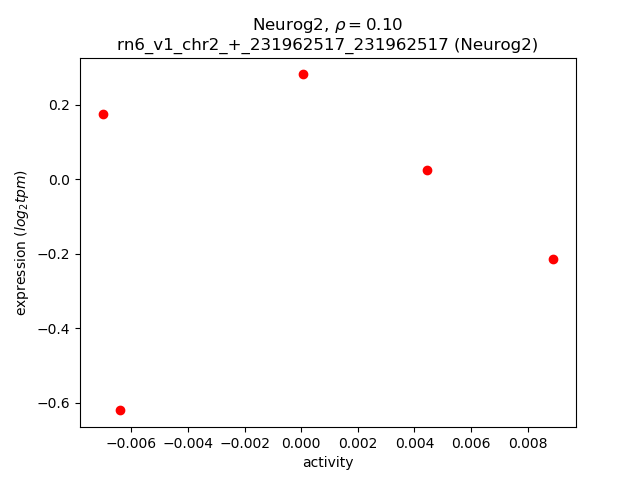
Activity-expression correlation:
| Gene | Promoter | Pearson corr. coef. | P-value | Plot |
|---|---|---|---|---|
| Neurog2 | rn6_v1_chr2_+_231962517_231962517 | 0.10 | 8.8e-01 | Click! |
Activity profile of Neurog2 motif
Sorted Z-values of Neurog2 motif
| Promoter | Log-likelihood | Transcript | Gene | Gene Info |
|---|---|---|---|---|
| chr3_+_145764932 | 0.25 |
ENSRNOT00000075257
|
AABR07054264.1
|
|
| chr10_-_51576376 | 0.24 |
ENSRNOT00000004829
|
Arhgap44
|
Rho GTPase activating protein 44 |
| chr10_-_63952726 | 0.23 |
ENSRNOT00000090461
|
Doc2b
|
double C2 domain beta |
| chr20_+_6211420 | 0.23 |
ENSRNOT00000000624
|
Kctd20
|
potassium channel tetramerization domain containing 20 |
| chr8_-_23390773 | 0.21 |
ENSRNOT00000019601
ENSRNOT00000071846 |
Anln
|
anillin, actin binding protein |
| chr6_+_60566196 | 0.21 |
ENSRNOT00000006709
ENSRNOT00000075193 |
Dock4
|
dedicator of cytokinesis 4 |
| chr7_-_114848414 | 0.20 |
ENSRNOT00000032620
|
Slc45a4
|
solute carrier family 45, member 4 |
| chr2_+_196334626 | 0.20 |
ENSRNOT00000050914
ENSRNOT00000028645 ENSRNOT00000090729 |
Sema6c
|
semaphorin 6C |
| chr10_+_11393103 | 0.19 |
ENSRNOT00000076022
|
Adcy9
|
adenylate cyclase 9 |
| chr5_-_12526962 | 0.18 |
ENSRNOT00000092104
|
St18
|
suppression of tumorigenicity 18 |
| chr2_+_207930796 | 0.17 |
ENSRNOT00000047827
|
Kcnd3
|
potassium voltage-gated channel subfamily D member 3 |
| chr3_+_131351587 | 0.17 |
ENSRNOT00000010835
|
Btbd3
|
BTB domain containing 3 |
| chr16_-_83438561 | 0.17 |
ENSRNOT00000057461
|
Col4a2
|
collagen type IV alpha 2 chain |
| chr2_-_177924970 | 0.16 |
ENSRNOT00000029340
|
Rapgef2
|
Rap guanine nucleotide exchange factor 2 |
| chr9_-_81586116 | 0.16 |
ENSRNOT00000089952
|
Tmbim1
|
transmembrane BAX inhibitor motif containing 1 |
| chr13_-_88642011 | 0.16 |
ENSRNOT00000067037
|
LOC100361087
|
hypothetical LOC100361087 |
| chr8_-_63750531 | 0.16 |
ENSRNOT00000009496
|
Neo1
|
neogenin 1 |
| chr5_-_169630340 | 0.15 |
ENSRNOT00000087043
|
Kcnab2
|
potassium voltage-gated channel subfamily A regulatory beta subunit 2 |
| chr3_-_13525983 | 0.15 |
ENSRNOT00000082036
|
Pbx3
|
PBX homeobox 3 |
| chr10_-_16046033 | 0.15 |
ENSRNOT00000089460
|
Cpeb4
|
cytoplasmic polyadenylation element binding protein 4 |
| chr5_-_12563429 | 0.14 |
ENSRNOT00000059625
|
St18
|
suppression of tumorigenicity 18 |
| chr1_+_124625985 | 0.14 |
ENSRNOT00000021068
|
Otud7a
|
OTU deubiquitinase 7A |
| chr4_-_155740193 | 0.14 |
ENSRNOT00000043229
|
LOC102550396
|
LRRGT00188 |
| chr10_-_16045835 | 0.14 |
ENSRNOT00000064832
|
Cpeb4
|
cytoplasmic polyadenylation element binding protein 4 |
| chrX_-_76708878 | 0.14 |
ENSRNOT00000045534
|
Atrx
|
ATRX, chromatin remodeler |
| chr10_-_56530842 | 0.13 |
ENSRNOT00000077451
|
AABR07029863.3
|
|
| chr4_+_124005280 | 0.13 |
ENSRNOT00000014353
|
Nr2c2
|
nuclear receptor subfamily 2, group C, member 2 |
| chr4_-_31730386 | 0.13 |
ENSRNOT00000013817
|
Slc25a13
|
solute carrier family 25 member 13 |
| chr3_+_152402520 | 0.13 |
ENSRNOT00000027086
|
Cnbd2
|
cyclic nucleotide binding domain containing 2 |
| chr8_+_69971778 | 0.12 |
ENSRNOT00000058007
ENSRNOT00000037941 ENSRNOT00000050649 |
Megf11
|
multiple EGF-like-domains 11 |
| chr7_+_117456039 | 0.12 |
ENSRNOT00000051754
|
Mroh1
|
maestro heat-like repeat family member 1 |
| chr10_+_11392625 | 0.12 |
ENSRNOT00000072802
|
Adcy9
|
adenylate cyclase 9 |
| chrX_-_76924362 | 0.12 |
ENSRNOT00000078997
|
Atrx
|
ATRX, chromatin remodeler |
| chr10_-_45297385 | 0.12 |
ENSRNOT00000041187
|
Hist3h2bb
|
histone cluster 3 H2B family member b |
| chr2_+_196594303 | 0.12 |
ENSRNOT00000064442
ENSRNOT00000044738 |
Arnt
|
aryl hydrocarbon receptor nuclear translocator |
| chrX_-_29648359 | 0.12 |
ENSRNOT00000086721
ENSRNOT00000006777 |
Gpm6b
|
glycoprotein m6b |
| chr7_-_117978787 | 0.11 |
ENSRNOT00000074262
|
Zfp647
|
zinc finger protein 647 |
| chr9_-_112027155 | 0.11 |
ENSRNOT00000021258
ENSRNOT00000080962 |
Pja2
|
praja ring finger ubiquitin ligase 2 |
| chr17_-_10208360 | 0.11 |
ENSRNOT00000087397
|
Unc5a
|
unc-5 netrin receptor A |
| chr5_+_121952977 | 0.11 |
ENSRNOT00000008278
|
Pde4b
|
phosphodiesterase 4B |
| chr9_+_16302578 | 0.11 |
ENSRNOT00000021762
|
Gltscr1l
|
GLTSCR1-like |
| chr3_+_40038336 | 0.11 |
ENSRNOT00000048804
|
Galnt13
|
polypeptide N-acetylgalactosaminyltransferase 13 |
| chr20_-_5212624 | 0.10 |
ENSRNOT00000074261
|
LOC103689996
|
antigen peptide transporter 2 |
| chr1_+_162083030 | 0.10 |
ENSRNOT00000016361
|
Gab2
|
GRB2-associated binding protein 2 |
| chr6_-_76552559 | 0.10 |
ENSRNOT00000065230
|
Ralgapa1
|
Ral GTPase activating protein catalytic alpha subunit 1 |
| chr3_-_66335869 | 0.10 |
ENSRNOT00000079781
ENSRNOT00000043238 ENSRNOT00000073412 ENSRNOT00000057878 ENSRNOT00000079212 |
Cerkl
|
ceramide kinase-like |
| chr20_+_3995544 | 0.10 |
ENSRNOT00000000527
|
Tap2
|
transporter 2, ATP binding cassette subfamily B member |
| chr3_-_66417741 | 0.10 |
ENSRNOT00000007662
|
Neurod1
|
neuronal differentiation 1 |
| chr10_+_74959285 | 0.09 |
ENSRNOT00000010296
|
Rnf43
|
ring finger protein 43 |
| chr3_+_172155496 | 0.09 |
ENSRNOT00000066279
|
Stx16
|
syntaxin 16 |
| chr4_-_81241152 | 0.09 |
ENSRNOT00000015325
ENSRNOT00000015152 |
Hnrnpa2b1
|
heterogeneous nuclear ribonucleoprotein A2/B1 |
| chr4_+_57378069 | 0.09 |
ENSRNOT00000080173
ENSRNOT00000011851 |
Nrf1
|
nuclear respiratory factor 1 |
| chr7_-_118518193 | 0.09 |
ENSRNOT00000075636
|
LOC102555083
|
zinc finger protein 250-like |
| chr17_-_8331032 | 0.08 |
ENSRNOT00000016704
|
Smad5
|
SMAD family member 5 |
| chr2_+_122368265 | 0.08 |
ENSRNOT00000078321
|
Atp11b
|
ATPase phospholipid transporting 11B (putative) |
| chr2_-_54777729 | 0.08 |
ENSRNOT00000082548
|
C7
|
complement C7 |
| chr4_-_22424862 | 0.08 |
ENSRNOT00000082359
|
Abcb1a
|
ATP binding cassette subfamily B member 1A |
| chr16_-_32753278 | 0.08 |
ENSRNOT00000015759
|
Mfap3l
|
microfibrillar-associated protein 3-like |
| chr3_-_146407252 | 0.08 |
ENSRNOT00000091310
|
Apmap
|
adipocyte plasma membrane associated protein |
| chr1_+_259958310 | 0.07 |
ENSRNOT00000019751
|
LOC103689954
|
ectonucleoside triphosphate diphosphohydrolase 1 |
| chr1_-_198577226 | 0.07 |
ENSRNOT00000055013
|
Spn
|
sialophorin |
| chr3_+_150135821 | 0.07 |
ENSRNOT00000047286
|
Zfp341
|
zinc finger protein 341 |
| chr2_-_118989127 | 0.07 |
ENSRNOT00000014871
|
Gnb4
|
G protein subunit beta 4 |
| chr19_+_42097995 | 0.07 |
ENSRNOT00000020197
|
Hp
|
haptoglobin |
| chr9_+_16508799 | 0.07 |
ENSRNOT00000021803
|
Rpl7l1
|
ribosomal protein L7-like 1 |
| chr2_+_123617794 | 0.07 |
ENSRNOT00000080632
|
RGD1307100
|
similar to RIKEN cDNA D630029K19 |
| chr1_+_99505677 | 0.07 |
ENSRNOT00000024645
|
Zfp719
|
zinc finger protein 719 |
| chr5_+_48012231 | 0.07 |
ENSRNOT00000077040
|
Mdn1
|
midasin AAA ATPase 1 |
| chr1_+_40816107 | 0.06 |
ENSRNOT00000060767
|
Akap12
|
A-kinase anchoring protein 12 |
| chr3_+_8453609 | 0.06 |
ENSRNOT00000041921
|
Odf2
|
outer dense fiber of sperm tails 2 |
| chr7_+_72599479 | 0.06 |
ENSRNOT00000018963
|
AABR07057460.1
|
|
| chr19_+_52647070 | 0.06 |
ENSRNOT00000068389
ENSRNOT00000087857 |
Crispld2
|
cysteine-rich secretory protein LCCL domain containing 2 |
| chr16_+_35573058 | 0.06 |
ENSRNOT00000059580
|
Galntl6
|
polypeptide N-acetylgalactosaminyltransferase-like 6 |
| chr7_+_2752680 | 0.06 |
ENSRNOT00000033726
|
Cs
|
citrate synthase |
| chr3_+_36173002 | 0.06 |
ENSRNOT00000038906
|
LOC499796
|
LRRGT00012 |
| chr2_-_39003552 | 0.06 |
ENSRNOT00000078884
|
Zswim6
|
zinc finger, SWIM-type containing 6 |
| chr20_-_29579578 | 0.06 |
ENSRNOT00000000700
|
AC096404.1
|
|
| chr15_-_100348760 | 0.06 |
ENSRNOT00000085607
|
AABR07019341.1
|
|
| chr4_-_170783725 | 0.05 |
ENSRNOT00000072528
|
Wbp11
|
WW domain binding protein 11 |
| chr2_-_35870578 | 0.05 |
ENSRNOT00000066069
|
Rnf180
|
ring finger protein 180 |
| chr1_-_167708685 | 0.05 |
ENSRNOT00000092857
ENSRNOT00000024992 |
Trim21
|
tripartite motif-containing 21 |
| chr19_-_22632071 | 0.05 |
ENSRNOT00000077275
|
Gpt2
|
glutamic--pyruvic transaminase 2 |
| chr8_+_50604768 | 0.05 |
ENSRNOT00000059383
|
AC135409.1
|
|
| chr16_+_49293243 | 0.05 |
ENSRNOT00000049830
|
AC130162.1
|
|
| chr7_-_127081704 | 0.05 |
ENSRNOT00000055893
|
LOC108351584
|
uncharacterized LOC108351584 |
| chr11_-_88972176 | 0.05 |
ENSRNOT00000002498
|
Pkp2
|
plakophilin 2 |
| chr8_+_49737798 | 0.05 |
ENSRNOT00000022476
|
Dscaml1
|
DS cell adhesion molecule-like 1 |
| chr17_+_87274944 | 0.04 |
ENSRNOT00000073718
|
Etl4
|
enhancer trap locus 4 |
| chr2_+_40554146 | 0.04 |
ENSRNOT00000015138
|
Pde4d
|
phosphodiesterase 4D |
| chr17_-_58301260 | 0.04 |
ENSRNOT00000083331
|
Adarb2
|
adenosine deaminase, RNA-specific, B2 |
| chr5_+_58636083 | 0.04 |
ENSRNOT00000067281
|
Unc13b
|
unc-13 homolog B |
| chr5_-_134905588 | 0.04 |
ENSRNOT00000016013
|
Nsun4
|
NOP2/Sun RNA methyltransferase family member 4 |
| chr1_+_164425475 | 0.04 |
ENSRNOT00000023386
|
Klhl35
|
kelch-like family member 35 |
| chrX_-_65101425 | 0.04 |
ENSRNOT00000076732
|
Las1l
|
LAS1-like, ribosome biogenesis factor |
| chr16_+_71889235 | 0.04 |
ENSRNOT00000038266
|
Adam32
|
ADAM metallopeptidase domain 32 |
| chr12_-_18526250 | 0.04 |
ENSRNOT00000001791
|
Asmt
|
acetylserotonin O-methyltransferase |
| chr1_-_65863037 | 0.04 |
ENSRNOT00000075269
|
AABR07002068.1
|
|
| chr13_+_71656651 | 0.04 |
ENSRNOT00000050365
|
Zfp648
|
zinc finger protein 648 |
| chr20_+_7767395 | 0.04 |
ENSRNOT00000084771
|
Zfp523
|
zinc finger protein 523 |
| chr5_+_98469047 | 0.03 |
ENSRNOT00000041374
|
Lurap1l
|
leucine rich adaptor protein 1-like |
| chr10_-_4257868 | 0.03 |
ENSRNOT00000035886
|
Tnfrsf17
|
TNF receptor superfamily member 17 |
| chr17_+_21984325 | 0.03 |
ENSRNOT00000088725
|
AABR07027267.1
|
|
| chr8_+_50573026 | 0.03 |
ENSRNOT00000025232
|
Bud13
|
BUD13 homolog |
| chr13_+_67611708 | 0.03 |
ENSRNOT00000063833
|
Tpr
|
translocated promoter region, nuclear basket protein |
| chr3_+_80468154 | 0.03 |
ENSRNOT00000021837
|
Ckap5
|
cytoskeleton associated protein 5 |
| chr3_-_145810834 | 0.03 |
ENSRNOT00000075429
|
LOC102555217
|
zinc finger protein 120-like |
| chr1_-_189181901 | 0.03 |
ENSRNOT00000092022
|
Gp2
|
glycoprotein 2 |
| chr18_-_77535564 | 0.03 |
ENSRNOT00000041380
ENSRNOT00000090265 |
Atp9b
|
ATPase phospholipid transporting 9B (putative) |
| chr4_+_79868442 | 0.03 |
ENSRNOT00000089973
|
Mpp6
|
membrane palmitoylated protein 6 |
| chr1_+_88885937 | 0.03 |
ENSRNOT00000029719
|
Nfkbid
|
NFKB inhibitor delta |
| chr7_+_71065197 | 0.03 |
ENSRNOT00000051075
|
Rdh16
|
retinol dehydrogenase 16 (all-trans) |
| chr8_+_22423467 | 0.03 |
ENSRNOT00000085320
|
Ilf3
|
interleukin enhancer binding factor 3 |
| chr1_+_254530121 | 0.03 |
ENSRNOT00000089627
|
AC080157.1
|
|
| chr19_-_43215281 | 0.03 |
ENSRNOT00000025052
|
Aars
|
alanyl-tRNA synthetase |
| chr8_+_107499262 | 0.02 |
ENSRNOT00000081029
|
Cep70
|
centrosomal protein 70 |
| chrX_+_45213228 | 0.02 |
ENSRNOT00000088538
|
LOC103690319
|
odorant-binding protein |
| chr8_-_48634797 | 0.02 |
ENSRNOT00000012868
|
Hinfp
|
histone H4 transcription factor |
| chr1_+_213451721 | 0.02 |
ENSRNOT00000045652
|
Olr315
|
olfactory receptor 315 |
| chr2_+_102685513 | 0.02 |
ENSRNOT00000033940
|
Bhlhe22
|
basic helix-loop-helix family, member e22 |
| chr15_-_44673765 | 0.02 |
ENSRNOT00000048783
|
AABR07018167.1
|
|
| chr1_+_199351628 | 0.02 |
ENSRNOT00000078578
|
Bckdk
|
branched chain ketoacid dehydrogenase kinase |
| chr3_-_148057523 | 0.02 |
ENSRNOT00000055408
|
Defb24
|
defensin beta 24 |
| chr16_+_23447366 | 0.02 |
ENSRNOT00000068629
|
Psd3
|
pleckstrin and Sec7 domain containing 3 |
| chr1_+_87045796 | 0.02 |
ENSRNOT00000027620
|
Lgals7
|
galectin 7 |
| chr20_-_2083688 | 0.02 |
ENSRNOT00000001011
|
Znrd1as1
|
ZNRD1 antisense RNA 1 |
| chr5_+_48011864 | 0.02 |
ENSRNOT00000067610
|
Mdn1
|
midasin AAA ATPase 1 |
| chr5_-_173312023 | 0.02 |
ENSRNOT00000026671
|
Tas1r3
|
taste 1 receptor member 3 |
| chr1_-_264706476 | 0.02 |
ENSRNOT00000045446
|
AC121209.1
|
|
| chr19_-_10763091 | 0.02 |
ENSRNOT00000079523
ENSRNOT00000023455 |
Arl2bp
|
ADP-ribosylation factor like GTPase 2 binding protein |
| chr10_+_69737328 | 0.02 |
ENSRNOT00000055999
ENSRNOT00000076773 |
Tmem132e
|
transmembrane protein 132E |
| chr15_+_48789165 | 0.02 |
ENSRNOT00000044562
|
Zfp395
|
zinc finger protein 395 |
| chr12_+_1889331 | 0.02 |
ENSRNOT00000066281
|
Arhgef18
|
Rho/Rac guanine nucleotide exchange factor 18 |
| chr1_-_72461547 | 0.02 |
ENSRNOT00000022480
|
Ssc5d
|
scavenger receptor cysteine rich family member with 5 domains |
| chr6_+_18880737 | 0.02 |
ENSRNOT00000003432
|
Alkbh8
|
alkB homolog 8, tRNA methyltransferase |
| chr7_-_132343169 | 0.01 |
ENSRNOT00000021064
|
Abcd2
|
ATP binding cassette subfamily D member 2 |
| chr4_-_130659697 | 0.01 |
ENSRNOT00000072374
|
LOC100363436
|
rCG56280-like |
| chr1_-_213534641 | 0.01 |
ENSRNOT00000033074
|
Syce1
|
synaptonemal complex central element protein 1 |
| chr3_-_95418679 | 0.01 |
ENSRNOT00000018074
|
Rcn1
|
reticulocalbin 1 |
| chr7_-_123572082 | 0.01 |
ENSRNOT00000068020
|
Naga
|
N-acetyl galactosaminidase, alpha |
| chr17_+_30556884 | 0.01 |
ENSRNOT00000080929
ENSRNOT00000022022 |
Eci2
|
enoyl-CoA delta isomerase 2 |
| chr11_-_87449940 | 0.01 |
ENSRNOT00000002560
|
Slc7a4
|
solute carrier family 7, member 4 |
| chr1_-_214844858 | 0.01 |
ENSRNOT00000046344
|
Tollip
|
toll interacting protein |
| chr5_-_73621070 | 0.01 |
ENSRNOT00000014888
|
Ctnnal1
|
catenin alpha-like 1 |
| chr2_-_34419428 | 0.01 |
ENSRNOT00000048123
|
AABR07007905.1
|
|
| chr3_-_37445907 | 0.01 |
ENSRNOT00000006172
|
Rbm43
|
RNA binding motif protein 43 |
| chr4_+_68635581 | 0.01 |
ENSRNOT00000016217
|
Ssbp1
|
single stranded DNA binding protein 1 |
| chrX_+_123404518 | 0.01 |
ENSRNOT00000015085
|
Slc25a5
|
solute carrier family 25 member 5 |
| chr3_-_23353425 | 0.01 |
ENSRNOT00000019703
|
Golga1
|
golgin A1 |
| chr2_+_21931493 | 0.01 |
ENSRNOT00000018259
|
Dhfr
|
dihydrofolate reductase |
| chr10_+_37582706 | 0.01 |
ENSRNOT00000007630
|
RGD1306484
|
similar to growth and transformation-dependent protein |
| chr1_+_84070983 | 0.00 |
ENSRNOT00000090478
|
Numbl
|
NUMB-like, endocytic adaptor protein |
| chr6_-_108596446 | 0.00 |
ENSRNOT00000031331
ENSRNOT00000077458 ENSRNOT00000082792 |
Ltbp2
|
latent transforming growth factor beta binding protein 2 |
| chr20_-_3439983 | 0.00 |
ENSRNOT00000080822
ENSRNOT00000001099 |
Ier3
|
immediate early response 3 |
| chr4_+_34237762 | 0.00 |
ENSRNOT00000084163
|
Mios
|
meiosis regulator for oocyte development |
| chr3_-_123206828 | 0.00 |
ENSRNOT00000030192
|
Ddrgk1
|
DDRGK domain containing 1 |
| chr9_-_105655471 | 0.00 |
ENSRNOT00000014921
|
RGD1560925
|
similar to 2610034M16Rik protein |
| chr3_-_133894569 | 0.00 |
ENSRNOT00000084221
|
AABR07053968.1
|
|
| chr4_+_122365093 | 0.00 |
ENSRNOT00000024011
|
Klf15
|
Kruppel-like factor 15 |
| chr2_-_184993341 | 0.00 |
ENSRNOT00000071580
|
Fam160a1
|
family with sequence similarity 160, member A1 |
| chr4_-_173640684 | 0.00 |
ENSRNOT00000010728
|
Rergl
|
RERG like |
| chr20_+_3309899 | 0.00 |
ENSRNOT00000001049
|
Abcf1
|
ATP binding cassette subfamily F member 1 |
| chr5_+_58667885 | 0.00 |
ENSRNOT00000064755
|
Unc13b
|
unc-13 homolog B |
| chr1_-_205630073 | 0.00 |
ENSRNOT00000037064
|
Tex36
|
testis expressed 36 |
| chr3_-_171286413 | 0.00 |
ENSRNOT00000008365
ENSRNOT00000081036 |
Zbp1
|
Z-DNA binding protein 1 |
| chr6_+_64252020 | 0.00 |
ENSRNOT00000047296
ENSRNOT00000082105 |
Pnpla8
|
patatin-like phospholipase domain containing 8 |
| chr5_-_70463546 | 0.00 |
ENSRNOT00000043184
|
AC118841.1
|
|
| chrX_-_104984341 | 0.00 |
ENSRNOT00000077996
|
Xkrx
|
XK related, X-linked |
| chr2_+_179952227 | 0.00 |
ENSRNOT00000015081
|
Pdgfc
|
platelet derived growth factor C |
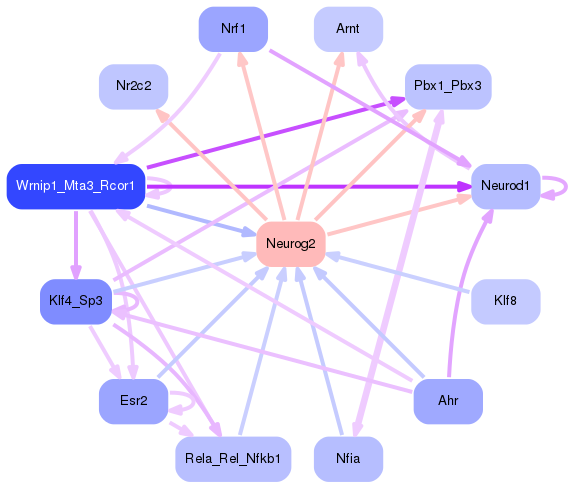
Network of associatons between targets according to the STRING database.

First level regulatory network of Neurog2
Gene Ontology Analysis
Gene overrepresentation in biological process category:
| Log-likelihood per target | Total log-likelihood | Term | Description |
|---|---|---|---|
| 0.1 | 0.3 | GO:0097394 | post-embryonic appendage morphogenesis(GO:0035120) post-embryonic limb morphogenesis(GO:0035127) post-embryonic forelimb morphogenesis(GO:0035128) telomeric repeat-containing RNA transcription(GO:0097393) telomeric repeat-containing RNA transcription from RNA pol II promoter(GO:0097394) regulation of telomeric RNA transcription from RNA pol II promoter(GO:1901580) negative regulation of telomeric RNA transcription from RNA pol II promoter(GO:1901581) positive regulation of telomeric RNA transcription from RNA pol II promoter(GO:1901582) |
| 0.1 | 0.2 | GO:1904694 | negative regulation of vascular smooth muscle contraction(GO:1904694) |
| 0.1 | 0.2 | GO:0015772 | disaccharide transport(GO:0015766) sucrose transport(GO:0015770) oligosaccharide transport(GO:0015772) |
| 0.1 | 0.2 | GO:0098886 | modification of dendritic spine(GO:0098886) |
| 0.1 | 0.2 | GO:0090521 | glomerular visceral epithelial cell migration(GO:0090521) |
| 0.0 | 0.1 | GO:0046968 | antigen processing and presentation of exogenous peptide antigen via MHC class Ib(GO:0002477) antigen processing and presentation of exogenous protein antigen via MHC class Ib, TAP-dependent(GO:0002481) antigen processing and presentation of endogenous peptide antigen via MHC class Ib via ER pathway(GO:0002488) antigen processing and presentation of endogenous peptide antigen via MHC class Ib via ER pathway, TAP-dependent(GO:0002489) positive regulation of antigen processing and presentation of peptide antigen(GO:0002585) regulation of antigen processing and presentation of peptide antigen via MHC class I(GO:0002589) cytosol to ER transport(GO:0046967) peptide antigen transport(GO:0046968) |
| 0.0 | 0.2 | GO:0048022 | negative regulation of melanin biosynthetic process(GO:0048022) negative regulation of secondary metabolite biosynthetic process(GO:1900377) |
| 0.0 | 0.1 | GO:0043490 | malate-aspartate shuttle(GO:0043490) |
| 0.0 | 0.1 | GO:1902044 | regulation of Fas signaling pathway(GO:1902044) |
| 0.0 | 0.1 | GO:0051612 | negative regulation of neurotransmitter uptake(GO:0051581) regulation of serotonin uptake(GO:0051611) negative regulation of serotonin uptake(GO:0051612) |
| 0.0 | 0.3 | GO:2000766 | negative regulation of cytoplasmic translation(GO:2000766) |
| 0.0 | 0.2 | GO:1901898 | negative regulation of relaxation of cardiac muscle(GO:1901898) |
| 0.0 | 0.1 | GO:2000295 | regulation of hydrogen peroxide catabolic process(GO:2000295) |
| 0.0 | 0.1 | GO:0001880 | Mullerian duct regression(GO:0001880) |
| 0.0 | 0.1 | GO:0002483 | antigen processing and presentation of endogenous peptide antigen(GO:0002483) antigen processing and presentation of endogenous peptide antigen via MHC class I(GO:0019885) |
| 0.0 | 0.1 | GO:1905230 | carbohydrate export(GO:0033231) daunorubicin transport(GO:0043215) response to borneol(GO:1905230) cellular response to borneol(GO:1905231) response to codeine(GO:1905233) response to quercetin(GO:1905235) drug transport across blood-brain barrier(GO:1990962) establishment of blood-retinal barrier(GO:1990963) |
| 0.0 | 0.1 | GO:0060729 | intestinal epithelial structure maintenance(GO:0060729) |
| 0.0 | 0.1 | GO:0033564 | anterior/posterior axon guidance(GO:0033564) |
| 0.0 | 0.1 | GO:0044806 | G-quadruplex DNA unwinding(GO:0044806) |
| 0.0 | 0.1 | GO:0002884 | type IV hypersensitivity(GO:0001806) negative regulation of hypersensitivity(GO:0002884) |
| 0.0 | 0.3 | GO:0071880 | adenylate cyclase-activating adrenergic receptor signaling pathway(GO:0071880) |
| 0.0 | 0.2 | GO:0070995 | NADPH oxidation(GO:0070995) |
| 0.0 | 0.2 | GO:0031340 | positive regulation of vesicle fusion(GO:0031340) |
| 0.0 | 0.2 | GO:0097623 | potassium ion export across plasma membrane(GO:0097623) |
| 0.0 | 0.0 | GO:0030186 | melatonin metabolic process(GO:0030186) |
| 0.0 | 0.1 | GO:0035871 | protein K11-linked deubiquitination(GO:0035871) |
| 0.0 | 0.0 | GO:0042851 | L-alanine metabolic process(GO:0042851) |
| 0.0 | 0.0 | GO:0010808 | positive regulation of synaptic vesicle priming(GO:0010808) |
| 0.0 | 0.2 | GO:0038063 | collagen-activated tyrosine kinase receptor signaling pathway(GO:0038063) |
| 0.0 | 0.2 | GO:0048681 | negative regulation of axon regeneration(GO:0048681) |
Gene overrepresentation in cellular component category:
| Log-likelihood per target | Total log-likelihood | Term | Description |
|---|---|---|---|
| 0.1 | 0.3 | GO:1990421 | subtelomeric heterochromatin(GO:1990421) nuclear subtelomeric heterochromatin(GO:1990707) |
| 0.0 | 0.2 | GO:0042825 | TAP complex(GO:0042825) |
| 0.0 | 0.2 | GO:0005826 | actomyosin contractile ring(GO:0005826) |
| 0.0 | 0.2 | GO:0098642 | collagen type IV trimer(GO:0005587) network-forming collagen trimer(GO:0098642) collagen network(GO:0098645) |
| 0.0 | 0.1 | GO:0031838 | haptoglobin-hemoglobin complex(GO:0031838) |
| 0.0 | 0.1 | GO:0071598 | neuronal ribonucleoprotein granule(GO:0071598) |
| 0.0 | 0.3 | GO:1990124 | messenger ribonucleoprotein complex(GO:1990124) |
| 0.0 | 0.3 | GO:0008074 | guanylate cyclase complex, soluble(GO:0008074) |
| 0.0 | 0.1 | GO:0005579 | membrane attack complex(GO:0005579) |
| 0.0 | 0.2 | GO:0044224 | juxtaparanode region of axon(GO:0044224) |
Gene overrepresentation in molecular function category:
| Log-likelihood per target | Total log-likelihood | Term | Description |
|---|---|---|---|
| 0.1 | 0.2 | GO:0008506 | sucrose:proton symporter activity(GO:0008506) sucrose transmembrane transporter activity(GO:0008515) disaccharide transmembrane transporter activity(GO:0015154) oligosaccharide transmembrane transporter activity(GO:0015157) |
| 0.1 | 0.3 | GO:0015616 | DNA translocase activity(GO:0015616) |
| 0.0 | 0.2 | GO:0015440 | peptide-transporting ATPase activity(GO:0015440) |
| 0.0 | 0.1 | GO:0004874 | aryl hydrocarbon receptor activity(GO:0004874) |
| 0.0 | 0.2 | GO:0005250 | A-type (transient outward) potassium channel activity(GO:0005250) |
| 0.0 | 0.1 | GO:0001069 | regulatory region RNA binding(GO:0001069) |
| 0.0 | 0.2 | GO:0031697 | beta-1 adrenergic receptor binding(GO:0031697) |
| 0.0 | 0.1 | GO:0015183 | L-aspartate transmembrane transporter activity(GO:0015183) |
| 0.0 | 0.1 | GO:0005042 | netrin receptor activity(GO:0005042) |
| 0.0 | 0.1 | GO:0001729 | ceramide kinase activity(GO:0001729) |
| 0.0 | 0.3 | GO:0000900 | translation repressor activity, nucleic acid binding(GO:0000900) |
| 0.0 | 0.0 | GO:0047635 | L-alanine:2-oxoglutarate aminotransferase activity(GO:0004021) alanine-oxo-acid transaminase activity(GO:0047635) |
| 0.0 | 0.2 | GO:0039706 | co-receptor binding(GO:0039706) |
| 0.0 | 0.2 | GO:0030215 | semaphorin receptor binding(GO:0030215) |
| 0.0 | 0.1 | GO:0090555 | phosphatidylethanolamine-translocating ATPase activity(GO:0090555) |
| 0.0 | 0.0 | GO:0008169 | C-methyltransferase activity(GO:0008169) |
| 0.0 | 0.1 | GO:0030492 | hemoglobin binding(GO:0030492) |
| 0.0 | 0.3 | GO:0004383 | guanylate cyclase activity(GO:0004383) |
| 0.0 | 0.1 | GO:0005068 | transmembrane receptor protein tyrosine kinase adaptor activity(GO:0005068) |
| 0.0 | 0.1 | GO:0046912 | transferase activity, transferring acyl groups, acyl groups converted into alkyl on transfer(GO:0046912) |
| 0.0 | 0.1 | GO:0004064 | arylesterase activity(GO:0004064) |
Gene overrepresentation in curated gene sets: canonical pathways category:
| Log-likelihood per target | Total log-likelihood | Term | Description |
|---|---|---|---|
| 0.0 | 0.3 | PID LPA4 PATHWAY | LPA4-mediated signaling events |
Gene overrepresentation in curated gene sets: REACTOME pathways category:
| Log-likelihood per target | Total log-likelihood | Term | Description |
|---|---|---|---|
| 0.0 | 0.3 | REACTOME ADENYLATE CYCLASE ACTIVATING PATHWAY | Genes involved in Adenylate cyclase activating pathway |