Project
GSE49485: Hypoxia transcriptome sequencing of rat brain.
Navigation
Downloads
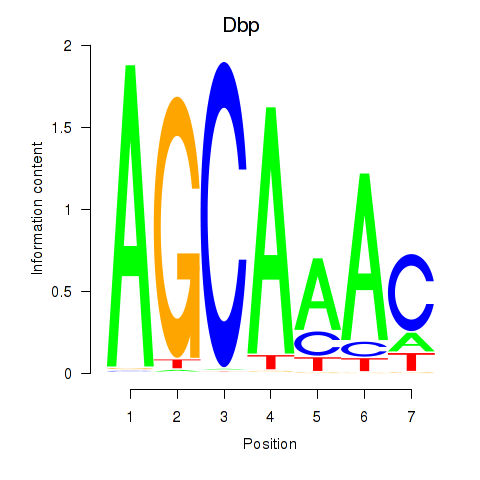
Results for Dbp
Z-value: 0.87
Motif logo
Transcription factors associated with Dbp
| Gene Symbol | Gene ID | Gene Info |
|---|---|---|
|
Dbp
|
ENSRNOG00000021027 | D-box binding PAR bZIP transcription factor |
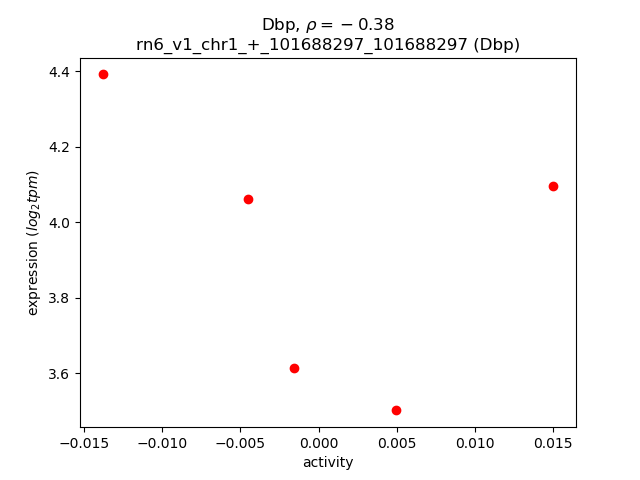
Activity-expression correlation:
| Gene | Promoter | Pearson corr. coef. | P-value | Plot |
|---|---|---|---|---|
| Dbp | rn6_v1_chr1_+_101688297_101688297 | -0.38 | 5.2e-01 | Click! |
Activity profile of Dbp motif
Sorted Z-values of Dbp motif
| Promoter | Log-likelihood | Transcript | Gene | Gene Info |
|---|---|---|---|---|
| chr8_+_40009691 | 0.45 |
ENSRNOT00000042679
|
Vsig2
|
V-set and immunoglobulin domain containing 2 |
| chr12_-_40822159 | 0.42 |
ENSRNOT00000001826
|
Hectd4
|
HECT domain E3 ubiquitin protein ligase 4 |
| chr13_-_111948753 | 0.42 |
ENSRNOT00000048074
|
Hsd11b1
|
hydroxysteroid 11-beta dehydrogenase 1 |
| chr20_-_22459025 | 0.42 |
ENSRNOT00000000792
|
Egr2
|
early growth response 2 |
| chr9_-_28732919 | 0.41 |
ENSRNOT00000083915
|
Rims1
|
regulating synaptic membrane exocytosis 1 |
| chr6_+_52631092 | 0.39 |
ENSRNOT00000014054
|
Atxn7l1
|
ataxin 7-like 1 |
| chr10_-_90240509 | 0.36 |
ENSRNOT00000028407
|
Atxn7l3
|
ataxin 7-like 3 |
| chr17_+_43632397 | 0.32 |
ENSRNOT00000013790
|
Hist1h2ah
|
histone cluster 1, H2ah |
| chr7_+_99954492 | 0.30 |
ENSRNOT00000005885
|
Trib1
|
tribbles pseudokinase 1 |
| chr15_+_51756978 | 0.30 |
ENSRNOT00000024067
|
Egr3
|
early growth response 3 |
| chr7_+_48867664 | 0.29 |
ENSRNOT00000005862
|
Ppfia2
|
PTPRF interacting protein alpha 2 |
| chr13_-_109580271 | 0.29 |
ENSRNOT00000088326
|
Flvcr1
|
feline leukemia virus subgroup C cellular receptor 1 |
| chr1_-_267203986 | 0.28 |
ENSRNOT00000027574
|
Sh3pxd2a
|
SH3 and PX domains 2A |
| chr12_-_46889082 | 0.28 |
ENSRNOT00000001525
|
Pla2g1b
|
phospholipase A2 group IB |
| chr11_+_69484293 | 0.28 |
ENSRNOT00000049292
|
Kalrn
|
kalirin, RhoGEF kinase |
| chr11_-_30051103 | 0.27 |
ENSRNOT00000046486
|
Tiam1
|
T-cell lymphoma invasion and metastasis 1 |
| chr16_+_74237001 | 0.26 |
ENSRNOT00000026039
|
Polb
|
DNA polymerase beta |
| chr1_+_198932870 | 0.26 |
ENSRNOT00000055003
|
Fbrs
|
fibrosin |
| chr9_+_119542328 | 0.25 |
ENSRNOT00000082005
|
Lpin2
|
lipin 2 |
| chr9_+_14560504 | 0.24 |
ENSRNOT00000091532
|
Nfya
|
nuclear transcription factor Y subunit alpha |
| chr10_-_61744976 | 0.23 |
ENSRNOT00000079926
ENSRNOT00000092314 ENSRNOT00000034298 |
Sgsm2
|
small G protein signaling modulator 2 |
| chr11_+_57430166 | 0.22 |
ENSRNOT00000093201
|
Phldb2
|
pleckstrin homology-like domain, family B, member 2 |
| chr3_-_158328881 | 0.22 |
ENSRNOT00000044466
|
Ptprt
|
protein tyrosine phosphatase, receptor type, T |
| chr6_+_126874193 | 0.22 |
ENSRNOT00000011775
|
Unc79
|
unc-79 homolog (C. elegans) |
| chr2_-_173087648 | 0.22 |
ENSRNOT00000091079
|
Iqcj
|
IQ motif containing J |
| chr3_+_80676820 | 0.21 |
ENSRNOT00000084809
|
Ambra1
|
autophagy and beclin 1 regulator 1 |
| chr18_+_30864216 | 0.21 |
ENSRNOT00000027015
|
Pcdhga7
|
protocadherin gamma subfamily A, 7 |
| chr18_-_32670665 | 0.20 |
ENSRNOT00000019409
|
Nr3c1
|
nuclear receptor subfamily 3, group C, member 1 |
| chr14_+_63095720 | 0.19 |
ENSRNOT00000006071
|
Ppargc1a
|
PPARG coactivator 1 alpha |
| chr3_+_175426752 | 0.19 |
ENSRNOT00000085718
|
Ss18l1
|
SS18L1, nBAF chromatin remodeling complex subunit |
| chr7_+_23403891 | 0.18 |
ENSRNOT00000037918
|
Syn3
|
synapsin III |
| chr5_+_43603043 | 0.18 |
ENSRNOT00000009899
|
Epha7
|
Eph receptor A7 |
| chr8_-_39551700 | 0.18 |
ENSRNOT00000091894
ENSRNOT00000076025 |
Pknox2
|
PBX/knotted 1 homeobox 2 |
| chr3_-_120087136 | 0.17 |
ENSRNOT00000078994
|
Kcnip3
|
potassium voltage-gated channel interacting protein 3 |
| chr10_+_74959285 | 0.17 |
ENSRNOT00000010296
|
Rnf43
|
ring finger protein 43 |
| chr7_+_41475163 | 0.17 |
ENSRNOT00000037844
|
Dusp6
|
dual specificity phosphatase 6 |
| chr9_-_52238564 | 0.17 |
ENSRNOT00000005073
|
Col5a2
|
collagen type V alpha 2 chain |
| chr1_+_190671696 | 0.17 |
ENSRNOT00000084934
|
AABR07005633.1
|
|
| chr4_+_168599331 | 0.16 |
ENSRNOT00000086719
|
Crebl2
|
cAMP responsive element binding protein-like 2 |
| chr7_+_3216497 | 0.16 |
ENSRNOT00000008909
|
Mmp19
|
matrix metallopeptidase 19 |
| chr18_-_18079560 | 0.16 |
ENSRNOT00000072093
|
AABR07031533.1
|
|
| chr3_-_120076788 | 0.16 |
ENSRNOT00000047158
|
Kcnip3
|
potassium voltage-gated channel interacting protein 3 |
| chr14_-_84751886 | 0.16 |
ENSRNOT00000078838
|
Mtmr3
|
myotubularin related protein 3 |
| chr20_+_25990656 | 0.15 |
ENSRNOT00000081254
|
Lrrtm3
|
leucine rich repeat transmembrane neuronal 3 |
| chr14_+_39663421 | 0.15 |
ENSRNOT00000003197
|
Gabra2
|
gamma-aminobutyric acid type A receptor alpha2 subunit |
| chr10_-_31359699 | 0.15 |
ENSRNOT00000081280
|
Cyfip2
|
cytoplasmic FMR1 interacting protein 2 |
| chr7_+_80750725 | 0.15 |
ENSRNOT00000079962
|
Oxr1
|
oxidation resistance 1 |
| chr17_-_89881919 | 0.15 |
ENSRNOT00000090982
|
LOC100910957
|
acyl-CoA-binding domain-containing protein 5-like |
| chr4_+_113935492 | 0.14 |
ENSRNOT00000035329
|
LOC103692170
|
coiled-coil domain-containing protein 142 |
| chr14_+_17531398 | 0.14 |
ENSRNOT00000050038
|
Cdkl2
|
cyclin dependent kinase like 2 |
| chr6_-_135939534 | 0.13 |
ENSRNOT00000052237
|
Diras3
|
DIRAS family GTPase 3 |
| chr2_+_66940057 | 0.13 |
ENSRNOT00000043050
|
Cdh9
|
cadherin 9 |
| chr13_+_34483876 | 0.13 |
ENSRNOT00000092998
|
Clasp1
|
cytoplasmic linker associated protein 1 |
| chr2_-_49128501 | 0.13 |
ENSRNOT00000073847
|
Parp8
|
poly (ADP-ribose) polymerase family, member 8 |
| chr7_-_114573900 | 0.13 |
ENSRNOT00000011219
|
Ptk2
|
protein tyrosine kinase 2 |
| chr14_+_84876781 | 0.13 |
ENSRNOT00000065188
|
Ascc2
|
activating signal cointegrator 1 complex subunit 2 |
| chr2_-_210454737 | 0.13 |
ENSRNOT00000079993
|
Ahcyl1
|
adenosylhomocysteinase-like 1 |
| chr14_-_114692764 | 0.12 |
ENSRNOT00000008210
|
Sptbn1
|
spectrin, beta, non-erythrocytic 1 |
| chr3_+_43255567 | 0.12 |
ENSRNOT00000044419
|
Gpd2
|
glycerol-3-phosphate dehydrogenase 2 |
| chr5_+_119727839 | 0.12 |
ENSRNOT00000014354
|
Cachd1
|
cache domain containing 1 |
| chr11_+_42259761 | 0.12 |
ENSRNOT00000047310
|
Epha6
|
Eph receptor A6 |
| chr3_+_116899878 | 0.12 |
ENSRNOT00000090802
ENSRNOT00000066101 |
Sema6d
|
semaphorin 6D |
| chr7_-_123767797 | 0.11 |
ENSRNOT00000012699
|
Tcf20
|
transcription factor 20 |
| chr7_-_143966863 | 0.11 |
ENSRNOT00000018828
|
Sp7
|
Sp7 transcription factor |
| chr2_-_188645196 | 0.11 |
ENSRNOT00000083793
|
Efna3
|
ephrin A3 |
| chr5_+_139394794 | 0.11 |
ENSRNOT00000045954
|
Scmh1
|
sex comb on midleg homolog 1 (Drosophila) |
| chr3_+_8537350 | 0.11 |
ENSRNOT00000079640
|
Sptan1
|
spectrin, alpha, non-erythrocytic 1 |
| chrX_+_39711201 | 0.11 |
ENSRNOT00000080512
ENSRNOT00000009802 |
Cnksr2
|
connector enhancer of kinase suppressor of Ras 2 |
| chr15_-_33250546 | 0.11 |
ENSRNOT00000017857
|
RGD1565222
|
similar to RIKEN cDNA 4931414P19 |
| chr15_-_77736892 | 0.10 |
ENSRNOT00000057924
|
Pcdh9
|
protocadherin 9 |
| chr4_-_68819872 | 0.10 |
ENSRNOT00000033265
ENSRNOT00000081884 |
Clec5a
|
C-type lectin domain family 5, member A |
| chr17_+_35435079 | 0.10 |
ENSRNOT00000074800
|
Exoc2
|
exocyst complex component 2 |
| chr2_-_196526886 | 0.10 |
ENSRNOT00000077325
|
Setdb1
|
SET domain, bifurcated 1 |
| chr17_-_9952898 | 0.10 |
ENSRNOT00000060928
|
Nsd1
|
nuclear receptor binding SET domain protein 1 |
| chr2_-_118989127 | 0.10 |
ENSRNOT00000014871
|
Gnb4
|
G protein subunit beta 4 |
| chr4_+_77554269 | 0.09 |
ENSRNOT00000037248
|
Zfp282
|
zinc finger protein 282 |
| chr4_+_157513414 | 0.09 |
ENSRNOT00000078769
|
Pianp
|
PILR alpha associated neural protein |
| chr8_-_120446455 | 0.09 |
ENSRNOT00000085161
ENSRNOT00000042854 ENSRNOT00000037199 |
Arpp21
|
cAMP regulated phosphoprotein 21 |
| chr15_+_23792931 | 0.09 |
ENSRNOT00000092091
|
Samd4a
|
sterile alpha motif domain containing 4A |
| chr16_+_11032531 | 0.09 |
ENSRNOT00000078390
|
Wapl
|
WAPL cohesin release factor |
| chr1_-_89042176 | 0.09 |
ENSRNOT00000080842
|
Kmt2b
|
lysine methyltransferase 2B |
| chr2_+_50099576 | 0.09 |
ENSRNOT00000089218
|
Hcn1
|
hyperpolarization-activated cyclic nucleotide-gated potassium channel 1 |
| chr4_+_123307624 | 0.09 |
ENSRNOT00000085466
|
Iqsec1
|
IQ motif and Sec7 domain 1 |
| chr15_+_102164751 | 0.09 |
ENSRNOT00000076400
|
Gpc6
|
glypican 6 |
| chr7_-_2972521 | 0.09 |
ENSRNOT00000061995
|
Zc3h10
|
zinc finger CCCH type containing 10 |
| chr18_+_30581530 | 0.09 |
ENSRNOT00000048166
|
Pcdhb20
|
protocadherin beta 20 |
| chr10_+_19366793 | 0.08 |
ENSRNOT00000050610
|
Fam196b
|
family with sequence similarity 196, member B |
| chrX_+_62727755 | 0.08 |
ENSRNOT00000077055
|
Pcyt1b
|
phosphate cytidylyltransferase 1, choline, beta |
| chr6_+_12362813 | 0.08 |
ENSRNOT00000022370
|
Ston1
|
stonin 1 |
| chr1_-_72311856 | 0.07 |
ENSRNOT00000021286
|
Epn1
|
Epsin 1 |
| chr3_-_150064438 | 0.07 |
ENSRNOT00000086933
|
E2f1
|
E2F transcription factor 1 |
| chr10_-_1461216 | 0.07 |
ENSRNOT00000083125
ENSRNOT00000084447 ENSRNOT00000078421 |
Parn
|
poly(A)-specific ribonuclease |
| chr10_+_56512615 | 0.07 |
ENSRNOT00000021883
|
Neurl4
|
neuralized E3 ubiquitin protein ligase 4 |
| chr2_+_104744461 | 0.07 |
ENSRNOT00000016083
ENSRNOT00000082627 |
Cp
|
ceruloplasmin |
| chr6_+_93461713 | 0.07 |
ENSRNOT00000031595
|
Arid4a
|
AT-rich interaction domain 4A |
| chr15_+_344685 | 0.07 |
ENSRNOT00000065542
ENSRNOT00000066928 |
Kcnma1
|
potassium calcium-activated channel subfamily M alpha 1 |
| chr15_+_96821832 | 0.07 |
ENSRNOT00000012785
|
Slitrk5
|
SLIT and NTRK-like family, member 5 |
| chr2_-_189818224 | 0.07 |
ENSRNOT00000020575
|
Ints3
|
integrator complex subunit 3 |
| chr3_+_95707386 | 0.07 |
ENSRNOT00000005882
|
Pax6
|
paired box 6 |
| chr15_-_93307420 | 0.07 |
ENSRNOT00000012195
|
Slitrk1
|
SLIT and NTRK-like family, member 1 |
| chr1_+_266844480 | 0.07 |
ENSRNOT00000027482
|
Taf5
|
TATA-box binding protein associated factor 5 |
| chr2_+_102685513 | 0.06 |
ENSRNOT00000033940
|
Bhlhe22
|
basic helix-loop-helix family, member e22 |
| chr11_-_66807694 | 0.06 |
ENSRNOT00000083152
|
Golgb1
|
golgin B1 |
| chr10_+_34489940 | 0.06 |
ENSRNOT00000085975
|
Zfp62
|
zinc finger protein 62 |
| chrX_+_15988604 | 0.06 |
ENSRNOT00000003800
|
Usp27x
|
ubiquitin specific peptidase 27, X-linked |
| chr1_-_134870255 | 0.06 |
ENSRNOT00000055829
|
Chd2
|
chromodomain helicase DNA binding protein 2 |
| chr7_+_18440742 | 0.06 |
ENSRNOT00000011513
|
Myo1f
|
myosin IF |
| chr8_-_122311431 | 0.06 |
ENSRNOT00000033126
|
Fbxl2
|
F-box and leucine-rich repeat protein 2 |
| chr12_+_7081895 | 0.06 |
ENSRNOT00000047163
|
Hmgb1
|
high mobility group box 1 |
| chr4_+_81311490 | 0.06 |
ENSRNOT00000016265
|
Snx10
|
sorting nexin 10 |
| chr10_-_110182291 | 0.06 |
ENSRNOT00000015178
ENSRNOT00000054936 |
Csnk1d
|
casein kinase 1, delta |
| chr10_+_65767930 | 0.05 |
ENSRNOT00000039954
|
Vtn
|
vitronectin |
| chr8_-_96203677 | 0.05 |
ENSRNOT00000074515
|
Syncrip
|
synaptotagmin binding, cytoplasmic RNA interacting protein |
| chr19_+_37252843 | 0.05 |
ENSRNOT00000021145
|
E2f4
|
E2F transcription factor 4 |
| chr4_-_42188289 | 0.05 |
ENSRNOT00000081688
|
Rbmxl1b
|
RNA binding motif protein, X-linked-like 1B |
| chr6_+_48452369 | 0.05 |
ENSRNOT00000044310
|
Myt1l
|
myelin transcription factor 1-like |
| chr16_+_83824430 | 0.05 |
ENSRNOT00000032918
|
Irs2
|
insulin receptor substrate 2 |
| chr1_-_188895223 | 0.05 |
ENSRNOT00000032796
|
Gpr139
|
G protein-coupled receptor 139 |
| chr2_+_41467064 | 0.05 |
ENSRNOT00000073231
|
AABR07008066.2
|
|
| chr12_-_5822874 | 0.05 |
ENSRNOT00000075920
|
Fry
|
FRY microtubule binding protein |
| chr18_-_29015552 | 0.05 |
ENSRNOT00000028713
|
Nrg2
|
neuregulin 2 |
| chr2_+_41442241 | 0.05 |
ENSRNOT00000067546
|
Pde4d
|
phosphodiesterase 4D |
| chr14_+_34455934 | 0.05 |
ENSRNOT00000085991
ENSRNOT00000002981 |
Clock
|
clock circadian regulator |
| chr8_+_117282390 | 0.05 |
ENSRNOT00000074772
|
Usp19
|
ubiquitin specific peptidase 19 |
| chr2_-_63166509 | 0.05 |
ENSRNOT00000018246
|
Cdh6
|
cadherin 6 |
| chr8_+_44990014 | 0.05 |
ENSRNOT00000044608
|
Hspa8
|
heat shock protein family A (Hsp70) member 8 |
| chr15_+_4240203 | 0.05 |
ENSRNOT00000010178
|
Mss51
|
MSS51 mitochondrial translational activator |
| chr8_+_4440876 | 0.05 |
ENSRNOT00000049325
ENSRNOT00000076529 ENSRNOT00000076748 |
Pdgfd
|
platelet derived growth factor D |
| chr9_-_15582556 | 0.05 |
ENSRNOT00000020516
|
RGD1561662
|
similar to AI661453 protein |
| chr5_+_154489590 | 0.05 |
ENSRNOT00000035788
|
Id3
|
inhibitor of DNA binding 3, HLH protein |
| chr2_+_34546988 | 0.05 |
ENSRNOT00000072577
|
Adamts6
|
ADAM metallopeptidase with thrombospondin type 1 motif, 6 |
| chr4_-_176922424 | 0.05 |
ENSRNOT00000055540
|
Abcc9
|
ATP binding cassette subfamily C member 9 |
| chr7_-_68549763 | 0.05 |
ENSRNOT00000078014
|
Slc16a7
|
solute carrier family 16 member 7 |
| chr10_+_77762900 | 0.05 |
ENSRNOT00000003308
|
Mmd
|
monocyte to macrophage differentiation-associated |
| chr2_-_140334912 | 0.05 |
ENSRNOT00000015067
|
Elf2
|
E74-like factor 2 |
| chr10_+_95770154 | 0.04 |
ENSRNOT00000030300
|
Helz
|
helicase with zinc finger |
| chr2_+_58462949 | 0.04 |
ENSRNOT00000080618
|
Nadk2
|
NAD kinase 2, mitochondrial |
| chr9_+_3896337 | 0.04 |
ENSRNOT00000079166
|
LOC103693189
|
protein tyrosine phosphatase type IVA 1 |
| chr6_-_117972898 | 0.04 |
ENSRNOT00000032968
|
AABR07065265.1
|
|
| chr9_+_100104000 | 0.04 |
ENSRNOT00000074160
|
Capn10
|
calpain 10 |
| chr13_-_67926222 | 0.04 |
ENSRNOT00000076697
|
Hmcn1
|
hemicentin 1 |
| chr2_-_196527127 | 0.04 |
ENSRNOT00000028709
|
Setdb1
|
SET domain, bifurcated 1 |
| chr9_+_18564927 | 0.04 |
ENSRNOT00000061014
|
Runx2
|
runt-related transcription factor 2 |
| chr6_+_22696397 | 0.04 |
ENSRNOT00000011630
|
Alk
|
anaplastic lymphoma receptor tyrosine kinase |
| chr1_+_260798239 | 0.04 |
ENSRNOT00000036791
|
Lcor
|
ligand dependent nuclear receptor corepressor |
| chrX_+_32745873 | 0.04 |
ENSRNOT00000005559
|
Grpr
|
gastrin releasing peptide receptor |
| chr11_-_83867203 | 0.04 |
ENSRNOT00000002394
|
Chrd
|
chordin |
| chr15_+_33074441 | 0.04 |
ENSRNOT00000075610
|
Mmp14
|
matrix metallopeptidase 14 |
| chr5_-_146787676 | 0.04 |
ENSRNOT00000008887
|
Zscan20
|
zinc finger and SCAN domain containing 20 |
| chr20_+_7330250 | 0.04 |
ENSRNOT00000090993
|
LOC499407
|
LRRGT00097 |
| chr7_-_24667301 | 0.03 |
ENSRNOT00000009154
|
Tmem263
|
transmembrane protein 263 |
| chr11_+_57108956 | 0.03 |
ENSRNOT00000035485
|
Cd96
|
CD96 molecule |
| chr9_-_119190698 | 0.03 |
ENSRNOT00000021534
|
Tgif1
|
TGFB-induced factor homeobox 1 |
| chr3_+_160231914 | 0.03 |
ENSRNOT00000014411
|
Kcnk15
|
potassium two pore domain channel subfamily K member 15 |
| chr19_-_43528851 | 0.03 |
ENSRNOT00000036972
|
Mlkl
|
mixed lineage kinase domain like pseudokinase |
| chrX_+_112270986 | 0.03 |
ENSRNOT00000091441
ENSRNOT00000082652 |
Vsig1
|
V-set and immunoglobulin domain containing 1 |
| chr20_+_25990304 | 0.03 |
ENSRNOT00000033980
|
Lrrtm3
|
leucine rich repeat transmembrane neuronal 3 |
| chr5_+_60850852 | 0.03 |
ENSRNOT00000016720
|
Trmt10b
|
tRNA methyltransferase 10B |
| chr12_-_38274036 | 0.03 |
ENSRNOT00000063990
|
Kntc1
|
kinetochore associated 1 |
| chrX_+_84064427 | 0.03 |
ENSRNOT00000046364
|
Zfp711
|
zinc finger protein 711 |
| chr16_-_6405117 | 0.03 |
ENSRNOT00000047737
|
Cacna1d
|
calcium voltage-gated channel subunit alpha1 D |
| chr2_-_29121104 | 0.03 |
ENSRNOT00000020543
|
Tnpo1
|
transportin 1 |
| chr14_+_2050483 | 0.02 |
ENSRNOT00000000047
|
Slc26a1
|
solute carrier family 26 member 1 |
| chr13_-_51201331 | 0.02 |
ENSRNOT00000005272
ENSRNOT00000078990 |
Tmem183a
|
transmembrane protein 183A |
| chr19_+_9895121 | 0.02 |
ENSRNOT00000033953
|
Prss54
|
protease, serine, 54 |
| chr4_-_180505916 | 0.02 |
ENSRNOT00000086465
|
AABR07062512.1
|
|
| chr7_+_60099120 | 0.02 |
ENSRNOT00000007338
|
LOC100911101
|
leucine-rich repeat-containing protein 10-like |
| chr1_+_23409408 | 0.02 |
ENSRNOT00000022362
|
Eya4
|
EYA transcriptional coactivator and phosphatase 4 |
| chr1_+_265157379 | 0.02 |
ENSRNOT00000022426
|
Btrc
|
beta-transducin repeat containing E3 ubiquitin protein ligase |
| chr16_-_6404578 | 0.02 |
ENSRNOT00000051371
|
Cacna1d
|
calcium voltage-gated channel subunit alpha1 D |
| chr7_+_12820840 | 0.02 |
ENSRNOT00000012317
|
Rnf126
|
ring finger protein 126 |
| chr2_+_54191538 | 0.01 |
ENSRNOT00000019524
|
Plcxd3
|
phosphatidylinositol-specific phospholipase C, X domain containing 3 |
| chr5_-_12526962 | 0.01 |
ENSRNOT00000092104
|
St18
|
suppression of tumorigenicity 18 |
| chr13_-_1946508 | 0.01 |
ENSRNOT00000043890
|
Dsel
|
dermatan sulfate epimerase-like |
| chr4_+_102426224 | 0.01 |
ENSRNOT00000073768
|
LOC103694107
|
NADH dehydrogenase [ubiquinone] 1 beta subcomplex subunit 3 pseudogene |
| chr7_+_60087429 | 0.01 |
ENSRNOT00000073117
|
Lrrc10
|
leucine-rich repeat-containing 10 |
| chr3_+_8643936 | 0.01 |
ENSRNOT00000077797
|
Set
|
SET nuclear proto-oncogene |
| chr13_+_60619309 | 0.01 |
ENSRNOT00000082129
|
AABR07021204.1
|
|
| chr17_-_80807181 | 0.01 |
ENSRNOT00000040052
ENSRNOT00000090064 |
Cubn
|
cubilin |
| chr8_+_87211819 | 0.01 |
ENSRNOT00000086093
|
LOC100363289
|
LRRGT00022-like |
| chr17_+_34704616 | 0.01 |
ENSRNOT00000090706
ENSRNOT00000083674 ENSRNOT00000077110 |
Exoc2
|
exocyst complex component 2 |
| chr16_+_71787966 | 0.01 |
ENSRNOT00000080084
|
Htra4
|
HtrA serine peptidase 4 |
| chr5_-_117612123 | 0.01 |
ENSRNOT00000065112
|
Dock7
|
dedicator of cytokinesis 7 |
| chr5_-_150506871 | 0.01 |
ENSRNOT00000086131
|
Trnau1ap
|
tRNA selenocysteine 1 associated protein 1 |
| chr2_-_154542557 | 0.01 |
ENSRNOT00000013392
|
Slc33a1
|
solute carrier family 33 member 1 |
| chr6_+_137997335 | 0.01 |
ENSRNOT00000006872
|
Tmem121
|
transmembrane protein 121 |
| chr2_-_188736462 | 0.01 |
ENSRNOT00000028030
|
Flad1
|
flavin adenine dinucleotide synthetase 1 |
| chr15_-_60743064 | 0.01 |
ENSRNOT00000013333
|
Akap11
|
A-kinase anchoring protein 11 |
| chr20_-_27757149 | 0.01 |
ENSRNOT00000088287
|
Dse
|
dermatan sulfate epimerase |
| chr15_+_47373120 | 0.01 |
ENSRNOT00000070815
|
Rp1l1
|
RP1 like 1 |
| chr18_+_61258911 | 0.00 |
ENSRNOT00000082403
|
Zfp532
|
zinc finger protein 532 |
| chr19_+_46733633 | 0.00 |
ENSRNOT00000016307
|
Clec3a
|
C-type lectin domain family 3, member A |
| chr16_+_69089955 | 0.00 |
ENSRNOT00000017324
|
Brf2
|
BRF2, RNA polymerase III transcription initiation factor 50 subunit |
| chr1_-_7443863 | 0.00 |
ENSRNOT00000088558
|
Phactr2
|
phosphatase and actin regulator 2 |
| chr17_-_27969433 | 0.00 |
ENSRNOT00000073967
|
Nrn1
|
neuritin 1 |
| chr18_+_61261418 | 0.00 |
ENSRNOT00000064250
|
Zfp532
|
zinc finger protein 532 |
| chr1_-_82610350 | 0.00 |
ENSRNOT00000028177
|
Cyp2s1
|
cytochrome P450, family 2, subfamily s, polypeptide 1 |
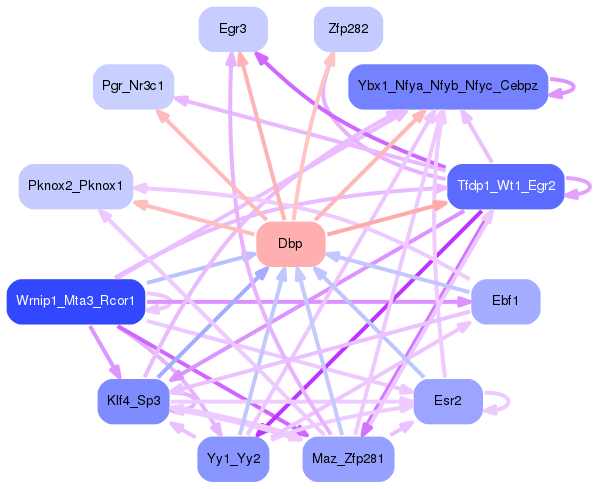
Network of associatons between targets according to the STRING database.

First level regulatory network of Dbp
Gene Ontology Analysis
Gene overrepresentation in biological process category:
| Log-likelihood per target | Total log-likelihood | Term | Description |
|---|---|---|---|
| 0.1 | 0.4 | GO:0006713 | glucocorticoid catabolic process(GO:0006713) |
| 0.1 | 0.4 | GO:0031632 | positive regulation of synaptic vesicle fusion to presynaptic membrane(GO:0031632) |
| 0.1 | 0.5 | GO:0021593 | rhombomere morphogenesis(GO:0021593) |
| 0.1 | 0.5 | GO:0098989 | NMDA selective glutamate receptor signaling pathway(GO:0098989) |
| 0.1 | 0.2 | GO:0034499 | late endosome to Golgi transport(GO:0034499) |
| 0.1 | 0.3 | GO:0045658 | regulation of neutrophil differentiation(GO:0045658) |
| 0.1 | 0.2 | GO:0071250 | cellular response to nitrite(GO:0071250) response to nitrite(GO:0080033) response to resveratrol(GO:1904638) regulation of progesterone biosynthetic process(GO:2000182) |
| 0.1 | 0.3 | GO:0051964 | negative regulation of synapse assembly(GO:0051964) |
| 0.1 | 0.2 | GO:1900170 | negative regulation of glucocorticoid mediated signaling pathway(GO:1900170) |
| 0.0 | 0.3 | GO:0072675 | osteoclast fusion(GO:0072675) |
| 0.0 | 0.3 | GO:0006287 | base-excision repair, gap-filling(GO:0006287) |
| 0.0 | 0.3 | GO:1903224 | regulation of endodermal cell differentiation(GO:1903224) |
| 0.0 | 0.4 | GO:1903690 | negative regulation of wound healing, spreading of epidermal cells(GO:1903690) |
| 0.0 | 0.1 | GO:0090309 | positive regulation of methylation-dependent chromatin silencing(GO:0090309) |
| 0.0 | 0.3 | GO:0015886 | heme transport(GO:0015886) |
| 0.0 | 0.1 | GO:0071921 | establishment of sister chromatid cohesion(GO:0034085) cohesin loading(GO:0071921) regulation of cohesin loading(GO:0071922) |
| 0.0 | 0.1 | GO:0000414 | regulation of histone H3-K36 methylation(GO:0000414) |
| 0.0 | 0.1 | GO:0019563 | glycerol catabolic process(GO:0019563) |
| 0.0 | 0.1 | GO:0060082 | eye blink reflex(GO:0060082) |
| 0.0 | 0.1 | GO:1902630 | regulation of membrane hyperpolarization(GO:1902630) |
| 0.0 | 0.3 | GO:0046643 | positive regulation of T cell differentiation in thymus(GO:0033089) regulation of gamma-delta T cell differentiation(GO:0045586) regulation of gamma-delta T cell activation(GO:0046643) positive regulation of thymocyte aggregation(GO:2000400) |
| 0.0 | 0.1 | GO:0035711 | T cell mediated immune response to tumor cell(GO:0002424) regulation of T cell mediated immune response to tumor cell(GO:0002840) negative regulation of RNA polymerase II transcriptional preinitiation complex assembly(GO:0017055) regulation of mismatch repair(GO:0032423) positive regulation of toll-like receptor 9 signaling pathway(GO:0034165) T-helper 1 cell activation(GO:0035711) positive regulation of glycogen catabolic process(GO:0045819) negative regulation of apoptotic cell clearance(GO:2000426) |
| 0.0 | 0.2 | GO:0051388 | positive regulation of neurotrophin TRK receptor signaling pathway(GO:0051388) |
| 0.0 | 0.1 | GO:0071930 | negative regulation of transcription involved in G1/S transition of mitotic cell cycle(GO:0071930) |
| 0.0 | 0.1 | GO:0033353 | S-adenosylmethionine cycle(GO:0033353) |
| 0.0 | 0.3 | GO:0002227 | innate immune response in mucosa(GO:0002227) |
| 0.0 | 0.1 | GO:0086024 | adrenergic receptor signaling pathway involved in positive regulation of heart rate(GO:0086024) |
| 0.0 | 0.4 | GO:0016578 | histone deubiquitination(GO:0016578) |
| 0.0 | 0.0 | GO:0061740 | protein targeting to lysosome involved in chaperone-mediated autophagy(GO:0061740) regulation of lysosomal membrane permeability(GO:0097213) positive regulation of lysosomal membrane permeability(GO:0097214) |
| 0.0 | 0.0 | GO:0035696 | monocyte extravasation(GO:0035696) |
| 0.0 | 0.2 | GO:1902993 | positive regulation of beta-amyloid formation(GO:1902004) positive regulation of amyloid precursor protein catabolic process(GO:1902993) |
| 0.0 | 0.1 | GO:1902083 | negative regulation of peptidyl-cysteine S-nitrosylation(GO:1902083) |
| 0.0 | 0.2 | GO:0001554 | luteolysis(GO:0001554) |
| 0.0 | 0.1 | GO:0001927 | exocyst assembly(GO:0001927) entry of bacterium into host cell(GO:0035635) regulation of entry of bacterium into host cell(GO:2000535) |
| 0.0 | 0.0 | GO:0090648 | response to environmental enrichment(GO:0090648) |
| 0.0 | 0.1 | GO:0010748 | negative regulation of plasma membrane long-chain fatty acid transport(GO:0010748) |
| 0.0 | 0.0 | GO:0031989 | bombesin receptor signaling pathway(GO:0031989) |
| 0.0 | 0.1 | GO:1904428 | negative regulation of tubulin deacetylation(GO:1904428) |
| 0.0 | 0.3 | GO:0048266 | behavioral response to pain(GO:0048266) |
| 0.0 | 0.1 | GO:1900042 | positive regulation of interleukin-2 secretion(GO:1900042) |
Gene overrepresentation in cellular component category:
| Log-likelihood per target | Total log-likelihood | Term | Description |
|---|---|---|---|
| 0.1 | 0.4 | GO:0098831 | presynaptic active zone cytoplasmic component(GO:0098831) |
| 0.0 | 0.2 | GO:0005588 | collagen type V trimer(GO:0005588) |
| 0.0 | 0.2 | GO:0016602 | CCAAT-binding factor complex(GO:0016602) |
| 0.0 | 0.1 | GO:0031592 | centrosomal corona(GO:0031592) |
| 0.0 | 0.1 | GO:0098855 | HCN channel complex(GO:0098855) |
| 0.0 | 0.4 | GO:0000124 | SAGA complex(GO:0000124) |
| 0.0 | 0.2 | GO:0032437 | cuticular plate(GO:0032437) |
| 0.0 | 0.1 | GO:0009331 | glycerol-3-phosphate dehydrogenase complex(GO:0009331) |
| 0.0 | 0.3 | GO:0060091 | kinocilium(GO:0060091) |
| 0.0 | 0.2 | GO:0045180 | basal cortex(GO:0045180) |
| 0.0 | 0.1 | GO:0098888 | extrinsic component of presynaptic membrane(GO:0098888) |
| 0.0 | 0.1 | GO:0070876 | SOSS complex(GO:0070876) |
| 0.0 | 0.0 | GO:1990836 | lysosomal matrix(GO:1990836) |
| 0.0 | 0.2 | GO:0071565 | nBAF complex(GO:0071565) |
| 0.0 | 0.1 | GO:0035189 | Rb-E2F complex(GO:0035189) |
| 0.0 | 0.0 | GO:0008282 | ATP-sensitive potassium channel complex(GO:0008282) |
| 0.0 | 0.1 | GO:0005726 | perichromatin fibrils(GO:0005726) |
Gene overrepresentation in molecular function category:
| Log-likelihood per target | Total log-likelihood | Term | Description |
|---|---|---|---|
| 0.1 | 0.4 | GO:0003845 | 11-beta-hydroxysteroid dehydrogenase [NAD(P)] activity(GO:0003845) |
| 0.0 | 0.1 | GO:0052590 | sn-glycerol-3-phosphate:ubiquinone oxidoreductase activity(GO:0052590) sn-glycerol-3-phosphate:ubiquinone-8 oxidoreductase activity(GO:0052591) |
| 0.0 | 0.1 | GO:0042799 | histone methyltransferase activity (H4-K20 specific)(GO:0042799) |
| 0.0 | 0.3 | GO:0015232 | heme transporter activity(GO:0015232) |
| 0.0 | 0.1 | GO:0016802 | adenosylhomocysteinase activity(GO:0004013) trialkylsulfonium hydrolase activity(GO:0016802) |
| 0.0 | 0.2 | GO:0052629 | phosphatidylinositol-3,5-bisphosphate 3-phosphatase activity(GO:0052629) |
| 0.0 | 0.3 | GO:0047498 | calcium-dependent phospholipase A2 activity(GO:0047498) |
| 0.0 | 0.2 | GO:0008503 | benzodiazepine receptor activity(GO:0008503) |
| 0.0 | 0.3 | GO:0016176 | superoxide-generating NADPH oxidase activator activity(GO:0016176) |
| 0.0 | 0.5 | GO:0030676 | Rac guanyl-nucleotide exchange factor activity(GO:0030676) |
| 0.0 | 0.2 | GO:0005004 | GPI-linked ephrin receptor activity(GO:0005004) |
| 0.0 | 0.2 | GO:1990239 | steroid hormone binding(GO:1990239) |
| 0.0 | 0.5 | GO:0071837 | HMG box domain binding(GO:0071837) |
| 0.0 | 0.2 | GO:0045294 | alpha-catenin binding(GO:0045294) delta-catenin binding(GO:0070097) |
| 0.0 | 0.1 | GO:0060072 | large conductance calcium-activated potassium channel activity(GO:0060072) |
| 0.0 | 0.1 | GO:0004105 | choline-phosphate cytidylyltransferase activity(GO:0004105) |
| 0.0 | 0.0 | GO:0008281 | sulfonylurea receptor activity(GO:0008281) |
| 0.0 | 0.3 | GO:0055106 | ubiquitin-protein transferase regulator activity(GO:0055106) |
| 0.0 | 0.3 | GO:0008195 | phosphatidate phosphatase activity(GO:0008195) |
| 0.0 | 0.1 | GO:0043515 | kinetochore binding(GO:0043515) |
| 0.0 | 0.0 | GO:0004946 | bombesin receptor activity(GO:0004946) |
| 0.0 | 0.1 | GO:0005006 | epidermal growth factor-activated receptor activity(GO:0005006) |
| 0.0 | 0.0 | GO:0031686 | A1 adenosine receptor binding(GO:0031686) |
| 0.0 | 0.4 | GO:1990841 | promoter-specific chromatin binding(GO:1990841) |
| 0.0 | 0.1 | GO:0004322 | ferroxidase activity(GO:0004322) oxidoreductase activity, oxidizing metal ions, oxygen as acceptor(GO:0016724) |
| 0.0 | 0.1 | GO:0005003 | ephrin receptor activity(GO:0005003) |
| 0.0 | 0.2 | GO:0017017 | MAP kinase tyrosine/serine/threonine phosphatase activity(GO:0017017) |
| 0.0 | 0.1 | GO:0010858 | calcium-dependent protein kinase regulator activity(GO:0010858) |
| 0.0 | 0.1 | GO:1990380 | Lys48-specific deubiquitinase activity(GO:1990380) |
| 0.0 | 0.1 | GO:0008432 | JUN kinase binding(GO:0008432) |
Gene overrepresentation in curated gene sets: canonical pathways category:
| Log-likelihood per target | Total log-likelihood | Term | Description |
|---|---|---|---|
| 0.0 | 0.5 | PID ARF6 DOWNSTREAM PATHWAY | Arf6 downstream pathway |
| 0.0 | 0.7 | ST DIFFERENTIATION PATHWAY IN PC12 CELLS | Differentiation Pathway in PC12 Cells; this is a specific case of PAC1 Receptor Pathway. |
| 0.0 | 0.4 | PID EPHA FWDPATHWAY | EPHA forward signaling |
Gene overrepresentation in curated gene sets: REACTOME pathways category:
| Log-likelihood per target | Total log-likelihood | Term | Description |
|---|---|---|---|
| 0.0 | 0.6 | REACTOME DOPAMINE NEUROTRANSMITTER RELEASE CYCLE | Genes involved in Dopamine Neurotransmitter Release Cycle |
| 0.0 | 0.2 | REACTOME ACTIVATION OF CHAPERONE GENES BY ATF6 ALPHA | Genes involved in Activation of Chaperone Genes by ATF6-alpha |
| 0.0 | 0.3 | REACTOME BASE FREE SUGAR PHOSPHATE REMOVAL VIA THE SINGLE NUCLEOTIDE REPLACEMENT PATHWAY | Genes involved in Base-free sugar-phosphate removal via the single-nucleotide replacement pathway |
| 0.0 | 0.3 | REACTOME ACYL CHAIN REMODELLING OF PI | Genes involved in Acyl chain remodelling of PI |
| 0.0 | 0.3 | REACTOME SYNTHESIS OF PE | Genes involved in Synthesis of PE |
| 0.0 | 0.4 | REACTOME STEROID HORMONES | Genes involved in Steroid hormones |
| 0.0 | 0.2 | REACTOME ERKS ARE INACTIVATED | Genes involved in ERKs are inactivated |
| 0.0 | 0.4 | REACTOME BMAL1 CLOCK NPAS2 ACTIVATES CIRCADIAN EXPRESSION | Genes involved in BMAL1:CLOCK/NPAS2 Activates Circadian Expression |