Project
GSE49485: Hypoxia transcriptome sequencing of rat brain.
Navigation
Downloads
Results for Cpeb1
Z-value: 0.98
Motif logo
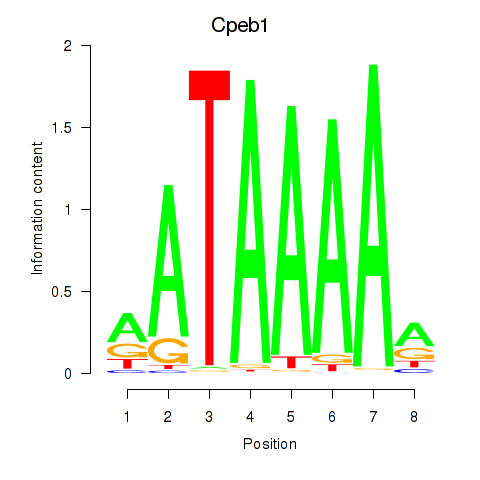
Transcription factors associated with Cpeb1
| Gene Symbol | Gene ID | Gene Info |
|---|---|---|
|
Cpeb1
|
ENSRNOG00000019161 | cytoplasmic polyadenylation element binding protein 1 |
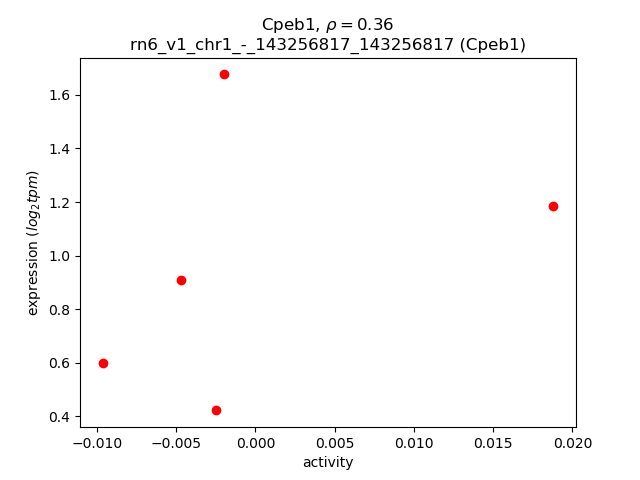
Activity-expression correlation:
| Gene | Promoter | Pearson corr. coef. | P-value | Plot |
|---|---|---|---|---|
| Cpeb1 | rn6_v1_chr1_-_143256817_143256817 | 0.36 | 5.5e-01 | Click! |
Activity profile of Cpeb1 motif
Sorted Z-values of Cpeb1 motif
| Promoter | Log-likelihood | Transcript | Gene | Gene Info |
|---|---|---|---|---|
| chr6_+_146784915 | 0.63 |
ENSRNOT00000008362
|
Sp8
|
Sp8 transcription factor |
| chr10_-_16046033 | 0.54 |
ENSRNOT00000089460
|
Cpeb4
|
cytoplasmic polyadenylation element binding protein 4 |
| chr10_-_16045835 | 0.41 |
ENSRNOT00000064832
|
Cpeb4
|
cytoplasmic polyadenylation element binding protein 4 |
| chr9_-_52238564 | 0.40 |
ENSRNOT00000005073
|
Col5a2
|
collagen type V alpha 2 chain |
| chr20_-_5064469 | 0.39 |
ENSRNOT00000001120
|
Ly6g6d
|
lymphocyte antigen 6 complex, locus G6D |
| chr18_-_77579969 | 0.35 |
ENSRNOT00000034896
|
Sall3
|
spalt-like transcription factor 3 |
| chr15_-_48284548 | 0.34 |
ENSRNOT00000038336
|
Hmbox1
|
homeobox containing 1 |
| chrX_+_13117239 | 0.32 |
ENSRNOT00000088998
|
AABR07037112.1
|
|
| chr14_+_104250617 | 0.31 |
ENSRNOT00000079874
|
Spred2
|
sprouty-related, EVH1 domain containing 2 |
| chr19_+_23389375 | 0.30 |
ENSRNOT00000018629
|
Sall1
|
spalt-like transcription factor 1 |
| chr3_+_100786862 | 0.30 |
ENSRNOT00000080190
|
Bdnf
|
brain-derived neurotrophic factor |
| chr2_+_27905535 | 0.28 |
ENSRNOT00000022120
|
Fam169a
|
family with sequence similarity 169, member A |
| chr15_+_27933211 | 0.28 |
ENSRNOT00000013619
|
Rnase10
|
ribonuclease A family member 10 |
| chr7_+_34533543 | 0.28 |
ENSRNOT00000007412
ENSRNOT00000084185 |
Ntn4
|
netrin 4 |
| chr10_+_77537340 | 0.27 |
ENSRNOT00000003297
|
Tmem100
|
transmembrane protein 100 |
| chr3_-_36660758 | 0.27 |
ENSRNOT00000006111
|
Rnd3
|
Rho family GTPase 3 |
| chr5_+_25168295 | 0.26 |
ENSRNOT00000020245
|
Fsbp
|
fibrinogen silencer binding protein |
| chr10_-_64657089 | 0.26 |
ENSRNOT00000080703
|
Abr
|
active BCR-related |
| chr13_-_86671515 | 0.26 |
ENSRNOT00000082869
|
AABR07021704.1
|
|
| chr3_+_47677720 | 0.26 |
ENSRNOT00000065340
|
Tbr1
|
T-box, brain, 1 |
| chr1_-_166912524 | 0.25 |
ENSRNOT00000092952
|
Inppl1
|
inositol polyphosphate phosphatase-like 1 |
| chr10_+_35343189 | 0.25 |
ENSRNOT00000083688
|
Mapk9
|
mitogen-activated protein kinase 9 |
| chr20_+_5094468 | 0.24 |
ENSRNOT00000078576
|
Abhd16a
|
abhydrolase domain containing 16A |
| chr15_+_37171052 | 0.24 |
ENSRNOT00000011684
|
Zmym2
|
zinc finger MYM-type containing 2 |
| chr11_-_46369577 | 0.24 |
ENSRNOT00000049859
ENSRNOT00000047817 ENSRNOT00000002220 ENSRNOT00000002223 ENSRNOT00000063864 ENSRNOT00000070871 ENSRNOT00000072140 |
Abi3bp
|
ABI family member 3 binding protein |
| chr2_+_136993208 | 0.23 |
ENSRNOT00000040187
ENSRNOT00000066542 |
Pcdh10
|
protocadherin 10 |
| chrX_-_26376467 | 0.23 |
ENSRNOT00000051655
ENSRNOT00000036502 |
Arhgap6
|
Rho GTPase activating protein 6 |
| chr4_-_108717309 | 0.22 |
ENSRNOT00000085062
|
AABR07061178.1
|
|
| chr20_-_47910375 | 0.22 |
ENSRNOT00000000348
|
Sobp
|
sine oculis binding protein homolog |
| chr18_-_18079560 | 0.22 |
ENSRNOT00000072093
|
AABR07031533.1
|
|
| chr4_+_168615890 | 0.22 |
ENSRNOT00000009324
|
Crebl2
|
cAMP responsive element binding protein-like 2 |
| chr10_-_87136026 | 0.21 |
ENSRNOT00000014230
ENSRNOT00000083233 |
Smarce1
|
SWI/SNF related, matrix associated, actin dependent regulator of chromatin, subfamily e, member 1 |
| chr2_+_216863428 | 0.21 |
ENSRNOT00000068413
|
Col11a1
|
collagen type XI alpha 1 chain |
| chr7_-_118792625 | 0.21 |
ENSRNOT00000007398
|
Myh9
|
myosin, heavy chain 9 |
| chr2_+_22910236 | 0.20 |
ENSRNOT00000078266
|
Homer1
|
homer scaffolding protein 1 |
| chr18_+_48853418 | 0.20 |
ENSRNOT00000022792
|
Csnk1g3
|
casein kinase 1, gamma 3 |
| chr2_-_187771857 | 0.19 |
ENSRNOT00000092517
ENSRNOT00000035383 |
Pmf1
|
polyamine-modulated factor 1 |
| chrX_+_76786466 | 0.19 |
ENSRNOT00000090665
|
Fgf16
|
fibroblast growth factor 16 |
| chr19_-_29016521 | 0.19 |
ENSRNOT00000049860
|
LOC685160
|
similar to spermatogenesis associated glutamate (E)-rich protein 4d |
| chr1_+_282134981 | 0.18 |
ENSRNOT00000036203
|
Nanos1
|
nanos C2HC-type zinc finger 1 |
| chr2_+_207930796 | 0.18 |
ENSRNOT00000047827
|
Kcnd3
|
potassium voltage-gated channel subfamily D member 3 |
| chr7_+_64769089 | 0.18 |
ENSRNOT00000088861
|
Grip1
|
glutamate receptor interacting protein 1 |
| chr3_+_150135821 | 0.17 |
ENSRNOT00000047286
|
Zfp341
|
zinc finger protein 341 |
| chr2_-_31753528 | 0.17 |
ENSRNOT00000075057
|
Pik3r1
|
phosphoinositide-3-kinase regulatory subunit 1 |
| chr16_-_9658484 | 0.17 |
ENSRNOT00000065216
|
Mapk8
|
mitogen-activated protein kinase 8 |
| chr2_+_22909569 | 0.17 |
ENSRNOT00000073871
|
Homer1
|
homer scaffolding protein 1 |
| chr14_+_104821215 | 0.17 |
ENSRNOT00000007162
|
Sertad2
|
SERTA domain containing 2 |
| chr7_-_116161708 | 0.17 |
ENSRNOT00000068707
|
Cyp11b2
|
cytochrome P450, family 11, subfamily b, polypeptide 2 |
| chr5_+_150787043 | 0.16 |
ENSRNOT00000082945
|
Eya3
|
EYA transcriptional coactivator and phosphatase 3 |
| chr2_-_138833933 | 0.16 |
ENSRNOT00000013343
|
Pcdh18
|
protocadherin 18 |
| chr13_+_57243877 | 0.16 |
ENSRNOT00000083693
|
Kcnt2
|
potassium sodium-activated channel subfamily T member 2 |
| chr15_-_43542939 | 0.16 |
ENSRNOT00000012996
|
Dpysl2
|
dihydropyrimidinase-like 2 |
| chr7_+_64768742 | 0.16 |
ENSRNOT00000005545
|
Grip1
|
glutamate receptor interacting protein 1 |
| chr3_+_151126591 | 0.16 |
ENSRNOT00000025859
|
Myh7b
|
myosin heavy chain 7B |
| chr9_-_79898912 | 0.16 |
ENSRNOT00000022076
|
March4
|
membrane associated ring-CH-type finger 4 |
| chr3_+_72460889 | 0.16 |
ENSRNOT00000012209
|
Tnks1bp1
|
tankyrase 1 binding protein 1 |
| chr6_-_8344574 | 0.16 |
ENSRNOT00000009660
|
Prepl
|
prolyl endopeptidase-like |
| chr9_+_2190915 | 0.15 |
ENSRNOT00000077417
|
Satb1
|
SATB homeobox 1 |
| chr7_-_116255167 | 0.15 |
ENSRNOT00000038109
ENSRNOT00000041774 |
Cyp11b2
|
cytochrome P450, family 11, subfamily b, polypeptide 2 |
| chr19_-_19315357 | 0.15 |
ENSRNOT00000018888
|
Cyld
|
CYLD lysine 63 deubiquitinase |
| chr9_+_73529612 | 0.15 |
ENSRNOT00000032430
|
Unc80
|
unc-80 homolog, NALCN activator |
| chr15_-_2966576 | 0.15 |
ENSRNOT00000070893
ENSRNOT00000017383 |
Kat6b
|
lysine acetyltransferase 6B |
| chr10_-_38985466 | 0.15 |
ENSRNOT00000010121
|
Il13
|
interleukin 13 |
| chr8_+_45797315 | 0.15 |
ENSRNOT00000059997
|
AABR07070046.1
|
|
| chr3_+_100787449 | 0.15 |
ENSRNOT00000078543
|
Bdnf
|
brain-derived neurotrophic factor |
| chrX_-_152642531 | 0.14 |
ENSRNOT00000085037
|
Gabra3
|
gamma-aminobutyric acid type A receptor alpha3 subunit |
| chr13_-_26769374 | 0.14 |
ENSRNOT00000003768
|
Bcl2
|
BCL2, apoptosis regulator |
| chr9_+_94324793 | 0.14 |
ENSRNOT00000092493
|
Eif4e2
|
eukaryotic translation initiation factor 4E family member 2 |
| chrX_+_156655960 | 0.14 |
ENSRNOT00000085723
|
Mecp2
|
methyl CpG binding protein 2 |
| chr2_+_201289357 | 0.14 |
ENSRNOT00000067358
|
Tbx15
|
T-box 15 |
| chr5_+_58855773 | 0.14 |
ENSRNOT00000072869
|
Rusc2
|
RUN and SH3 domain containing 2 |
| chr3_+_98297554 | 0.14 |
ENSRNOT00000006524
|
Kcna4
|
potassium voltage-gated channel subfamily A member 4 |
| chr17_-_77527894 | 0.14 |
ENSRNOT00000032173
|
Bend7
|
BEN domain containing 7 |
| chr10_+_14136883 | 0.14 |
ENSRNOT00000082295
|
AC115181.1
|
|
| chr1_+_57692836 | 0.14 |
ENSRNOT00000083968
ENSRNOT00000019358 |
Chd1
|
chromodomain helicase DNA binding protein 1 |
| chr5_+_2278357 | 0.14 |
ENSRNOT00000066590
|
Stau2
|
staufen double-stranded RNA binding protein 2 |
| chr5_+_139394794 | 0.14 |
ENSRNOT00000045954
|
Scmh1
|
sex comb on midleg homolog 1 (Drosophila) |
| chr2_+_198388809 | 0.14 |
ENSRNOT00000083087
|
Hist2h2aa3
|
histone cluster 2, H2aa3 |
| chr3_+_137154086 | 0.13 |
ENSRNOT00000034252
|
Otor
|
otoraplin |
| chr1_-_163554839 | 0.13 |
ENSRNOT00000081509
|
Emsy
|
EMSY BRCA2-interacting transcriptional repressor |
| chr13_-_89565813 | 0.13 |
ENSRNOT00000004347
|
Pcp4l1
|
Purkinje cell protein 4-like 1 |
| chr5_-_136002900 | 0.13 |
ENSRNOT00000025197
|
Plk3
|
polo-like kinase 3 |
| chr12_+_48403797 | 0.13 |
ENSRNOT00000044751
|
Ssh1
|
slingshot protein phosphatase 1 |
| chr8_-_78397123 | 0.13 |
ENSRNOT00000087270
ENSRNOT00000084925 |
Tcf12
|
transcription factor 12 |
| chr4_+_3959640 | 0.13 |
ENSRNOT00000009439
|
Paxip1
|
PAX interacting protein 1 |
| chr2_-_198382190 | 0.13 |
ENSRNOT00000044268
|
Hist2h2aa2
|
histone cluster 2, H2aa2 |
| chr5_+_25725683 | 0.13 |
ENSRNOT00000087602
|
LOC679087
|
similar to swan |
| chr8_-_44327551 | 0.13 |
ENSRNOT00000083939
|
Gramd1b
|
GRAM domain containing 1B |
| chr20_+_44060731 | 0.13 |
ENSRNOT00000000737
|
Lama4
|
laminin subunit alpha 4 |
| chr6_+_6946695 | 0.13 |
ENSRNOT00000061921
|
Mta3
|
metastasis associated 1 family, member 3 |
| chr1_-_174411141 | 0.12 |
ENSRNOT00000065288
|
Nrip3
|
nuclear receptor interacting protein 3 |
| chr1_-_20962526 | 0.12 |
ENSRNOT00000061332
ENSRNOT00000017322 ENSRNOT00000017412 ENSRNOT00000079688 ENSRNOT00000017417 |
Epb41l2
|
erythrocyte membrane protein band 4.1-like 2 |
| chr16_-_32421005 | 0.12 |
ENSRNOT00000082712
|
Nek1
|
NIMA-related kinase 1 |
| chrX_+_11648989 | 0.12 |
ENSRNOT00000041003
|
Bcor
|
BCL6 co-repressor |
| chr17_-_18590536 | 0.12 |
ENSRNOT00000078992
|
Cap2
|
CAP, adenylate cyclase-associated protein, 2 (yeast) |
| chr18_-_37245809 | 0.12 |
ENSRNOT00000079585
|
Ppp2r2b
|
protein phosphatase 2, regulatory subunit B, beta |
| chr7_-_122644054 | 0.12 |
ENSRNOT00000025941
|
Dnajb7
|
DnaJ heat shock protein family (Hsp40) member B7 |
| chr3_+_48096954 | 0.12 |
ENSRNOT00000068238
ENSRNOT00000064344 ENSRNOT00000044638 |
Slc4a10
|
solute carrier family 4 member 10 |
| chr13_+_34400170 | 0.11 |
ENSRNOT00000061516
ENSRNOT00000061515 ENSRNOT00000061513 ENSRNOT00000084506 ENSRNOT00000086641 |
Clasp1
|
cytoplasmic linker associated protein 1 |
| chr2_+_263212051 | 0.11 |
ENSRNOT00000089396
|
Negr1
|
neuronal growth regulator 1 |
| chr4_+_130172727 | 0.11 |
ENSRNOT00000051121
|
Mitf
|
melanogenesis associated transcription factor |
| chr12_+_18931477 | 0.11 |
ENSRNOT00000077087
|
Spry3
|
sprouty RTK signaling antagonist 3 |
| chr6_-_8344897 | 0.11 |
ENSRNOT00000082353
|
Prepl
|
prolyl endopeptidase-like |
| chr1_+_142679345 | 0.11 |
ENSRNOT00000034267
|
Zscan2
|
zinc finger and SCAN domain containing 2 |
| chr20_+_5049496 | 0.11 |
ENSRNOT00000088251
ENSRNOT00000001118 |
Ddah2
|
dimethylarginine dimethylaminohydrolase 2 |
| chr20_-_4542073 | 0.10 |
ENSRNOT00000000477
|
Cfb
|
complement factor B |
| chr18_+_32594958 | 0.10 |
ENSRNOT00000018511
|
Spry4
|
sprouty RTK signaling antagonist 4 |
| chr3_-_163847671 | 0.10 |
ENSRNOT00000076833
|
Znfx1
|
zinc finger, NFX1-type containing 1 |
| chrX_+_984798 | 0.10 |
ENSRNOT00000073016
|
Zfp182
|
zinc finger protein 182 |
| chrX_+_51286737 | 0.10 |
ENSRNOT00000035692
|
Dmd
|
dystrophin |
| chr5_+_148051126 | 0.10 |
ENSRNOT00000074415
|
Ptp4a2
|
protein tyrosine phosphatase type IVA, member 2 |
| chr5_+_25253010 | 0.10 |
ENSRNOT00000061333
|
Rbm12b
|
RNA binding motif protein 12B |
| chr5_-_65073012 | 0.10 |
ENSRNOT00000007957
|
Grin3a
|
glutamate ionotropic receptor NMDA type subunit 3A |
| chr3_-_61488696 | 0.10 |
ENSRNOT00000083045
|
Lnpk
|
lunapark, ER junction formation factor |
| chr6_+_58468155 | 0.10 |
ENSRNOT00000091263
|
Etv1
|
ets variant 1 |
| chr20_-_4391402 | 0.10 |
ENSRNOT00000090518
ENSRNOT00000083489 |
Ppt2
|
palmitoyl-protein thioesterase 2 |
| chr13_-_80745347 | 0.10 |
ENSRNOT00000041908
|
Fmo1
|
flavin containing monooxygenase 1 |
| chr4_-_170763916 | 0.10 |
ENSRNOT00000071512
|
Hist1h4m
|
histone cluster 1, H4m |
| chr10_+_81913689 | 0.09 |
ENSRNOT00000003780
|
Tob1
|
transducer of ErbB-2.1 |
| chr7_+_58419197 | 0.09 |
ENSRNOT00000085829
|
Zfc3h1
|
zinc finger, C3H1-type containing |
| chr5_+_124690214 | 0.09 |
ENSRNOT00000011237
|
Plpp3
|
phospholipid phosphatase 3 |
| chr17_-_42422053 | 0.09 |
ENSRNOT00000048298
|
Fam65b
|
family with sequence similarity 65, member B |
| chr5_-_64818813 | 0.09 |
ENSRNOT00000009111
ENSRNOT00000086505 |
Aldob
|
aldolase, fructose-bisphosphate B |
| chr13_-_88061108 | 0.09 |
ENSRNOT00000003774
|
Rgs4
|
regulator of G-protein signaling 4 |
| chr7_-_33916338 | 0.09 |
ENSRNOT00000005492
|
Cfap54
|
cilia and flagella associated protein 54 |
| chr5_+_167141875 | 0.08 |
ENSRNOT00000089314
|
Slc2a5
|
solute carrier family 2 member 5 |
| chr10_+_95770154 | 0.08 |
ENSRNOT00000030300
|
Helz
|
helicase with zinc finger |
| chr5_-_168734296 | 0.08 |
ENSRNOT00000066120
|
Camta1
|
calmodulin binding transcription activator 1 |
| chr1_-_191984858 | 0.08 |
ENSRNOT00000025309
|
Gga2
|
golgi associated, gamma adaptin ear containing, ARF binding protein 2 |
| chr1_-_167849800 | 0.08 |
ENSRNOT00000093078
ENSRNOT00000092838 ENSRNOT00000093075 ENSRNOT00000075222 |
Trim68
|
tripartite motif containing 68 |
| chr1_-_278042312 | 0.08 |
ENSRNOT00000018693
|
Ablim1
|
actin-binding LIM protein 1 |
| chr2_+_234375315 | 0.08 |
ENSRNOT00000071270
|
LOC102549542
|
elongation of very long chain fatty acids protein 6-like |
| chr2_+_18937458 | 0.08 |
ENSRNOT00000022377
|
Tmem167a
|
transmembrane protein 167A |
| chr2_+_43271092 | 0.08 |
ENSRNOT00000017571
|
Mier3
|
mesoderm induction early response 1, family member 3 |
| chr10_-_109840047 | 0.08 |
ENSRNOT00000054947
|
Notum
|
NOTUM, palmitoleoyl-protein carboxylesterase |
| chr2_+_238257031 | 0.08 |
ENSRNOT00000016066
|
Ints12
|
integrator complex subunit 12 |
| chr5_+_152680407 | 0.08 |
ENSRNOT00000076864
|
Stmn1
|
stathmin 1 |
| chr5_+_142731767 | 0.07 |
ENSRNOT00000067762
|
Inpp5b
|
inositol polyphosphate-5-phosphatase B |
| chr2_+_232104809 | 0.07 |
ENSRNOT00000083193
|
Tifa
|
TRAF-interacting protein with forkhead-associated domain |
| chrX_-_158288109 | 0.07 |
ENSRNOT00000072527
|
LOC103690175
|
PHD finger protein 6 |
| chr6_+_113898420 | 0.07 |
ENSRNOT00000064872
|
Nrxn3
|
neurexin 3 |
| chr8_+_61671513 | 0.07 |
ENSRNOT00000091128
|
Ptpn9
|
protein tyrosine phosphatase, non-receptor type 9 |
| chr4_-_29778039 | 0.07 |
ENSRNOT00000074177
|
Sgce
|
sarcoglycan, epsilon |
| chr10_+_104582955 | 0.07 |
ENSRNOT00000009733
|
Unk
|
unkempt family zinc finger |
| chr20_+_42966140 | 0.07 |
ENSRNOT00000000707
|
Marcks
|
myristoylated alanine rich protein kinase C substrate |
| chr1_+_64928503 | 0.07 |
ENSRNOT00000086274
|
Vom2r80
|
vomeronasal 2 receptor, 80 |
| chr17_-_84830185 | 0.07 |
ENSRNOT00000040697
|
Skida1
|
SKI/DACH domain containing 1 |
| chr9_-_121713091 | 0.07 |
ENSRNOT00000073432
|
Adcyap1
|
adenylate cyclase activating polypeptide 1 |
| chr17_+_36334147 | 0.07 |
ENSRNOT00000050261
|
E2f3
|
E2F transcription factor 3 |
| chr11_-_782954 | 0.07 |
ENSRNOT00000040065
|
Epha3
|
Eph receptor A3 |
| chr6_-_117972898 | 0.07 |
ENSRNOT00000032968
|
AABR07065265.1
|
|
| chr1_-_198900375 | 0.06 |
ENSRNOT00000024969
|
Zfp689
|
zinc finger protein 689 |
| chr18_+_30820321 | 0.06 |
ENSRNOT00000060472
|
Pcdhga3
|
protocadherin gamma subfamily A, 3 |
| chr16_-_10802512 | 0.06 |
ENSRNOT00000079554
|
Bmpr1a
|
bone morphogenetic protein receptor type 1A |
| chr6_+_134804141 | 0.06 |
ENSRNOT00000086143
|
Ppp2r5c
|
protein phosphatase 2, regulatory subunit B', gamma |
| chr7_-_140506925 | 0.06 |
ENSRNOT00000083354
|
Kmt2d
|
lysine methyltransferase 2D |
| chr1_+_218569510 | 0.06 |
ENSRNOT00000019652
|
Cpt1a
|
carnitine palmitoyltransferase 1A |
| chr9_-_32019205 | 0.06 |
ENSRNOT00000016194
|
Adgrb3
|
adhesion G protein-coupled receptor B3 |
| chr8_+_23398030 | 0.06 |
ENSRNOT00000031893
|
RGD1561444
|
similar to RIKEN cDNA 9530077C05 |
| chr7_+_70445366 | 0.06 |
ENSRNOT00000045687
|
RGD1565117
|
similar to 40S ribosomal protein S26 |
| chr5_+_58667885 | 0.06 |
ENSRNOT00000064755
|
Unc13b
|
unc-13 homolog B |
| chr2_+_122368265 | 0.06 |
ENSRNOT00000078321
|
Atp11b
|
ATPase phospholipid transporting 11B (putative) |
| chr8_+_103938520 | 0.06 |
ENSRNOT00000067835
|
Gk5
|
glycerol kinase 5 (putative) |
| chr5_-_146069670 | 0.06 |
ENSRNOT00000072793
|
LOC682102
|
hypothetical protein LOC682102 |
| chr2_+_187322416 | 0.06 |
ENSRNOT00000025183
|
Crabp2
|
cellular retinoic acid binding protein 2 |
| chr6_+_73358112 | 0.06 |
ENSRNOT00000041373
|
Arhgap5
|
Rho GTPase activating protein 5 |
| chr5_-_6186329 | 0.06 |
ENSRNOT00000012610
|
Sulf1
|
sulfatase 1 |
| chr18_-_16542165 | 0.06 |
ENSRNOT00000079381
|
Slc39a6
|
solute carrier family 39 member 6 |
| chr17_-_44527801 | 0.05 |
ENSRNOT00000089643
|
Hist1h2bk
|
histone cluster 1 H2B family member k |
| chr14_+_69800156 | 0.05 |
ENSRNOT00000072746
|
Lcorl
|
ligand dependent nuclear receptor corepressor-like |
| chr9_+_16619040 | 0.05 |
ENSRNOT00000024010
|
Rrp36
|
ribosomal RNA processing 36 |
| chr8_-_93390305 | 0.05 |
ENSRNOT00000056930
|
Ibtk
|
inhibitor of Bruton tyrosine kinase |
| chr5_+_4373626 | 0.05 |
ENSRNOT00000064946
|
Eya1
|
EYA transcriptional coactivator and phosphatase 1 |
| chr3_+_95715193 | 0.05 |
ENSRNOT00000089525
|
Pax6
|
paired box 6 |
| chr18_+_40853988 | 0.05 |
ENSRNOT00000091759
|
AABR07031963.1
|
uncharacterized protein LOC317165 |
| chr6_+_52459946 | 0.05 |
ENSRNOT00000073277
ENSRNOT00000013474 |
Atxn7l1
|
ataxin 7-like 1 |
| chr2_+_178354890 | 0.05 |
ENSRNOT00000037890
|
Ppid
|
peptidylprolyl isomerase D |
| chr10_+_90230441 | 0.05 |
ENSRNOT00000082722
|
Tmub2
|
transmembrane and ubiquitin-like domain containing 2 |
| chr8_-_67040005 | 0.05 |
ENSRNOT00000038641
|
Glce
|
glucuronic acid epimerase |
| chr3_-_157049666 | 0.05 |
ENSRNOT00000089958
|
Chd6
|
chromodomain helicase DNA binding protein 6 |
| chr8_+_111495331 | 0.05 |
ENSRNOT00000091275
ENSRNOT00000012162 |
Slco2a1
|
solute carrier organic anion transporter family, member 2a1 |
| chr4_+_167754525 | 0.05 |
ENSRNOT00000007889
|
Etv6
|
ets variant 6 |
| chr9_+_17041389 | 0.04 |
ENSRNOT00000025598
|
Abcc10
|
ATP binding cassette subfamily C member 10 |
| chr18_+_56364620 | 0.04 |
ENSRNOT00000068535
ENSRNOT00000086033 |
Pdgfrb
|
platelet derived growth factor receptor beta |
| chr20_+_28920616 | 0.04 |
ENSRNOT00000070897
|
P4ha1
|
prolyl 4-hydroxylase subunit alpha 1 |
| chr18_+_59748444 | 0.04 |
ENSRNOT00000024752
|
St8sia3
|
ST8 alpha-N-acetyl-neuraminide alpha-2,8-sialyltransferase 3 |
| chr7_-_2961873 | 0.04 |
ENSRNOT00000067441
|
Rps15-ps2
|
ribosomal protein S15, pseudogene 2 |
| chr4_-_81241152 | 0.04 |
ENSRNOT00000015325
ENSRNOT00000015152 |
Hnrnpa2b1
|
heterogeneous nuclear ribonucleoprotein A2/B1 |
| chr2_-_192027225 | 0.04 |
ENSRNOT00000016430
|
Prr9
|
proline rich 9 |
| chr2_-_186232292 | 0.04 |
ENSRNOT00000087088
|
Dclk2
|
doublecortin-like kinase 2 |
| chr15_-_37056892 | 0.04 |
ENSRNOT00000047731
|
Zmym5
|
zinc finger MYM-type containing 5 |
| chr20_-_31597830 | 0.04 |
ENSRNOT00000085877
|
Col13a1
|
collagen type XIII alpha 1 chain |
| chr1_-_246110218 | 0.04 |
ENSRNOT00000077544
|
Rfx3
|
regulatory factor X3 |
| chr5_-_85123829 | 0.04 |
ENSRNOT00000007578
|
Brinp1
|
BMP/retinoic acid inducible neural specific 1 |
| chr3_-_148312420 | 0.04 |
ENSRNOT00000047416
ENSRNOT00000081272 |
Bcl2l1
|
Bcl2-like 1 |
| chr5_+_128083118 | 0.04 |
ENSRNOT00000079161
|
Zcchc11
|
zinc finger CCHC-type containing 11 |
| chr6_-_77848434 | 0.04 |
ENSRNOT00000034342
|
Slc25a21
|
solute carrier family 25 member 21 |
| chr4_+_2055615 | 0.04 |
ENSRNOT00000007646
|
Rnf32
|
ring finger protein 32 |
| chr2_+_88217188 | 0.04 |
ENSRNOT00000014267
|
Car1
|
carbonic anhydrase I |
| chr20_+_3364814 | 0.04 |
ENSRNOT00000001077
|
RGD1302996
|
hypothetical protein MGC:15854 |
Network of associatons between targets according to the STRING database.

First level regulatory network of Cpeb1
Gene Ontology Analysis
Gene overrepresentation in biological process category:
| Log-likelihood per target | Total log-likelihood | Term | Description |
|---|---|---|---|
| 0.1 | 0.3 | GO:2000384 | regulation of ectoderm development(GO:2000383) negative regulation of ectoderm development(GO:2000384) |
| 0.1 | 0.4 | GO:1903225 | negative regulation of endodermal cell differentiation(GO:1903225) |
| 0.1 | 1.0 | GO:2000766 | negative regulation of cytoplasmic translation(GO:2000766) |
| 0.1 | 0.3 | GO:0043314 | negative regulation of neutrophil degranulation(GO:0043314) |
| 0.1 | 0.3 | GO:1902093 | positive regulation of sperm motility(GO:1902093) |
| 0.1 | 0.2 | GO:1903923 | protein processing in phagocytic vesicle(GO:1900756) regulation of protein processing in phagocytic vesicle(GO:1903921) positive regulation of protein processing in phagocytic vesicle(GO:1903923) |
| 0.1 | 0.3 | GO:0060842 | arterial endothelial cell differentiation(GO:0060842) |
| 0.1 | 0.3 | GO:0000414 | regulation of histone H3-K36 methylation(GO:0000414) |
| 0.1 | 0.1 | GO:0048378 | lateral mesodermal cell fate commitment(GO:0048372) lateral mesodermal cell fate specification(GO:0048377) regulation of lateral mesodermal cell fate specification(GO:0048378) |
| 0.1 | 0.2 | GO:0098749 | cerebellar neuron development(GO:0098749) |
| 0.1 | 0.2 | GO:0046462 | monoacylglycerol metabolic process(GO:0046462) monoacylglycerol catabolic process(GO:0052651) |
| 0.1 | 0.2 | GO:1902595 | regulation of DNA replication origin binding(GO:1902595) |
| 0.1 | 0.4 | GO:0061193 | taste bud development(GO:0061193) |
| 0.1 | 0.3 | GO:0051365 | cellular response to potassium ion starvation(GO:0051365) |
| 0.1 | 0.2 | GO:1990108 | protein linear deubiquitination(GO:1990108) |
| 0.1 | 0.2 | GO:0033861 | negative regulation of NAD(P)H oxidase activity(GO:0033861) negative regulation of complement-dependent cytotoxicity(GO:1903660) |
| 0.0 | 0.1 | GO:0006808 | regulation of nitrogen utilization(GO:0006808) nitrogen utilization(GO:0019740) negative regulation of retinal cell programmed cell death(GO:0046671) |
| 0.0 | 0.1 | GO:2000820 | negative regulation of transcription from RNA polymerase II promoter involved in smooth muscle cell differentiation(GO:2000820) |
| 0.0 | 0.3 | GO:0035426 | extracellular matrix-cell signaling(GO:0035426) |
| 0.0 | 0.1 | GO:2000777 | positive regulation of proteasomal ubiquitin-dependent protein catabolic process involved in cellular response to hypoxia(GO:2000777) |
| 0.0 | 0.2 | GO:2000546 | positive regulation of fat cell proliferation(GO:0070346) positive regulation of cell chemotaxis to fibroblast growth factor(GO:1904849) positive regulation of endothelial cell chemotaxis to fibroblast growth factor(GO:2000546) |
| 0.0 | 0.2 | GO:0031394 | positive regulation of prostaglandin biosynthetic process(GO:0031394) positive regulation of unsaturated fatty acid biosynthetic process(GO:2001280) |
| 0.0 | 0.1 | GO:0098964 | dendritic transport of ribonucleoprotein complex(GO:0098961) dendritic transport of messenger ribonucleoprotein complex(GO:0098963) anterograde dendritic transport of messenger ribonucleoprotein complex(GO:0098964) |
| 0.0 | 0.1 | GO:0021629 | muscle attachment(GO:0016203) olfactory nerve morphogenesis(GO:0021627) olfactory nerve structural organization(GO:0021629) |
| 0.0 | 0.3 | GO:0001661 | conditioned taste aversion(GO:0001661) |
| 0.0 | 0.2 | GO:0035989 | tendon development(GO:0035989) |
| 0.0 | 0.1 | GO:0044330 | canonical Wnt signaling pathway involved in positive regulation of wound healing(GO:0044330) |
| 0.0 | 0.1 | GO:0006116 | NADH oxidation(GO:0006116) |
| 0.0 | 0.1 | GO:1903690 | negative regulation of wound healing, spreading of epidermal cells(GO:1903690) |
| 0.0 | 0.3 | GO:0035563 | positive regulation of chromatin binding(GO:0035563) |
| 0.0 | 0.1 | GO:0044336 | canonical Wnt signaling pathway involved in negative regulation of apoptotic process(GO:0044336) |
| 0.0 | 0.1 | GO:1904717 | positive regulation of receptor clustering(GO:1903911) regulation of AMPA glutamate receptor clustering(GO:1904717) |
| 0.0 | 0.4 | GO:2001256 | regulation of store-operated calcium entry(GO:2001256) |
| 0.0 | 0.6 | GO:0009954 | proximal/distal pattern formation(GO:0009954) |
| 0.0 | 0.2 | GO:0016576 | histone dephosphorylation(GO:0016576) |
| 0.0 | 0.1 | GO:0015755 | fructose transport(GO:0015755) cellular response to fructose stimulus(GO:0071332) |
| 0.0 | 0.3 | GO:0043569 | negative regulation of insulin-like growth factor receptor signaling pathway(GO:0043569) |
| 0.0 | 0.1 | GO:0002877 | regulation of acute inflammatory response to non-antigenic stimulus(GO:0002877) |
| 0.0 | 0.1 | GO:0097156 | fasciculation of motor neuron axon(GO:0097156) |
| 0.0 | 0.1 | GO:0060988 | lipid tube assembly(GO:0060988) |
| 0.0 | 0.2 | GO:0006337 | nucleosome disassembly(GO:0006337) |
| 0.0 | 0.1 | GO:0070494 | regulation of thrombin receptor signaling pathway(GO:0070494) negative regulation of thrombin receptor signaling pathway(GO:0070495) |
| 0.0 | 0.4 | GO:0021891 | olfactory bulb interneuron development(GO:0021891) |
| 0.0 | 0.1 | GO:0060686 | limb joint morphogenesis(GO:0036022) negative regulation of prostatic bud formation(GO:0060686) |
| 0.0 | 0.1 | GO:1904937 | pancreatic A cell development(GO:0003322) forebrain-midbrain boundary formation(GO:0021905) somatic motor neuron fate commitment(GO:0021917) regulation of transcription from RNA polymerase II promoter involved in somatic motor neuron fate commitment(GO:0021918) sensory neuron migration(GO:1904937) |
| 0.0 | 0.2 | GO:0097623 | potassium ion export across plasma membrane(GO:0097623) |
| 0.0 | 0.3 | GO:0043517 | negative regulation of peptidyl-threonine phosphorylation(GO:0010801) positive regulation of DNA damage response, signal transduction by p53 class mediator(GO:0043517) |
| 0.0 | 0.2 | GO:0010459 | negative regulation of heart rate(GO:0010459) |
| 0.0 | 0.2 | GO:0043374 | CD8-positive, alpha-beta T cell differentiation(GO:0043374) |
| 0.0 | 0.1 | GO:0061743 | motor learning(GO:0061743) |
| 0.0 | 0.0 | GO:1990743 | protein sialylation(GO:1990743) |
| 0.0 | 0.1 | GO:0071787 | endoplasmic reticulum tubular network assembly(GO:0071787) |
| 0.0 | 0.0 | GO:0002071 | glandular epithelial cell maturation(GO:0002071) positive regulation of type B pancreatic cell development(GO:2000078) |
| 0.0 | 0.2 | GO:0051895 | negative regulation of focal adhesion assembly(GO:0051895) |
| 0.0 | 0.0 | GO:0019050 | suppression by virus of host apoptotic process(GO:0019050) modulation by virus of host apoptotic process(GO:0039526) cellular response to astaxanthin(GO:1905218) |
| 0.0 | 0.4 | GO:0095500 | acetylcholine receptor signaling pathway(GO:0095500) signal transduction involved in cellular response to ammonium ion(GO:1903831) response to acetylcholine(GO:1905144) cellular response to acetylcholine(GO:1905145) |
| 0.0 | 0.1 | GO:0042159 | lipoprotein catabolic process(GO:0042159) |
| 0.0 | 0.0 | GO:0071492 | cellular response to UV-A(GO:0071492) |
| 0.0 | 0.1 | GO:0001555 | oocyte growth(GO:0001555) |
| 0.0 | 0.1 | GO:0098734 | macromolecule depalmitoylation(GO:0098734) |
| 0.0 | 0.0 | GO:0030210 | heparin biosynthetic process(GO:0030210) |
| 0.0 | 0.0 | GO:0007296 | vitellogenesis(GO:0007296) |
| 0.0 | 0.1 | GO:1900019 | regulation of protein kinase C activity(GO:1900019) positive regulation of protein kinase C activity(GO:1900020) |
| 0.0 | 0.0 | GO:0072276 | cell migration involved in vasculogenesis(GO:0035441) VEGF-activated platelet-derived growth factor receptor signaling pathway(GO:0038086) positive regulation of cell proliferation by VEGF-activated platelet derived growth factor receptor signaling pathway(GO:0038091) metanephric glomerulus morphogenesis(GO:0072275) metanephric glomerulus vasculature morphogenesis(GO:0072276) metanephric glomerular capillary formation(GO:0072277) |
| 0.0 | 0.0 | GO:0044806 | G-quadruplex DNA unwinding(GO:0044806) |
| 0.0 | 0.0 | GO:0021529 | spinal cord oligodendrocyte cell differentiation(GO:0021529) spinal cord oligodendrocyte cell fate specification(GO:0021530) |
| 0.0 | 0.1 | GO:0043923 | positive regulation by host of viral transcription(GO:0043923) |
| 0.0 | 0.1 | GO:1902373 | negative regulation of mRNA catabolic process(GO:1902373) |
| 0.0 | 0.2 | GO:0014049 | positive regulation of glutamate secretion(GO:0014049) |
Gene overrepresentation in cellular component category:
| Log-likelihood per target | Total log-likelihood | Term | Description |
|---|---|---|---|
| 0.1 | 0.4 | GO:0005588 | collagen type V trimer(GO:0005588) |
| 0.1 | 0.2 | GO:0005592 | collagen type XI trimer(GO:0005592) |
| 0.1 | 0.2 | GO:0005943 | phosphatidylinositol 3-kinase complex, class IA(GO:0005943) |
| 0.1 | 0.2 | GO:0000444 | MIS12/MIND type complex(GO:0000444) |
| 0.1 | 0.2 | GO:0097513 | myosin II filament(GO:0097513) |
| 0.0 | 1.1 | GO:1990124 | messenger ribonucleoprotein complex(GO:1990124) |
| 0.0 | 0.1 | GO:0031592 | centrosomal corona(GO:0031592) |
| 0.0 | 0.4 | GO:0030061 | mitochondrial crista(GO:0030061) |
| 0.0 | 0.4 | GO:0010369 | chromocenter(GO:0010369) |
| 0.0 | 0.1 | GO:0090571 | RNA polymerase II transcription repressor complex(GO:0090571) |
| 0.0 | 0.2 | GO:0097512 | cardiac myofibril(GO:0097512) |
| 0.0 | 0.1 | GO:0097441 | basilar dendrite(GO:0097441) |
| 0.0 | 0.1 | GO:0097425 | smooth endoplasmic reticulum membrane(GO:0030868) smooth endoplasmic reticulum part(GO:0097425) |
| 0.0 | 0.2 | GO:0071564 | npBAF complex(GO:0071564) |
| 0.0 | 0.1 | GO:0042585 | germinal vesicle(GO:0042585) dendritic branch(GO:0044307) |
| 0.0 | 0.2 | GO:0070775 | H3 histone acetyltransferase complex(GO:0070775) MOZ/MORF histone acetyltransferase complex(GO:0070776) |
| 0.0 | 0.2 | GO:0044666 | MLL3/4 complex(GO:0044666) |
| 0.0 | 0.3 | GO:0030014 | CCR4-NOT complex(GO:0030014) |
| 0.0 | 0.2 | GO:0005614 | interstitial matrix(GO:0005614) |
| 0.0 | 0.1 | GO:0016012 | sarcoglycan complex(GO:0016012) |
| 0.0 | 0.2 | GO:0097542 | ciliary tip(GO:0097542) |
| 0.0 | 0.0 | GO:0016222 | procollagen-proline 4-dioxygenase complex(GO:0016222) |
| 0.0 | 0.5 | GO:0043034 | costamere(GO:0043034) |
Gene overrepresentation in molecular function category:
| Log-likelihood per target | Total log-likelihood | Term | Description |
|---|---|---|---|
| 0.1 | 0.3 | GO:0004507 | steroid 11-beta-monooxygenase activity(GO:0004507) corticosterone 18-monooxygenase activity(GO:0047783) |
| 0.1 | 0.4 | GO:0031802 | type 5 metabotropic glutamate receptor binding(GO:0031802) |
| 0.1 | 0.2 | GO:0031762 | follicle-stimulating hormone receptor binding(GO:0031762) |
| 0.1 | 0.9 | GO:0000900 | translation repressor activity, nucleic acid binding(GO:0000900) |
| 0.1 | 0.4 | GO:0005169 | neurotrophin TRKB receptor binding(GO:0005169) |
| 0.0 | 0.3 | GO:0005173 | stem cell factor receptor binding(GO:0005173) |
| 0.0 | 0.3 | GO:0003720 | telomerase activity(GO:0003720) RNA-directed DNA polymerase activity(GO:0003964) |
| 0.0 | 0.4 | GO:0004705 | JUN kinase activity(GO:0004705) SAP kinase activity(GO:0016909) |
| 0.0 | 0.2 | GO:0005250 | A-type (transient outward) potassium channel activity(GO:0005250) |
| 0.0 | 0.1 | GO:0016403 | dimethylargininase activity(GO:0016403) |
| 0.0 | 0.3 | GO:0043237 | laminin-1 binding(GO:0043237) |
| 0.0 | 0.1 | GO:0042731 | PH domain binding(GO:0042731) |
| 0.0 | 0.2 | GO:0051434 | BH3 domain binding(GO:0051434) |
| 0.0 | 0.1 | GO:0042392 | sphingosine-1-phosphate phosphatase activity(GO:0042392) |
| 0.0 | 0.2 | GO:0046935 | 1-phosphatidylinositol-3-kinase regulator activity(GO:0046935) |
| 0.0 | 0.1 | GO:0045322 | unmethylated CpG binding(GO:0045322) |
| 0.0 | 0.4 | GO:0030550 | acetylcholine receptor inhibitor activity(GO:0030550) |
| 0.0 | 0.3 | GO:0004445 | inositol-polyphosphate 5-phosphatase activity(GO:0004445) |
| 0.0 | 0.2 | GO:0032184 | SUMO polymer binding(GO:0032184) |
| 0.0 | 0.2 | GO:0071532 | ankyrin repeat binding(GO:0071532) |
| 0.0 | 0.2 | GO:0061578 | Lys63-specific deubiquitinase activity(GO:0061578) |
| 0.0 | 0.1 | GO:0046030 | inositol trisphosphate phosphatase activity(GO:0046030) |
| 0.0 | 0.3 | GO:0070008 | serine-type exopeptidase activity(GO:0070008) |
| 0.0 | 0.2 | GO:0070061 | fructose binding(GO:0070061) |
| 0.0 | 0.1 | GO:1990715 | mRNA CDS binding(GO:1990715) |
| 0.0 | 0.2 | GO:0047372 | acylglycerol lipase activity(GO:0047372) |
| 0.0 | 0.3 | GO:0030159 | receptor signaling complex scaffold activity(GO:0030159) |
| 0.0 | 0.1 | GO:0016416 | carnitine O-palmitoyltransferase activity(GO:0004095) O-palmitoyltransferase activity(GO:0016416) |
| 0.0 | 0.0 | GO:0005017 | platelet-derived growth factor-activated receptor activity(GO:0005017) |
| 0.0 | 0.0 | GO:0003828 | alpha-N-acetylneuraminate alpha-2,8-sialyltransferase activity(GO:0003828) |
| 0.0 | 0.1 | GO:0008474 | palmitoyl-(protein) hydrolase activity(GO:0008474) palmitoyl hydrolase activity(GO:0098599) |
| 0.0 | 0.2 | GO:0043522 | leucine zipper domain binding(GO:0043522) |
| 0.0 | 0.0 | GO:0050265 | RNA uridylyltransferase activity(GO:0050265) |
| 0.0 | 0.1 | GO:0008449 | N-acetylglucosamine-6-sulfatase activity(GO:0008449) |
| 0.0 | 0.1 | GO:0043515 | kinetochore binding(GO:0043515) |
| 0.0 | 0.0 | GO:0050253 | retinyl-palmitate esterase activity(GO:0050253) |
| 0.0 | 0.0 | GO:0035375 | zymogen binding(GO:0035375) |
| 0.0 | 0.0 | GO:0004656 | procollagen-proline 4-dioxygenase activity(GO:0004656) |
| 0.0 | 0.1 | GO:0098821 | BMP receptor activity(GO:0098821) |
| 0.0 | 0.2 | GO:0043274 | phospholipase binding(GO:0043274) |
Gene overrepresentation in curated gene sets: canonical pathways category:
| Log-likelihood per target | Total log-likelihood | Term | Description |
|---|---|---|---|
| 0.0 | 0.2 | ST IL 13 PATHWAY | Interleukin 13 (IL-13) Pathway |
| 0.0 | 0.4 | PID EPHA2 FWD PATHWAY | EPHA2 forward signaling |
| 0.0 | 0.1 | SA FAS SIGNALING | The TNF-type receptor Fas induces apoptosis on ligand binding. |
| 0.0 | 0.2 | PID ERB GENOMIC PATHWAY | Validated nuclear estrogen receptor beta network |
| 0.0 | 0.2 | PID TCR JNK PATHWAY | JNK signaling in the CD4+ TCR pathway |
| 0.0 | 0.1 | SA G2 AND M PHASES | Cdc25 activates the cdc2/cyclin B complex to induce the G2/M transition. |
| 0.0 | 0.5 | PID SYNDECAN 1 PATHWAY | Syndecan-1-mediated signaling events |
| 0.0 | 0.4 | NABA BASEMENT MEMBRANES | Genes encoding structural components of basement membranes |
Gene overrepresentation in curated gene sets: REACTOME pathways category:
| Log-likelihood per target | Total log-likelihood | Term | Description |
|---|---|---|---|
| 0.0 | 0.4 | REACTOME ACTIVATION OF THE AP1 FAMILY OF TRANSCRIPTION FACTORS | Genes involved in Activation of the AP-1 family of transcription factors |
| 0.0 | 0.3 | REACTOME ENDOGENOUS STEROLS | Genes involved in Endogenous sterols |
| 0.0 | 0.4 | REACTOME SIGNALING BY FGFR1 FUSION MUTANTS | Genes involved in Signaling by FGFR1 fusion mutants |