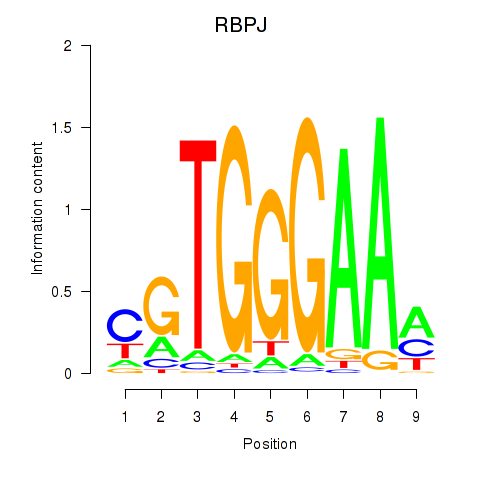
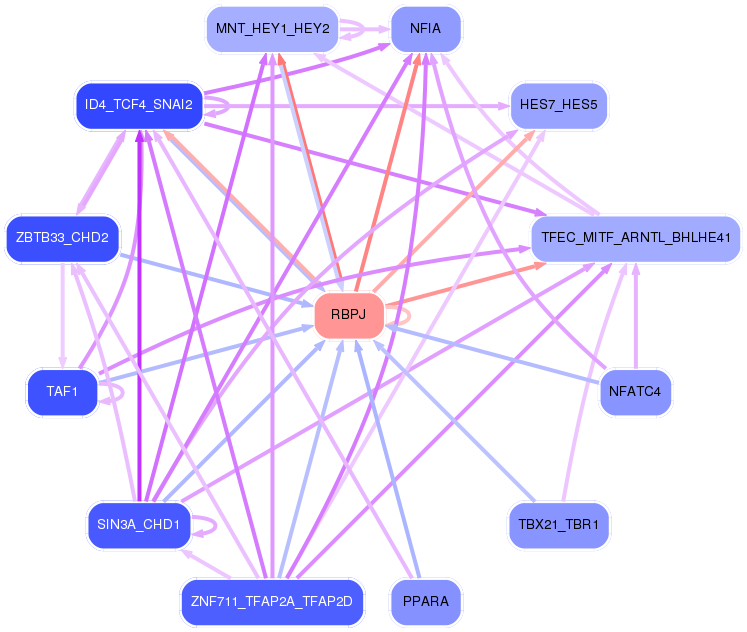
Motif ID: RBPJ
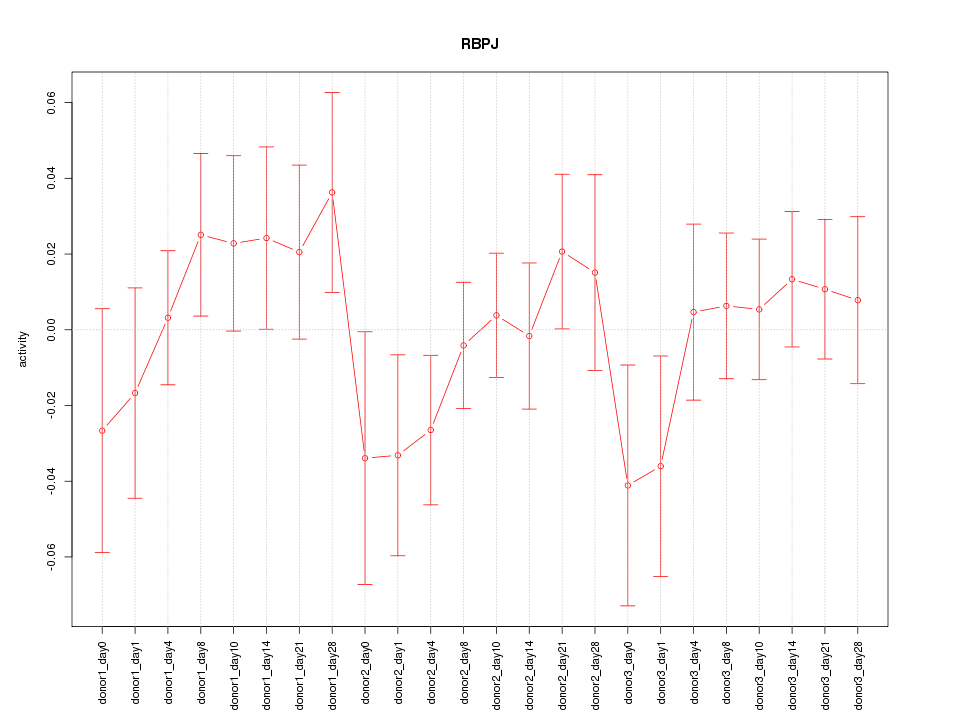
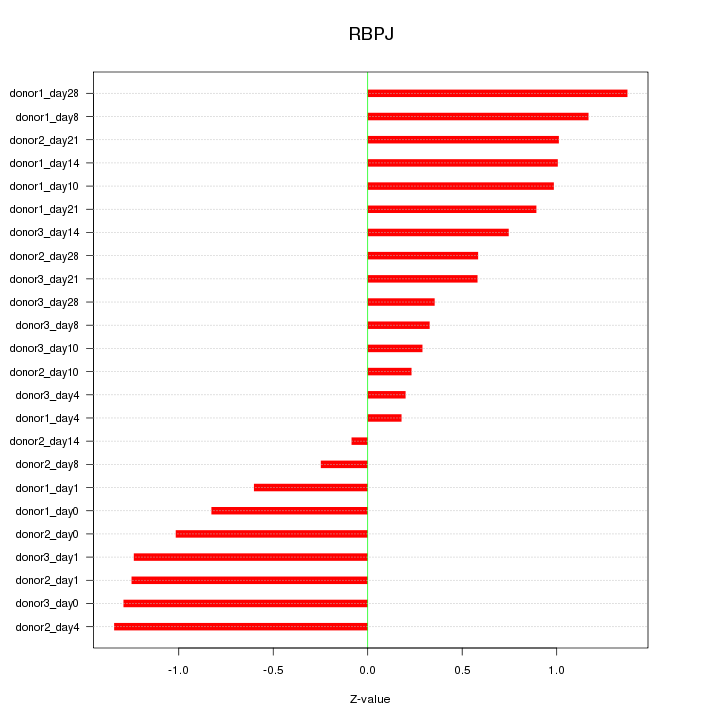
Z-value: 0.853
Transcription factors associated with RBPJ:
| Gene Symbol | Entrez ID | Gene Name |
|---|---|---|
| RBPJ | ENSG00000168214.16 | RBPJ |
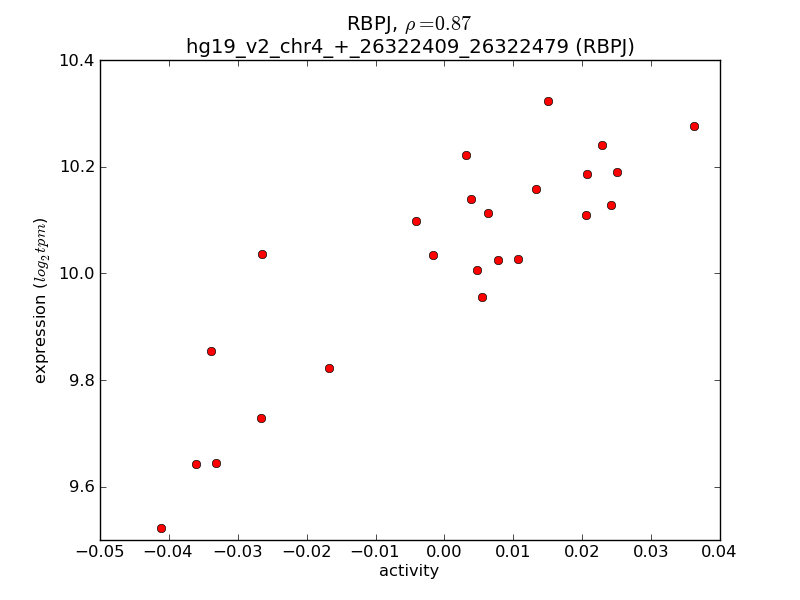
Activity-expression correlation:
| Gene Symbol | Promoter | Pearson corr. coef. | P-value | Plot |
|---|---|---|---|---|
| RBPJ | hg19_v2_chr4_+_26322409_26322479, hg19_v2_chr4_+_26321284_26321377 | 0.87 | 2.3e-08 | Click! |

Top targets:
Gene overrepresentation in biological_process category:
| Log-likelihood per target | Total log-likelihood | Term | Description |
|---|---|---|---|
| 4.6 | 13.8 | GO:1903568 | negative regulation of protein localization to cilium(GO:1903565) regulation of protein localization to ciliary membrane(GO:1903567) negative regulation of protein localization to ciliary membrane(GO:1903568) |
| 1.0 | 3.8 | GO:2000820 | negative regulation of transcription from RNA polymerase II promoter involved in smooth muscle cell differentiation(GO:2000820) |
| 0.4 | 2.1 | GO:0030382 | sperm mitochondrion organization(GO:0030382) |
| 0.3 | 1.3 | GO:0000255 | allantoin metabolic process(GO:0000255) |
| 0.2 | 0.7 | GO:0019243 | methylglyoxal catabolic process to D-lactate via S-lactoyl-glutathione(GO:0019243) methylglyoxal catabolic process(GO:0051596) methylglyoxal catabolic process to lactate(GO:0061727) |
| 0.2 | 0.6 | GO:2000974 | auditory receptor cell fate determination(GO:0042668) negative regulation of pro-B cell differentiation(GO:2000974) |
| 0.2 | 1.5 | GO:1990034 | cellular response to corticosterone stimulus(GO:0071386) calcium ion export from cell(GO:1990034) |
| 0.2 | 0.7 | GO:0010157 | response to chlorate(GO:0010157) |
| 0.2 | 3.4 | GO:0021670 | lateral ventricle development(GO:0021670) |
| 0.2 | 1.4 | GO:0006552 | leucine catabolic process(GO:0006552) |
| 0.1 | 0.6 | GO:0072156 | distal tubule morphogenesis(GO:0072156) |
| 0.1 | 3.8 | GO:0072189 | ureter development(GO:0072189) |
| 0.1 | 2.4 | GO:2000480 | negative regulation of cAMP-dependent protein kinase activity(GO:2000480) |
| 0.1 | 0.9 | GO:0072734 | response to staurosporine(GO:0072733) cellular response to staurosporine(GO:0072734) |
| 0.1 | 0.3 | GO:0032765 | positive regulation of mast cell cytokine production(GO:0032765) |
| 0.1 | 0.4 | GO:0019046 | release from viral latency(GO:0019046) |
| 0.1 | 0.6 | GO:1901668 | regulation of superoxide dismutase activity(GO:1901668) |
| 0.1 | 0.3 | GO:0046013 | regulation of T cell homeostatic proliferation(GO:0046013) |
| 0.1 | 0.5 | GO:0072367 | regulation of lipid transport by regulation of transcription from RNA polymerase II promoter(GO:0072367) |
| 0.1 | 0.3 | GO:0006391 | transcription initiation from mitochondrial promoter(GO:0006391) |
| 0.1 | 2.5 | GO:0070584 | mitochondrion morphogenesis(GO:0070584) |
| 0.1 | 0.5 | GO:0030242 | pexophagy(GO:0030242) |
| 0.1 | 0.2 | GO:1901297 | positive regulation of ephrin receptor signaling pathway(GO:1901189) positive regulation of canonical Wnt signaling pathway involved in cardiac muscle cell fate commitment(GO:1901297) positive regulation of canonical Wnt signaling pathway involved in heart development(GO:1905068) |
| 0.1 | 0.2 | GO:2000824 | negative regulation of androgen receptor activity(GO:2000824) |
| 0.1 | 0.3 | GO:0060648 | mammary gland bud morphogenesis(GO:0060648) regulation of determination of dorsal identity(GO:2000015) |
| 0.1 | 0.2 | GO:0035552 | oxidative single-stranded DNA demethylation(GO:0035552) |
| 0.1 | 1.1 | GO:0061365 | positive regulation of triglyceride lipase activity(GO:0061365) |
| 0.1 | 0.5 | GO:0097178 | ruffle assembly(GO:0097178) |
| 0.1 | 0.2 | GO:1902530 | regulation of protein linear polyubiquitination(GO:1902528) positive regulation of protein linear polyubiquitination(GO:1902530) |
| 0.0 | 0.3 | GO:0036493 | positive regulation of translation in response to endoplasmic reticulum stress(GO:0036493) |
| 0.0 | 0.4 | GO:0006398 | mRNA 3'-end processing by stem-loop binding and cleavage(GO:0006398) |
| 0.0 | 0.9 | GO:0032516 | positive regulation of phosphoprotein phosphatase activity(GO:0032516) |
| 0.0 | 0.4 | GO:0042415 | norepinephrine metabolic process(GO:0042415) |
| 0.0 | 0.2 | GO:0030950 | establishment or maintenance of actin cytoskeleton polarity(GO:0030950) |
| 0.0 | 1.3 | GO:0010842 | retina layer formation(GO:0010842) |
| 0.0 | 1.9 | GO:2000144 | positive regulation of DNA-templated transcription, initiation(GO:2000144) |
| 0.0 | 0.2 | GO:0051563 | smooth endoplasmic reticulum calcium ion homeostasis(GO:0051563) regulation of core promoter binding(GO:1904796) |
| 0.0 | 0.3 | GO:0001867 | complement activation, lectin pathway(GO:0001867) |
| 0.0 | 4.9 | GO:0030449 | regulation of complement activation(GO:0030449) |
| 0.0 | 0.2 | GO:2001183 | negative regulation of interleukin-10 secretion(GO:2001180) negative regulation of interleukin-12 secretion(GO:2001183) |
| 0.0 | 0.3 | GO:0098532 | histone H3-K27 trimethylation(GO:0098532) |
| 0.0 | 0.1 | GO:1903660 | cellular response to mercury ion(GO:0071288) negative regulation of complement-dependent cytotoxicity(GO:1903660) |
| 0.0 | 0.2 | GO:0048539 | bone marrow development(GO:0048539) |
| 0.0 | 0.2 | GO:0061732 | mitochondrial acetyl-CoA biosynthetic process from pyruvate(GO:0061732) |
| 0.0 | 0.2 | GO:0043152 | induction of bacterial agglutination(GO:0043152) |
| 0.0 | 0.3 | GO:0030046 | parallel actin filament bundle assembly(GO:0030046) |
| 0.0 | 0.1 | GO:0051122 | hepoxilin metabolic process(GO:0051121) hepoxilin biosynthetic process(GO:0051122) |
| 0.0 | 0.3 | GO:0030213 | hyaluronan biosynthetic process(GO:0030213) |
| 0.0 | 3.6 | GO:0010811 | positive regulation of cell-substrate adhesion(GO:0010811) |
| 0.0 | 0.1 | GO:2000324 | positive regulation of glucocorticoid receptor signaling pathway(GO:2000324) |
| 0.0 | 0.3 | GO:1900038 | negative regulation of vascular permeability(GO:0043116) negative regulation of cellular response to hypoxia(GO:1900038) |
| 0.0 | 0.6 | GO:1904659 | hexose transmembrane transport(GO:0035428) glucose transmembrane transport(GO:1904659) |
| 0.0 | 0.2 | GO:0098735 | positive regulation of the force of heart contraction(GO:0098735) |
| 0.0 | 1.1 | GO:0048791 | calcium ion-regulated exocytosis of neurotransmitter(GO:0048791) |
| 0.0 | 1.1 | GO:0000289 | nuclear-transcribed mRNA poly(A) tail shortening(GO:0000289) |
| 0.0 | 0.1 | GO:0097167 | circadian regulation of translation(GO:0097167) |
| 0.0 | 0.1 | GO:0006627 | protein processing involved in protein targeting to mitochondrion(GO:0006627) |
| 0.0 | 0.5 | GO:0046710 | GDP metabolic process(GO:0046710) |
| 0.0 | 0.2 | GO:0071447 | cellular response to hydroperoxide(GO:0071447) |
| 0.0 | 0.1 | GO:0035745 | T-helper 2 cell cytokine production(GO:0035745) |
| 0.0 | 0.2 | GO:0032012 | regulation of ARF protein signal transduction(GO:0032012) |
| 0.0 | 0.5 | GO:0001893 | maternal placenta development(GO:0001893) |
| 0.0 | 0.6 | GO:0035904 | aorta development(GO:0035904) |
Gene overrepresentation in cellular_component category:
| Log-likelihood per target | Total log-likelihood | Term | Description |
|---|---|---|---|
| 0.7 | 3.4 | GO:0005879 | axonemal microtubule(GO:0005879) |
| 0.4 | 2.2 | GO:0097513 | myosin II filament(GO:0097513) |
| 0.4 | 1.3 | GO:0070195 | growth hormone receptor complex(GO:0070195) |
| 0.3 | 1.5 | GO:0000308 | cytoplasmic cyclin-dependent protein kinase holoenzyme complex(GO:0000308) |
| 0.2 | 4.6 | GO:0005614 | interstitial matrix(GO:0005614) |
| 0.1 | 2.1 | GO:0097227 | sperm annulus(GO:0097227) |
| 0.1 | 0.7 | GO:0044294 | dendritic growth cone(GO:0044294) |
| 0.1 | 0.6 | GO:1990130 | Iml1 complex(GO:1990130) |
| 0.1 | 0.9 | GO:0097197 | tetraspanin-enriched microdomain(GO:0097197) |
| 0.1 | 2.4 | GO:0016580 | Sin3 complex(GO:0016580) |
| 0.1 | 0.7 | GO:0042382 | paraspeckles(GO:0042382) |
| 0.1 | 1.5 | GO:0032591 | dendritic spine membrane(GO:0032591) |
| 0.0 | 1.1 | GO:0030014 | CCR4-NOT complex(GO:0030014) |
| 0.0 | 0.2 | GO:0002193 | MAML1-RBP-Jkappa- ICN1 complex(GO:0002193) |
| 0.0 | 0.2 | GO:0045254 | pyruvate dehydrogenase complex(GO:0045254) |
| 0.0 | 0.3 | GO:0032426 | stereocilium tip(GO:0032426) |
| 0.0 | 0.4 | GO:0005671 | Ada2/Gcn5/Ada3 transcription activator complex(GO:0005671) |
| 0.0 | 0.5 | GO:0034706 | sodium channel complex(GO:0034706) |
| 0.0 | 0.2 | GO:0070765 | gamma-secretase complex(GO:0070765) |
| 0.0 | 0.7 | GO:0030057 | desmosome(GO:0030057) |
| 0.0 | 0.1 | GO:1990635 | proximal dendrite(GO:1990635) |
| 0.0 | 0.2 | GO:0035686 | sperm fibrous sheath(GO:0035686) |
| 0.0 | 0.2 | GO:0060077 | inhibitory synapse(GO:0060077) |
| 0.0 | 0.2 | GO:0017146 | NMDA selective glutamate receptor complex(GO:0017146) |
| 0.0 | 0.2 | GO:0042589 | zymogen granule membrane(GO:0042589) |
Gene overrepresentation in molecular_function category:
| Log-likelihood per target | Total log-likelihood | Term | Description |
|---|---|---|---|
| 1.1 | 3.4 | GO:0031862 | prostanoid receptor binding(GO:0031862) |
| 1.0 | 4.0 | GO:0035939 | microsatellite binding(GO:0035939) |
| 0.2 | 0.7 | GO:0004416 | hydroxyacylglutathione hydrolase activity(GO:0004416) |
| 0.1 | 0.7 | GO:0005119 | smoothened binding(GO:0005119) |
| 0.1 | 2.2 | GO:0030898 | actin-dependent ATPase activity(GO:0030898) |
| 0.1 | 2.4 | GO:0004862 | cAMP-dependent protein kinase inhibitor activity(GO:0004862) |
| 0.1 | 1.9 | GO:0042813 | Wnt-activated receptor activity(GO:0042813) |
| 0.1 | 1.4 | GO:0003995 | acyl-CoA dehydrogenase activity(GO:0003995) |
| 0.1 | 0.3 | GO:0070363 | mitochondrial light strand promoter sense binding(GO:0070363) |
| 0.1 | 0.2 | GO:0004739 | pyruvate dehydrogenase (acetyl-transferring) activity(GO:0004739) |
| 0.1 | 0.7 | GO:0001011 | transcription factor activity, sequence-specific DNA binding, RNA polymerase recruiting(GO:0001011) transcription factor activity, TFIIB-class binding(GO:0001087) |
| 0.1 | 0.2 | GO:0035514 | DNA demethylase activity(GO:0035514) |
| 0.0 | 1.5 | GO:0005388 | calcium-transporting ATPase activity(GO:0005388) |
| 0.0 | 0.1 | GO:0097158 | pre-mRNA intronic pyrimidine-rich binding(GO:0097158) |
| 0.0 | 0.3 | GO:0016403 | dimethylargininase activity(GO:0016403) |
| 0.0 | 0.3 | GO:0098821 | BMP receptor activity(GO:0098821) |
| 0.0 | 0.6 | GO:0055056 | D-glucose transmembrane transporter activity(GO:0055056) |
| 0.0 | 1.1 | GO:0004806 | triglyceride lipase activity(GO:0004806) |
| 0.0 | 0.1 | GO:0004052 | arachidonate 12-lipoxygenase activity(GO:0004052) |
| 0.0 | 1.8 | GO:0070888 | E-box binding(GO:0070888) |
| 0.0 | 0.2 | GO:0042500 | aspartic endopeptidase activity, intramembrane cleaving(GO:0042500) |
| 0.0 | 0.5 | GO:0015280 | ligand-gated sodium channel activity(GO:0015280) |
| 0.0 | 1.5 | GO:0030332 | cyclin binding(GO:0030332) |
| 0.0 | 3.3 | GO:0005518 | collagen binding(GO:0005518) |
| 0.0 | 0.6 | GO:0016641 | oxidoreductase activity, acting on the CH-NH2 group of donors, oxygen as acceptor(GO:0016641) |
| 0.0 | 0.9 | GO:0097200 | cysteine-type endopeptidase activity involved in execution phase of apoptosis(GO:0097200) |
| 0.0 | 0.4 | GO:0043996 | histone acetyltransferase activity (H4-K5 specific)(GO:0043995) histone acetyltransferase activity (H4-K8 specific)(GO:0043996) histone acetyltransferase activity (H4-K16 specific)(GO:0046972) |
| 0.0 | 0.8 | GO:0070064 | proline-rich region binding(GO:0070064) |
| 0.0 | 0.2 | GO:0099580 | ion antiporter activity involved in regulation of postsynaptic membrane potential(GO:0099580) |
| 0.0 | 0.3 | GO:0043225 | anion transmembrane-transporting ATPase activity(GO:0043225) |
| 0.0 | 0.7 | GO:0005545 | 1-phosphatidylinositol binding(GO:0005545) |
| 0.0 | 0.1 | GO:0005136 | interleukin-4 receptor binding(GO:0005136) |
| 0.0 | 0.3 | GO:0035259 | glucocorticoid receptor binding(GO:0035259) |
| 0.0 | 0.3 | GO:0005537 | mannose binding(GO:0005537) |
| 0.0 | 0.8 | GO:0031624 | ubiquitin conjugating enzyme binding(GO:0031624) |
| 0.0 | 0.5 | GO:0016922 | ligand-dependent nuclear receptor binding(GO:0016922) |
| 0.0 | 0.2 | GO:0000150 | recombinase activity(GO:0000150) |
| 0.0 | 1.1 | GO:0005544 | calcium-dependent phospholipid binding(GO:0005544) |
| 0.0 | 0.1 | GO:0005250 | A-type (transient outward) potassium channel activity(GO:0005250) |
| 0.0 | 1.0 | GO:0001540 | beta-amyloid binding(GO:0001540) |
| 0.0 | 0.5 | GO:0004385 | guanylate kinase activity(GO:0004385) |
| 0.0 | 0.3 | GO:0008093 | cytoskeletal adaptor activity(GO:0008093) |
| 0.0 | 0.5 | GO:0003785 | actin monomer binding(GO:0003785) |
| 0.0 | 0.2 | GO:0016594 | glycine binding(GO:0016594) |
Gene overrepresentation in C2:CP category:
| Log-likelihood per target | Total log-likelihood | Term | Description |
|---|---|---|---|
| 0.1 | 5.6 | PID_HES_HEY_PATHWAY | Notch-mediated HES/HEY network |
| 0.0 | 3.8 | PID_HNF3A_PATHWAY | FOXA1 transcription factor network |
| 0.0 | 1.1 | SA_CASPASE_CASCADE | Apoptosis is mediated by caspases, cysteine proteases arranged in a proteolytic cascade. |
| 0.0 | 0.7 | PID_HEDGEHOG_2PATHWAY | Signaling events mediated by the Hedgehog family |
| 0.0 | 1.9 | PID_IL6_7_PATHWAY | IL6-mediated signaling events |
| 0.0 | 4.3 | NABA_ECM_GLYCOPROTEINS | Genes encoding structural ECM glycoproteins |
| 0.0 | 1.5 | PID_CMYB_PATHWAY | C-MYB transcription factor network |
Gene overrepresentation in C2:CP:REACTOME category:
| Log-likelihood per target | Total log-likelihood | Term | Description |
|---|---|---|---|
| 0.1 | 1.4 | REACTOME_BRANCHED_CHAIN_AMINO_ACID_CATABOLISM | Genes involved in Branched-chain amino acid catabolism |
| 0.0 | 1.3 | REACTOME_PROLACTIN_RECEPTOR_SIGNALING | Genes involved in Prolactin receptor signaling |
| 0.0 | 2.7 | REACTOME_NOTCH1_INTRACELLULAR_DOMAIN_REGULATES_TRANSCRIPTION | Genes involved in NOTCH1 Intracellular Domain Regulates Transcription |
| 0.0 | 1.1 | REACTOME_DEADENYLATION_OF_MRNA | Genes involved in Deadenylation of mRNA |
| 0.0 | 0.6 | REACTOME_FACILITATIVE_NA_INDEPENDENT_GLUCOSE_TRANSPORTERS | Genes involved in Facilitative Na+-independent glucose transporters |
| 0.0 | 1.1 | REACTOME_SEMA4D_INDUCED_CELL_MIGRATION_AND_GROWTH_CONE_COLLAPSE | Genes involved in Sema4D induced cell migration and growth-cone collapse |
| 0.0 | 0.9 | REACTOME_CASPASE_MEDIATED_CLEAVAGE_OF_CYTOSKELETAL_PROTEINS | Genes involved in Caspase-mediated cleavage of cytoskeletal proteins |
| 0.0 | 0.4 | REACTOME_SLBP_DEPENDENT_PROCESSING_OF_REPLICATION_DEPENDENT_HISTONE_PRE_MRNAS | Genes involved in SLBP Dependent Processing of Replication-Dependent Histone Pre-mRNAs |
| 0.0 | 0.3 | REACTOME_APOPTOSIS_INDUCED_DNA_FRAGMENTATION | Genes involved in Apoptosis induced DNA fragmentation |
| 0.0 | 0.2 | REACTOME_REGULATION_OF_PYRUVATE_DEHYDROGENASE_PDH_COMPLEX | Genes involved in Regulation of pyruvate dehydrogenase (PDH) complex |
| 0.0 | 0.3 | REACTOME_HYALURONAN_METABOLISM | Genes involved in Hyaluronan metabolism |
| 0.0 | 1.1 | REACTOME_LIPID_DIGESTION_MOBILIZATION_AND_TRANSPORT | Genes involved in Lipid digestion, mobilization, and transport |
| 0.0 | 0.2 | REACTOME_REGULATED_PROTEOLYSIS_OF_P75NTR | Genes involved in Regulated proteolysis of p75NTR |
| 0.0 | 0.3 | REACTOME_ACTIVATION_OF_RAC | Genes involved in Activation of Rac |