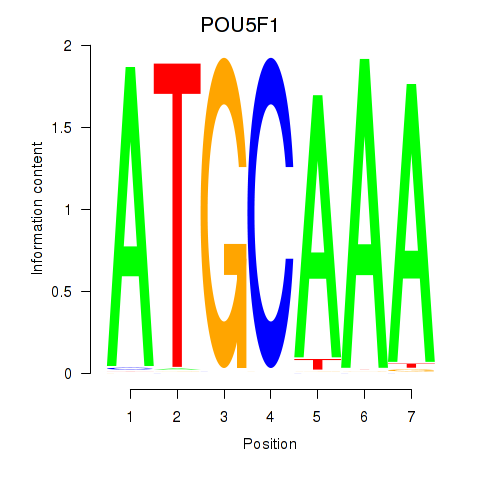
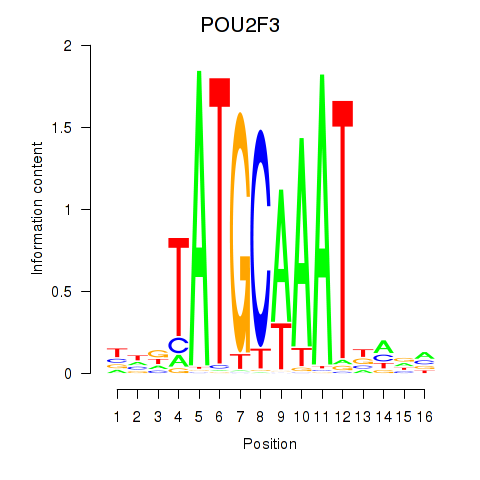
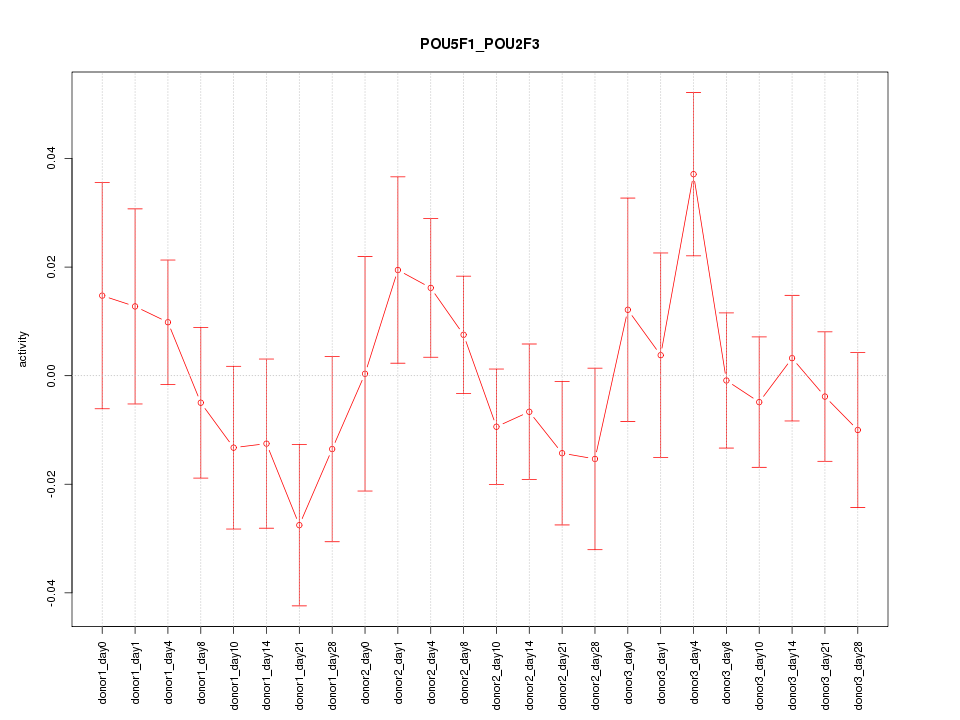
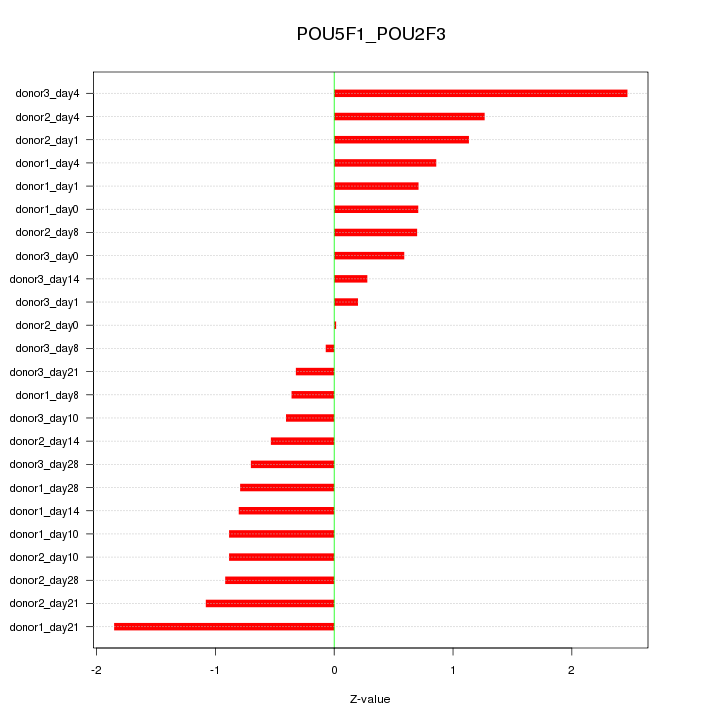
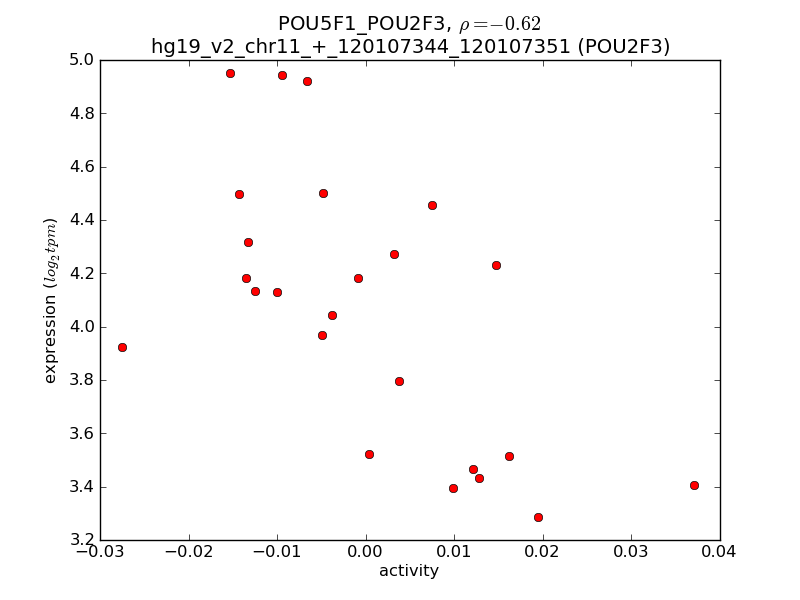
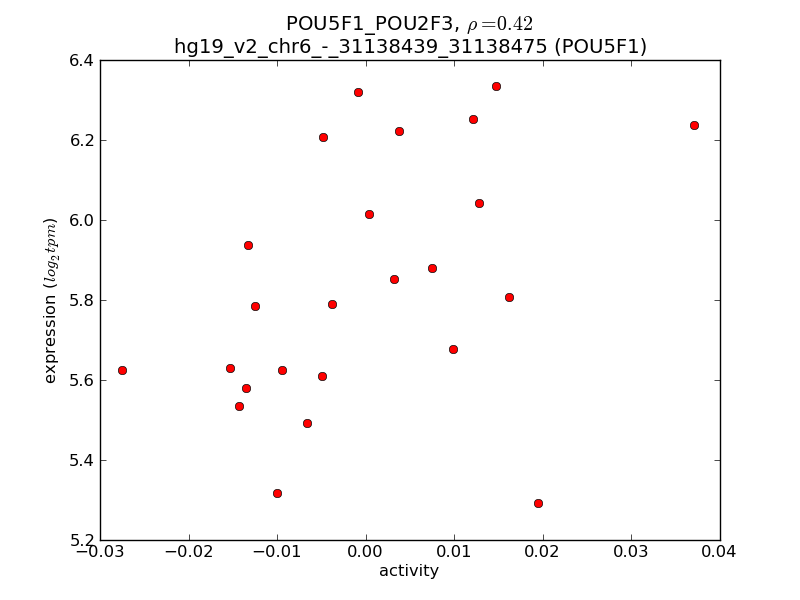
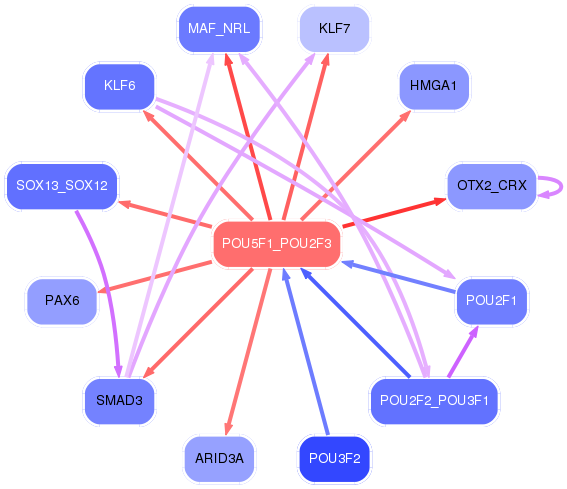
Motif ID: POU5F1_POU2F3
Z-value: 0.938
Transcription factors associated with POU5F1_POU2F3:
| Gene Symbol | Entrez ID | Gene Name |
|---|---|---|
| POU2F3 | ENSG00000137709.5 | POU2F3 |
| POU5F1 | ENSG00000204531.11 | POU5F1 |
Activity-expression correlation:
| Gene Symbol | Promoter | Pearson corr. coef. | P-value | Plot |
|---|---|---|---|---|
| POU2F3 | hg19_v2_chr11_+_120107344_120107351 | -0.62 | 1.3e-03 | Click! |
| POU5F1 | hg19_v2_chr6_-_31138439_31138475 | 0.42 | 3.9e-02 | Click! |

Top targets:
Gene overrepresentation in biological_process category:
| Log-likelihood per target | Total log-likelihood | Term | Description |
|---|---|---|---|
| 1.0 | 3.0 | GO:0060557 | positive regulation of vitamin metabolic process(GO:0046136) positive regulation of vitamin D biosynthetic process(GO:0060557) positive regulation of calcidiol 1-monooxygenase activity(GO:0060559) |
| 0.4 | 2.2 | GO:0032468 | Golgi calcium ion homeostasis(GO:0032468) |
| 0.4 | 1.8 | GO:0003322 | pancreatic A cell development(GO:0003322) |
| 0.4 | 1.8 | GO:0018101 | protein citrullination(GO:0018101) histone citrullination(GO:0036414) |
| 0.3 | 1.6 | GO:0018364 | peptidyl-glutamine methylation(GO:0018364) |
| 0.3 | 1.2 | GO:0033031 | positive regulation of neutrophil apoptotic process(GO:0033031) |
| 0.3 | 0.9 | GO:0007057 | spindle assembly involved in female meiosis I(GO:0007057) positive regulation of oocyte maturation(GO:1900195) |
| 0.3 | 1.1 | GO:0036269 | swimming behavior(GO:0036269) |
| 0.3 | 20.1 | GO:0018149 | peptide cross-linking(GO:0018149) |
| 0.3 | 0.8 | GO:0060279 | regulation of ovulation(GO:0060278) positive regulation of ovulation(GO:0060279) |
| 0.2 | 0.7 | GO:1903225 | negative regulation of endodermal cell differentiation(GO:1903225) |
| 0.2 | 0.7 | GO:0009786 | regulation of asymmetric cell division(GO:0009786) |
| 0.2 | 0.7 | GO:1902534 | single-organism membrane invagination(GO:1902534) |
| 0.2 | 1.8 | GO:0036486 | trunk segmentation(GO:0035290) trunk neural crest cell migration(GO:0036484) ventral trunk neural crest cell migration(GO:0036486) |
| 0.2 | 0.9 | GO:0033123 | positive regulation of cyclic nucleotide catabolic process(GO:0030807) positive regulation of cAMP catabolic process(GO:0030822) positive regulation of purine nucleotide catabolic process(GO:0033123) |
| 0.2 | 0.4 | GO:0002581 | negative regulation of antigen processing and presentation of peptide or polysaccharide antigen via MHC class II(GO:0002581) |
| 0.2 | 1.0 | GO:0061767 | negative regulation of lung blood pressure(GO:0061767) |
| 0.2 | 1.0 | GO:1904075 | trophectodermal cell proliferation(GO:0001834) regulation of trophectodermal cell proliferation(GO:1904073) positive regulation of trophectodermal cell proliferation(GO:1904075) |
| 0.2 | 1.0 | GO:0048850 | hypophysis morphogenesis(GO:0048850) |
| 0.2 | 0.8 | GO:2000427 | positive regulation of apoptotic cell clearance(GO:2000427) |
| 0.2 | 0.8 | GO:0035026 | leading edge cell differentiation(GO:0035026) |
| 0.2 | 0.8 | GO:0002879 | positive regulation of acute inflammatory response to non-antigenic stimulus(GO:0002879) |
| 0.2 | 1.0 | GO:1902261 | positive regulation of delayed rectifier potassium channel activity(GO:1902261) |
| 0.2 | 1.0 | GO:0006003 | fructose 2,6-bisphosphate metabolic process(GO:0006003) |
| 0.2 | 1.4 | GO:2000609 | regulation of thyroid hormone generation(GO:2000609) |
| 0.2 | 1.3 | GO:0007598 | blood coagulation, extrinsic pathway(GO:0007598) |
| 0.2 | 1.3 | GO:0010767 | regulation of transcription from RNA polymerase II promoter in response to UV-induced DNA damage(GO:0010767) |
| 0.2 | 1.9 | GO:0036155 | acylglycerol acyl-chain remodeling(GO:0036155) |
| 0.2 | 0.2 | GO:0044843 | G1/S transition of mitotic cell cycle(GO:0000082) cell cycle G1/S phase transition(GO:0044843) |
| 0.2 | 0.6 | GO:0032416 | negative regulation of sodium:proton antiporter activity(GO:0032416) musculoskeletal movement, spinal reflex action(GO:0050883) |
| 0.2 | 0.6 | GO:0010982 | regulation of high-density lipoprotein particle clearance(GO:0010982) |
| 0.1 | 3.4 | GO:0045717 | negative regulation of fatty acid biosynthetic process(GO:0045717) |
| 0.1 | 1.1 | GO:2000543 | positive regulation of gastrulation(GO:2000543) |
| 0.1 | 0.4 | GO:0019442 | tryptophan catabolic process to acetyl-CoA(GO:0019442) |
| 0.1 | 0.7 | GO:0090402 | oncogene-induced cell senescence(GO:0090402) |
| 0.1 | 0.5 | GO:0019860 | transformation of host cell by virus(GO:0019087) uracil metabolic process(GO:0019860) |
| 0.1 | 1.2 | GO:0034983 | peptidyl-lysine deacetylation(GO:0034983) |
| 0.1 | 0.5 | GO:0044837 | assembly of actomyosin apparatus involved in cytokinesis(GO:0000912) actomyosin contractile ring assembly(GO:0000915) actomyosin contractile ring organization(GO:0044837) |
| 0.1 | 0.4 | GO:0010165 | response to X-ray(GO:0010165) |
| 0.1 | 0.4 | GO:1903070 | negative regulation of ER-associated ubiquitin-dependent protein catabolic process(GO:1903070) |
| 0.1 | 0.4 | GO:0003050 | regulation of systemic arterial blood pressure by atrial natriuretic peptide(GO:0003050) |
| 0.1 | 0.8 | GO:2000334 | blood microparticle formation(GO:0072564) regulation of blood microparticle formation(GO:2000332) positive regulation of blood microparticle formation(GO:2000334) |
| 0.1 | 0.4 | GO:0007412 | axon target recognition(GO:0007412) |
| 0.1 | 0.7 | GO:0030035 | microspike assembly(GO:0030035) |
| 0.1 | 0.4 | GO:0021913 | regulation of transcription from RNA polymerase II promoter involved in ventral spinal cord interneuron specification(GO:0021913) |
| 0.1 | 0.9 | GO:0003065 | positive regulation of heart rate by epinephrine(GO:0003065) |
| 0.1 | 0.7 | GO:0071105 | response to interleukin-11(GO:0071105) |
| 0.1 | 1.7 | GO:0033004 | negative regulation of mast cell activation(GO:0033004) |
| 0.1 | 0.4 | GO:1905167 | positive regulation of lysosomal protein catabolic process(GO:1905167) |
| 0.1 | 0.6 | GO:0007525 | somatic muscle development(GO:0007525) |
| 0.1 | 1.2 | GO:0030223 | neutrophil differentiation(GO:0030223) |
| 0.1 | 0.4 | GO:0009257 | 10-formyltetrahydrofolate biosynthetic process(GO:0009257) |
| 0.1 | 4.3 | GO:0001580 | detection of chemical stimulus involved in sensory perception of bitter taste(GO:0001580) |
| 0.1 | 0.5 | GO:0030047 | actin modification(GO:0030047) |
| 0.1 | 0.5 | GO:0016321 | female meiosis chromosome segregation(GO:0016321) |
| 0.1 | 0.4 | GO:0014846 | esophagus smooth muscle contraction(GO:0014846) |
| 0.1 | 1.0 | GO:0070561 | vitamin D receptor signaling pathway(GO:0070561) |
| 0.1 | 0.3 | GO:0014740 | negative regulation of muscle hyperplasia(GO:0014740) |
| 0.1 | 0.4 | GO:0036510 | trimming of terminal mannose on C branch(GO:0036510) |
| 0.1 | 0.3 | GO:0019242 | methylglyoxal biosynthetic process(GO:0019242) |
| 0.1 | 0.7 | GO:1905150 | regulation of voltage-gated sodium channel activity(GO:1905150) |
| 0.1 | 0.6 | GO:1902714 | negative regulation of interferon-gamma secretion(GO:1902714) |
| 0.1 | 2.6 | GO:0009235 | cobalamin metabolic process(GO:0009235) |
| 0.1 | 0.5 | GO:0006177 | GMP biosynthetic process(GO:0006177) |
| 0.1 | 13.5 | GO:0006958 | complement activation, classical pathway(GO:0006958) |
| 0.1 | 1.2 | GO:0019885 | antigen processing and presentation of endogenous peptide antigen via MHC class I(GO:0019885) |
| 0.1 | 0.3 | GO:0071484 | response to high light intensity(GO:0009644) cellular response to light intensity(GO:0071484) |
| 0.1 | 0.3 | GO:2000230 | negative regulation of pancreatic stellate cell proliferation(GO:2000230) |
| 0.1 | 0.5 | GO:0070995 | NADPH oxidation(GO:0070995) |
| 0.1 | 0.5 | GO:0060385 | axonogenesis involved in innervation(GO:0060385) |
| 0.1 | 0.7 | GO:0070236 | negative regulation of activation-induced cell death of T cells(GO:0070236) |
| 0.1 | 0.3 | GO:0021648 | vestibulocochlear nerve morphogenesis(GO:0021648) vestibulocochlear nerve formation(GO:0021650) |
| 0.1 | 0.4 | GO:0036324 | vascular endothelial growth factor receptor-2 signaling pathway(GO:0036324) negative regulation of phosphatidylinositol 3-kinase activity(GO:0043553) negative regulation of vascular endothelial growth factor signaling pathway(GO:1900747) |
| 0.1 | 0.7 | GO:1902746 | regulation of lens fiber cell differentiation(GO:1902746) |
| 0.1 | 0.2 | GO:0003241 | growth involved in heart morphogenesis(GO:0003241) |
| 0.1 | 0.5 | GO:0002457 | T cell antigen processing and presentation(GO:0002457) |
| 0.1 | 2.6 | GO:0070306 | lens fiber cell differentiation(GO:0070306) |
| 0.1 | 0.2 | GO:1903301 | positive regulation of glucokinase activity(GO:0033133) positive regulation of hexokinase activity(GO:1903301) |
| 0.1 | 0.4 | GO:0090131 | mesenchyme migration(GO:0090131) |
| 0.1 | 0.2 | GO:0006597 | spermine biosynthetic process(GO:0006597) |
| 0.1 | 2.6 | GO:0060325 | face morphogenesis(GO:0060325) |
| 0.1 | 0.4 | GO:0033353 | S-adenosylmethionine cycle(GO:0033353) |
| 0.1 | 0.2 | GO:0035552 | oxidative single-stranded DNA demethylation(GO:0035552) |
| 0.1 | 0.4 | GO:2000402 | negative regulation of lymphocyte migration(GO:2000402) |
| 0.1 | 0.5 | GO:1902202 | regulation of hepatocyte growth factor receptor signaling pathway(GO:1902202) |
| 0.1 | 0.4 | GO:0055064 | chloride ion homeostasis(GO:0055064) |
| 0.1 | 1.4 | GO:0006751 | glutathione catabolic process(GO:0006751) |
| 0.1 | 0.5 | GO:0010519 | negative regulation of phospholipase activity(GO:0010519) |
| 0.1 | 0.3 | GO:0008065 | establishment of blood-nerve barrier(GO:0008065) |
| 0.1 | 0.1 | GO:0035990 | tendon cell differentiation(GO:0035990) tendon formation(GO:0035992) |
| 0.1 | 0.3 | GO:0090158 | endoplasmic reticulum membrane organization(GO:0090158) |
| 0.1 | 0.3 | GO:0046013 | regulation of T cell homeostatic proliferation(GO:0046013) |
| 0.1 | 0.3 | GO:0032625 | interleukin-21 production(GO:0032625) interleukin-21 secretion(GO:0072619) |
| 0.1 | 0.4 | GO:1900063 | regulation of peroxisome organization(GO:1900063) |
| 0.1 | 0.2 | GO:0060474 | positive regulation of sperm motility involved in capacitation(GO:0060474) |
| 0.1 | 3.7 | GO:0000413 | protein peptidyl-prolyl isomerization(GO:0000413) |
| 0.1 | 0.2 | GO:0046081 | dUTP metabolic process(GO:0046080) dUTP catabolic process(GO:0046081) |
| 0.1 | 0.2 | GO:0021797 | forebrain anterior/posterior pattern specification(GO:0021797) |
| 0.1 | 0.3 | GO:2000639 | regulation of SREBP signaling pathway(GO:2000638) negative regulation of SREBP signaling pathway(GO:2000639) |
| 0.1 | 0.2 | GO:0035378 | carbon dioxide transmembrane transport(GO:0035378) |
| 0.1 | 0.1 | GO:0005984 | maltose metabolic process(GO:0000023) disaccharide metabolic process(GO:0005984) |
| 0.1 | 0.2 | GO:0021773 | striatal medium spiny neuron differentiation(GO:0021773) |
| 0.1 | 0.5 | GO:1904885 | beta-catenin destruction complex assembly(GO:1904885) |
| 0.1 | 4.0 | GO:0044364 | killing of cells of other organism(GO:0031640) disruption of cells of other organism(GO:0044364) |
| 0.1 | 0.7 | GO:0006957 | complement activation, alternative pathway(GO:0006957) |
| 0.1 | 0.3 | GO:0097211 | response to gonadotropin-releasing hormone(GO:0097210) cellular response to gonadotropin-releasing hormone(GO:0097211) |
| 0.1 | 0.7 | GO:0006657 | CDP-choline pathway(GO:0006657) |
| 0.1 | 0.1 | GO:0071288 | cellular response to mercury ion(GO:0071288) |
| 0.1 | 0.2 | GO:0021965 | spinal cord ventral commissure morphogenesis(GO:0021965) |
| 0.1 | 0.2 | GO:2001245 | regulation of phosphatidylcholine biosynthetic process(GO:2001245) |
| 0.1 | 0.2 | GO:0098886 | modification of dendritic spine(GO:0098886) |
| 0.1 | 0.7 | GO:0033601 | positive regulation of mammary gland epithelial cell proliferation(GO:0033601) |
| 0.1 | 0.1 | GO:0050818 | regulation of coagulation(GO:0050818) |
| 0.1 | 0.3 | GO:0006642 | triglyceride mobilization(GO:0006642) |
| 0.1 | 1.1 | GO:0002544 | chronic inflammatory response(GO:0002544) |
| 0.1 | 1.1 | GO:0030322 | stabilization of membrane potential(GO:0030322) |
| 0.1 | 0.3 | GO:0034392 | negative regulation of smooth muscle cell apoptotic process(GO:0034392) |
| 0.1 | 0.3 | GO:0038031 | non-canonical Wnt signaling pathway via JNK cascade(GO:0038031) |
| 0.1 | 0.3 | GO:0050913 | sensory perception of bitter taste(GO:0050913) |
| 0.1 | 0.1 | GO:1900226 | negative regulation of NLRP3 inflammasome complex assembly(GO:1900226) |
| 0.1 | 0.9 | GO:0090129 | positive regulation of synapse maturation(GO:0090129) |
| 0.1 | 0.5 | GO:2000601 | positive regulation of Arp2/3 complex-mediated actin nucleation(GO:2000601) |
| 0.1 | 0.2 | GO:2000547 | regulation of dendritic cell dendrite assembly(GO:2000547) |
| 0.1 | 0.2 | GO:0006970 | response to osmotic stress(GO:0006970) |
| 0.1 | 0.3 | GO:0036015 | detoxification of copper ion(GO:0010273) response to interleukin-3(GO:0036015) cellular response to interleukin-3(GO:0036016) stress response to copper ion(GO:1990169) |
| 0.1 | 0.3 | GO:0035881 | amacrine cell differentiation(GO:0035881) |
| 0.1 | 0.2 | GO:2000870 | positive regulation of female gonad development(GO:2000196) regulation of progesterone secretion(GO:2000870) |
| 0.0 | 0.2 | GO:0018076 | N-terminal peptidyl-lysine acetylation(GO:0018076) ascending aorta development(GO:0035905) ascending aorta morphogenesis(GO:0035910) |
| 0.0 | 0.4 | GO:1902866 | regulation of retina development in camera-type eye(GO:1902866) |
| 0.0 | 0.1 | GO:0060940 | epithelial to mesenchymal transition involved in cardiac fibroblast development(GO:0060940) |
| 0.0 | 2.0 | GO:0006607 | NLS-bearing protein import into nucleus(GO:0006607) |
| 0.0 | 0.2 | GO:1901097 | negative regulation of autophagosome maturation(GO:1901097) |
| 0.0 | 0.9 | GO:0071850 | mitotic cell cycle arrest(GO:0071850) |
| 0.0 | 0.5 | GO:0070970 | interleukin-2 secretion(GO:0070970) |
| 0.0 | 0.4 | GO:0031120 | snRNA pseudouridine synthesis(GO:0031120) |
| 0.0 | 0.5 | GO:0046325 | negative regulation of glucose import(GO:0046325) |
| 0.0 | 0.2 | GO:1900122 | positive regulation of receptor binding(GO:1900122) |
| 0.0 | 0.1 | GO:0042270 | protection from natural killer cell mediated cytotoxicity(GO:0042270) |
| 0.0 | 0.2 | GO:1903285 | negative regulation of dopamine uptake involved in synaptic transmission(GO:0051585) norepinephrine uptake(GO:0051620) regulation of norepinephrine uptake(GO:0051621) negative regulation of norepinephrine uptake(GO:0051622) negative regulation of catecholamine uptake involved in synaptic transmission(GO:0051945) regulation of glutathione peroxidase activity(GO:1903282) positive regulation of glutathione peroxidase activity(GO:1903284) positive regulation of hydrogen peroxide catabolic process(GO:1903285) positive regulation of peroxidase activity(GO:2000470) |
| 0.0 | 7.4 | GO:0002377 | immunoglobulin production(GO:0002377) |
| 0.0 | 0.4 | GO:0099566 | regulation of postsynaptic cytosolic calcium ion concentration(GO:0099566) |
| 0.0 | 0.1 | GO:1900158 | positive regulation of osteoclast proliferation(GO:0090290) regulation of bone mineralization involved in bone maturation(GO:1900157) negative regulation of bone mineralization involved in bone maturation(GO:1900158) |
| 0.0 | 0.2 | GO:0048631 | regulation of skeletal muscle tissue growth(GO:0048631) |
| 0.0 | 1.3 | GO:0071498 | cellular response to fluid shear stress(GO:0071498) |
| 0.0 | 0.2 | GO:0035519 | protein K29-linked ubiquitination(GO:0035519) |
| 0.0 | 0.1 | GO:0045348 | positive regulation of MHC class II biosynthetic process(GO:0045348) |
| 0.0 | 0.2 | GO:0046671 | negative regulation of cellular pH reduction(GO:0032848) CD8-positive, alpha-beta T cell lineage commitment(GO:0043375) negative regulation of retinal cell programmed cell death(GO:0046671) |
| 0.0 | 2.4 | GO:0035307 | positive regulation of dephosphorylation(GO:0035306) positive regulation of protein dephosphorylation(GO:0035307) |
| 0.0 | 0.1 | GO:0061743 | motor learning(GO:0061743) |
| 0.0 | 0.4 | GO:0042905 | 9-cis-retinoic acid biosynthetic process(GO:0042904) 9-cis-retinoic acid metabolic process(GO:0042905) |
| 0.0 | 0.4 | GO:0070212 | protein poly-ADP-ribosylation(GO:0070212) |
| 0.0 | 0.6 | GO:1904778 | regulation of protein localization to cell cortex(GO:1904776) positive regulation of protein localization to cell cortex(GO:1904778) |
| 0.0 | 0.4 | GO:0051013 | microtubule severing(GO:0051013) |
| 0.0 | 0.7 | GO:0033234 | negative regulation of protein sumoylation(GO:0033234) |
| 0.0 | 0.4 | GO:0010724 | regulation of definitive erythrocyte differentiation(GO:0010724) |
| 0.0 | 0.5 | GO:0052696 | flavonoid glucuronidation(GO:0052696) xenobiotic glucuronidation(GO:0052697) |
| 0.0 | 0.8 | GO:0033141 | positive regulation of peptidyl-serine phosphorylation of STAT protein(GO:0033141) |
| 0.0 | 0.3 | GO:0090043 | tubulin deacetylation(GO:0090042) regulation of tubulin deacetylation(GO:0090043) |
| 0.0 | 0.1 | GO:0051086 | chaperone mediated protein folding independent of cofactor(GO:0051086) |
| 0.0 | 0.2 | GO:0045664 | regulation of neuron differentiation(GO:0045664) |
| 0.0 | 0.2 | GO:0048133 | germ-line stem cell division(GO:0042078) male germ-line stem cell asymmetric division(GO:0048133) regulation of branching involved in mammary gland duct morphogenesis(GO:0060762) germline stem cell asymmetric division(GO:0098728) |
| 0.0 | 0.2 | GO:0061086 | negative regulation of histone H3-K27 methylation(GO:0061086) |
| 0.0 | 0.9 | GO:0008053 | mitochondrial fusion(GO:0008053) |
| 0.0 | 0.2 | GO:2000158 | positive regulation of ubiquitin-specific protease activity(GO:2000158) |
| 0.0 | 0.2 | GO:0021785 | branchiomotor neuron axon guidance(GO:0021785) |
| 0.0 | 0.1 | GO:1903028 | regulation of opsonization(GO:1903027) positive regulation of opsonization(GO:1903028) |
| 0.0 | 0.1 | GO:0060084 | synaptic transmission involved in micturition(GO:0060084) |
| 0.0 | 0.4 | GO:0090091 | positive regulation of extracellular matrix disassembly(GO:0090091) |
| 0.0 | 0.3 | GO:0070424 | regulation of nucleotide-binding oligomerization domain containing signaling pathway(GO:0070424) |
| 0.0 | 0.4 | GO:0033623 | regulation of integrin activation(GO:0033623) |
| 0.0 | 0.1 | GO:0048250 | mitochondrial iron ion transport(GO:0048250) |
| 0.0 | 0.7 | GO:0031033 | myosin filament organization(GO:0031033) |
| 0.0 | 0.2 | GO:0002329 | pre-B cell differentiation(GO:0002329) |
| 0.0 | 0.5 | GO:0001574 | ganglioside biosynthetic process(GO:0001574) |
| 0.0 | 0.0 | GO:1902227 | negative regulation of macrophage colony-stimulating factor signaling pathway(GO:1902227) negative regulation of response to macrophage colony-stimulating factor(GO:1903970) negative regulation of cellular response to macrophage colony-stimulating factor stimulus(GO:1903973) regulation of microglial cell activation(GO:1903978) |
| 0.0 | 0.7 | GO:0007216 | G-protein coupled glutamate receptor signaling pathway(GO:0007216) |
| 0.0 | 0.5 | GO:0034501 | protein localization to kinetochore(GO:0034501) |
| 0.0 | 0.2 | GO:0048023 | positive regulation of melanin biosynthetic process(GO:0048023) positive regulation of secondary metabolite biosynthetic process(GO:1900378) |
| 0.0 | 0.2 | GO:0060157 | urinary bladder development(GO:0060157) |
| 0.0 | 0.2 | GO:0061737 | leukotriene signaling pathway(GO:0061737) |
| 0.0 | 0.0 | GO:0060775 | mediolateral intercalation(GO:0060031) planar cell polarity pathway involved in gastrula mediolateral intercalation(GO:0060775) |
| 0.0 | 0.3 | GO:2000821 | regulation of grooming behavior(GO:2000821) |
| 0.0 | 0.4 | GO:2000659 | regulation of interleukin-1-mediated signaling pathway(GO:2000659) |
| 0.0 | 0.1 | GO:0034343 | type III interferon production(GO:0034343) regulation of type III interferon production(GO:0034344) positive regulation of interferon-beta secretion(GO:0035549) |
| 0.0 | 0.1 | GO:0072268 | pattern specification involved in metanephros development(GO:0072268) |
| 0.0 | 0.7 | GO:0045116 | protein neddylation(GO:0045116) |
| 0.0 | 0.4 | GO:0071803 | positive regulation of podosome assembly(GO:0071803) |
| 0.0 | 0.5 | GO:0030277 | maintenance of gastrointestinal epithelium(GO:0030277) |
| 0.0 | 0.2 | GO:2001256 | regulation of store-operated calcium entry(GO:2001256) |
| 0.0 | 0.1 | GO:1902626 | assembly of large subunit precursor of preribosome(GO:1902626) |
| 0.0 | 0.1 | GO:0061386 | closure of optic fissure(GO:0061386) |
| 0.0 | 0.1 | GO:0000432 | regulation of transcription from RNA polymerase II promoter by glucose(GO:0000430) positive regulation of transcription from RNA polymerase II promoter by glucose(GO:0000432) |
| 0.0 | 1.0 | GO:0048268 | clathrin coat assembly(GO:0048268) |
| 0.0 | 0.2 | GO:0032074 | negative regulation of nuclease activity(GO:0032074) |
| 0.0 | 0.2 | GO:0031914 | negative regulation of synaptic plasticity(GO:0031914) |
| 0.0 | 0.2 | GO:0002082 | regulation of oxidative phosphorylation(GO:0002082) |
| 0.0 | 0.1 | GO:0042357 | thiamine diphosphate metabolic process(GO:0042357) |
| 0.0 | 0.2 | GO:0044339 | canonical Wnt signaling pathway involved in osteoblast differentiation(GO:0044339) |
| 0.0 | 0.1 | GO:0021524 | visceral motor neuron differentiation(GO:0021524) |
| 0.0 | 0.2 | GO:0044806 | G-quadruplex DNA unwinding(GO:0044806) |
| 0.0 | 4.0 | GO:0006334 | nucleosome assembly(GO:0006334) |
| 0.0 | 0.3 | GO:0016127 | cholesterol catabolic process(GO:0006707) sterol catabolic process(GO:0016127) |
| 0.0 | 0.1 | GO:0021564 | vagus nerve development(GO:0021564) |
| 0.0 | 0.3 | GO:0060394 | regulation of SMAD protein complex assembly(GO:0010990) negative regulation of SMAD protein complex assembly(GO:0010991) negative regulation of pathway-restricted SMAD protein phosphorylation(GO:0060394) |
| 0.0 | 0.4 | GO:0046349 | amino sugar biosynthetic process(GO:0046349) |
| 0.0 | 0.1 | GO:0042271 | susceptibility to natural killer cell mediated cytotoxicity(GO:0042271) |
| 0.0 | 0.2 | GO:0019227 | neuronal action potential propagation(GO:0019227) detection of mechanical stimulus involved in sensory perception of pain(GO:0050966) action potential propagation(GO:0098870) |
| 0.0 | 0.6 | GO:0006853 | carnitine shuttle(GO:0006853) |
| 0.0 | 1.5 | GO:0060395 | SMAD protein signal transduction(GO:0060395) |
| 0.0 | 0.2 | GO:0038129 | directional guidance of interneurons involved in migration from the subpallium to the cortex(GO:0021840) chemorepulsion involved in interneuron migration from the subpallium to the cortex(GO:0021842) ERBB3 signaling pathway(GO:0038129) |
| 0.0 | 0.2 | GO:0010891 | negative regulation of sequestering of triglyceride(GO:0010891) |
| 0.0 | 0.0 | GO:0006041 | glucosamine metabolic process(GO:0006041) |
| 0.0 | 0.1 | GO:0086097 | phospholipase C-activating angiotensin-activated signaling pathway(GO:0086097) |
| 0.0 | 0.1 | GO:0060065 | uterus development(GO:0060065) |
| 0.0 | 0.1 | GO:0036229 | glutamine secretion(GO:0010585) L-glutamine import(GO:0036229) L-glutamine import into cell(GO:1903803) |
| 0.0 | 0.2 | GO:0008228 | opsonization(GO:0008228) |
| 0.0 | 0.2 | GO:0030307 | positive regulation of cell growth(GO:0030307) |
| 0.0 | 0.1 | GO:0036018 | response to erythropoietin(GO:0036017) cellular response to erythropoietin(GO:0036018) |
| 0.0 | 0.4 | GO:0046602 | regulation of mitotic centrosome separation(GO:0046602) |
| 0.0 | 0.6 | GO:0030033 | microvillus assembly(GO:0030033) |
| 0.0 | 0.2 | GO:0046618 | drug export(GO:0046618) |
| 0.0 | 0.2 | GO:0015939 | pantothenate metabolic process(GO:0015939) |
| 0.0 | 0.1 | GO:0046098 | histone H3-K4 demethylation(GO:0034720) guanine metabolic process(GO:0046098) response to fungicide(GO:0060992) |
| 0.0 | 0.1 | GO:0006226 | dUMP biosynthetic process(GO:0006226) |
| 0.0 | 0.2 | GO:0006776 | vitamin A metabolic process(GO:0006776) |
| 0.0 | 0.1 | GO:1900383 | regulation of synaptic plasticity by receptor localization to synapse(GO:1900383) |
| 0.0 | 0.2 | GO:0086073 | bundle of His cell-Purkinje myocyte adhesion involved in cell communication(GO:0086073) |
| 0.0 | 0.4 | GO:0006833 | water transport(GO:0006833) |
| 0.0 | 0.5 | GO:0045063 | T-helper 1 cell differentiation(GO:0045063) |
| 0.0 | 0.1 | GO:0015862 | uridine transport(GO:0015862) |
| 0.0 | 0.2 | GO:0003360 | brainstem development(GO:0003360) |
| 0.0 | 0.1 | GO:0035281 | pre-miRNA export from nucleus(GO:0035281) |
| 0.0 | 0.2 | GO:0015712 | hexose phosphate transport(GO:0015712) glucose-6-phosphate transport(GO:0015760) |
| 0.0 | 0.1 | GO:0046440 | L-lysine catabolic process to acetyl-CoA(GO:0019474) L-lysine catabolic process(GO:0019477) L-lysine metabolic process(GO:0046440) |
| 0.0 | 0.0 | GO:0002856 | natural killer cell tolerance induction(GO:0002519) regulation of tolerance induction dependent upon immune response(GO:0002652) negative regulation of response to tumor cell(GO:0002835) negative regulation of immune response to tumor cell(GO:0002838) negative regulation of natural killer cell mediated immune response to tumor cell(GO:0002856) negative regulation of natural killer cell mediated cytotoxicity directed against tumor cell target(GO:0002859) granulocyte colony-stimulating factor production(GO:0071611) regulation of granulocyte colony-stimulating factor production(GO:0071655) |
| 0.0 | 0.2 | GO:0071233 | cellular response to leucine(GO:0071233) |
| 0.0 | 0.1 | GO:0051012 | microtubule sliding(GO:0051012) |
| 0.0 | 0.2 | GO:0033622 | integrin activation(GO:0033622) |
| 0.0 | 0.3 | GO:0043383 | negative T cell selection(GO:0043383) |
| 0.0 | 1.6 | GO:0045071 | negative regulation of viral genome replication(GO:0045071) |
| 0.0 | 0.2 | GO:1901843 | positive regulation of high voltage-gated calcium channel activity(GO:1901843) |
| 0.0 | 0.3 | GO:1902969 | mitotic DNA replication(GO:1902969) |
| 0.0 | 0.1 | GO:0015870 | acetylcholine transport(GO:0015870) |
| 0.0 | 0.3 | GO:0015937 | coenzyme A biosynthetic process(GO:0015937) |
| 0.0 | 0.4 | GO:0007205 | protein kinase C-activating G-protein coupled receptor signaling pathway(GO:0007205) |
| 0.0 | 0.1 | GO:0048840 | otolith development(GO:0048840) |
| 0.0 | 0.2 | GO:0042756 | drinking behavior(GO:0042756) |
| 0.0 | 0.1 | GO:0043353 | enucleate erythrocyte differentiation(GO:0043353) |
| 0.0 | 0.1 | GO:2000483 | negative regulation of interleukin-8 secretion(GO:2000483) |
| 0.0 | 0.2 | GO:0046886 | positive regulation of hormone metabolic process(GO:0032352) positive regulation of hormone biosynthetic process(GO:0046886) |
| 0.0 | 0.1 | GO:1901876 | regulation of calcium ion binding(GO:1901876) negative regulation of calcium ion binding(GO:1901877) |
| 0.0 | 0.1 | GO:0046005 | positive regulation of circadian sleep/wake cycle, REM sleep(GO:0046005) |
| 0.0 | 0.7 | GO:0045747 | positive regulation of Notch signaling pathway(GO:0045747) |
| 0.0 | 0.9 | GO:0035235 | ionotropic glutamate receptor signaling pathway(GO:0035235) |
| 0.0 | 0.1 | GO:0090258 | negative regulation of mitochondrial fission(GO:0090258) |
| 0.0 | 0.0 | GO:0034182 | regulation of maintenance of sister chromatid cohesion(GO:0034091) positive regulation of maintenance of sister chromatid cohesion(GO:0034093) regulation of maintenance of mitotic sister chromatid cohesion(GO:0034182) positive regulation of maintenance of mitotic sister chromatid cohesion(GO:0034184) |
| 0.0 | 0.4 | GO:0048665 | neuron fate specification(GO:0048665) |
| 0.0 | 1.7 | GO:0050911 | detection of chemical stimulus involved in sensory perception of smell(GO:0050911) |
| 0.0 | 0.2 | GO:1900029 | positive regulation of ruffle assembly(GO:1900029) |
| 0.0 | 0.6 | GO:0022400 | regulation of rhodopsin mediated signaling pathway(GO:0022400) |
| 0.0 | 0.3 | GO:0048704 | embryonic skeletal system morphogenesis(GO:0048704) |
| 0.0 | 0.2 | GO:0072498 | embryonic skeletal joint development(GO:0072498) |
| 0.0 | 0.1 | GO:0046856 | phosphatidylinositol dephosphorylation(GO:0046856) |
| 0.0 | 0.2 | GO:0048387 | negative regulation of retinoic acid receptor signaling pathway(GO:0048387) |
| 0.0 | 0.4 | GO:1902857 | positive regulation of nonmotile primary cilium assembly(GO:1902857) |
| 0.0 | 0.1 | GO:0006089 | lactate metabolic process(GO:0006089) |
| 0.0 | 0.4 | GO:0035729 | cellular response to hepatocyte growth factor stimulus(GO:0035729) hepatocyte growth factor receptor signaling pathway(GO:0048012) |
| 0.0 | 0.1 | GO:0034447 | very-low-density lipoprotein particle clearance(GO:0034447) |
| 0.0 | 0.4 | GO:0008284 | positive regulation of cell proliferation(GO:0008284) |
| 0.0 | 0.1 | GO:0007256 | activation of JNKK activity(GO:0007256) |
| 0.0 | 0.2 | GO:0060340 | positive regulation of type I interferon-mediated signaling pathway(GO:0060340) |
| 0.0 | 0.2 | GO:0048534 | hematopoietic or lymphoid organ development(GO:0048534) |
| 0.0 | 0.3 | GO:0034605 | cellular response to heat(GO:0034605) |
| 0.0 | 0.1 | GO:1903984 | rhythmic synaptic transmission(GO:0060024) negative regulation of ribosome biogenesis(GO:0090071) regulation of TRAIL-activated apoptotic signaling pathway(GO:1903121) positive regulation of TRAIL-activated apoptotic signaling pathway(GO:1903984) |
| 0.0 | 0.0 | GO:0071335 | submandibular salivary gland formation(GO:0060661) hair follicle cell proliferation(GO:0071335) regulation of hair follicle cell proliferation(GO:0071336) positive regulation of hair follicle cell proliferation(GO:0071338) |
| 0.0 | 0.2 | GO:0030091 | protein repair(GO:0030091) |
| 0.0 | 0.1 | GO:0017196 | N-terminal peptidyl-methionine acetylation(GO:0017196) |
| 0.0 | 0.4 | GO:2000479 | regulation of cAMP-dependent protein kinase activity(GO:2000479) |
| 0.0 | 1.7 | GO:0070125 | mitochondrial translational elongation(GO:0070125) |
| 0.0 | 0.1 | GO:0016255 | attachment of GPI anchor to protein(GO:0016255) |
| 0.0 | 0.5 | GO:0051491 | positive regulation of filopodium assembly(GO:0051491) |
| 0.0 | 0.3 | GO:0006107 | oxaloacetate metabolic process(GO:0006107) |
| 0.0 | 0.3 | GO:0006388 | tRNA splicing, via endonucleolytic cleavage and ligation(GO:0006388) |
| 0.0 | 0.0 | GO:0043696 | dedifferentiation(GO:0043696) cell dedifferentiation(GO:0043697) |
| 0.0 | 0.8 | GO:0048146 | positive regulation of fibroblast proliferation(GO:0048146) |
| 0.0 | 0.2 | GO:0007625 | grooming behavior(GO:0007625) |
| 0.0 | 0.0 | GO:1903244 | positive regulation of cardiac muscle adaptation(GO:0010615) positive regulation of cardiac muscle hypertrophy in response to stress(GO:1903244) |
| 0.0 | 0.3 | GO:0051601 | exocyst localization(GO:0051601) |
| 0.0 | 0.2 | GO:0045040 | protein import into mitochondrial outer membrane(GO:0045040) |
| 0.0 | 0.1 | GO:0048263 | determination of dorsal identity(GO:0048263) |
| 0.0 | 0.2 | GO:0003298 | physiological muscle hypertrophy(GO:0003298) physiological cardiac muscle hypertrophy(GO:0003301) cell growth involved in cardiac muscle cell development(GO:0061049) |
| 0.0 | 0.6 | GO:0036075 | endochondral ossification(GO:0001958) replacement ossification(GO:0036075) |
| 0.0 | 0.1 | GO:0006294 | nucleotide-excision repair, preincision complex assembly(GO:0006294) |
| 0.0 | 2.0 | GO:0048813 | dendrite morphogenesis(GO:0048813) |
| 0.0 | 0.1 | GO:0042448 | progesterone metabolic process(GO:0042448) |
| 0.0 | 0.1 | GO:0002043 | blood vessel endothelial cell proliferation involved in sprouting angiogenesis(GO:0002043) |
| 0.0 | 0.2 | GO:0018298 | protein-chromophore linkage(GO:0018298) |
| 0.0 | 0.1 | GO:0002903 | negative regulation of B cell apoptotic process(GO:0002903) |
| 0.0 | 0.0 | GO:0001172 | transcription, RNA-templated(GO:0001172) |
| 0.0 | 0.0 | GO:0042560 | folic acid-containing compound catabolic process(GO:0009397) pteridine-containing compound catabolic process(GO:0042560) |
| 0.0 | 0.1 | GO:0035873 | lactate transport(GO:0015727) lactate transmembrane transport(GO:0035873) |
| 0.0 | 0.4 | GO:0007257 | activation of JUN kinase activity(GO:0007257) |
| 0.0 | 0.6 | GO:0010107 | potassium ion import(GO:0010107) |
| 0.0 | 0.3 | GO:0035589 | G-protein coupled purinergic nucleotide receptor signaling pathway(GO:0035589) |
| 0.0 | 0.1 | GO:0031915 | positive regulation of synaptic plasticity(GO:0031915) |
| 0.0 | 0.3 | GO:0006935 | chemotaxis(GO:0006935) taxis(GO:0042330) |
| 0.0 | 0.1 | GO:0048743 | positive regulation of skeletal muscle fiber development(GO:0048743) |
| 0.0 | 0.1 | GO:0010623 | programmed cell death involved in cell development(GO:0010623) |
| 0.0 | 0.1 | GO:0010989 | negative regulation of lipoprotein particle clearance(GO:0010985) negative regulation of low-density lipoprotein particle clearance(GO:0010989) |
| 0.0 | 0.2 | GO:0033189 | response to vitamin A(GO:0033189) |
| 0.0 | 0.1 | GO:0097475 | motor neuron migration(GO:0097475) |
| 0.0 | 0.2 | GO:0007084 | mitotic nuclear envelope reassembly(GO:0007084) |
| 0.0 | 0.0 | GO:0050713 | negative regulation of interleukin-1 secretion(GO:0050711) negative regulation of interleukin-1 beta secretion(GO:0050713) |
| 0.0 | 0.1 | GO:0030225 | macrophage differentiation(GO:0030225) |
| 0.0 | 0.1 | GO:0070365 | hepatocyte differentiation(GO:0070365) |
| 0.0 | 0.2 | GO:0001556 | oocyte maturation(GO:0001556) |
| 0.0 | 0.1 | GO:0038128 | ERBB2 signaling pathway(GO:0038128) |
| 0.0 | 0.1 | GO:0072396 | response to cell cycle checkpoint signaling(GO:0072396) response to DNA integrity checkpoint signaling(GO:0072402) response to DNA damage checkpoint signaling(GO:0072423) regulation of apoptotic DNA fragmentation(GO:1902510) regulation of DNA catabolic process(GO:1903624) |
| 0.0 | 0.4 | GO:0018146 | keratan sulfate biosynthetic process(GO:0018146) |
| 0.0 | 0.0 | GO:0035880 | embryonic nail plate morphogenesis(GO:0035880) |
| 0.0 | 0.3 | GO:0042347 | negative regulation of NF-kappaB import into nucleus(GO:0042347) |
| 0.0 | 0.1 | GO:0006682 | galactosylceramide biosynthetic process(GO:0006682) galactolipid biosynthetic process(GO:0019375) |
| 0.0 | 0.1 | GO:0001865 | NK T cell differentiation(GO:0001865) |
| 0.0 | 0.5 | GO:0046847 | filopodium assembly(GO:0046847) |
| 0.0 | 0.2 | GO:0001514 | selenocysteine incorporation(GO:0001514) translational readthrough(GO:0006451) |
| 0.0 | 0.3 | GO:0031639 | plasminogen activation(GO:0031639) |
| 0.0 | 0.5 | GO:0000186 | activation of MAPKK activity(GO:0000186) |
| 0.0 | 0.7 | GO:0030183 | B cell differentiation(GO:0030183) |
Gene overrepresentation in cellular_component category:
| Log-likelihood per target | Total log-likelihood | Term | Description |
|---|---|---|---|
| 0.4 | 1.6 | GO:0097442 | CA3 pyramidal cell dendrite(GO:0097442) |
| 0.3 | 0.9 | GO:0071749 | IgA immunoglobulin complex(GO:0071745) IgA immunoglobulin complex, circulating(GO:0071746) monomeric IgA immunoglobulin complex(GO:0071748) polymeric IgA immunoglobulin complex(GO:0071749) secretory IgA immunoglobulin complex(GO:0071751) |
| 0.3 | 18.9 | GO:0001533 | cornified envelope(GO:0001533) |
| 0.3 | 0.8 | GO:0043511 | inhibin complex(GO:0043511) inhibin A complex(GO:0043512) |
| 0.2 | 1.7 | GO:0042629 | mast cell granule(GO:0042629) |
| 0.2 | 0.7 | GO:0005588 | collagen type V trimer(GO:0005588) |
| 0.2 | 0.9 | GO:0001674 | female germ cell nucleus(GO:0001674) |
| 0.2 | 0.6 | GO:0035841 | new growing cell tip(GO:0035841) |
| 0.2 | 0.9 | GO:0098843 | postsynaptic endocytic zone(GO:0098843) |
| 0.2 | 0.5 | GO:1990031 | pinceau fiber(GO:1990031) |
| 0.2 | 0.9 | GO:0030485 | smooth muscle contractile fiber(GO:0030485) |
| 0.2 | 0.6 | GO:0030936 | collagen type XIII trimer(GO:0005600) transmembrane collagen trimer(GO:0030936) |
| 0.1 | 1.0 | GO:0035867 | alphav-beta3 integrin-IGF-1-IGF1R complex(GO:0035867) |
| 0.1 | 1.3 | GO:0036449 | microtubule minus-end(GO:0036449) |
| 0.1 | 1.0 | GO:0071144 | SMAD2-SMAD3 protein complex(GO:0071144) |
| 0.1 | 0.4 | GO:1990032 | parallel fiber(GO:1990032) |
| 0.1 | 1.3 | GO:0014701 | junctional sarcoplasmic reticulum membrane(GO:0014701) |
| 0.1 | 0.5 | GO:0097149 | centralspindlin complex(GO:0097149) |
| 0.1 | 0.8 | GO:0070022 | transforming growth factor beta receptor homodimeric complex(GO:0070022) |
| 0.1 | 0.5 | GO:0000942 | condensed nuclear chromosome outer kinetochore(GO:0000942) |
| 0.1 | 5.3 | GO:0000786 | nucleosome(GO:0000786) |
| 0.1 | 0.2 | GO:0097444 | spine apparatus(GO:0097444) |
| 0.1 | 0.4 | GO:0044308 | axonal spine(GO:0044308) |
| 0.1 | 0.4 | GO:0072589 | box H/ACA scaRNP complex(GO:0072589) box H/ACA telomerase RNP complex(GO:0090661) |
| 0.1 | 0.3 | GO:0000811 | GINS complex(GO:0000811) |
| 0.1 | 1.0 | GO:0005751 | mitochondrial respiratory chain complex IV(GO:0005751) |
| 0.1 | 0.2 | GO:0036195 | muscle cell projection(GO:0036194) muscle cell projection membrane(GO:0036195) |
| 0.1 | 0.7 | GO:0035985 | senescence-associated heterochromatin focus(GO:0035985) |
| 0.1 | 0.2 | GO:0036452 | ESCRT I complex(GO:0000813) ESCRT complex(GO:0036452) |
| 0.0 | 0.9 | GO:0032059 | bleb(GO:0032059) |
| 0.0 | 0.7 | GO:1990712 | HFE-transferrin receptor complex(GO:1990712) |
| 0.0 | 0.5 | GO:0000940 | condensed chromosome outer kinetochore(GO:0000940) |
| 0.0 | 0.3 | GO:1990452 | Parkin-FBXW7-Cul1 ubiquitin ligase complex(GO:1990452) |
| 0.0 | 0.4 | GO:0043240 | Fanconi anaemia nuclear complex(GO:0043240) |
| 0.0 | 0.6 | GO:0033093 | Weibel-Palade body(GO:0033093) |
| 0.0 | 0.2 | GO:0032937 | SREBP-SCAP-Insig complex(GO:0032937) |
| 0.0 | 1.0 | GO:0030285 | integral component of synaptic vesicle membrane(GO:0030285) intrinsic component of synaptic vesicle membrane(GO:0098563) |
| 0.0 | 0.6 | GO:0005589 | collagen type VI trimer(GO:0005589) collagen beaded filament(GO:0098647) |
| 0.0 | 0.6 | GO:0008091 | spectrin(GO:0008091) |
| 0.0 | 0.3 | GO:0019815 | B cell receptor complex(GO:0019815) |
| 0.0 | 0.1 | GO:0044611 | nuclear pore inner ring(GO:0044611) |
| 0.0 | 0.2 | GO:0036020 | endolysosome membrane(GO:0036020) |
| 0.0 | 0.3 | GO:0005672 | transcription factor TFIIA complex(GO:0005672) |
| 0.0 | 0.2 | GO:0097524 | sperm plasma membrane(GO:0097524) |
| 0.0 | 0.3 | GO:0098559 | cytoplasmic side of early endosome membrane(GO:0098559) cytoplasmic side of late endosome membrane(GO:0098560) |
| 0.0 | 0.4 | GO:0005828 | kinetochore microtubule(GO:0005828) |
| 0.0 | 0.3 | GO:0035686 | sperm fibrous sheath(GO:0035686) |
| 0.0 | 0.5 | GO:0001518 | voltage-gated sodium channel complex(GO:0001518) |
| 0.0 | 0.5 | GO:0031209 | SCAR complex(GO:0031209) |
| 0.0 | 1.0 | GO:0031092 | platelet alpha granule membrane(GO:0031092) |
| 0.0 | 0.3 | GO:0035749 | myelin sheath adaxonal region(GO:0035749) |
| 0.0 | 0.5 | GO:0090543 | Flemming body(GO:0090543) |
| 0.0 | 0.2 | GO:0035869 | ciliary transition zone(GO:0035869) |
| 0.0 | 1.9 | GO:0019005 | SCF ubiquitin ligase complex(GO:0019005) |
| 0.0 | 0.1 | GO:0042765 | GPI-anchor transamidase complex(GO:0042765) |
| 0.0 | 0.1 | GO:0070985 | TFIIK complex(GO:0070985) |
| 0.0 | 0.1 | GO:0032279 | asymmetric synapse(GO:0032279) |
| 0.0 | 0.5 | GO:0042622 | photoreceptor outer segment membrane(GO:0042622) |
| 0.0 | 0.3 | GO:0030478 | actin cap(GO:0030478) |
| 0.0 | 0.1 | GO:0030689 | Noc complex(GO:0030689) |
| 0.0 | 0.2 | GO:0045009 | melanosome membrane(GO:0033162) chitosome(GO:0045009) |
| 0.0 | 0.7 | GO:0032982 | myosin filament(GO:0032982) |
| 0.0 | 0.4 | GO:0048786 | presynaptic active zone(GO:0048786) |
| 0.0 | 0.2 | GO:0071546 | pi-body(GO:0071546) |
| 0.0 | 0.3 | GO:0031089 | platelet dense granule lumen(GO:0031089) |
| 0.0 | 5.0 | GO:0072562 | blood microparticle(GO:0072562) |
| 0.0 | 0.1 | GO:0000015 | phosphopyruvate hydratase complex(GO:0000015) |
| 0.0 | 0.2 | GO:0043196 | varicosity(GO:0043196) |
| 0.0 | 0.2 | GO:0032541 | cortical endoplasmic reticulum(GO:0032541) |
| 0.0 | 1.7 | GO:1904724 | tertiary granule lumen(GO:1904724) |
| 0.0 | 0.2 | GO:0043204 | perikaryon(GO:0043204) |
| 0.0 | 0.6 | GO:0016327 | apicolateral plasma membrane(GO:0016327) |
| 0.0 | 0.1 | GO:0043293 | apoptosome(GO:0043293) |
| 0.0 | 0.1 | GO:0097450 | astrocyte end-foot(GO:0097450) |
| 0.0 | 1.7 | GO:0005811 | lipid particle(GO:0005811) |
| 0.0 | 0.2 | GO:0016011 | dystroglycan complex(GO:0016011) |
| 0.0 | 0.5 | GO:0042101 | T cell receptor complex(GO:0042101) |
| 0.0 | 0.1 | GO:0030121 | AP-1 adaptor complex(GO:0030121) |
| 0.0 | 0.2 | GO:0002116 | semaphorin receptor complex(GO:0002116) |
| 0.0 | 1.1 | GO:0000315 | organellar large ribosomal subunit(GO:0000315) mitochondrial large ribosomal subunit(GO:0005762) |
| 0.0 | 0.2 | GO:0097418 | neurofibrillary tangle(GO:0097418) |
| 0.0 | 0.1 | GO:0000125 | PCAF complex(GO:0000125) |
| 0.0 | 0.5 | GO:0000314 | organellar small ribosomal subunit(GO:0000314) mitochondrial small ribosomal subunit(GO:0005763) |
| 0.0 | 0.2 | GO:0032421 | stereocilium(GO:0032420) stereocilium bundle(GO:0032421) |
| 0.0 | 0.2 | GO:0005916 | fascia adherens(GO:0005916) |
| 0.0 | 1.6 | GO:0035097 | histone methyltransferase complex(GO:0035097) |
| 0.0 | 0.2 | GO:0032039 | integrator complex(GO:0032039) |
| 0.0 | 0.1 | GO:0016272 | prefoldin complex(GO:0016272) |
| 0.0 | 0.4 | GO:0002080 | acrosomal membrane(GO:0002080) |
| 0.0 | 0.1 | GO:0045111 | intermediate filament cytoskeleton(GO:0045111) |
| 0.0 | 0.2 | GO:0098799 | outer mitochondrial membrane protein complex(GO:0098799) |
| 0.0 | 0.2 | GO:0005664 | origin recognition complex(GO:0000808) nuclear origin of replication recognition complex(GO:0005664) |
| 0.0 | 1.5 | GO:0005796 | Golgi lumen(GO:0005796) |
| 0.0 | 0.1 | GO:0070554 | synaptobrevin 2-SNAP-25-syntaxin-3-complexin complex(GO:0070554) |
| 0.0 | 2.2 | GO:0031225 | anchored component of membrane(GO:0031225) |
| 0.0 | 0.5 | GO:0005790 | smooth endoplasmic reticulum(GO:0005790) |
| 0.0 | 1.2 | GO:0005905 | clathrin-coated pit(GO:0005905) |
| 0.0 | 0.4 | GO:0000791 | euchromatin(GO:0000791) |
| 0.0 | 0.3 | GO:0034364 | high-density lipoprotein particle(GO:0034364) |
| 0.0 | 0.4 | GO:0030673 | axolemma(GO:0030673) |
| 0.0 | 1.0 | GO:0035578 | azurophil granule lumen(GO:0035578) |
| 0.0 | 0.4 | GO:0001772 | immunological synapse(GO:0001772) |
| 0.0 | 0.1 | GO:0097486 | multivesicular body lumen(GO:0097486) |
| 0.0 | 0.5 | GO:0005581 | collagen trimer(GO:0005581) |
| 0.0 | 15.4 | GO:0005615 | extracellular space(GO:0005615) |
Gene overrepresentation in molecular_function category:
| Log-likelihood per target | Total log-likelihood | Term | Description |
|---|---|---|---|
| 0.6 | 1.7 | GO:0031731 | CCR6 chemokine receptor binding(GO:0031731) |
| 0.4 | 1.8 | GO:0004668 | protein-arginine deiminase activity(GO:0004668) |
| 0.3 | 0.9 | GO:0033754 | indoleamine 2,3-dioxygenase activity(GO:0033754) |
| 0.3 | 2.4 | GO:0004465 | lipoprotein lipase activity(GO:0004465) |
| 0.3 | 0.8 | GO:0070699 | type II activin receptor binding(GO:0070699) |
| 0.2 | 1.2 | GO:0005294 | neutral L-amino acid secondary active transmembrane transporter activity(GO:0005294) |
| 0.2 | 3.7 | GO:0030280 | structural constituent of epidermis(GO:0030280) |
| 0.2 | 0.5 | GO:0005171 | hepatocyte growth factor receptor binding(GO:0005171) |
| 0.2 | 0.7 | GO:0015091 | ferric iron transmembrane transporter activity(GO:0015091) trivalent inorganic cation transmembrane transporter activity(GO:0072510) |
| 0.2 | 1.0 | GO:0031962 | mineralocorticoid receptor binding(GO:0031962) |
| 0.2 | 0.6 | GO:0050816 | phosphothreonine binding(GO:0050816) |
| 0.2 | 4.3 | GO:0033038 | bitter taste receptor activity(GO:0033038) |
| 0.2 | 2.1 | GO:0001730 | 2'-5'-oligoadenylate synthetase activity(GO:0001730) |
| 0.2 | 3.6 | GO:0055106 | ubiquitin-protein transferase regulator activity(GO:0055106) |
| 0.2 | 0.5 | GO:0010997 | anaphase-promoting complex binding(GO:0010997) |
| 0.2 | 1.0 | GO:0003873 | 6-phosphofructo-2-kinase activity(GO:0003873) fructose-2,6-bisphosphate 2-phosphatase activity(GO:0004331) |
| 0.2 | 0.5 | GO:0008330 | protein tyrosine/threonine phosphatase activity(GO:0008330) |
| 0.2 | 3.7 | GO:0005149 | interleukin-1 receptor binding(GO:0005149) |
| 0.1 | 0.6 | GO:0051800 | phosphatidylinositol-3,4-bisphosphate 3-phosphatase activity(GO:0051800) |
| 0.1 | 0.6 | GO:0005503 | all-trans retinal binding(GO:0005503) |
| 0.1 | 0.7 | GO:0004105 | choline-phosphate cytidylyltransferase activity(GO:0004105) |
| 0.1 | 0.5 | GO:0003938 | IMP dehydrogenase activity(GO:0003938) |
| 0.1 | 0.4 | GO:1904288 | BAT3 complex binding(GO:1904288) |
| 0.1 | 0.9 | GO:0035662 | Toll-like receptor 4 binding(GO:0035662) |
| 0.1 | 2.0 | GO:0045499 | chemorepellent activity(GO:0045499) |
| 0.1 | 0.8 | GO:0070892 | lipoteichoic acid receptor activity(GO:0070892) |
| 0.1 | 0.7 | GO:0035402 | histone kinase activity (H3-T11 specific)(GO:0035402) |
| 0.1 | 0.5 | GO:0043515 | kinetochore binding(GO:0043515) |
| 0.1 | 3.5 | GO:0005528 | macrolide binding(GO:0005527) FK506 binding(GO:0005528) |
| 0.1 | 0.4 | GO:0004329 | formate-tetrahydrofolate ligase activity(GO:0004329) |
| 0.1 | 0.9 | GO:0035174 | histone serine kinase activity(GO:0035174) |
| 0.1 | 0.9 | GO:0043426 | MRF binding(GO:0043426) |
| 0.1 | 0.3 | GO:0004347 | glucose-6-phosphate isomerase activity(GO:0004347) |
| 0.1 | 0.4 | GO:0031694 | alpha-2A adrenergic receptor binding(GO:0031694) |
| 0.1 | 0.6 | GO:0001591 | dopamine neurotransmitter receptor activity, coupled via Gi/Go(GO:0001591) |
| 0.1 | 0.4 | GO:0030226 | apolipoprotein receptor activity(GO:0030226) lipoprotein transporter activity(GO:0042954) |
| 0.1 | 1.3 | GO:0004971 | AMPA glutamate receptor activity(GO:0004971) |
| 0.1 | 0.4 | GO:0047288 | monosialoganglioside sialyltransferase activity(GO:0047288) |
| 0.1 | 0.2 | GO:0004157 | dihydropyrimidinase activity(GO:0004157) |
| 0.1 | 0.3 | GO:0008195 | phosphatidate phosphatase activity(GO:0008195) |
| 0.1 | 0.3 | GO:0016812 | hydrolase activity, acting on carbon-nitrogen (but not peptide) bonds, in cyclic amides(GO:0016812) |
| 0.1 | 2.1 | GO:0002162 | dystroglycan binding(GO:0002162) |
| 0.1 | 1.0 | GO:0016174 | NAD(P)H oxidase activity(GO:0016174) |
| 0.1 | 0.9 | GO:0017034 | Rap guanyl-nucleotide exchange factor activity(GO:0017034) |
| 0.1 | 0.4 | GO:0042835 | BRE binding(GO:0042835) |
| 0.1 | 0.4 | GO:0016802 | adenosylhomocysteinase activity(GO:0004013) trialkylsulfonium hydrolase activity(GO:0016802) |
| 0.1 | 0.2 | GO:0035514 | DNA demethylase activity(GO:0035514) |
| 0.1 | 16.9 | GO:0003823 | antigen binding(GO:0003823) |
| 0.1 | 0.3 | GO:0004594 | pantothenate kinase activity(GO:0004594) |
| 0.1 | 0.9 | GO:0045159 | myosin II binding(GO:0045159) |
| 0.1 | 0.4 | GO:0016822 | hydrolase activity, acting on acid carbon-carbon bonds(GO:0016822) hydrolase activity, acting on acid carbon-carbon bonds, in ketonic substances(GO:0016823) |
| 0.1 | 0.5 | GO:0008568 | microtubule-severing ATPase activity(GO:0008568) |
| 0.1 | 1.4 | GO:0070006 | metalloaminopeptidase activity(GO:0070006) |
| 0.1 | 1.2 | GO:0036374 | glutathione hydrolase activity(GO:0036374) |
| 0.1 | 0.3 | GO:0000822 | inositol hexakisphosphate binding(GO:0000822) |
| 0.1 | 0.2 | GO:0008457 | beta-galactosyl-N-acetylglucosaminylgalactosylglucosyl-ceramide beta-1,3-acetylglucosaminyltransferase activity(GO:0008457) lactosylceramide 1,3-N-acetyl-beta-D-glucosaminyltransferase activity(GO:0047256) |
| 0.1 | 1.1 | GO:0008190 | eukaryotic initiation factor 4E binding(GO:0008190) |
| 0.1 | 0.4 | GO:0008449 | N-acetylglucosamine-6-sulfatase activity(GO:0008449) |
| 0.1 | 0.2 | GO:0004170 | dUTP diphosphatase activity(GO:0004170) |
| 0.1 | 0.2 | GO:0035379 | carbon dioxide transmembrane transporter activity(GO:0035379) |
| 0.1 | 1.1 | GO:0031078 | histone deacetylase activity (H3-K14 specific)(GO:0031078) NAD-dependent histone deacetylase activity (H3-K14 specific)(GO:0032041) |
| 0.1 | 0.2 | GO:0050309 | glucose-6-phosphatase activity(GO:0004346) sugar-terminal-phosphatase activity(GO:0050309) |
| 0.1 | 0.9 | GO:0097109 | neuroligin family protein binding(GO:0097109) |
| 0.1 | 1.0 | GO:0043024 | ribosomal small subunit binding(GO:0043024) |
| 0.1 | 0.3 | GO:0001010 | transcription factor activity, sequence-specific DNA binding transcription factor recruiting(GO:0001010) |
| 0.1 | 0.2 | GO:0033677 | single-stranded DNA-dependent ATP-dependent DNA helicase activity(GO:0017116) DNA/RNA helicase activity(GO:0033677) |
| 0.1 | 0.8 | GO:0035612 | AP-2 adaptor complex binding(GO:0035612) |
| 0.1 | 0.4 | GO:0004111 | creatine kinase activity(GO:0004111) |
| 0.1 | 2.7 | GO:0070412 | R-SMAD binding(GO:0070412) |
| 0.1 | 0.2 | GO:0070053 | thrombospondin receptor activity(GO:0070053) |
| 0.1 | 0.4 | GO:0003960 | NADPH:quinone reductase activity(GO:0003960) |
| 0.1 | 0.2 | GO:0003839 | gamma-glutamylcyclotransferase activity(GO:0003839) |
| 0.1 | 0.8 | GO:0008429 | phosphatidylethanolamine binding(GO:0008429) |
| 0.1 | 0.7 | GO:0017162 | aryl hydrocarbon receptor binding(GO:0017162) |
| 0.1 | 1.0 | GO:0050786 | RAGE receptor binding(GO:0050786) |
| 0.1 | 0.5 | GO:0042731 | PH domain binding(GO:0042731) |
| 0.1 | 1.1 | GO:0022841 | potassium ion leak channel activity(GO:0022841) |
| 0.0 | 0.8 | GO:0035615 | clathrin adaptor activity(GO:0035615) endocytic adaptor activity(GO:0098748) |
| 0.0 | 0.9 | GO:0035259 | glucocorticoid receptor binding(GO:0035259) |
| 0.0 | 0.3 | GO:0060230 | lipoprotein lipase activator activity(GO:0060230) |
| 0.0 | 0.3 | GO:0000213 | tRNA-intron endonuclease activity(GO:0000213) |
| 0.0 | 0.1 | GO:0004618 | phosphoglycerate kinase activity(GO:0004618) |
| 0.0 | 0.3 | GO:0022850 | serotonin-gated cation channel activity(GO:0022850) |
| 0.0 | 0.2 | GO:0060961 | phospholipase D inhibitor activity(GO:0060961) |
| 0.0 | 0.5 | GO:0035374 | chondroitin sulfate binding(GO:0035374) |
| 0.0 | 1.0 | GO:0051400 | BH domain binding(GO:0051400) |
| 0.0 | 0.2 | GO:0005502 | 11-cis retinal binding(GO:0005502) |
| 0.0 | 0.2 | GO:0005042 | netrin receptor activity(GO:0005042) |
| 0.0 | 0.5 | GO:0043855 | intracellular cyclic nucleotide activated cation channel activity(GO:0005221) cyclic nucleotide-gated ion channel activity(GO:0043855) |
| 0.0 | 1.4 | GO:0005388 | calcium-transporting ATPase activity(GO:0005388) |
| 0.0 | 1.1 | GO:0097602 | cullin family protein binding(GO:0097602) |
| 0.0 | 0.7 | GO:0008179 | adenylate cyclase binding(GO:0008179) |
| 0.0 | 0.4 | GO:0034513 | box H/ACA snoRNA binding(GO:0034513) |
| 0.0 | 1.0 | GO:0046965 | retinoid X receptor binding(GO:0046965) |
| 0.0 | 0.2 | GO:0051431 | corticotropin-releasing hormone receptor 2 binding(GO:0051431) |
| 0.0 | 0.6 | GO:0005132 | type I interferon receptor binding(GO:0005132) |
| 0.0 | 0.4 | GO:0003836 | beta-galactoside (CMP) alpha-2,3-sialyltransferase activity(GO:0003836) |
| 0.0 | 0.2 | GO:0046912 | transferase activity, transferring acyl groups, acyl groups converted into alkyl on transfer(GO:0046912) |
| 0.0 | 0.2 | GO:0031735 | CCR10 chemokine receptor binding(GO:0031735) |
| 0.0 | 0.1 | GO:0005136 | interleukin-4 receptor binding(GO:0005136) |
| 0.0 | 0.7 | GO:0016493 | C-C chemokine receptor activity(GO:0016493) |
| 0.0 | 0.5 | GO:1990825 | sequence-specific mRNA binding(GO:1990825) |
| 0.0 | 0.2 | GO:0017159 | pantetheine hydrolase activity(GO:0017159) |
| 0.0 | 0.2 | GO:0035800 | deubiquitinase activator activity(GO:0035800) |
| 0.0 | 0.1 | GO:0000384 | first spliceosomal transesterification activity(GO:0000384) |
| 0.0 | 0.1 | GO:0019862 | IgA binding(GO:0019862) |
| 0.0 | 0.2 | GO:0015307 | drug:proton antiporter activity(GO:0015307) |
| 0.0 | 0.0 | GO:0005157 | macrophage colony-stimulating factor receptor binding(GO:0005157) |
| 0.0 | 0.1 | GO:0047275 | glucosaminylgalactosylglucosylceramide beta-galactosyltransferase activity(GO:0047275) |
| 0.0 | 0.4 | GO:0004571 | mannosyl-oligosaccharide 1,2-alpha-mannosidase activity(GO:0004571) |
| 0.0 | 2.9 | GO:0019003 | GDP binding(GO:0019003) |
| 0.0 | 0.3 | GO:0005134 | interleukin-2 receptor binding(GO:0005134) |
| 0.0 | 1.5 | GO:0003785 | actin monomer binding(GO:0003785) |
| 0.0 | 0.2 | GO:0045029 | UDP-activated nucleotide receptor activity(GO:0045029) |
| 0.0 | 0.2 | GO:0004974 | leukotriene receptor activity(GO:0004974) |
| 0.0 | 0.1 | GO:1901375 | acetylcholine transmembrane transporter activity(GO:0005277) acetate ester transmembrane transporter activity(GO:1901375) |
| 0.0 | 0.2 | GO:0043533 | inositol 1,3,4,5 tetrakisphosphate binding(GO:0043533) |
| 0.0 | 1.0 | GO:0016676 | cytochrome-c oxidase activity(GO:0004129) heme-copper terminal oxidase activity(GO:0015002) oxidoreductase activity, acting on a heme group of donors, oxygen as acceptor(GO:0016676) |
| 0.0 | 0.7 | GO:0004653 | polypeptide N-acetylgalactosaminyltransferase activity(GO:0004653) |
| 0.0 | 0.1 | GO:0004706 | JUN kinase kinase kinase activity(GO:0004706) |
| 0.0 | 3.6 | GO:0004867 | serine-type endopeptidase inhibitor activity(GO:0004867) |
| 0.0 | 0.4 | GO:0015250 | water channel activity(GO:0015250) |
| 0.0 | 1.5 | GO:0005158 | insulin receptor binding(GO:0005158) |
| 0.0 | 0.1 | GO:0003923 | GPI-anchor transamidase activity(GO:0003923) |
| 0.0 | 0.4 | GO:0016918 | retinal binding(GO:0016918) |
| 0.0 | 0.1 | GO:0070905 | serine binding(GO:0070905) |
| 0.0 | 0.2 | GO:0004800 | thyroxine 5'-deiodinase activity(GO:0004800) |
| 0.0 | 0.5 | GO:0016500 | protein-hormone receptor activity(GO:0016500) |
| 0.0 | 1.1 | GO:0048487 | beta-tubulin binding(GO:0048487) |
| 0.0 | 0.3 | GO:0047035 | testosterone dehydrogenase (NAD+) activity(GO:0047035) |
| 0.0 | 0.6 | GO:0004861 | cyclin-dependent protein serine/threonine kinase inhibitor activity(GO:0004861) |
| 0.0 | 0.5 | GO:0050700 | CARD domain binding(GO:0050700) |
| 0.0 | 0.2 | GO:0016167 | glial cell-derived neurotrophic factor receptor activity(GO:0016167) |
| 0.0 | 0.5 | GO:0004089 | carbonate dehydratase activity(GO:0004089) |
| 0.0 | 0.2 | GO:0052650 | NADP-retinol dehydrogenase activity(GO:0052650) |
| 0.0 | 0.1 | GO:1990430 | extracellular matrix protein binding(GO:1990430) |
| 0.0 | 0.5 | GO:0000400 | four-way junction DNA binding(GO:0000400) |
| 0.0 | 0.4 | GO:0008349 | MAP kinase kinase kinase kinase activity(GO:0008349) |
| 0.0 | 0.1 | GO:0001596 | angiotensin type I receptor activity(GO:0001596) |
| 0.0 | 0.0 | GO:0015235 | cobalamin transporter activity(GO:0015235) |
| 0.0 | 0.2 | GO:0070728 | leucine binding(GO:0070728) |
| 0.0 | 0.4 | GO:0008140 | cAMP response element binding protein binding(GO:0008140) |
| 0.0 | 0.1 | GO:0050509 | N-acetylglucosaminyl-proteoglycan 4-beta-glucuronosyltransferase activity(GO:0050509) |
| 0.0 | 0.1 | GO:0004132 | dCMP deaminase activity(GO:0004132) |
| 0.0 | 0.2 | GO:0060002 | plus-end directed microfilament motor activity(GO:0060002) |
| 0.0 | 0.3 | GO:0046870 | cadmium ion binding(GO:0046870) |
| 0.0 | 0.5 | GO:0038191 | neuropilin binding(GO:0038191) |
| 0.0 | 0.4 | GO:0004143 | diacylglycerol kinase activity(GO:0004143) |
| 0.0 | 0.2 | GO:0030274 | LIM domain binding(GO:0030274) |
| 0.0 | 0.1 | GO:0099609 | microtubule lateral binding(GO:0099609) |
| 0.0 | 0.1 | GO:0097110 | scaffold protein binding(GO:0097110) |
| 0.0 | 0.5 | GO:0005248 | voltage-gated sodium channel activity(GO:0005248) voltage-gated ion channel activity involved in regulation of postsynaptic membrane potential(GO:1905030) |
| 0.0 | 0.1 | GO:0004634 | phosphopyruvate hydratase activity(GO:0004634) |
| 0.0 | 0.4 | GO:0015467 | G-protein activated inward rectifier potassium channel activity(GO:0015467) |
| 0.0 | 0.1 | GO:0004802 | transketolase activity(GO:0004802) |
| 0.0 | 0.4 | GO:0016857 | racemase and epimerase activity, acting on carbohydrates and derivatives(GO:0016857) |
| 0.0 | 0.1 | GO:0033743 | peptide-methionine (R)-S-oxide reductase activity(GO:0033743) |
| 0.0 | 0.3 | GO:0019956 | chemokine binding(GO:0019956) |
| 0.0 | 0.2 | GO:0038036 | sphingosine-1-phosphate receptor activity(GO:0038036) |
| 0.0 | 0.3 | GO:0070679 | inositol 1,4,5 trisphosphate binding(GO:0070679) |
| 0.0 | 0.1 | GO:0016778 | diphosphotransferase activity(GO:0016778) |
| 0.0 | 1.8 | GO:0008307 | structural constituent of muscle(GO:0008307) |
| 0.0 | 0.4 | GO:0070403 | NAD+ binding(GO:0070403) |
| 0.0 | 0.0 | GO:0005176 | ErbB-2 class receptor binding(GO:0005176) |
| 0.0 | 0.4 | GO:0031005 | filamin binding(GO:0031005) |
| 0.0 | 0.5 | GO:0070064 | proline-rich region binding(GO:0070064) |
| 0.0 | 0.3 | GO:0031628 | opioid receptor binding(GO:0031628) |
| 0.0 | 0.1 | GO:0016647 | oxidoreductase activity, acting on the CH-NH group of donors, oxygen as acceptor(GO:0016647) |
| 0.0 | 0.1 | GO:0050501 | hyaluronan synthase activity(GO:0050501) |
| 0.0 | 0.1 | GO:0047961 | glycine N-acyltransferase activity(GO:0047961) |
| 0.0 | 1.7 | GO:0004984 | olfactory receptor activity(GO:0004984) |
| 0.0 | 0.2 | GO:0086083 | cell adhesive protein binding involved in bundle of His cell-Purkinje myocyte communication(GO:0086083) |
| 0.0 | 0.1 | GO:0008113 | peptide-methionine (S)-S-oxide reductase activity(GO:0008113) |
| 0.0 | 0.1 | GO:0003828 | alpha-N-acetylneuraminate alpha-2,8-sialyltransferase activity(GO:0003828) |
| 0.0 | 15.9 | GO:0005198 | structural molecule activity(GO:0005198) |
| 0.0 | 0.3 | GO:0043138 | 3'-5' DNA helicase activity(GO:0043138) |
| 0.0 | 0.3 | GO:0043295 | glutathione binding(GO:0043295) |
| 0.0 | 0.2 | GO:0005242 | inward rectifier potassium channel activity(GO:0005242) |
| 0.0 | 0.5 | GO:0004709 | MAP kinase kinase kinase activity(GO:0004709) |
| 0.0 | 0.1 | GO:0047179 | platelet-activating factor acetyltransferase activity(GO:0047179) |
| 0.0 | 0.0 | GO:0030272 | 5-formyltetrahydrofolate cyclo-ligase activity(GO:0030272) |
| 0.0 | 0.5 | GO:0008157 | protein phosphatase 1 binding(GO:0008157) |
| 0.0 | 0.6 | GO:0008327 | methyl-CpG binding(GO:0008327) |
| 0.0 | 0.1 | GO:0004704 | NF-kappaB-inducing kinase activity(GO:0004704) |
| 0.0 | 0.3 | GO:0004806 | triglyceride lipase activity(GO:0004806) |
| 0.0 | 1.6 | GO:0008276 | protein methyltransferase activity(GO:0008276) |
| 0.0 | 0.1 | GO:0015186 | L-glutamine transmembrane transporter activity(GO:0015186) |
| 0.0 | 0.5 | GO:0015020 | glucuronosyltransferase activity(GO:0015020) |
| 0.0 | 0.3 | GO:0004033 | aldo-keto reductase (NADP) activity(GO:0004033) |
| 0.0 | 0.4 | GO:0000062 | fatty-acyl-CoA binding(GO:0000062) |
| 0.0 | 0.1 | GO:0015129 | lactate transmembrane transporter activity(GO:0015129) |
| 0.0 | 0.2 | GO:0042056 | chemoattractant activity(GO:0042056) |
| 0.0 | 0.2 | GO:0031404 | chloride ion binding(GO:0031404) |
| 0.0 | 0.1 | GO:0034597 | phosphatidylinositol-4,5-bisphosphate 4-phosphatase activity(GO:0034597) |
| 0.0 | 0.0 | GO:0003968 | RNA-directed RNA polymerase activity(GO:0003968) |
| 0.0 | 0.3 | GO:0005229 | intracellular calcium activated chloride channel activity(GO:0005229) |
| 0.0 | 0.2 | GO:0017154 | semaphorin receptor activity(GO:0017154) |
| 0.0 | 0.4 | GO:0005385 | zinc ion transmembrane transporter activity(GO:0005385) |
| 0.0 | 0.7 | GO:0030551 | cyclic nucleotide binding(GO:0030551) |
| 0.0 | 0.4 | GO:0051019 | mitogen-activated protein kinase binding(GO:0051019) |
| 0.0 | 0.2 | GO:0016863 | intramolecular oxidoreductase activity, transposing C=C bonds(GO:0016863) |
| 0.0 | 0.2 | GO:0003688 | DNA replication origin binding(GO:0003688) |
| 0.0 | 0.0 | GO:0004708 | MAP kinase kinase activity(GO:0004708) |
| 0.0 | 0.2 | GO:0008353 | RNA polymerase II carboxy-terminal domain kinase activity(GO:0008353) |
| 0.0 | 0.1 | GO:0005381 | iron ion transmembrane transporter activity(GO:0005381) |
| 0.0 | 0.0 | GO:0034191 | GBD domain binding(GO:0032427) apolipoprotein A-I receptor binding(GO:0034191) GDP-dissociation inhibitor binding(GO:0051021) Rho GDP-dissociation inhibitor binding(GO:0051022) |
| 0.0 | 0.5 | GO:0004177 | aminopeptidase activity(GO:0004177) |
Gene overrepresentation in C2:CP category:
| Log-likelihood per target | Total log-likelihood | Term | Description |
|---|---|---|---|
| 0.1 | 3.0 | SA_MMP_CYTOKINE_CONNECTION | Cytokines can induce activation of matrix metalloproteinases, which degrade extracellular matrix. |
| 0.1 | 0.8 | SA_G2_AND_M_PHASES | Cdc25 activates the cdc2/cyclin B complex to induce the G2/M transition. |
| 0.0 | 3.3 | PID_EPHB_FWD_PATHWAY | EPHB forward signaling |
| 0.0 | 2.3 | NABA_COLLAGENS | Genes encoding collagen proteins |
| 0.0 | 0.8 | PID_ALK1_PATHWAY | ALK1 signaling events |
| 0.0 | 0.5 | ST_G_ALPHA_S_PATHWAY | G alpha s Pathway |
| 0.0 | 1.9 | PID_IGF1_PATHWAY | IGF1 pathway |
| 0.0 | 1.0 | PID_SMAD2_3PATHWAY | Regulation of cytoplasmic and nuclear SMAD2/3 signaling |
| 0.0 | 0.7 | SIG_IL4RECEPTOR_IN_B_LYPHOCYTES | Genes related to IL4 rceptor signaling in B lymphocytes |
| 0.0 | 1.0 | PID_IL3_PATHWAY | IL3-mediated signaling events |
| 0.0 | 1.2 | ST_ERK1_ERK2_MAPK_PATHWAY | ERK1/ERK2 MAPK Pathway |
| 0.0 | 1.2 | PID_HDAC_CLASSII_PATHWAY | Signaling events mediated by HDAC Class II |
| 0.0 | 1.7 | PID_LKB1_PATHWAY | LKB1 signaling events |
| 0.0 | 1.3 | PID_SYNDECAN_4_PATHWAY | Syndecan-4-mediated signaling events |
| 0.0 | 3.0 | PID_AP1_PATHWAY | AP-1 transcription factor network |
| 0.0 | 0.9 | PID_NCADHERIN_PATHWAY | N-cadherin signaling events |
| 0.0 | 1.9 | PID_TAP63_PATHWAY | Validated transcriptional targets of TAp63 isoforms |
| 0.0 | 0.3 | PID_MYC_PATHWAY | C-MYC pathway |
| 0.0 | 1.4 | PID_TGFBR_PATHWAY | TGF-beta receptor signaling |
| 0.0 | 0.9 | PID_RAC1_PATHWAY | RAC1 signaling pathway |
| 0.0 | 0.2 | PID_IL12_2PATHWAY | IL12-mediated signaling events |
| 0.0 | 0.6 | PID_FRA_PATHWAY | Validated transcriptional targets of AP1 family members Fra1 and Fra2 |
| 0.0 | 0.6 | SA_CASPASE_CASCADE | Apoptosis is mediated by caspases, cysteine proteases arranged in a proteolytic cascade. |
| 0.0 | 2.4 | PID_MYC_ACTIV_PATHWAY | Validated targets of C-MYC transcriptional activation |
| 0.0 | 1.5 | PID_CDC42_PATHWAY | CDC42 signaling events |
| 0.0 | 0.5 | PID_NETRIN_PATHWAY | Netrin-mediated signaling events |
| 0.0 | 0.4 | PID_P38_MK2_PATHWAY | p38 signaling mediated by MAPKAP kinases |
| 0.0 | 1.3 | PID_REG_GR_PATHWAY | Glucocorticoid receptor regulatory network |
| 0.0 | 0.9 | PID_ILK_PATHWAY | Integrin-linked kinase signaling |
| 0.0 | 0.6 | PID_RHODOPSIN_PATHWAY | Visual signal transduction: Rods |
| 0.0 | 0.5 | PID_INTEGRIN3_PATHWAY | Beta3 integrin cell surface interactions |
| 0.0 | 0.3 | PID_INTEGRIN_A9B1_PATHWAY | Alpha9 beta1 integrin signaling events |
| 0.0 | 0.2 | PID_S1P_S1P1_PATHWAY | S1P1 pathway |
| 0.0 | 0.4 | PID_WNT_NONCANONICAL_PATHWAY | Noncanonical Wnt signaling pathway |
| 0.0 | 0.3 | PID_ERBB1_RECEPTOR_PROXIMAL_PATHWAY | EGF receptor (ErbB1) signaling pathway |
| 0.0 | 0.1 | PID_LYMPH_ANGIOGENESIS_PATHWAY | VEGFR3 signaling in lymphatic endothelium |
| 0.0 | 0.4 | PID_UPA_UPAR_PATHWAY | Urokinase-type plasminogen activator (uPA) and uPAR-mediated signaling |
| 0.0 | 0.1 | SA_G1_AND_S_PHASES | Cdk2, 4, and 6 bind cyclin D in G1, while cdk2/cyclin E promotes the G1/S transition. |
| 0.0 | 0.4 | NABA_BASEMENT_MEMBRANES | Genes encoding structural components of basement membranes |
| 0.0 | 0.6 | PID_BARD1_PATHWAY | BARD1 signaling events |
| 0.0 | 0.2 | PID_FCER1_PATHWAY | Fc-epsilon receptor I signaling in mast cells |
| 0.0 | 0.5 | PID_VEGFR1_2_PATHWAY | Signaling events mediated by VEGFR1 and VEGFR2 |
| 0.0 | 0.3 | PID_WNT_SIGNALING_PATHWAY | Wnt signaling network |
| 0.0 | 0.4 | PID_ECADHERIN_STABILIZATION_PATHWAY | Stabilization and expansion of the E-cadherin adherens junction |
| 0.0 | 0.5 | NABA_PROTEOGLYCANS | Genes encoding proteoglycans |
Gene overrepresentation in C2:CP:REACTOME category:
| Log-likelihood per target | Total log-likelihood | Term | Description |
|---|---|---|---|
| 0.3 | 3.8 | REACTOME_NEGATIVE_REGULATION_OF_THE_PI3K_AKT_NETWORK | Genes involved in Negative regulation of the PI3K/AKT network |
| 0.2 | 3.4 | REACTOME_SEMA3A_PLEXIN_REPULSION_SIGNALING_BY_INHIBITING_INTEGRIN_ADHESION | Genes involved in SEMA3A-Plexin repulsion signaling by inhibiting Integrin adhesion |
| 0.1 | 6.4 | REACTOME_PACKAGING_OF_TELOMERE_ENDS | Genes involved in Packaging Of Telomere Ends |
| 0.1 | 1.8 | REACTOME_SYNTHESIS_SECRETION_AND_INACTIVATION_OF_GIP | Genes involved in Synthesis, Secretion, and Inactivation of Glucose-dependent Insulinotropic Polypeptide (GIP) |
| 0.1 | 1.1 | REACTOME_GLYCOPROTEIN_HORMONES | Genes involved in Glycoprotein hormones |
| 0.1 | 1.1 | REACTOME_TANDEM_PORE_DOMAIN_POTASSIUM_CHANNELS | Genes involved in Tandem pore domain potassium channels |
| 0.1 | 1.3 | REACTOME_TRYPTOPHAN_CATABOLISM | Genes involved in Tryptophan catabolism |
| 0.1 | 0.1 | REACTOME_NEP_NS2_INTERACTS_WITH_THE_CELLULAR_EXPORT_MACHINERY | Genes involved in NEP/NS2 Interacts with the Cellular Export Machinery |
| 0.1 | 2.3 | REACTOME_SIGNAL_REGULATORY_PROTEIN_SIRP_FAMILY_INTERACTIONS | Genes involved in Signal regulatory protein (SIRP) family interactions |
| 0.1 | 0.5 | REACTOME_APOBEC3G_MEDIATED_RESISTANCE_TO_HIV1_INFECTION | Genes involved in APOBEC3G mediated resistance to HIV-1 infection |
| 0.1 | 0.8 | REACTOME_CRMPS_IN_SEMA3A_SIGNALING | Genes involved in CRMPs in Sema3A signaling |
| 0.0 | 0.5 | REACTOME_SIGNAL_ATTENUATION | Genes involved in Signal attenuation |
| 0.0 | 2.1 | REACTOME_DOWNREGULATION_OF_TGF_BETA_RECEPTOR_SIGNALING | Genes involved in Downregulation of TGF-beta receptor signaling |
| 0.0 | 2.8 | REACTOME_IL1_SIGNALING | Genes involved in Interleukin-1 signaling |
| 0.0 | 1.0 | REACTOME_TAK1_ACTIVATES_NFKB_BY_PHOSPHORYLATION_AND_ACTIVATION_OF_IKKS_COMPLEX | Genes involved in TAK1 activates NFkB by phosphorylation and activation of IKKs complex |
| 0.0 | 0.8 | REACTOME_GAP_JUNCTION_DEGRADATION | Genes involved in Gap junction degradation |
| 0.0 | 1.3 | REACTOME_UNBLOCKING_OF_NMDA_RECEPTOR_GLUTAMATE_BINDING_AND_ACTIVATION | Genes involved in Unblocking of NMDA receptor, glutamate binding and activation |
| 0.0 | 2.2 | REACTOME_ION_TRANSPORT_BY_P_TYPE_ATPASES | Genes involved in Ion transport by P-type ATPases |
| 0.0 | 1.5 | REACTOME_FORMATION_OF_FIBRIN_CLOT_CLOTTING_CASCADE | Genes involved in Formation of Fibrin Clot (Clotting Cascade) |
| 0.0 | 0.6 | REACTOME_CYCLIN_A_B1_ASSOCIATED_EVENTS_DURING_G2_M_TRANSITION | Genes involved in Cyclin A/B1 associated events during G2/M transition |
| 0.0 | 0.6 | REACTOME_ROLE_OF_DCC_IN_REGULATING_APOPTOSIS | Genes involved in Role of DCC in regulating apoptosis |
| 0.0 | 0.7 | REACTOME_G2_M_DNA_DAMAGE_CHECKPOINT | Genes involved in G2/M DNA damage checkpoint |
| 0.0 | 1.0 | REACTOME_AMYLOIDS | Genes involved in Amyloids |
| 0.0 | 1.7 | REACTOME_GLYCOLYSIS | Genes involved in Glycolysis |
| 0.0 | 1.5 | REACTOME_INTEGRIN_ALPHAIIB_BETA3_SIGNALING | Genes involved in Integrin alphaIIb beta3 signaling |
| 0.0 | 1.2 | REACTOME_BASIGIN_INTERACTIONS | Genes involved in Basigin interactions |
| 0.0 | 2.4 | REACTOME_COLLAGEN_FORMATION | Genes involved in Collagen formation |
| 0.0 | 1.1 | REACTOME_SYNTHESIS_OF_PC | Genes involved in Synthesis of PC |
| 0.0 | 0.4 | REACTOME_PASSIVE_TRANSPORT_BY_AQUAPORINS | Genes involved in Passive Transport by Aquaporins |
| 0.0 | 0.5 | REACTOME_PURINE_RIBONUCLEOSIDE_MONOPHOSPHATE_BIOSYNTHESIS | Genes involved in Purine ribonucleoside monophosphate biosynthesis |
| 0.0 | 0.5 | REACTOME_REVERSIBLE_HYDRATION_OF_CARBON_DIOXIDE | Genes involved in Reversible Hydration of Carbon Dioxide |
| 0.0 | 2.4 | REACTOME_INTERFERON_ALPHA_BETA_SIGNALING | Genes involved in Interferon alpha/beta signaling |
| 0.0 | 0.6 | REACTOME_FANCONI_ANEMIA_PATHWAY | Genes involved in Fanconi Anemia pathway |
| 0.0 | 0.3 | REACTOME_ACTIVATION_OF_NF_KAPPAB_IN_B_CELLS | Genes involved in Activation of NF-kappaB in B Cells |
| 0.0 | 1.0 | REACTOME_KINESINS | Genes involved in Kinesins |
| 0.0 | 0.3 | REACTOME_SYNTHESIS_SECRETION_AND_DEACYLATION_OF_GHRELIN | Genes involved in Synthesis, Secretion, and Deacylation of Ghrelin |
| 0.0 | 0.7 | REACTOME_CS_DS_DEGRADATION | Genes involved in CS/DS degradation |
| 0.0 | 0.7 | REACTOME_BETA_DEFENSINS | Genes involved in Beta defensins |
| 0.0 | 1.6 | REACTOME_STRIATED_MUSCLE_CONTRACTION | Genes involved in Striated Muscle Contraction |
| 0.0 | 0.3 | REACTOME_VITAMIN_B5_PANTOTHENATE_METABOLISM | Genes involved in Vitamin B5 (pantothenate) metabolism |
| 0.0 | 0.9 | REACTOME_PYRIMIDINE_METABOLISM | Genes involved in Pyrimidine metabolism |
| 0.0 | 0.7 | REACTOME_EFFECTS_OF_PIP2_HYDROLYSIS | Genes involved in Effects of PIP2 hydrolysis |
| 0.0 | 0.4 | REACTOME_CALNEXIN_CALRETICULIN_CYCLE | Genes involved in Calnexin/calreticulin cycle |
| 0.0 | 0.8 | REACTOME_ANTIGEN_PROCESSING_CROSS_PRESENTATION | Genes involved in Antigen processing-Cross presentation |
| 0.0 | 0.4 | REACTOME_INHIBITION_OF_VOLTAGE_GATED_CA2_CHANNELS_VIA_GBETA_GAMMA_SUBUNITS | Genes involved in Inhibition of voltage gated Ca2+ channels via Gbeta/gamma subunits |
| 0.0 | 0.5 | REACTOME_GLUCURONIDATION | Genes involved in Glucuronidation |
| 0.0 | 1.9 | REACTOME_GLYCEROPHOSPHOLIPID_BIOSYNTHESIS | Genes involved in Glycerophospholipid biosynthesis |
| 0.0 | 0.4 | REACTOME_OTHER_SEMAPHORIN_INTERACTIONS | Genes involved in Other semaphorin interactions |
| 0.0 | 0.3 | REACTOME_PRE_NOTCH_TRANSCRIPTION_AND_TRANSLATION | Genes involved in Pre-NOTCH Transcription and Translation |
| 0.0 | 0.4 | REACTOME_TRAF6_MEDIATED_IRF7_ACTIVATION | Genes involved in TRAF6 mediated IRF7 activation |
| 0.0 | 0.2 | REACTOME_ACTIVATION_OF_THE_PRE_REPLICATIVE_COMPLEX | Genes involved in Activation of the pre-replicative complex |
| 0.0 | 0.4 | REACTOME_ORGANIC_CATION_ANION_ZWITTERION_TRANSPORT | Genes involved in Organic cation/anion/zwitterion transport |
| 0.0 | 1.1 | REACTOME_NOTCH1_INTRACELLULAR_DOMAIN_REGULATES_TRANSCRIPTION | Genes involved in NOTCH1 Intracellular Domain Regulates Transcription |
| 0.0 | 4.0 | REACTOME_G_ALPHA_I_SIGNALLING_EVENTS | Genes involved in G alpha (i) signalling events |
| 0.0 | 0.2 | REACTOME_VEGF_LIGAND_RECEPTOR_INTERACTIONS | Genes involved in VEGF ligand-receptor interactions |
| 0.0 | 0.4 | REACTOME_INTERFERON_SIGNALING | Genes involved in Interferon Signaling |
| 0.0 | 0.2 | REACTOME_UNWINDING_OF_DNA | Genes involved in Unwinding of DNA |
| 0.0 | 0.4 | REACTOME_SIGNALING_BY_NODAL | Genes involved in Signaling by NODAL |
| 0.0 | 0.2 | REACTOME_E2F_ENABLED_INHIBITION_OF_PRE_REPLICATION_COMPLEX_FORMATION | Genes involved in E2F-enabled inhibition of pre-replication complex formation |
| 0.0 | 0.1 | REACTOME_CELL_SURFACE_INTERACTIONS_AT_THE_VASCULAR_WALL | Genes involved in Cell surface interactions at the vascular wall |
| 0.0 | 0.4 | REACTOME_ZINC_TRANSPORTERS | Genes involved in Zinc transporters |
| 0.0 | 0.2 | REACTOME_GLUCOSE_TRANSPORT | Genes involved in Glucose transport |
| 0.0 | 0.4 | REACTOME_FATTY_ACYL_COA_BIOSYNTHESIS | Genes involved in Fatty Acyl-CoA Biosynthesis |
| 0.0 | 1.3 | REACTOME_OLFACTORY_SIGNALING_PATHWAY | Genes involved in Olfactory Signaling Pathway |
| 0.0 | 0.3 | REACTOME_PROCESSING_OF_INTRONLESS_PRE_MRNAS | Genes involved in Processing of Intronless Pre-mRNAs |
| 0.0 | 0.4 | REACTOME_CELL_EXTRACELLULAR_MATRIX_INTERACTIONS | Genes involved in Cell-extracellular matrix interactions |
| 0.0 | 0.2 | REACTOME_HORMONE_SENSITIVE_LIPASE_HSL_MEDIATED_TRIACYLGLYCEROL_HYDROLYSIS | Genes involved in Hormone-sensitive lipase (HSL)-mediated triacylglycerol hydrolysis |
| 0.0 | 0.3 | REACTOME_NOD1_2_SIGNALING_PATHWAY | Genes involved in NOD1/2 Signaling Pathway |
| 0.0 | 0.4 | REACTOME_ADHERENS_JUNCTIONS_INTERACTIONS | Genes involved in Adherens junctions interactions |
| 0.0 | 0.2 | REACTOME_EICOSANOID_LIGAND_BINDING_RECEPTORS | Genes involved in Eicosanoid ligand-binding receptors |
| 0.0 | 0.4 | REACTOME_TELOMERE_MAINTENANCE | Genes involved in Telomere Maintenance |
|
|
|
|