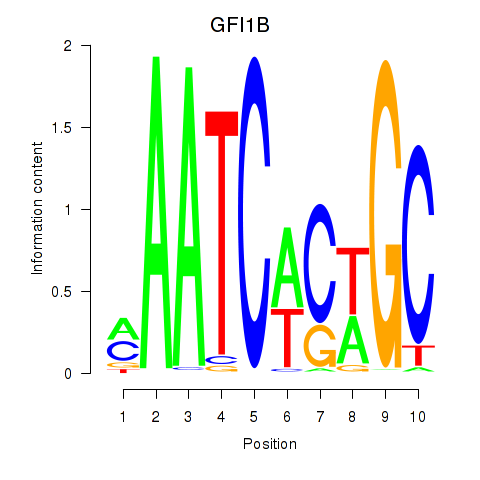
Motif ID: GFI1B
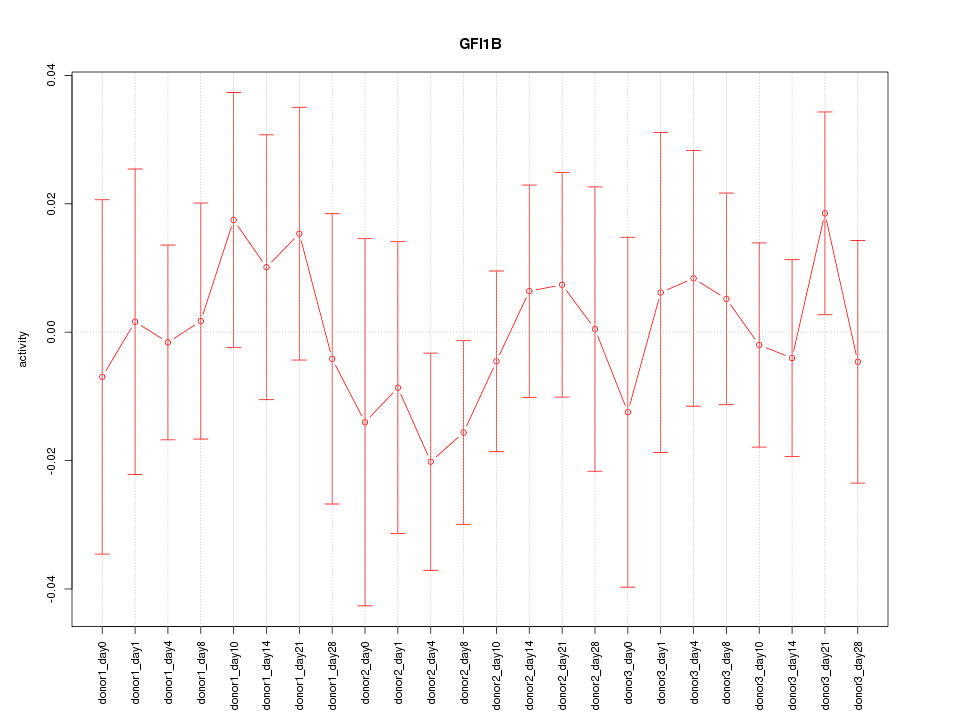
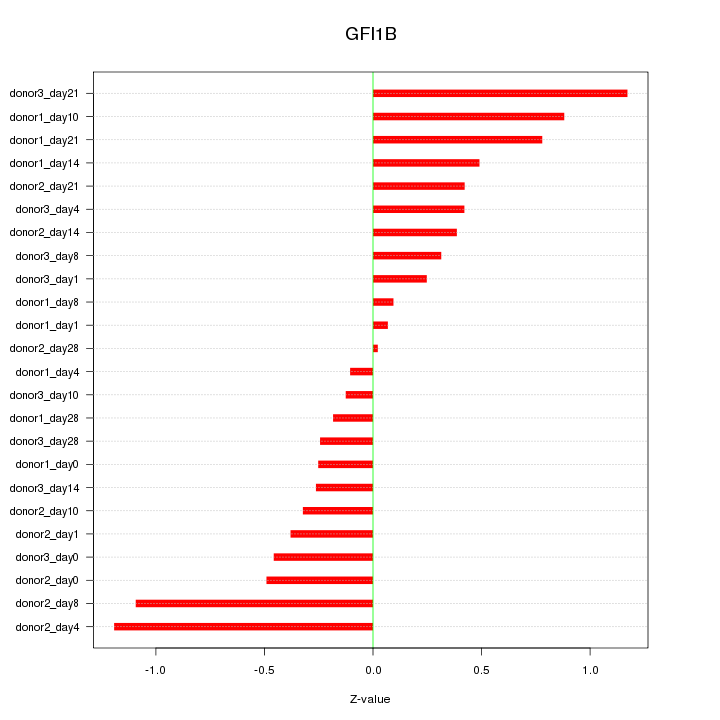
Z-value: 0.549
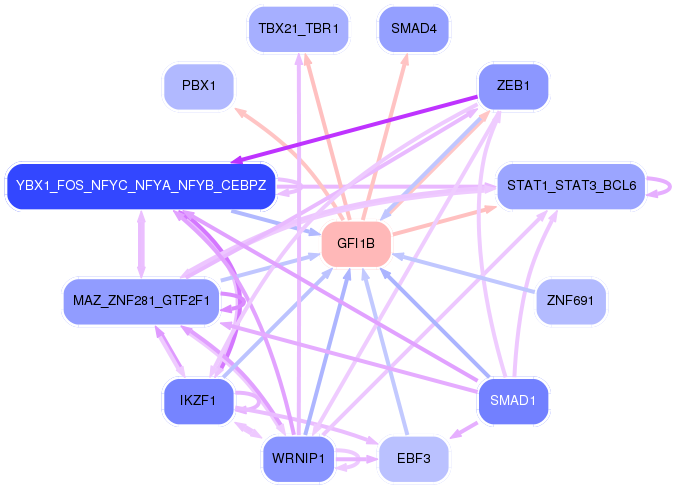
Transcription factors associated with GFI1B:
| Gene Symbol | Entrez ID | Gene Name |
|---|---|---|
| GFI1B | ENSG00000165702.8 | GFI1B |
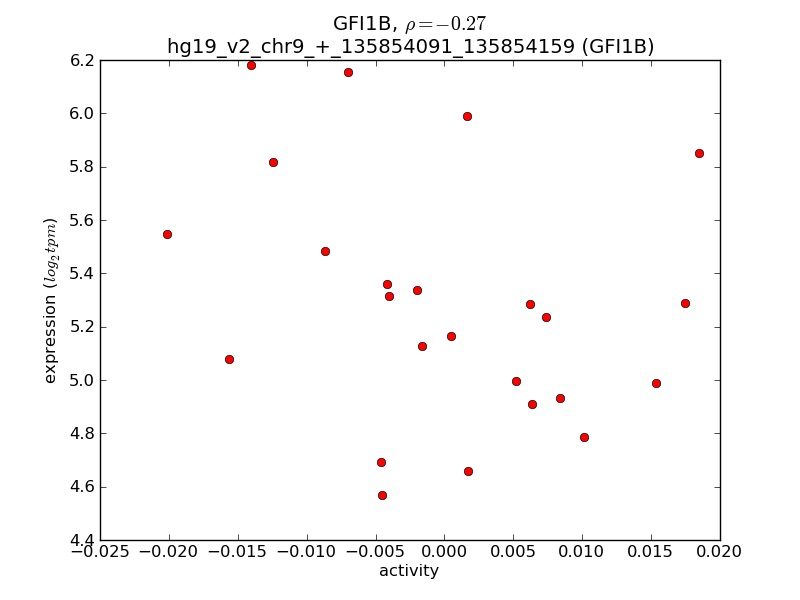
Activity-expression correlation:
| Gene Symbol | Promoter | Pearson corr. coef. | P-value | Plot |
|---|---|---|---|---|
| GFI1B | hg19_v2_chr9_+_135854091_135854159 | -0.27 | 1.9e-01 | Click! |

Top targets:
Gene overrepresentation in biological_process category:
| Log-likelihood per target | Total log-likelihood | Term | Description |
|---|---|---|---|
| 0.2 | 0.7 | GO:0060830 | ciliary receptor clustering involved in smoothened signaling pathway(GO:0060830) |
| 0.1 | 0.5 | GO:0044805 | late nucleophagy(GO:0044805) |
| 0.1 | 2.3 | GO:0019614 | catechol-containing compound catabolic process(GO:0019614) catecholamine catabolic process(GO:0042424) |
| 0.1 | 0.8 | GO:1904491 | protein localization to ciliary transition zone(GO:1904491) |
| 0.1 | 0.3 | GO:1990108 | protein linear deubiquitination(GO:1990108) |
| 0.1 | 0.6 | GO:1990822 | basic amino acid transmembrane transport(GO:1990822) |
| 0.1 | 0.3 | GO:0032764 | negative regulation of mast cell cytokine production(GO:0032764) |
| 0.1 | 0.6 | GO:0006537 | glutamate biosynthetic process(GO:0006537) gamma-aminobutyric acid biosynthetic process(GO:0009449) |
| 0.1 | 1.0 | GO:0006228 | UTP biosynthetic process(GO:0006228) |
| 0.1 | 0.2 | GO:0003249 | left ventricular cardiac muscle tissue morphogenesis(GO:0003220) cell proliferation involved in heart valve morphogenesis(GO:0003249) regulation of cell proliferation involved in heart valve morphogenesis(GO:0003250) |
| 0.1 | 0.3 | GO:0009236 | cobalamin biosynthetic process(GO:0009236) |
| 0.1 | 0.3 | GO:0006542 | glutamine biosynthetic process(GO:0006542) |
| 0.1 | 0.2 | GO:0093001 | glycolysis from storage polysaccharide through glucose-1-phosphate(GO:0093001) |
| 0.1 | 0.2 | GO:0046416 | D-amino acid metabolic process(GO:0046416) |
| 0.1 | 0.3 | GO:0021764 | amygdala development(GO:0021764) |
| 0.1 | 0.2 | GO:0006097 | glyoxylate cycle(GO:0006097) |
| 0.1 | 3.2 | GO:0035082 | axoneme assembly(GO:0035082) |
| 0.1 | 0.2 | GO:0072156 | distal tubule morphogenesis(GO:0072156) |
| 0.0 | 0.1 | GO:0042732 | D-xylose metabolic process(GO:0042732) |
| 0.0 | 0.1 | GO:0010520 | regulation of reciprocal meiotic recombination(GO:0010520) |
| 0.0 | 0.1 | GO:2000017 | positive regulation of determination of dorsal identity(GO:2000017) |
| 0.0 | 0.5 | GO:0045329 | carnitine biosynthetic process(GO:0045329) |
| 0.0 | 0.1 | GO:1901491 | negative regulation of lymphangiogenesis(GO:1901491) |
| 0.0 | 0.1 | GO:1900377 | negative regulation of melanin biosynthetic process(GO:0048022) negative regulation of secondary metabolite biosynthetic process(GO:1900377) |
| 0.0 | 0.1 | GO:0051781 | positive regulation of cell division(GO:0051781) |
| 0.0 | 0.9 | GO:0019373 | epoxygenase P450 pathway(GO:0019373) |
| 0.0 | 0.5 | GO:0038203 | TORC2 signaling(GO:0038203) |
| 0.0 | 0.7 | GO:0016024 | CDP-diacylglycerol biosynthetic process(GO:0016024) |
| 0.0 | 0.8 | GO:0031293 | membrane protein intracellular domain proteolysis(GO:0031293) |
| 0.0 | 0.1 | GO:0044336 | canonical Wnt signaling pathway involved in negative regulation of apoptotic process(GO:0044336) |
| 0.0 | 0.4 | GO:0008090 | retrograde axonal transport(GO:0008090) |
| 0.0 | 0.1 | GO:1903660 | negative regulation of complement-dependent cytotoxicity(GO:1903660) |
| 0.0 | 0.1 | GO:0006102 | isocitrate metabolic process(GO:0006102) |
| 0.0 | 0.1 | GO:0048372 | lateral mesodermal cell fate commitment(GO:0048372) lateral mesodermal cell fate specification(GO:0048377) regulation of lateral mesodermal cell fate specification(GO:0048378) |
| 0.0 | 0.1 | GO:0072137 | condensed mesenchymal cell proliferation(GO:0072137) |
| 0.0 | 0.3 | GO:0030321 | transepithelial chloride transport(GO:0030321) |
| 0.0 | 0.2 | GO:1903232 | melanosome assembly(GO:1903232) |
| 0.0 | 0.1 | GO:0002933 | lipid hydroxylation(GO:0002933) |
| 0.0 | 0.1 | GO:0070681 | glutaminyl-tRNAGln biosynthesis via transamidation(GO:0070681) |
| 0.0 | 0.1 | GO:1900168 | glial cell-derived neurotrophic factor secretion(GO:0044467) regulation of glial cell-derived neurotrophic factor secretion(GO:1900166) positive regulation of glial cell-derived neurotrophic factor secretion(GO:1900168) |
| 0.0 | 0.3 | GO:2000096 | positive regulation of Wnt signaling pathway, planar cell polarity pathway(GO:2000096) |
| 0.0 | 0.2 | GO:0015705 | iodide transport(GO:0015705) |
| 0.0 | 0.3 | GO:0045162 | clustering of voltage-gated sodium channels(GO:0045162) |
| 0.0 | 0.5 | GO:0097186 | amelogenesis(GO:0097186) |
| 0.0 | 0.1 | GO:0039506 | modulation by virus of host molecular function(GO:0039506) suppression by virus of host molecular function(GO:0039507) suppression by virus of host catalytic activity(GO:0039513) modulation by virus of host catalytic activity(GO:0039516) suppression by virus of host cysteine-type endopeptidase activity involved in apoptotic process(GO:0039650) negative regulation by symbiont of host catalytic activity(GO:0052053) negative regulation by symbiont of host molecular function(GO:0052056) modulation by symbiont of host catalytic activity(GO:0052148) |
| 0.0 | 0.1 | GO:0002101 | tRNA wobble cytosine modification(GO:0002101) |
| 0.0 | 0.0 | GO:0046709 | IDP metabolic process(GO:0046707) IDP catabolic process(GO:0046709) |
| 0.0 | 0.8 | GO:0048741 | skeletal muscle fiber development(GO:0048741) |
| 0.0 | 0.2 | GO:0007168 | receptor guanylyl cyclase signaling pathway(GO:0007168) |
| 0.0 | 0.1 | GO:1903597 | negative regulation of gap junction assembly(GO:1903597) |
| 0.0 | 0.5 | GO:0043968 | histone H2A acetylation(GO:0043968) |
| 0.0 | 0.1 | GO:0051673 | membrane disruption in other organism(GO:0051673) |
| 0.0 | 0.1 | GO:0045602 | negative regulation of endothelial cell differentiation(GO:0045602) |
| 0.0 | 0.1 | GO:0097211 | response to gonadotropin-releasing hormone(GO:0097210) cellular response to gonadotropin-releasing hormone(GO:0097211) |
| 0.0 | 0.1 | GO:0003241 | growth involved in heart morphogenesis(GO:0003241) |
| 0.0 | 0.1 | GO:0007185 | transmembrane receptor protein tyrosine phosphatase signaling pathway(GO:0007185) |
| 0.0 | 0.2 | GO:0071420 | cellular response to histamine(GO:0071420) |
| 0.0 | 0.1 | GO:0006581 | acetylcholine catabolic process in synaptic cleft(GO:0001507) acetylcholine catabolic process(GO:0006581) |
| 0.0 | 0.1 | GO:0032474 | otolith morphogenesis(GO:0032474) |
| 0.0 | 0.2 | GO:0046600 | negative regulation of centriole replication(GO:0046600) |
| 0.0 | 0.0 | GO:0060127 | subthalamic nucleus development(GO:0021763) prolactin secreting cell differentiation(GO:0060127) superior vena cava morphogenesis(GO:0060578) |
| 0.0 | 0.3 | GO:0007342 | fusion of sperm to egg plasma membrane(GO:0007342) |
| 0.0 | 0.0 | GO:0050960 | detection of temperature stimulus involved in thermoception(GO:0050960) response to capsazepine(GO:1901594) |
| 0.0 | 0.0 | GO:0006689 | ganglioside catabolic process(GO:0006689) |
| 0.0 | 0.1 | GO:1900114 | positive regulation of methylation-dependent chromatin silencing(GO:0090309) positive regulation of histone H3-K9 trimethylation(GO:1900114) |
| 0.0 | 0.8 | GO:0042733 | embryonic digit morphogenesis(GO:0042733) |
| 0.0 | 0.0 | GO:0097368 | establishment of Sertoli cell barrier(GO:0097368) |
| 0.0 | 0.1 | GO:0061299 | retina vasculature morphogenesis in camera-type eye(GO:0061299) |
| 0.0 | 0.1 | GO:1902774 | late endosome to lysosome transport(GO:1902774) |
Gene overrepresentation in cellular_component category:
| Log-likelihood per target | Total log-likelihood | Term | Description |
|---|---|---|---|
| 0.2 | 2.8 | GO:0072687 | meiotic spindle(GO:0072687) |
| 0.1 | 1.9 | GO:0036038 | MKS complex(GO:0036038) |
| 0.1 | 0.4 | GO:0031673 | H zone(GO:0031673) |
| 0.1 | 0.5 | GO:0032777 | Piccolo NuA4 histone acetyltransferase complex(GO:0032777) |
| 0.1 | 0.8 | GO:0070765 | gamma-secretase complex(GO:0070765) |
| 0.1 | 0.7 | GO:0030991 | intraciliary transport particle A(GO:0030991) |
| 0.0 | 0.1 | GO:0032302 | MutSbeta complex(GO:0032302) |
| 0.0 | 0.1 | GO:0048179 | activin receptor complex(GO:0048179) |
| 0.0 | 0.2 | GO:0097454 | Schwann cell microvillus(GO:0097454) |
| 0.0 | 0.2 | GO:0005945 | 6-phosphofructokinase complex(GO:0005945) |
| 0.0 | 0.4 | GO:0036157 | outer dynein arm(GO:0036157) |
| 0.0 | 0.2 | GO:0032444 | activin responsive factor complex(GO:0032444) |
| 0.0 | 0.1 | GO:0034751 | aryl hydrocarbon receptor complex(GO:0034751) |
| 0.0 | 0.2 | GO:1990111 | spermatoproteasome complex(GO:1990111) |
| 0.0 | 0.5 | GO:0031932 | TORC2 complex(GO:0031932) |
| 0.0 | 0.1 | GO:0030956 | glutamyl-tRNA(Gln) amidotransferase complex(GO:0030956) |
| 0.0 | 0.3 | GO:0097386 | glial cell projection(GO:0097386) |
| 0.0 | 0.4 | GO:0071004 | U2-type prespliceosome(GO:0071004) |
| 0.0 | 0.5 | GO:0000407 | pre-autophagosomal structure(GO:0000407) |
| 0.0 | 0.2 | GO:0030008 | TRAPP complex(GO:0030008) |
| 0.0 | 0.0 | GO:0036396 | MIS complex(GO:0036396) mRNA editing complex(GO:0045293) |
| 0.0 | 0.1 | GO:0032039 | integrator complex(GO:0032039) |
Gene overrepresentation in molecular_function category:
| Log-likelihood per target | Total log-likelihood | Term | Description |
|---|---|---|---|
| 0.2 | 2.0 | GO:0016206 | catechol O-methyltransferase activity(GO:0016206) |
| 0.1 | 0.5 | GO:0008336 | gamma-butyrobetaine dioxygenase activity(GO:0008336) |
| 0.1 | 0.8 | GO:0008158 | hedgehog receptor activity(GO:0008158) |
| 0.1 | 0.3 | GO:0032090 | Pyrin domain binding(GO:0032090) |
| 0.1 | 0.6 | GO:0015501 | glutamate:sodium symporter activity(GO:0015501) |
| 0.1 | 0.3 | GO:0016211 | glutamate-ammonia ligase activity(GO:0004356) ammonia ligase activity(GO:0016211) acid-ammonia (or amide) ligase activity(GO:0016880) |
| 0.1 | 0.2 | GO:0004450 | isocitrate dehydrogenase (NADP+) activity(GO:0004450) |
| 0.0 | 1.1 | GO:0070330 | aromatase activity(GO:0070330) |
| 0.0 | 0.1 | GO:0000404 | heteroduplex DNA loop binding(GO:0000404) double-strand/single-strand DNA junction binding(GO:0000406) dinucleotide repeat insertion binding(GO:0032181) |
| 0.0 | 0.2 | GO:0001069 | regulatory region RNA binding(GO:0001069) |
| 0.0 | 0.1 | GO:0002134 | pyrimidine nucleoside binding(GO:0001884) UTP binding(GO:0002134) sulfonylurea receptor binding(GO:0017098) pyrimidine ribonucleoside binding(GO:0032551) |
| 0.0 | 0.2 | GO:0047685 | amine sulfotransferase activity(GO:0047685) |
| 0.0 | 0.6 | GO:0015174 | basic amino acid transmembrane transporter activity(GO:0015174) |
| 0.0 | 0.1 | GO:0051538 | 3 iron, 4 sulfur cluster binding(GO:0051538) |
| 0.0 | 0.2 | GO:0043199 | sulfate binding(GO:0043199) |
| 0.0 | 0.2 | GO:0003872 | 6-phosphofructokinase activity(GO:0003872) |
| 0.0 | 1.0 | GO:0004550 | nucleoside diphosphate kinase activity(GO:0004550) |
| 0.0 | 0.1 | GO:0016361 | activin receptor activity, type I(GO:0016361) |
| 0.0 | 0.2 | GO:0003956 | NAD(P)+-protein-arginine ADP-ribosyltransferase activity(GO:0003956) |
| 0.0 | 0.3 | GO:1990380 | Lys48-specific deubiquitinase activity(GO:1990380) |
| 0.0 | 0.1 | GO:0031697 | beta-1 adrenergic receptor binding(GO:0031697) |
| 0.0 | 0.7 | GO:0003841 | 1-acylglycerol-3-phosphate O-acyltransferase activity(GO:0003841) |
| 0.0 | 0.1 | GO:0050567 | glutaminyl-tRNA synthase (glutamine-hydrolyzing) activity(GO:0050567) |
| 0.0 | 0.2 | GO:0022851 | GABA-gated chloride ion channel activity(GO:0022851) |
| 0.0 | 0.1 | GO:0098821 | BMP receptor activity(GO:0098821) |
| 0.0 | 0.3 | GO:0001161 | intronic transcription regulatory region sequence-specific DNA binding(GO:0001161) intronic transcription regulatory region DNA binding(GO:0044213) |
| 0.0 | 0.2 | GO:0030249 | guanylate cyclase regulator activity(GO:0030249) |
| 0.0 | 0.2 | GO:0031419 | cobalamin binding(GO:0031419) |
| 0.0 | 0.1 | GO:1990829 | C-rich single-stranded DNA binding(GO:1990829) |
| 0.0 | 0.1 | GO:0001129 | RNA polymerase II transcription factor activity, TBP-class protein binding, involved in preinitiation complex assembly(GO:0001129) RNA polymerase II transcription factor activity, TBP-class protein binding(GO:0001132) |
| 0.0 | 0.2 | GO:0004791 | thioredoxin-disulfide reductase activity(GO:0004791) |
| 0.0 | 0.3 | GO:0086080 | protein binding involved in heterotypic cell-cell adhesion(GO:0086080) |
| 0.0 | 0.0 | GO:0016422 | mRNA (2'-O-methyladenosine-N6-)-methyltransferase activity(GO:0016422) |
| 0.0 | 0.3 | GO:0051010 | microtubule plus-end binding(GO:0051010) |
| 0.0 | 0.1 | GO:0001591 | dopamine neurotransmitter receptor activity, coupled via Gi/Go(GO:0001591) |
| 0.0 | 0.1 | GO:0097199 | cysteine-type endopeptidase activity involved in apoptotic signaling pathway(GO:0097199) |
| 0.0 | 0.1 | GO:0097109 | neuroligin family protein binding(GO:0097109) |
| 0.0 | 0.0 | GO:0031531 | thyrotropin-releasing hormone receptor binding(GO:0031531) |
| 0.0 | 0.2 | GO:0004062 | aryl sulfotransferase activity(GO:0004062) |
| 0.0 | 0.3 | GO:0005229 | intracellular calcium activated chloride channel activity(GO:0005229) |
| 0.0 | 0.1 | GO:0030884 | lipid antigen binding(GO:0030882) endogenous lipid antigen binding(GO:0030883) exogenous lipid antigen binding(GO:0030884) |
| 0.0 | 0.1 | GO:0008240 | tripeptidyl-peptidase activity(GO:0008240) |
| 0.0 | 0.1 | GO:0016428 | tRNA (cytosine-5-)-methyltransferase activity(GO:0016428) |
Gene overrepresentation in C2:CP category:
| Log-likelihood per target | Total log-likelihood | Term | Description |
|---|---|---|---|
| 0.0 | 0.8 | PID_SYNDECAN_3_PATHWAY | Syndecan-3-mediated signaling events |
| 0.0 | 0.4 | PID_ALK2_PATHWAY | ALK2 signaling events |
Gene overrepresentation in C2:CP:REACTOME category:
| Log-likelihood per target | Total log-likelihood | Term | Description |
|---|---|---|---|
| 0.1 | 1.1 | REACTOME_XENOBIOTICS | Genes involved in Xenobiotics |
| 0.0 | 0.8 | REACTOME_REGULATED_PROTEOLYSIS_OF_P75NTR | Genes involved in Regulated proteolysis of p75NTR |
| 0.0 | 0.7 | REACTOME_SYNTHESIS_OF_PA | Genes involved in Synthesis of PA |
| 0.0 | 0.4 | REACTOME_CYTOSOLIC_SULFONATION_OF_SMALL_MOLECULES | Genes involved in Cytosolic sulfonation of small molecules |
| 0.0 | 1.1 | REACTOME_AMINO_ACID_AND_OLIGOPEPTIDE_SLC_TRANSPORTERS | Genes involved in Amino acid and oligopeptide SLC transporters |
| 0.0 | 0.3 | REACTOME_CITRIC_ACID_CYCLE_TCA_CYCLE | Genes involved in Citric acid cycle (TCA cycle) |
| 0.0 | 0.1 | REACTOME_SYNTHESIS_OF_BILE_ACIDS_AND_BILE_SALTS_VIA_24_HYDROXYCHOLESTEROL | Genes involved in Synthesis of bile acids and bile salts via 24-hydroxycholesterol |