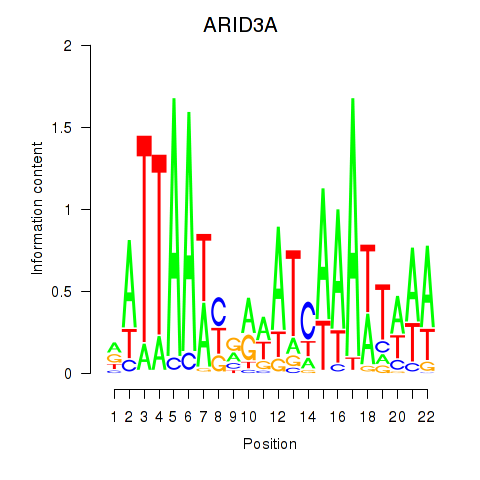
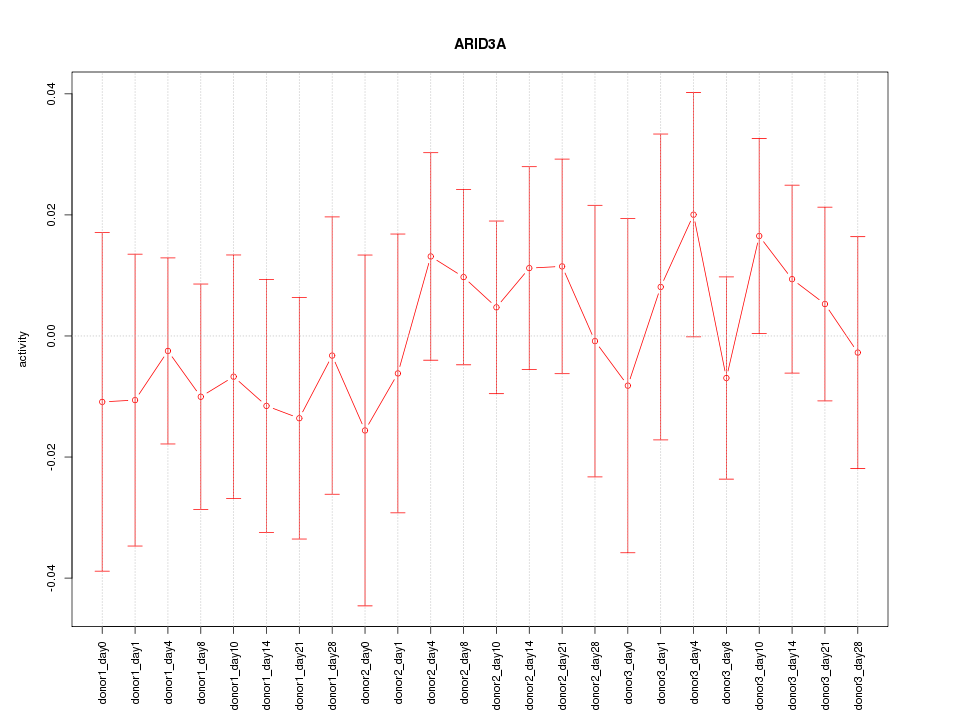
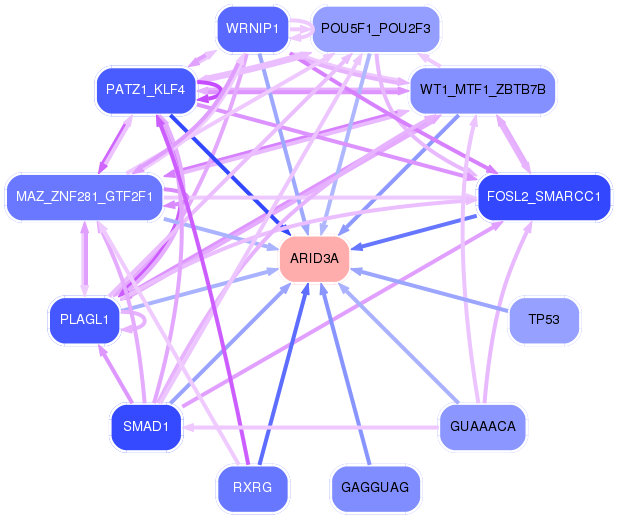
Motif ID: ARID3A
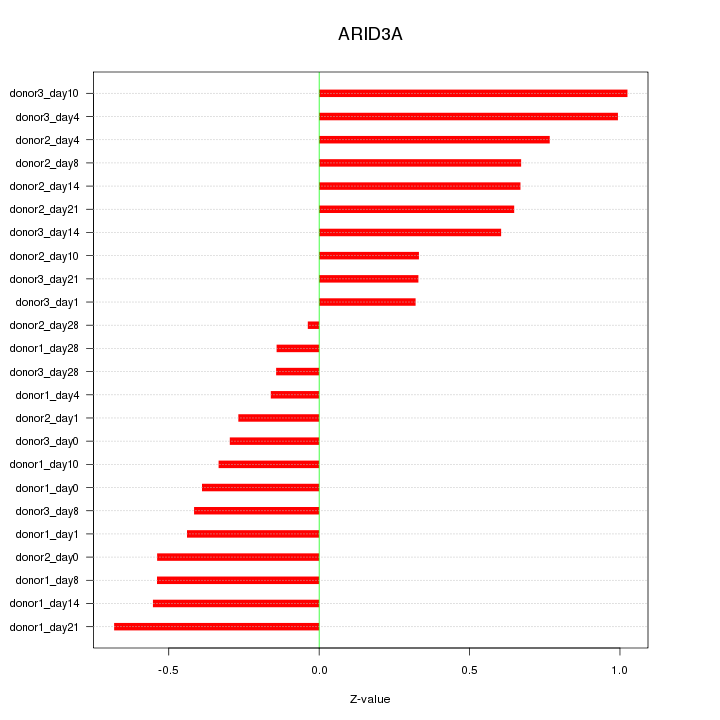
Z-value: 0.534
Transcription factors associated with ARID3A:
| Gene Symbol | Entrez ID | Gene Name |
|---|---|---|
| ARID3A | ENSG00000116017.6 | ARID3A |
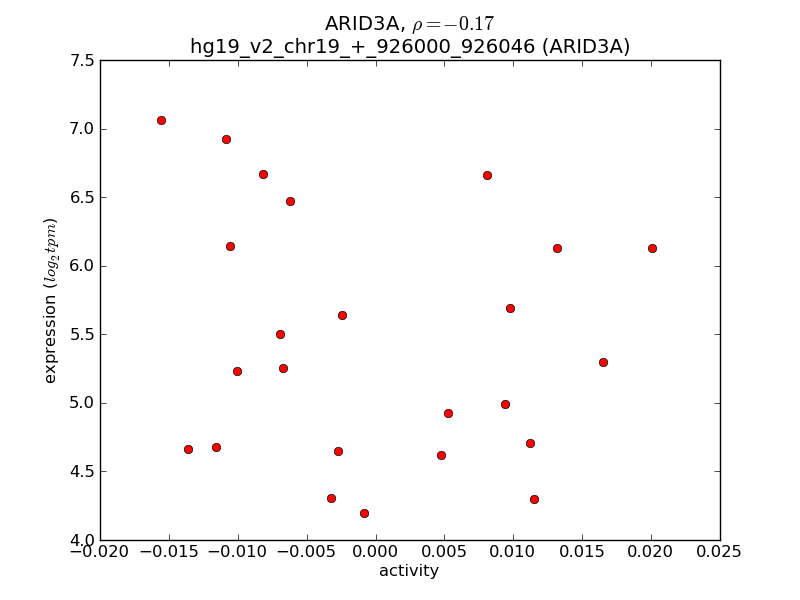
Activity-expression correlation:
| Gene Symbol | Promoter | Pearson corr. coef. | P-value | Plot |
|---|---|---|---|---|
| ARID3A | hg19_v2_chr19_+_926000_926046 | -0.17 | 4.3e-01 | Click! |

Top targets:
Gene overrepresentation in biological_process category:
| Log-likelihood per target | Total log-likelihood | Term | Description |
|---|---|---|---|
| 0.3 | 1.0 | GO:0036269 | swimming behavior(GO:0036269) |
| 0.3 | 0.8 | GO:0044278 | cell wall disruption in other organism(GO:0044278) |
| 0.2 | 0.7 | GO:0045897 | positive regulation of transcription during mitosis(GO:0045897) |
| 0.1 | 0.4 | GO:0051771 | negative regulation of nitric-oxide synthase biosynthetic process(GO:0051771) |
| 0.1 | 0.4 | GO:0019355 | nicotinamide nucleotide biosynthetic process from aspartate(GO:0019355) 'de novo' NAD biosynthetic process from aspartate(GO:0034628) |
| 0.1 | 0.6 | GO:1903385 | regulation of homophilic cell adhesion(GO:1903385) |
| 0.1 | 0.5 | GO:0034441 | plasma lipoprotein particle oxidation(GO:0034441) |
| 0.1 | 0.2 | GO:0003366 | cell-matrix adhesion involved in ameboidal cell migration(GO:0003366) |
| 0.1 | 1.4 | GO:0052695 | cellular glucuronidation(GO:0052695) |
| 0.1 | 0.2 | GO:1900245 | positive regulation of MDA-5 signaling pathway(GO:1900245) |
| 0.1 | 0.2 | GO:0007181 | transforming growth factor beta receptor complex assembly(GO:0007181) |
| 0.1 | 0.8 | GO:0070327 | thyroid hormone transport(GO:0070327) |
| 0.1 | 0.2 | GO:0044240 | multicellular organism lipid catabolic process(GO:0044240) |
| 0.0 | 0.4 | GO:0072592 | oxygen metabolic process(GO:0072592) |
| 0.0 | 0.2 | GO:0002669 | positive regulation of T cell anergy(GO:0002669) positive regulation of lymphocyte anergy(GO:0002913) |
| 0.0 | 0.6 | GO:0019317 | fucose catabolic process(GO:0019317) L-fucose metabolic process(GO:0042354) L-fucose catabolic process(GO:0042355) |
| 0.0 | 0.3 | GO:0032497 | detection of lipopolysaccharide(GO:0032497) |
| 0.0 | 0.3 | GO:0071651 | positive regulation of chemokine (C-C motif) ligand 5 production(GO:0071651) |
| 0.0 | 0.1 | GO:1900369 | negative regulation of RNA interference(GO:1900369) |
| 0.0 | 0.1 | GO:0036512 | trimming of terminal mannose on B branch(GO:0036509) trimming of first mannose on A branch(GO:0036511) trimming of second mannose on A branch(GO:0036512) |
| 0.0 | 0.2 | GO:1904139 | microglial cell migration(GO:1904124) regulation of microglial cell migration(GO:1904139) |
| 0.0 | 0.4 | GO:0043152 | induction of bacterial agglutination(GO:0043152) |
| 0.0 | 0.2 | GO:0000023 | maltose metabolic process(GO:0000023) |
| 0.0 | 0.1 | GO:0090149 | synaptic vesicle recycling via endosome(GO:0036466) mitochondrial membrane fission(GO:0090149) |
| 0.0 | 0.3 | GO:0014827 | intestine smooth muscle contraction(GO:0014827) |
| 0.0 | 0.2 | GO:0090625 | mRNA cleavage involved in gene silencing by siRNA(GO:0090625) |
| 0.0 | 0.2 | GO:2001256 | regulation of store-operated calcium entry(GO:2001256) |
| 0.0 | 0.2 | GO:0071896 | protein localization to adherens junction(GO:0071896) |
| 0.0 | 0.2 | GO:0035799 | ureter maturation(GO:0035799) |
| 0.0 | 0.5 | GO:0002566 | somatic diversification of immune receptors via somatic mutation(GO:0002566) |
| 0.0 | 0.1 | GO:0010430 | fatty acid omega-oxidation(GO:0010430) |
| 0.0 | 0.1 | GO:0042369 | vitamin D catabolic process(GO:0042369) |
| 0.0 | 0.1 | GO:0002586 | negative regulation of antigen processing and presentation of peptide or polysaccharide antigen via MHC class II(GO:0002581) regulation of antigen processing and presentation of peptide antigen via MHC class II(GO:0002586) |
| 0.0 | 0.1 | GO:0010513 | positive regulation of phosphatidylinositol biosynthetic process(GO:0010513) |
| 0.0 | 0.2 | GO:0043950 | positive regulation of cAMP-mediated signaling(GO:0043950) |
| 0.0 | 0.2 | GO:0034316 | negative regulation of Arp2/3 complex-mediated actin nucleation(GO:0034316) |
| 0.0 | 0.1 | GO:0044861 | protein transport into plasma membrane raft(GO:0044861) |
| 0.0 | 0.2 | GO:0099566 | regulation of postsynaptic cytosolic calcium ion concentration(GO:0099566) |
| 0.0 | 0.2 | GO:0061669 | spontaneous neurotransmitter secretion(GO:0061669) spontaneous synaptic transmission(GO:0098814) |
| 0.0 | 0.2 | GO:0070166 | enamel mineralization(GO:0070166) |
| 0.0 | 0.2 | GO:0031444 | slow-twitch skeletal muscle fiber contraction(GO:0031444) |
| 0.0 | 0.1 | GO:0015783 | GDP-fucose transport(GO:0015783) purine nucleotide-sugar transport(GO:0036079) |
| 0.0 | 0.2 | GO:0035457 | cellular response to interferon-alpha(GO:0035457) |
| 0.0 | 0.1 | GO:2000439 | positive regulation of monocyte extravasation(GO:2000439) |
| 0.0 | 0.1 | GO:0090526 | regulation of gluconeogenesis involved in cellular glucose homeostasis(GO:0090526) |
| 0.0 | 0.1 | GO:0071921 | establishment of sister chromatid cohesion(GO:0034085) cohesin loading(GO:0071921) regulation of cohesin loading(GO:0071922) |
| 0.0 | 0.4 | GO:0009312 | oligosaccharide biosynthetic process(GO:0009312) |
| 0.0 | 0.1 | GO:0034334 | adherens junction maintenance(GO:0034334) |
| 0.0 | 0.2 | GO:0060352 | cell adhesion molecule production(GO:0060352) |
| 0.0 | 0.2 | GO:0006600 | creatine metabolic process(GO:0006600) |
| 0.0 | 0.1 | GO:0033564 | anterior/posterior axon guidance(GO:0033564) |
| 0.0 | 0.2 | GO:0043249 | erythrocyte maturation(GO:0043249) |
| 0.0 | 0.1 | GO:0098535 | de novo centriole assembly(GO:0098535) |
| 0.0 | 0.3 | GO:0036149 | phosphatidylinositol acyl-chain remodeling(GO:0036149) |
| 0.0 | 0.3 | GO:0042226 | interleukin-6 biosynthetic process(GO:0042226) |
| 0.0 | 0.1 | GO:0032510 | endosome to lysosome transport via multivesicular body sorting pathway(GO:0032510) |
| 0.0 | 0.2 | GO:0036158 | outer dynein arm assembly(GO:0036158) |
| 0.0 | 0.1 | GO:1904896 | ESCRT complex disassembly(GO:1904896) ESCRT III complex disassembly(GO:1904903) |
| 0.0 | 0.1 | GO:0006848 | pyruvate transport(GO:0006848) pyruvate transmembrane transport(GO:1901475) |
| 0.0 | 0.8 | GO:1904893 | negative regulation of JAK-STAT cascade(GO:0046426) negative regulation of STAT cascade(GO:1904893) |
Gene overrepresentation in cellular_component category:
| Log-likelihood per target | Total log-likelihood | Term | Description |
|---|---|---|---|
| 0.2 | 1.0 | GO:0030485 | smooth muscle contractile fiber(GO:0030485) |
| 0.1 | 0.4 | GO:0097057 | TRAF2-GSTP1 complex(GO:0097057) |
| 0.1 | 0.2 | GO:0034669 | integrin alpha4-beta7 complex(GO:0034669) |
| 0.1 | 0.3 | GO:0046696 | lipopolysaccharide receptor complex(GO:0046696) |
| 0.1 | 0.5 | GO:0032389 | MutLalpha complex(GO:0032389) |
| 0.1 | 0.2 | GO:0034673 | inhibin-betaglycan-ActRII complex(GO:0034673) |
| 0.0 | 0.1 | GO:0043159 | cytoskeletal calyx(GO:0033150) acrosomal matrix(GO:0043159) |
| 0.0 | 0.3 | GO:0000120 | RNA polymerase I transcription factor complex(GO:0000120) |
| 0.0 | 0.2 | GO:0030061 | mitochondrial crista(GO:0030061) |
| 0.0 | 0.2 | GO:0044308 | axonal spine(GO:0044308) |
| 0.0 | 0.2 | GO:0005833 | hemoglobin complex(GO:0005833) |
| 0.0 | 0.0 | GO:0005712 | chiasma(GO:0005712) |
| 0.0 | 0.1 | GO:0044530 | supraspliceosomal complex(GO:0044530) |
| 0.0 | 0.4 | GO:0042589 | zymogen granule membrane(GO:0042589) |
| 0.0 | 0.1 | GO:0098536 | deuterosome(GO:0098536) |
| 0.0 | 0.2 | GO:0042105 | alpha-beta T cell receptor complex(GO:0042105) |
| 0.0 | 0.2 | GO:0097025 | MPP7-DLG1-LIN7 complex(GO:0097025) |
| 0.0 | 0.2 | GO:0035631 | CD40 receptor complex(GO:0035631) |
| 0.0 | 0.1 | GO:0044352 | pinosome(GO:0044352) macropinosome(GO:0044354) |
| 0.0 | 0.1 | GO:0033165 | interphotoreceptor matrix(GO:0033165) |
| 0.0 | 0.2 | GO:0035068 | micro-ribonucleoprotein complex(GO:0035068) |
| 0.0 | 0.1 | GO:0044614 | nuclear pore cytoplasmic filaments(GO:0044614) |
| 0.0 | 0.8 | GO:0005782 | peroxisomal matrix(GO:0005782) microbody lumen(GO:0031907) |
| 0.0 | 0.3 | GO:0005852 | eukaryotic translation initiation factor 3 complex(GO:0005852) |
| 0.0 | 0.1 | GO:0042382 | paraspeckles(GO:0042382) |
Gene overrepresentation in molecular_function category:
| Log-likelihood per target | Total log-likelihood | Term | Description |
|---|---|---|---|
| 0.3 | 1.0 | GO:0033754 | indoleamine 2,3-dioxygenase activity(GO:0033754) |
| 0.2 | 0.8 | GO:0016639 | oxidoreductase activity, acting on the CH-NH2 group of donors, NAD or NADP as acceptor(GO:0016639) |
| 0.1 | 0.4 | GO:0000309 | nicotinamide-nucleotide adenylyltransferase activity(GO:0000309) |
| 0.1 | 0.4 | GO:0070026 | nitric oxide binding(GO:0070026) |
| 0.1 | 0.4 | GO:0004473 | malate dehydrogenase (decarboxylating) (NAD+) activity(GO:0004471) malate dehydrogenase (decarboxylating) (NADP+) activity(GO:0004473) |
| 0.1 | 0.7 | GO:0047499 | calcium-independent phospholipase A2 activity(GO:0047499) |
| 0.1 | 0.5 | GO:0032138 | single base insertion or deletion binding(GO:0032138) |
| 0.1 | 0.2 | GO:0003829 | beta-1,3-galactosyl-O-glycosyl-glycoprotein beta-1,6-N-acetylglucosaminyltransferase activity(GO:0003829) |
| 0.1 | 0.2 | GO:0008386 | cholesterol monooxygenase (side-chain-cleaving) activity(GO:0008386) |
| 0.1 | 0.4 | GO:0001665 | alpha-N-acetylgalactosaminide alpha-2,6-sialyltransferase activity(GO:0001665) |
| 0.0 | 0.8 | GO:0042834 | peptidoglycan binding(GO:0042834) |
| 0.0 | 0.2 | GO:0048248 | CXCR3 chemokine receptor binding(GO:0048248) |
| 0.0 | 0.2 | GO:0023024 | MHC class I protein complex binding(GO:0023024) |
| 0.0 | 0.2 | GO:0016160 | amylase activity(GO:0016160) |
| 0.0 | 0.1 | GO:0031783 | corticotropin hormone receptor binding(GO:0031780) type 5 melanocortin receptor binding(GO:0031783) |
| 0.0 | 0.3 | GO:0001875 | lipopolysaccharide receptor activity(GO:0001875) |
| 0.0 | 0.7 | GO:0004993 | G-protein coupled serotonin receptor activity(GO:0004993) |
| 0.0 | 1.4 | GO:0015020 | glucuronosyltransferase activity(GO:0015020) |
| 0.0 | 0.6 | GO:0008417 | fucosyltransferase activity(GO:0008417) |
| 0.0 | 0.1 | GO:0005042 | netrin receptor activity(GO:0005042) |
| 0.0 | 0.2 | GO:0000293 | ferric-chelate reductase activity(GO:0000293) |
| 0.0 | 0.3 | GO:0033592 | RNA strand annealing activity(GO:0033592) |
| 0.0 | 0.1 | GO:0003726 | double-stranded RNA adenosine deaminase activity(GO:0003726) |
| 0.0 | 0.1 | GO:0005124 | scavenger receptor binding(GO:0005124) |
| 0.0 | 0.1 | GO:0005477 | pyruvate secondary active transmembrane transporter activity(GO:0005477) |
| 0.0 | 0.2 | GO:0099529 | neurotransmitter receptor activity involved in regulation of postsynaptic membrane potential(GO:0099529) neurotransmitter receptor activity involved in regulation of postsynaptic cytosolic calcium ion concentration(GO:0099583) transmitter-gated ion channel activity involved in regulation of postsynaptic membrane potential(GO:1904315) |
| 0.0 | 0.6 | GO:0005001 | transmembrane receptor protein tyrosine phosphatase activity(GO:0005001) transmembrane receptor protein phosphatase activity(GO:0019198) |
| 0.0 | 0.2 | GO:0005114 | type II transforming growth factor beta receptor binding(GO:0005114) |
| 0.0 | 0.1 | GO:0004031 | aldehyde oxidase activity(GO:0004031) |
| 0.0 | 0.1 | GO:0005105 | type 1 fibroblast growth factor receptor binding(GO:0005105) |
| 0.0 | 0.2 | GO:0047498 | calcium-dependent phospholipase A2 activity(GO:0047498) |
| 0.0 | 0.1 | GO:0005457 | GDP-fucose transmembrane transporter activity(GO:0005457) purine nucleotide-sugar transmembrane transporter activity(GO:0036080) |
| 0.0 | 0.2 | GO:0001609 | G-protein coupled adenosine receptor activity(GO:0001609) |
| 0.0 | 0.1 | GO:0019237 | centromeric DNA binding(GO:0019237) |
| 0.0 | 0.2 | GO:0004028 | 3-chloroallyl aldehyde dehydrogenase activity(GO:0004028) |
| 0.0 | 0.2 | GO:0042608 | T cell receptor binding(GO:0042608) |
| 0.0 | 0.5 | GO:0019707 | protein-cysteine S-palmitoyltransferase activity(GO:0019706) protein-cysteine S-acyltransferase activity(GO:0019707) |
| 0.0 | 0.2 | GO:0005432 | calcium:sodium antiporter activity(GO:0005432) |
| 0.0 | 0.1 | GO:0004977 | melanocortin receptor activity(GO:0004977) |
| 0.0 | 0.1 | GO:0010348 | lithium:proton antiporter activity(GO:0010348) |
| 0.0 | 0.3 | GO:0004065 | arylsulfatase activity(GO:0004065) |
| 0.0 | 0.1 | GO:0017040 | ceramidase activity(GO:0017040) |
| 0.0 | 0.2 | GO:0071933 | Arp2/3 complex binding(GO:0071933) |
| 0.0 | 0.2 | GO:0008329 | signaling pattern recognition receptor activity(GO:0008329) pattern recognition receptor activity(GO:0038187) |
| 0.0 | 0.3 | GO:0001013 | RNA polymerase I regulatory region DNA binding(GO:0001013) RNA polymerase I regulatory region sequence-specific DNA binding(GO:0001163) RNA polymerase I CORE element sequence-specific DNA binding(GO:0001164) |
| 0.0 | 0.1 | GO:0072345 | NAADP-sensitive calcium-release channel activity(GO:0072345) |
| 0.0 | 0.2 | GO:0031996 | thioesterase binding(GO:0031996) |
| 0.0 | 0.1 | GO:0005497 | androgen binding(GO:0005497) |
| 0.0 | 0.2 | GO:0031014 | troponin T binding(GO:0031014) |
| 0.0 | 0.1 | GO:0004571 | mannosyl-oligosaccharide 1,2-alpha-mannosidase activity(GO:0004571) |
Gene overrepresentation in C2:CP category:
| Log-likelihood per target | Total log-likelihood | Term | Description |
|---|---|---|---|
| 0.0 | 0.6 | PID_LIS1_PATHWAY | Lissencephaly gene (LIS1) in neuronal migration and development |
Gene overrepresentation in C2:CP:REACTOME category:
| Log-likelihood per target | Total log-likelihood | Term | Description |
|---|---|---|---|
| 0.1 | 1.4 | REACTOME_GLUCURONIDATION | Genes involved in Glucuronidation |
| 0.1 | 1.0 | REACTOME_TRYPTOPHAN_CATABOLISM | Genes involved in Tryptophan catabolism |
| 0.0 | 0.4 | REACTOME_SEROTONIN_RECEPTORS | Genes involved in Serotonin receptors |
| 0.0 | 0.5 | REACTOME_ACYL_CHAIN_REMODELLING_OF_PI | Genes involved in Acyl chain remodelling of PI |
| 0.0 | 0.3 | REACTOME_IKK_COMPLEX_RECRUITMENT_MEDIATED_BY_RIP1 | Genes involved in IKK complex recruitment mediated by RIP1 |
| 0.0 | 0.5 | REACTOME_SYNTHESIS_SECRETION_AND_DEACYLATION_OF_GHRELIN | Genes involved in Synthesis, Secretion, and Deacylation of Ghrelin |
| 0.0 | 0.2 | REACTOME_DIGESTION_OF_DIETARY_CARBOHYDRATE | Genes involved in Digestion of dietary carbohydrate |
| 0.0 | 0.5 | REACTOME_REGULATION_OF_COMPLEMENT_CASCADE | Genes involved in Regulation of Complement cascade |
| 0.0 | 0.3 | REACTOME_THE_ACTIVATION_OF_ARYLSULFATASES | Genes involved in The activation of arylsulfatases |
| 0.0 | 0.5 | REACTOME_GLUTATHIONE_CONJUGATION | Genes involved in Glutathione conjugation |
| 0.0 | 0.2 | REACTOME_P2Y_RECEPTORS | Genes involved in P2Y receptors |