Project
GSE43616: Time-course of wild-type Arabidopsis leaf
Navigation
Downloads
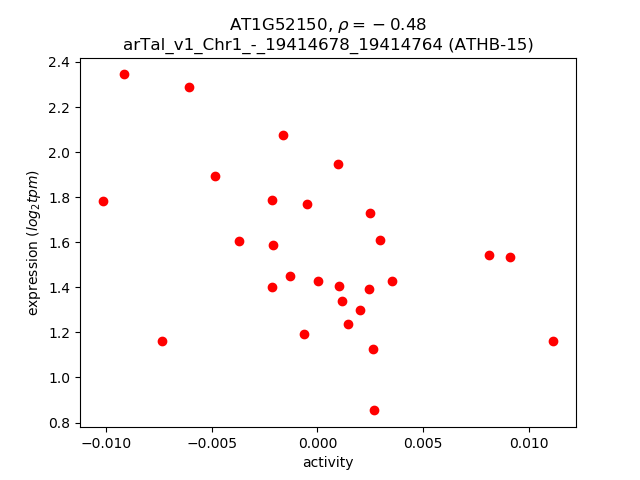
Results for AT1G52150
Z-value: 0.44
Transcription factors associated with AT1G52150
| Gene Symbol | Gene ID | Gene Info |
|---|---|---|
|
AT1G52150
|
AT1G52150 | Homeobox-leucine zipper family protein / lipid-binding START domain-containing protein |
Activity-expression correlation:
| Gene | Promoter | Pearson corr. coef. | P-value | Plot |
|---|---|---|---|---|
| ATHB-15 | arTal_v1_Chr1_-_19414678_19414764 | -0.48 | 9.5e-03 | Click! |
Activity profile of AT1G52150 motif
Sorted Z-values of AT1G52150 motif
| Promoter | Log-likelihood | Transcript | Gene | Gene Info |
|---|---|---|---|---|
| arTal_v1_Chr4_-_18098633_18098633 | 1.21 |
AT4G38770.1
|
PRP4
|
proline-rich protein 4 |
| arTal_v1_Chr5_+_9072708_9072727 | 1.16 |
AT5G25980.2
AT5G25980.1 AT5G25980.3 |
TGG2
|
glucoside glucohydrolase 2 |
| arTal_v1_Chr2_-_1800472_1800472 | 0.91 |
AT2G05070.1
|
LHCB2.2
|
photosystem II light harvesting complex protein 2.2 |
| arTal_v1_Chr5_+_4757856_4757972 | 0.90 |
AT5G14740.3
AT5G14740.6 AT5G14740.1 AT5G14740.7 AT5G14740.8 AT5G14740.2 AT5G14740.4 AT5G14740.5 |
CA2
|
carbonic anhydrase 2 |
| arTal_v1_Chr4_-_17777445_17777445 | 0.87 |
AT4G37800.1
|
XTH7
|
xyloglucan endotransglucosylase/hydrolase 7 |
| arTal_v1_Chr5_+_26298728_26298728 | 0.83 |
AT5G65730.1
|
XTH6
|
xyloglucan endotransglucosylase/hydrolase 6 |
| arTal_v1_Chr5_-_9082384_9082384 | 0.83 |
AT5G26000.1
AT5G26000.2 |
TGG1
|
thioglucoside glucohydrolase 1 |
| arTal_v1_Chr5_-_19648362_19648362 | 0.81 |
AT5G48490.1
|
AT5G48490
|
Bifunctional inhibitor/lipid-transfer protein/seed storage 2S albumin superfamily protein |
| arTal_v1_Chr1_+_3008910_3008910 | 0.80 |
AT1G09310.1
|
AT1G09310
|
plant/protein (Protein of unknown function, DUF538) |
| arTal_v1_Chr5_+_4758921_4758921 | 0.77 |
AT5G14740.9
|
CA2
|
carbonic anhydrase 2 |
| arTal_v1_Chr5_+_5237970_5238178 | 0.76 |
AT5G16030.1
AT5G16030.4 AT5G16030.2 AT5G16030.3 |
AT5G16030
|
mental retardation GTPase activating protein |
| arTal_v1_Chr5_+_22038165_22038165 | 0.75 |
AT5G54270.1
|
LHCB3
|
light-harvesting chlorophyll B-binding protein 3 |
| arTal_v1_Chr4_-_7493080_7493080 | 0.72 |
AT4G12730.1
|
FLA2
|
FASCICLIN-like arabinogalactan 2 |
| arTal_v1_Chr3_+_5556710_5556710 | 0.72 |
AT3G16370.1
|
AT3G16370
|
GDSL-like Lipase/Acylhydrolase superfamily protein |
| arTal_v1_Chr1_+_10722183_10722183 | 0.70 |
AT1G30380.1
|
PSAK
|
photosystem I subunit K |
| arTal_v1_Chr3_+_18046144_18046144 | 0.70 |
AT3G48720.1
|
DCF
|
HXXXD-type acyl-transferase family protein |
| arTal_v1_Chr5_-_8916856_8916856 | 0.69 |
AT5G25610.1
|
RD22
|
BURP domain-containing protein |
| arTal_v1_Chr3_-_23165387_23165387 | 0.68 |
AT3G62630.1
|
AT3G62630
|
stress response NST1-like protein (DUF1645) |
| arTal_v1_Chr5_-_25898171_25898171 | 0.67 |
AT5G64770.1
|
RGF9
|
root meristem growth factor |
| arTal_v1_Chr5_+_5238502_5238502 | 0.67 |
AT5G16030.5
|
AT5G16030
|
mental retardation GTPase activating protein |
| arTal_v1_Chr4_-_18165740_18165740 | 0.64 |
AT4G38970.2
|
FBA2
|
fructose-bisphosphate aldolase 2 |
| arTal_v1_Chr4_-_18166008_18166008 | 0.64 |
AT4G38970.1
|
FBA2
|
fructose-bisphosphate aldolase 2 |
| arTal_v1_Chr1_+_10371675_10371675 | 0.64 |
AT1G29660.1
|
AT1G29660
|
GDSL-like Lipase/Acylhydrolase superfamily protein |
| arTal_v1_Chr5_+_26767599_26767599 | 0.64 |
AT5G67070.1
|
RALFL34
|
ralf-like 34 |
| arTal_v1_Chr1_-_29485389_29485389 | 0.63 |
AT1G78370.1
|
GSTU20
|
glutathione S-transferase TAU 20 |
| arTal_v1_Chr2_-_1824480_1824480 | 0.63 |
AT2G05100.1
AT2G05100.2 |
LHCB2.1
|
photosystem II light harvesting complex protein 2.1 |
| arTal_v1_Chr5_-_25343369_25343369 | 0.62 |
AT5G63180.1
|
AT5G63180
|
Pectin lyase-like superfamily protein |
| arTal_v1_Chr1_+_26687202_26687202 | 0.62 |
AT1G70760.1
|
NdhL
|
inorganic carbon transport protein-like protein |
| arTal_v1_Chr1_+_1136078_1136078 | 0.61 |
AT1G04250.1
|
AXR3
|
AUX/IAA transcriptional regulator family protein |
| arTal_v1_Chr5_-_18371021_18371021 | 0.60 |
AT5G45340.2
AT5G45340.1 |
CYP707A3
|
cytochrome P450, family 707, subfamily A, polypeptide 3 |
| arTal_v1_Chr4_+_12876822_12876948 | 0.60 |
AT4G25080.6
AT4G25080.5 AT4G25080.2 AT4G25080.1 AT4G25080.3 AT4G25080.4 |
CHLM
|
magnesium-protoporphyrin IX methyltransferase |
| arTal_v1_Chr1_+_17918207_17918207 | 0.60 |
AT1G48480.1
|
RKL1
|
receptor-like kinase 1 |
| arTal_v1_Chr2_+_19243348_19243427 | 0.59 |
AT2G46820.1
AT2G46820.2 |
PSI-P
|
photosystem I P subunit |
| arTal_v1_Chr1_+_24647121_24647121 | 0.58 |
AT1G66180.1
|
AT1G66180
|
Eukaryotic aspartyl protease family protein |
| arTal_v1_Chr5_+_16468327_16468344 | 0.58 |
AT5G41140.1
AT5G41140.2 |
AT5G41140
|
Myosin heavy chain-related protein |
| arTal_v1_Chr2_+_2763449_2763513 | 0.58 |
AT2G06850.1
AT2G06850.2 |
XTH4
|
xyloglucan endotransglucosylase/hydrolase 4 |
| arTal_v1_Chr3_+_3698658_3698658 | 0.58 |
AT3G11700.1
|
FLA18
|
FASCICLIN-like arabinogalactan protein 18 precursor |
| arTal_v1_Chr3_+_8586359_8586359 | 0.57 |
AT3G23805.1
|
RALFL24
|
ralf-like 24 |
| arTal_v1_Chr5_-_17581275_17581275 | 0.57 |
AT5G43750.1
|
PnsB5
|
NAD(P)H dehydrogenase 18 |
| arTal_v1_Chr4_+_12660687_12660687 | 0.57 |
AT4G24510.1
|
CER2
|
HXXXD-type acyl-transferase family protein |
| arTal_v1_Chr1_+_20713499_20713499 | 0.56 |
AT1G55480.1
|
ZKT
|
protein containing PDZ domain, a K-box domain, and a TPR region |
| arTal_v1_Chr3_+_22745514_22745514 | 0.56 |
AT3G61470.1
|
LHCA2
|
photosystem I light harvesting complex protein |
| arTal_v1_Chr4_+_13177356_13177356 | 0.56 |
AT4G25960.1
|
ABCB2
|
P-glycoprotein 2 |
| arTal_v1_Chr5_-_20940895_20940895 | 0.55 |
AT5G51550.1
|
EXL3
|
EXORDIUM like 3 |
| arTal_v1_Chr3_-_22322661_22322661 | 0.55 |
AT3G60390.1
|
HAT3
|
homeobox-leucine zipper protein 3 |
| arTal_v1_Chr2_+_14216771_14216771 | 0.55 |
AT2G33570.1
|
GALS1
|
glycosyltransferase family protein (DUF23) |
| arTal_v1_Chr3_-_8589754_8589754 | 0.55 |
AT3G23810.1
|
SAHH2
|
S-adenosyl-l-homocysteine (SAH) hydrolase 2 |
| arTal_v1_Chr5_+_2680401_2680401 | 0.54 |
AT5G08330.1
|
TCP11
|
TCP family transcription factor |
| arTal_v1_Chr3_-_4008018_4008018 | 0.54 |
AT3G12610.1
|
DRT100
|
Leucine-rich repeat (LRR) family protein |
| arTal_v1_Chr3_+_188321_188384 | 0.53 |
AT3G01480.1
AT3G01480.2 |
CYP38
|
cyclophilin 38 |
| arTal_v1_Chr5_+_3889906_3889906 | 0.53 |
AT5G12050.1
|
AT5G12050
|
rho GTPase-activating protein |
| arTal_v1_Chr3_-_2334185_2334185 | 0.53 |
AT3G07320.1
|
AT3G07320
|
O-Glycosyl hydrolases family 17 protein |
| arTal_v1_Chr2_+_19191247_19191247 | 0.53 |
AT2G46710.1
|
ROPGAP3
|
Rho GTPase activating protein with PAK-box/P21-Rho-binding domain-containing protein |
| arTal_v1_Chr1_+_25374072_25374222 | 0.53 |
AT1G67700.1
AT1G67700.2 AT1G67700.5 AT1G67700.4 AT1G67700.3 |
AT1G67700
|
multidrug resistance protein |
| arTal_v1_Chr5_-_18026077_18026077 | 0.52 |
AT5G44680.1
|
AT5G44680
|
DNA glycosylase superfamily protein |
| arTal_v1_Chr4_-_13958107_13958107 | 0.52 |
AT4G28080.1
|
AT4G28080
|
Tetratricopeptide repeat (TPR)-like superfamily protein |
| arTal_v1_Chr1_+_4868346_4868346 | 0.52 |
AT1G14250.1
|
AT1G14250
|
GDA1/CD39 nucleoside phosphatase family protein |
| arTal_v1_Chr3_+_17929581_17929581 | 0.52 |
AT3G48420.1
|
AT3G48420
|
Haloacid dehalogenase-like hydrolase (HAD) superfamily protein |
| arTal_v1_Chr1_-_20648891_20648891 | 0.51 |
AT1G55330.1
|
AGP21
|
arabinogalactan protein 21 |
| arTal_v1_Chr5_+_2657054_2657054 | 0.51 |
AT5G08260.1
|
scpl35
|
serine carboxypeptidase-like 35 |
| arTal_v1_Chr4_-_17606924_17607050 | 0.51 |
AT4G37450.1
AT4G37450.2 |
AGP18
|
arabinogalactan protein 18 |
| arTal_v1_Chr3_-_6855513_6855590 | 0.50 |
AT3G19720.3
AT3G19720.2 AT3G19720.1 |
ARC5
|
P-loop containing nucleoside triphosphate hydrolases superfamily protein |
| arTal_v1_Chr5_-_740319_740319 | 0.50 |
AT5G03140.1
|
AT5G03140
|
Concanavalin A-like lectin protein kinase family protein |
| arTal_v1_Chr5_-_1293723_1293723 | 0.50 |
AT5G04530.1
|
KCS19
|
3-ketoacyl-CoA synthase 19 |
| arTal_v1_Chr1_+_25574381_25574381 | 0.50 |
AT1G68238.1
|
AT1G68238
|
transmembrane protein |
| arTal_v1_Chr3_+_10017321_10017321 | 0.50 |
AT3G27160.1
AT3G27160.2 |
GHS1
|
Ribosomal protein S21 family protein |
| arTal_v1_Chr1_+_20447157_20447208 | 0.50 |
AT1G54820.1
AT1G54820.2 AT1G54820.3 AT1G54820.4 |
AT1G54820
|
Protein kinase superfamily protein |
| arTal_v1_Chr1_+_19052193_19052193 | 0.49 |
AT1G51402.1
|
AT1G51402
|
hypothetical protein |
| arTal_v1_Chr2_-_12173951_12173991 | 0.49 |
AT2G28470.2
AT2G28470.4 AT2G28470.1 AT2G28470.3 |
BGAL8
|
beta-galactosidase 8 |
| arTal_v1_Chr2_+_6518749_6518749 | 0.49 |
AT2G15050.3
AT2G15050.1 AT2G15050.2 |
LTP
|
lipid transfer protein |
| arTal_v1_Chr1_-_19052582_19052582 | 0.49 |
AT1G51400.1
|
AT1G51400
|
Photosystem II 5 kD protein |
| arTal_v1_Chr5_-_24990331_24990331 | 0.49 |
AT5G62220.1
|
GT18
|
glycosyltransferase 18 |
| arTal_v1_Chr2_-_7496292_7496292 | 0.49 |
AT2G17230.1
|
EXL5
|
EXORDIUM like 5 |
| arTal_v1_Chr1_+_5878390_5878390 | 0.49 |
AT1G17200.1
|
AT1G17200
|
Uncharacterized protein family (UPF0497) |
| arTal_v1_Chr3_-_6436046_6436046 | 0.48 |
AT3G18710.1
|
PUB29
|
plant U-box 29 |
| arTal_v1_Chr5_+_21582614_21582614 | 0.48 |
AT5G53200.1
|
TRY
|
Homeodomain-like superfamily protein |
| arTal_v1_Chr1_+_26141726_26141836 | 0.48 |
AT1G69530.2
AT1G69530.1 AT1G69530.3 AT1G69530.5 AT1G69530.4 |
EXPA1
|
expansin A1 |
| arTal_v1_Chr3_+_8610979_8610979 | 0.48 |
AT3G23840.1
|
AT3G23840
|
HXXXD-type acyl-transferase family protein |
| arTal_v1_Chr2_-_15474717_15474828 | 0.48 |
AT2G36870.2
AT2G36870.1 |
XTH32
|
xyloglucan endotransglucosylase/hydrolase 32 |
| arTal_v1_Chr4_+_18296388_18296388 | 0.47 |
AT4G39350.1
|
CESA2
|
cellulose synthase A2 |
| arTal_v1_Chr1_-_28603932_28603932 | 0.47 |
AT1G76240.1
|
AT1G76240
|
DUF241 domain protein (DUF241) |
| arTal_v1_Chr5_+_18634041_18634041 | 0.47 |
AT5G45950.1
|
AT5G45950
|
GDSL-like Lipase/Acylhydrolase superfamily protein |
| arTal_v1_Chr2_-_16391073_16391176 | 0.47 |
AT2G39250.2
AT2G39250.1 |
SNZ
|
Integrase-type DNA-binding superfamily protein |
| arTal_v1_Chr5_-_8707885_8707885 | 0.47 |
AT5G25190.1
|
ESE3
|
Integrase-type DNA-binding superfamily protein |
| arTal_v1_Chr4_-_11785937_11785937 | 0.47 |
AT4G22290.1
|
AT4G22290
|
Ubiquitin-specific protease family C19-related protein |
| arTal_v1_Chr4_-_947075_947085 | 0.46 |
AT4G02130.2
AT4G02130.3 |
GATL6
|
galacturonosyltransferase 6 |
| arTal_v1_Chr3_-_19467455_19467455 | 0.46 |
AT3G52500.1
|
AT3G52500
|
Eukaryotic aspartyl protease family protein |
| arTal_v1_Chr4_+_16708552_16708552 | 0.46 |
AT4G35100.2
|
PIP3
|
plasma membrane intrinsic protein 3 |
| arTal_v1_Chr4_+_16708361_16708361 | 0.45 |
AT4G35100.1
|
PIP3
|
plasma membrane intrinsic protein 3 |
| arTal_v1_Chr2_-_17648945_17649062 | 0.45 |
AT2G42380.1
AT2G42380.4 AT2G42380.3 AT2G42380.2 AT2G42380.5 |
BZIP34
|
Basic-leucine zipper (bZIP) transcription factor family protein |
| arTal_v1_Chr4_+_14677661_14677695 | 0.45 |
AT4G30020.2
AT4G30020.3 |
AT4G30020
|
PA-domain containing subtilase family protein |
| arTal_v1_Chr4_+_9906821_9906840 | 0.45 |
AT4G17810.1
AT4G17810.2 |
AT4G17810
|
C2H2 and C2HC zinc fingers superfamily protein |
| arTal_v1_Chr2_+_11087280_11087280 | 0.45 |
AT2G26010.1
|
PDF1.3
|
plant defensin 1.3 |
| arTal_v1_Chr3_-_2656297_2656297 | 0.45 |
AT3G08740.1
|
AT3G08740
|
elongation factor P (EF-P) family protein |
| arTal_v1_Chr5_+_1912013_1912013 | 0.45 |
AT5G06270.2
AT5G06270.1 |
AT5G06270
|
hypothetical protein |
| arTal_v1_Chr1_+_19879405_19879405 | 0.45 |
AT1G53300.1
|
TTL1
|
tetratricopetide-repeat thioredoxin-like 1 |
| arTal_v1_Chr2_+_8940833_8940833 | 0.45 |
AT2G20750.2
AT2G20750.1 |
EXPB1
|
expansin B1 |
| arTal_v1_Chr5_+_7778017_7778095 | 0.44 |
AT5G23120.2
AT5G23120.1 |
HCF136
|
photosystem II stability/assembly factor, chloroplast (HCF136) |
| arTal_v1_Chr5_-_4171954_4171954 | 0.44 |
AT5G13140.1
|
AT5G13140
|
Pollen Ole e 1 allergen and extensin family protein |
| arTal_v1_Chr5_+_5431584_5431584 | 0.44 |
AT5G16590.1
|
AT5G16590
|
Leucine-rich repeat protein kinase family protein |
| arTal_v1_Chr4_+_10231218_10231218 | 0.44 |
AT4G18570.2
AT4G18570.1 |
AT4G18570
|
Tetratricopeptide repeat (TPR)-like superfamily protein |
| arTal_v1_Chr1_-_6283348_6283348 | 0.44 |
AT1G18265.1
|
AT1G18265
|
zein-binding protein (Protein of unknown function, DUF593) |
| arTal_v1_Chr4_-_12333904_12333904 | 0.44 |
AT4G23670.1
|
AT4G23670
|
Polyketide cyclase/dehydrase and lipid transport superfamily protein |
| arTal_v1_Chr3_+_20984635_20984635 | 0.44 |
AT3G56650.1
|
PPD6
|
thylakoid lumenal protein (Mog1/PsbP/DUF1795-like photosystem II reaction center PsbP family protein) |
| arTal_v1_Chr4_+_11880080_11880080 | 0.44 |
AT4G22560.1
|
AT4G22560
|
sulfated surface-like glycoprotein |
| arTal_v1_Chr1_-_3443957_3443957 | 0.44 |
AT1G10470.3
AT1G10470.2 |
ARR4
|
response regulator 4 |
| arTal_v1_Chr4_-_10278794_10278794 | 0.44 |
AT4G18670.1
|
AT4G18670
|
Leucine-rich repeat (LRR) family protein |
| arTal_v1_Chr5_-_23873691_23873849 | 0.44 |
AT5G59130.1
AT5G59130.2 AT5G59130.3 AT5G59130.4 |
AT5G59130
|
Subtilase family protein |
| arTal_v1_Chr5_+_224134_224134 | 0.44 |
AT5G01590.1
|
AT5G01590
|
histone-lysine N-methyltransferase ATXR3-like protein |
| arTal_v1_Chr5_-_990630_990630 | 0.43 |
AT5G03760.1
|
ATCSLA09
|
Nucleotide-diphospho-sugar transferases superfamily protein |
| arTal_v1_Chr4_+_5550404_5550404 | 0.43 |
AT4G08685.1
|
SAH7
|
Pollen Ole e 1 allergen and extensin family protein |
| arTal_v1_Chr2_+_19469571_19469612 | 0.43 |
AT2G47440.2
AT2G47440.1 |
AT2G47440
|
Tetratricopeptide repeat (TPR)-like superfamily protein |
| arTal_v1_Chr1_-_3444360_3444360 | 0.43 |
AT1G10470.1
|
ARR4
|
response regulator 4 |
| arTal_v1_Chr1_-_4807517_4807517 | 0.43 |
AT1G14030.1
|
LSMT-L
|
Rubisco methyltransferase family protein |
| arTal_v1_Chr2_+_18691664_18691664 | 0.43 |
AT2G45340.1
|
AT2G45340
|
Leucine-rich repeat protein kinase family protein |
| arTal_v1_Chr2_-_19622251_19622301 | 0.42 |
AT2G47940.2
AT2G47940.1 |
DEG2
|
DEGP protease 2 |
| arTal_v1_Chr2_+_19109513_19109513 | 0.42 |
AT2G46535.1
|
AT2G46535
|
hypothetical protein |
| arTal_v1_Chr5_+_6387341_6387489 | 0.42 |
AT5G19090.1
AT5G19090.4 AT5G19090.3 AT5G19090.2 |
AT5G19090
|
Heavy metal transport/detoxification superfamily protein |
| arTal_v1_Chr3_+_21680027_21680108 | 0.42 |
AT3G58620.1
AT3G58620.2 |
TTL4
|
tetratricopetide-repeat thioredoxin-like 4 |
| arTal_v1_Chr1_-_8935544_8935544 | 0.42 |
AT1G25440.1
|
BBX15
|
B-box type zinc finger protein with CCT domain-containing protein |
| arTal_v1_Chr5_+_6471827_6471827 | 0.42 |
AT5G19250.1
|
AT5G19250
|
Glycoprotein membrane precursor GPI-anchored |
| arTal_v1_Chr5_-_4061950_4061950 | 0.42 |
AT5G12860.2
|
DiT1
|
dicarboxylate transporter 1 |
| arTal_v1_Chr3_-_10877578_10877578 | 0.42 |
AT3G28860.1
|
ABCB19
|
ATP binding cassette subfamily B19 |
| arTal_v1_Chr3_+_4389215_4389215 | 0.42 |
AT3G13470.1
|
Cpn60beta2
|
TCP-1/cpn60 chaperonin family protein |
| arTal_v1_Chr5_-_22515458_22515458 | 0.42 |
AT5G55570.2
AT5G55570.1 |
AT5G55570
|
transmembrane protein |
| arTal_v1_Chr3_-_20806333_20806333 | 0.42 |
AT3G56060.1
|
AT3G56060
|
Glucose-methanol-choline (GMC) oxidoreductase family protein |
| arTal_v1_Chr2_-_9699915_9699944 | 0.42 |
AT2G22795.3
AT2G22795.2 AT2G22795.1 |
AT2G22795
|
hypothetical protein |
| arTal_v1_Chr3_-_22881775_22881775 | 0.42 |
AT3G61820.1
|
AT3G61820
|
Eukaryotic aspartyl protease family protein |
| arTal_v1_Chr4_+_13718679_13718679 | 0.42 |
AT4G27430.2
|
CIP7
|
COP1-interacting protein 7 |
| arTal_v1_Chr5_-_23406479_23406479 | 0.42 |
AT5G57780.1
|
P1R1
|
transcription factor |
| arTal_v1_Chr4_-_947249_947249 | 0.41 |
AT4G02130.1
|
GATL6
|
galacturonosyltransferase 6 |
| arTal_v1_Chr1_-_6579314_6579314 | 0.41 |
AT1G19050.1
|
ARR7
|
response regulator 7 |
| arTal_v1_Chr1_-_1307973_1307973 | 0.41 |
AT1G04680.1
|
AT1G04680
|
Pectin lyase-like superfamily protein |
| arTal_v1_Chr5_-_4062289_4062289 | 0.41 |
AT5G12860.1
|
DiT1
|
dicarboxylate transporter 1 |
| arTal_v1_Chr1_-_27265806_27265806 | 0.41 |
AT1G72430.1
|
AT1G72430
|
SAUR-like auxin-responsive protein family |
| arTal_v1_Chr4_+_13718007_13718007 | 0.41 |
AT4G27430.1
|
CIP7
|
COP1-interacting protein 7 |
| arTal_v1_Chr1_-_23137254_23137254 | 0.41 |
AT1G62510.1
|
AT1G62510
|
Bifunctional inhibitor/lipid-transfer protein/seed storage 2S albumin superfamily protein |
| arTal_v1_Chr2_+_11926446_11926446 | 0.41 |
AT2G28000.1
|
CPN60A
|
chaperonin-60alpha |
| arTal_v1_Chr3_+_20776220_20776265 | 0.41 |
AT3G55980.2
AT3G55980.1 |
SZF1
|
salt-inducible zinc finger 1 |
| arTal_v1_Chr3_+_8194606_8194711 | 0.41 |
AT3G23050.1
AT3G23050.3 AT3G23050.2 |
IAA7
|
indole-3-acetic acid 7 |
| arTal_v1_Chr2_-_10043673_10043840 | 0.41 |
AT2G23600.1
AT2G23600.3 AT2G23600.2 |
ACL
|
acetone-cyanohydrin lyase |
| arTal_v1_Chr5_+_21226721_21226721 | 0.41 |
AT5G52280.1
|
AT5G52280
|
Myosin heavy chain-related protein |
| arTal_v1_Chr2_+_417427_417427 | 0.41 |
AT2G01910.2
|
ATMAP65-6
|
Microtubule associated protein (MAP65/ASE1) family protein |
| arTal_v1_Chr1_+_4159227_4159265 | 0.40 |
AT1G12250.1
AT1G12250.3 AT1G12250.2 |
AT1G12250
|
Pentapeptide repeat-containing protein |
| arTal_v1_Chr3_-_1855063_1855197 | 0.40 |
AT3G06130.2
AT3G06130.1 |
AT3G06130
|
Heavy metal transport/detoxification superfamily protein |
| arTal_v1_Chr2_+_18495215_18495215 | 0.40 |
AT2G44840.1
|
ERF13
|
ethylene-responsive element binding factor 13 |
| arTal_v1_Chr2_+_1676999_1676999 | 0.40 |
AT2G04780.2
|
FLA7
|
FASCICLIN-like arabinoogalactan 7 |
| arTal_v1_Chr1_-_24974791_24974946 | 0.40 |
AT1G66940.2
AT1G66940.4 AT1G66940.1 AT1G66940.3 |
AT1G66940
|
kinase-like protein |
| arTal_v1_Chr4_+_14192569_14192569 | 0.39 |
AT4G28720.1
|
YUC8
|
Flavin-binding monooxygenase family protein |
| arTal_v1_Chr3_-_6980523_6980523 | 0.39 |
AT3G20015.1
|
AT3G20015
|
Eukaryotic aspartyl protease family protein |
| arTal_v1_Chr5_-_22988092_22988110 | 0.39 |
AT5G56850.3
AT5G56850.1 AT5G56850.2 AT5G56850.4 |
AT5G56850
|
hypothetical protein |
| arTal_v1_Chr1_+_14003819_14003866 | 0.39 |
AT1G36940.1
AT1G36940.2 |
AT1G36940
|
myotubularin-like protein |
| arTal_v1_Chr4_+_7758275_7758275 | 0.39 |
AT4G13340.1
|
LRX3
|
Leucine-rich repeat (LRR) family protein |
| arTal_v1_Chr3_+_20344785_20344785 | 0.39 |
AT3G54920.1
|
PMR6
|
Pectin lyase-like superfamily protein |
| arTal_v1_Chr4_+_14678096_14678096 | 0.39 |
AT4G30020.4
|
AT4G30020
|
PA-domain containing subtilase family protein |
| arTal_v1_Chr2_+_12542933_12542933 | 0.39 |
AT2G29180.1
|
AT2G29180
|
transmembrane protein |
| arTal_v1_Chr1_-_18405493_18405681 | 0.39 |
AT1G49730.3
AT1G49730.4 AT1G49730.2 AT1G49730.5 AT1G49730.1 |
AT1G49730
|
Protein kinase superfamily protein |
| arTal_v1_Chr1_-_3047893_3048006 | 0.39 |
AT1G09440.1
AT1G09440.2 |
AT1G09440
|
Protein kinase superfamily protein |
| arTal_v1_Chr5_-_21246682_21246774 | 0.38 |
AT5G52320.2
AT5G52320.1 |
CYP96A4
|
cytochrome P450, family 96, subfamily A, polypeptide 4 |
| arTal_v1_Chr1_+_18504757_18504757 | 0.38 |
AT1G49975.1
|
AT1G49975
|
photosystem I reaction center subunit N |
| arTal_v1_Chr2_-_7727404_7727503 | 0.38 |
AT2G17780.2
AT2G17780.4 AT2G17780.5 AT2G17780.8 AT2G17780.10 AT2G17780.9 AT2G17780.1 AT2G17780.6 AT2G17780.3 AT2G17780.7 |
MCA2
|
PLAC8 family protein |
| arTal_v1_Chr1_-_24023424_24023424 | 0.38 |
AT1G64640.1
|
ENODL8
|
early nodulin-like protein 8 |
| arTal_v1_Chr4_-_14439723_14439769 | 0.38 |
AT4G29310.1
AT4G29310.2 |
AT4G29310
|
DUF1005 family protein (DUF1005) |
| arTal_v1_Chr1_+_29178705_29178705 | 0.38 |
AT1G77640.1
|
AT1G77640
|
Integrase-type DNA-binding superfamily protein |
| arTal_v1_Chr2_+_416021_416021 | 0.38 |
AT2G01910.1
|
ATMAP65-6
|
Microtubule associated protein (MAP65/ASE1) family protein |
| arTal_v1_Chr2_+_9293261_9293261 | 0.38 |
AT2G21790.1
|
RNR1
|
ribonucleotide reductase 1 |
| arTal_v1_Chr5_+_19179881_19179881 | 0.38 |
AT5G47230.1
|
ERF5
|
ethylene responsive element binding factor 5 |
| arTal_v1_Chr4_-_15312987_15312987 | 0.38 |
AT4G31590.1
|
CSLC5
|
Cellulose-synthase-like C5 |
| arTal_v1_Chr2_+_1676717_1676717 | 0.38 |
AT2G04780.1
|
FLA7
|
FASCICLIN-like arabinoogalactan 7 |
| arTal_v1_Chr5_-_5833989_5834000 | 0.38 |
AT5G17700.2
AT5G17700.1 AT5G17700.3 |
AT5G17700
|
MATE efflux family protein |
| arTal_v1_Chr3_+_5676749_5676829 | 0.38 |
AT3G16660.2
AT3G16660.1 |
AT3G16660
|
Pollen Ole e 1 allergen and extensin family protein |
| arTal_v1_Chr2_+_18537177_18537177 | 0.38 |
AT2G44940.1
|
AT2G44940
|
Integrase-type DNA-binding superfamily protein |
| arTal_v1_Chr2_-_19563960_19563960 | 0.38 |
AT2G47750.1
|
GH3.9
|
putative indole-3-acetic acid-amido synthetase GH3.9 |
| arTal_v1_Chr1_-_16709713_16709713 | 0.38 |
AT1G44000.1
|
AT1G44000
|
STAY-GREEN-like protein |
| arTal_v1_Chr3_-_17288953_17289006 | 0.38 |
AT3G46940.1
AT3G46940.2 |
DUT1
|
DUTP-PYROPHOSPHATASE-LIKE 1 |
| arTal_v1_Chr4_-_14627631_14627631 | 0.37 |
AT4G29905.1
|
AT4G29905
|
hypothetical protein |
| arTal_v1_Chr4_-_17355891_17356037 | 0.37 |
AT4G36850.3
AT4G36850.4 AT4G36850.2 AT4G36850.1 |
AT4G36850
|
PQ-loop repeat family protein / transmembrane family protein |
| arTal_v1_Chr1_-_4492587_4492667 | 0.37 |
AT1G13170.2
AT1G13170.1 |
ORP1D
|
OSBP(oxysterol binding protein)-related protein 1D |
| arTal_v1_Chr4_+_14317226_14317256 | 0.37 |
AT4G29060.1
AT4G29060.2 |
emb2726
|
elongation factor Ts family protein |
| arTal_v1_Chr1_-_12054753_12054753 | 0.37 |
AT1G33240.1
AT1G33240.3 |
GTL1
|
GT-2-like 1 |
| arTal_v1_Chr1_-_12053935_12053935 | 0.37 |
AT1G33240.2
|
GTL1
|
GT-2-like 1 |
| arTal_v1_Chr5_+_1399395_1399395 | 0.37 |
AT5G04820.1
|
OFP13
|
ovate family protein 13 |
| arTal_v1_Chr2_-_14909863_14909863 | 0.36 |
AT2G35470.1
|
AT2G35470
|
ribosome maturation factor |
| arTal_v1_Chr1_-_25710989_25710989 | 0.36 |
AT1G68520.1
|
BBX14
|
B-box type zinc finger protein with CCT domain-containing protein |
| arTal_v1_Chr4_-_12068538_12068624 | 0.36 |
AT4G23020.2
AT4G23020.1 |
TRM11
|
hypothetical protein |
| arTal_v1_Chr3_+_20780175_20780175 | 0.36 |
AT3G55990.1
|
ESK1
|
trichome birefringence-like protein (DUF828) |
| arTal_v1_Chr5_-_19899301_19899301 | 0.36 |
AT5G49100.1
|
AT5G49100
|
vitellogenin-like protein |
| arTal_v1_Chr2_-_10304812_10304812 | 0.36 |
AT2G24230.1
|
AT2G24230
|
Leucine-rich repeat protein kinase family protein |
| arTal_v1_Chr1_-_21507679_21507679 | 0.36 |
AT1G58080.1
|
ATP-PRT1
|
ATP phosphoribosyl transferase 1 |
| arTal_v1_Chr5_+_16768935_16768935 | 0.36 |
AT5G41900.1
|
AT5G41900
|
alpha/beta-Hydrolases superfamily protein |
| arTal_v1_Chr4_+_14944129_14944129 | 0.36 |
AT4G30610.1
|
BRS1
|
alpha/beta-Hydrolases superfamily protein |
| arTal_v1_Chr1_+_26983615_26983721 | 0.36 |
AT1G71720.1
AT1G71720.2 |
PDE338
|
Nucleic acid-binding proteins superfamily |
| arTal_v1_Chr3_+_21238223_21238223 | 0.36 |
AT3G57400.1
|
AT3G57400
|
transmembrane protein |
| arTal_v1_Chr3_-_21805335_21805335 | 0.36 |
AT3G59010.1
|
PME61
|
pectin methylesterase 61 |
| arTal_v1_Chr5_-_3278461_3278461 | 0.36 |
AT5G10430.1
|
AGP4
|
arabinogalactan protein 4 |
| arTal_v1_Chr1_+_20048434_20048434 | 0.36 |
AT1G53700.1
|
WAG1
|
WAG 1 |
| arTal_v1_Chr4_+_14677141_14677141 | 0.35 |
AT4G30020.1
|
AT4G30020
|
PA-domain containing subtilase family protein |
| arTal_v1_Chr1_-_15607966_15607966 | 0.35 |
AT1G41830.1
|
SKS6
|
SKU5-similar 6 |
| arTal_v1_Chr5_-_22194559_22194559 | 0.35 |
AT5G54630.1
|
AT5G54630
|
zinc finger protein-like protein |
| arTal_v1_Chr5_-_1063425_1063425 | 0.35 |
AT5G03940.1
|
CPSRP54
|
chloroplast signal recognition particle 54 kDa subunit |
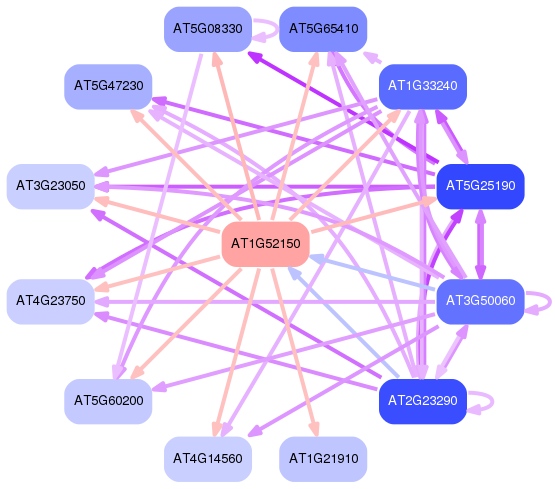
Network of associatons between targets according to the STRING database.

First level regulatory network of AT1G52150
Gene Ontology Analysis
Gene overrepresentation in biological process category:
| Log-likelihood per target | Total log-likelihood | Term | Description |
|---|---|---|---|
| 0.4 | 2.3 | GO:0009769 | photosynthesis, light harvesting in photosystem II(GO:0009769) |
| 0.3 | 0.8 | GO:0015742 | alpha-ketoglutarate transport(GO:0015742) |
| 0.2 | 0.7 | GO:0006428 | isoleucyl-tRNA aminoacylation(GO:0006428) |
| 0.2 | 0.6 | GO:0010541 | acropetal auxin transport(GO:0010541) |
| 0.2 | 0.5 | GO:0042817 | pyridoxal metabolic process(GO:0042817) |
| 0.2 | 0.6 | GO:0048656 | anther wall tapetum formation(GO:0048656) anther wall tapetum cell differentiation(GO:0048657) |
| 0.2 | 0.8 | GO:0009200 | deoxyribonucleoside triphosphate metabolic process(GO:0009200) |
| 0.2 | 0.5 | GO:0080145 | cysteine homeostasis(GO:0080145) |
| 0.1 | 1.9 | GO:0010158 | abaxial cell fate specification(GO:0010158) |
| 0.1 | 0.4 | GO:0046156 | siroheme biosynthetic process(GO:0019354) siroheme metabolic process(GO:0046156) |
| 0.1 | 0.4 | GO:0090058 | metaxylem development(GO:0090058) |
| 0.1 | 0.5 | GO:0033353 | S-adenosylmethionine cycle(GO:0033353) S-adenosylhomocysteine metabolic process(GO:0046498) |
| 0.1 | 0.8 | GO:0031116 | positive regulation of microtubule polymerization(GO:0031116) |
| 0.1 | 0.4 | GO:0010062 | negative regulation of cell fate specification(GO:0009996) negative regulation of trichoblast fate specification(GO:0010062) negative regulation of plant epidermal cell differentiation(GO:1903889) |
| 0.1 | 0.4 | GO:0010198 | synergid death(GO:0010198) |
| 0.1 | 0.5 | GO:0019499 | cyanide metabolic process(GO:0019499) |
| 0.1 | 0.5 | GO:0010376 | stomatal complex formation(GO:0010376) |
| 0.1 | 0.4 | GO:0006063 | uronic acid metabolic process(GO:0006063) galacturonate metabolic process(GO:0019586) |
| 0.1 | 0.6 | GO:0009650 | UV protection(GO:0009650) |
| 0.1 | 0.7 | GO:2000037 | regulation of stomatal complex patterning(GO:2000037) |
| 0.1 | 0.6 | GO:0010258 | NADH dehydrogenase complex (plastoquinone) assembly(GO:0010258) |
| 0.1 | 0.8 | GO:0010065 | primary meristem tissue development(GO:0010065) |
| 0.1 | 0.5 | GO:0010683 | tricyclic triterpenoid metabolic process(GO:0010683) |
| 0.1 | 0.3 | GO:1905157 | positive regulation of photosynthesis(GO:1905157) |
| 0.1 | 1.5 | GO:0015976 | carbon utilization(GO:0015976) |
| 0.1 | 0.5 | GO:0010086 | embryonic root morphogenesis(GO:0010086) |
| 0.1 | 0.6 | GO:0045038 | protein import into chloroplast thylakoid membrane(GO:0045038) |
| 0.1 | 0.4 | GO:0018023 | peptidyl-lysine trimethylation(GO:0018023) |
| 0.1 | 0.3 | GO:0090227 | regulation of red or far-red light signaling pathway(GO:0090227) |
| 0.1 | 0.5 | GO:0033591 | response to L-ascorbic acid(GO:0033591) |
| 0.1 | 0.4 | GO:0002943 | tRNA dihydrouridine synthesis(GO:0002943) |
| 0.1 | 1.0 | GO:0010206 | photosystem II repair(GO:0010206) |
| 0.1 | 0.5 | GO:0048533 | sporocyte differentiation(GO:0048533) |
| 0.1 | 0.5 | GO:0010451 | floral meristem growth(GO:0010451) |
| 0.1 | 0.6 | GO:0045492 | xylan biosynthetic process(GO:0045492) |
| 0.1 | 0.5 | GO:0090057 | root radial pattern formation(GO:0090057) |
| 0.1 | 0.3 | GO:0030417 | nicotianamine metabolic process(GO:0030417) nicotianamine biosynthetic process(GO:0030418) tricarboxylic acid biosynthetic process(GO:0072351) |
| 0.1 | 0.3 | GO:0070509 | calcium ion import(GO:0070509) |
| 0.1 | 0.6 | GO:2000122 | negative regulation of stomatal complex development(GO:2000122) |
| 0.1 | 1.1 | GO:0048759 | xylem vessel member cell differentiation(GO:0048759) |
| 0.1 | 0.3 | GO:0090207 | regulation of triglyceride metabolic process(GO:0090207) |
| 0.1 | 0.5 | GO:0042547 | cell wall modification involved in multidimensional cell growth(GO:0042547) |
| 0.1 | 0.1 | GO:0033240 | positive regulation of cellular amine metabolic process(GO:0033240) positive regulation of cellular amino acid metabolic process(GO:0045764) |
| 0.1 | 0.4 | GO:0019745 | pentacyclic triterpenoid metabolic process(GO:0019742) pentacyclic triterpenoid biosynthetic process(GO:0019745) |
| 0.1 | 0.2 | GO:0010501 | RNA secondary structure unwinding(GO:0010501) |
| 0.1 | 1.3 | GO:0030388 | fructose 1,6-bisphosphate metabolic process(GO:0030388) |
| 0.1 | 1.0 | GO:0010274 | hydrotropism(GO:0010274) |
| 0.1 | 1.3 | GO:0048829 | root cap development(GO:0048829) |
| 0.1 | 0.3 | GO:1900370 | positive regulation of RNA interference(GO:1900370) |
| 0.1 | 0.3 | GO:0006065 | aminoglycan biosynthetic process(GO:0006023) glycosaminoglycan biosynthetic process(GO:0006024) UDP-glucuronate biosynthetic process(GO:0006065) glycosaminoglycan metabolic process(GO:0030203) |
| 0.1 | 0.1 | GO:0009270 | response to humidity(GO:0009270) |
| 0.1 | 0.2 | GO:0034982 | mitochondrial protein processing(GO:0034982) |
| 0.1 | 0.3 | GO:0015959 | diadenosine polyphosphate metabolic process(GO:0015959) diadenosine tetraphosphate metabolic process(GO:0015965) |
| 0.1 | 0.9 | GO:0010413 | glucuronoxylan metabolic process(GO:0010413) glucuronoxylan biosynthetic process(GO:0010417) |
| 0.1 | 0.4 | GO:0010600 | regulation of auxin biosynthetic process(GO:0010600) |
| 0.1 | 0.6 | GO:2000071 | regulation of defense response by callose deposition(GO:2000071) |
| 0.1 | 0.2 | GO:0090392 | sepal giant cell differentiation(GO:0090392) |
| 0.1 | 0.3 | GO:0051329 | mitotic G1 phase(GO:0000080) mitotic S phase(GO:0000084) mitotic G2 phase(GO:0000085) G1 phase(GO:0051318) G2 phase(GO:0051319) S phase(GO:0051320) interphase(GO:0051325) mitotic interphase(GO:0051329) |
| 0.1 | 0.3 | GO:0009806 | lignan metabolic process(GO:0009806) lignan biosynthetic process(GO:0009807) |
| 0.1 | 1.5 | GO:0009645 | response to low light intensity stimulus(GO:0009645) |
| 0.1 | 0.3 | GO:0046741 | transport of virus in host, tissue to tissue(GO:0046741) |
| 0.1 | 0.2 | GO:0043480 | pigment accumulation in response to UV light(GO:0043478) pigment accumulation in tissues in response to UV light(GO:0043479) pigment accumulation in tissues(GO:0043480) anthocyanin accumulation in tissues in response to UV light(GO:0043481) |
| 0.1 | 1.2 | GO:0006949 | syncytium formation(GO:0006949) |
| 0.1 | 0.2 | GO:0080170 | hydrogen peroxide transmembrane transport(GO:0080170) |
| 0.1 | 0.1 | GO:0006177 | GMP biosynthetic process(GO:0006177) GMP metabolic process(GO:0046037) |
| 0.1 | 0.1 | GO:1903961 | positive regulation of transporter activity(GO:0032411) positive regulation of ion transmembrane transporter activity(GO:0032414) positive regulation of anion channel activity(GO:1901529) positive regulation of anion transport(GO:1903793) positive regulation of anion transmembrane transport(GO:1903961) |
| 0.1 | 0.7 | GO:0018904 | ether metabolic process(GO:0018904) |
| 0.1 | 0.1 | GO:0055073 | cadmium ion homeostasis(GO:0055073) |
| 0.1 | 1.1 | GO:0042761 | very long-chain fatty acid biosynthetic process(GO:0042761) |
| 0.1 | 0.3 | GO:0001682 | tRNA 5'-leader removal(GO:0001682) |
| 0.1 | 0.2 | GO:0019184 | glutathione biosynthetic process(GO:0006750) nonribosomal peptide biosynthetic process(GO:0019184) |
| 0.1 | 0.2 | GO:0010338 | leaf formation(GO:0010338) |
| 0.1 | 0.3 | GO:0045730 | respiratory burst involved in defense response(GO:0002679) respiratory burst(GO:0045730) |
| 0.1 | 0.5 | GO:0010233 | vascular transport(GO:0010232) phloem transport(GO:0010233) |
| 0.1 | 0.8 | GO:0006782 | protoporphyrinogen IX biosynthetic process(GO:0006782) protoporphyrinogen IX metabolic process(GO:0046501) |
| 0.1 | 0.2 | GO:1902475 | L-alpha-amino acid transmembrane transport(GO:1902475) |
| 0.1 | 0.3 | GO:0006556 | S-adenosylmethionine biosynthetic process(GO:0006556) |
| 0.1 | 0.4 | GO:0010190 | cytochrome b6f complex assembly(GO:0010190) |
| 0.1 | 0.3 | GO:0010390 | histone monoubiquitination(GO:0010390) |
| 0.0 | 0.7 | GO:0018401 | protein hydroxylation(GO:0018126) peptidyl-proline hydroxylation to 4-hydroxy-L-proline(GO:0018401) 4-hydroxyproline metabolic process(GO:0019471) peptidyl-proline hydroxylation(GO:0019511) |
| 0.0 | 2.5 | GO:0019759 | S-glycoside catabolic process(GO:0016145) glycosinolate catabolic process(GO:0019759) glucosinolate catabolic process(GO:0019762) |
| 0.0 | 0.6 | GO:0042793 | transcription from plastid promoter(GO:0042793) |
| 0.0 | 0.2 | GO:0090506 | axillary shoot meristem initiation(GO:0090506) |
| 0.0 | 0.5 | GO:1990066 | nonphotochemical quenching(GO:0010196) energy quenching(GO:1990066) |
| 0.0 | 0.2 | GO:0009759 | indole glucosinolate biosynthetic process(GO:0009759) |
| 0.0 | 0.3 | GO:0048629 | trichome patterning(GO:0048629) |
| 0.0 | 0.1 | GO:0048464 | sepal development(GO:0048442) flower calyx development(GO:0048464) |
| 0.0 | 0.7 | GO:0000105 | histidine biosynthetic process(GO:0000105) histidine metabolic process(GO:0006547) imidazole-containing compound metabolic process(GO:0052803) |
| 0.0 | 0.3 | GO:0080117 | secondary growth(GO:0080117) |
| 0.0 | 0.5 | GO:0010371 | regulation of gibberellin biosynthetic process(GO:0010371) |
| 0.0 | 0.4 | GO:0061727 | lactate metabolic process(GO:0006089) methylglyoxal metabolic process(GO:0009438) methylglyoxal catabolic process to D-lactate via S-lactoyl-glutathione(GO:0019243) ketone catabolic process(GO:0042182) methylglyoxal catabolic process(GO:0051596) methylglyoxal catabolic process to lactate(GO:0061727) |
| 0.0 | 2.3 | GO:0015995 | chlorophyll biosynthetic process(GO:0015995) |
| 0.0 | 0.4 | GO:0043096 | adenine salvage(GO:0006168) purine nucleobase salvage(GO:0043096) |
| 0.0 | 1.2 | GO:0009833 | plant-type primary cell wall biogenesis(GO:0009833) |
| 0.0 | 2.9 | GO:0009834 | plant-type secondary cell wall biogenesis(GO:0009834) |
| 0.0 | 0.0 | GO:0051480 | regulation of cytosolic calcium ion concentration(GO:0051480) |
| 0.0 | 0.4 | GO:0000966 | RNA 5'-end processing(GO:0000966) |
| 0.0 | 0.2 | GO:2001295 | malonyl-CoA biosynthetic process(GO:2001295) |
| 0.0 | 0.3 | GO:0051095 | regulation of helicase activity(GO:0051095) positive regulation of helicase activity(GO:0051096) |
| 0.0 | 1.3 | GO:0006284 | base-excision repair(GO:0006284) |
| 0.0 | 0.2 | GO:0015675 | nickel cation transport(GO:0015675) |
| 0.0 | 0.5 | GO:0016559 | peroxisome fission(GO:0016559) |
| 0.0 | 0.4 | GO:1902025 | nitrate import(GO:1902025) |
| 0.0 | 0.1 | GO:0010623 | programmed cell death involved in cell development(GO:0010623) |
| 0.0 | 0.3 | GO:0015909 | long-chain fatty acid transport(GO:0015909) |
| 0.0 | 0.6 | GO:0009089 | lysine biosynthetic process(GO:0009085) lysine biosynthetic process via diaminopimelate(GO:0009089) diaminopimelate metabolic process(GO:0046451) |
| 0.0 | 0.4 | GO:0006535 | cysteine biosynthetic process from serine(GO:0006535) |
| 0.0 | 0.6 | GO:0010215 | cellulose microfibril organization(GO:0010215) |
| 0.0 | 0.2 | GO:0009772 | fat-soluble vitamin metabolic process(GO:0006775) photosynthetic electron transport in photosystem II(GO:0009772) fat-soluble vitamin biosynthetic process(GO:0042362) |
| 0.0 | 0.2 | GO:0052746 | inositol phosphorylation(GO:0052746) |
| 0.0 | 0.4 | GO:1990170 | stress response to cadmium ion(GO:1990170) |
| 0.0 | 0.3 | GO:0046294 | formaldehyde catabolic process(GO:0046294) |
| 0.0 | 0.5 | GO:0051762 | sesquiterpene biosynthetic process(GO:0051762) |
| 0.0 | 0.2 | GO:0061087 | positive regulation of histone H3-K27 methylation(GO:0061087) |
| 0.0 | 0.1 | GO:0042149 | cellular response to glucose starvation(GO:0042149) |
| 0.0 | 2.0 | GO:0048825 | cotyledon development(GO:0048825) |
| 0.0 | 1.0 | GO:0046856 | phosphatidylinositol dephosphorylation(GO:0046856) |
| 0.0 | 0.2 | GO:0043247 | telomere maintenance in response to DNA damage(GO:0043247) |
| 0.0 | 0.3 | GO:0071249 | cellular response to nitrate(GO:0071249) |
| 0.0 | 0.5 | GO:0032922 | circadian regulation of gene expression(GO:0032922) |
| 0.0 | 0.2 | GO:0048871 | multicellular organismal homeostasis(GO:0048871) |
| 0.0 | 0.4 | GO:0010093 | specification of floral organ identity(GO:0010093) |
| 0.0 | 0.2 | GO:0007142 | male meiosis II(GO:0007142) |
| 0.0 | 0.7 | GO:0042044 | water transport(GO:0006833) fluid transport(GO:0042044) |
| 0.0 | 0.1 | GO:0009865 | pollen tube adhesion(GO:0009865) cell-cell adhesion(GO:0098609) multi organism cell adhesion(GO:0098740) |
| 0.0 | 0.2 | GO:0019419 | sulfate reduction(GO:0019419) |
| 0.0 | 1.4 | GO:0045489 | pectin biosynthetic process(GO:0045489) |
| 0.0 | 0.1 | GO:0090342 | regulation of cell aging(GO:0090342) |
| 0.0 | 1.7 | GO:0010411 | xyloglucan metabolic process(GO:0010411) |
| 0.0 | 0.2 | GO:0006013 | mannose metabolic process(GO:0006013) |
| 0.0 | 0.3 | GO:0009635 | response to herbicide(GO:0009635) |
| 0.0 | 0.3 | GO:1903338 | regulation of cell wall organization or biogenesis(GO:1903338) |
| 0.0 | 0.3 | GO:0046466 | membrane lipid catabolic process(GO:0046466) |
| 0.0 | 0.3 | GO:0051513 | regulation of monopolar cell growth(GO:0051513) |
| 0.0 | 0.6 | GO:0050821 | protein stabilization(GO:0050821) |
| 0.0 | 0.1 | GO:0019427 | acetyl-CoA biosynthetic process from acetate(GO:0019427) |
| 0.0 | 0.3 | GO:0043155 | photoinhibition(GO:0010205) negative regulation of photosynthesis, light reaction(GO:0043155) |
| 0.0 | 0.2 | GO:0080120 | CAAX-box protein processing(GO:0071586) CAAX-box protein maturation(GO:0080120) |
| 0.0 | 0.3 | GO:0009554 | megasporogenesis(GO:0009554) |
| 0.0 | 0.1 | GO:0016139 | glycoside catabolic process(GO:0016139) |
| 0.0 | 0.5 | GO:0006636 | unsaturated fatty acid biosynthetic process(GO:0006636) |
| 0.0 | 0.3 | GO:0010951 | negative regulation of endopeptidase activity(GO:0010951) regulation of endopeptidase activity(GO:0052548) |
| 0.0 | 0.1 | GO:2000039 | regulation of trichome morphogenesis(GO:2000039) |
| 0.0 | 0.4 | GO:0010229 | inflorescence development(GO:0010229) |
| 0.0 | 0.6 | GO:0065001 | polarity specification of adaxial/abaxial axis(GO:0009944) specification of axis polarity(GO:0065001) |
| 0.0 | 0.4 | GO:0006526 | arginine biosynthetic process(GO:0006526) |
| 0.0 | 0.1 | GO:0046208 | spermine catabolic process(GO:0046208) |
| 0.0 | 0.1 | GO:1990884 | rRNA acetylation involved in maturation of SSU-rRNA(GO:1904812) rRNA acetylation(GO:1990882) RNA acetylation(GO:1990884) |
| 0.0 | 0.1 | GO:0046373 | L-arabinose metabolic process(GO:0046373) |
| 0.0 | 0.1 | GO:0046901 | tetrahydrofolylpolyglutamate biosynthetic process(GO:0046901) |
| 0.0 | 0.1 | GO:0010185 | regulation of cellular defense response(GO:0010185) |
| 0.0 | 0.3 | GO:0035336 | long-chain fatty-acyl-CoA metabolic process(GO:0035336) |
| 0.0 | 0.1 | GO:0032042 | mitochondrial DNA metabolic process(GO:0032042) |
| 0.0 | 0.8 | GO:0042026 | protein refolding(GO:0042026) |
| 0.0 | 0.1 | GO:0008295 | spermidine biosynthetic process(GO:0008295) |
| 0.0 | 0.4 | GO:0035999 | tetrahydrofolate interconversion(GO:0035999) |
| 0.0 | 0.6 | GO:2000012 | regulation of auxin polar transport(GO:2000012) |
| 0.0 | 0.2 | GO:0060771 | phyllotactic patterning(GO:0060771) |
| 0.0 | 0.1 | GO:0071281 | cellular response to iron ion(GO:0071281) |
| 0.0 | 0.1 | GO:0030322 | stabilization of membrane potential(GO:0030322) |
| 0.0 | 0.2 | GO:0048598 | embryonic morphogenesis(GO:0048598) |
| 0.0 | 2.0 | GO:0045490 | pectin catabolic process(GO:0045490) |
| 0.0 | 0.1 | GO:0006471 | protein ADP-ribosylation(GO:0006471) protein poly-ADP-ribosylation(GO:0070212) |
| 0.0 | 0.1 | GO:0006435 | threonyl-tRNA aminoacylation(GO:0006435) |
| 0.0 | 0.2 | GO:0030308 | negative regulation of cell growth(GO:0030308) |
| 0.0 | 0.1 | GO:0033499 | galactose catabolic process(GO:0019388) galactose catabolic process via UDP-galactose(GO:0033499) |
| 0.0 | 0.7 | GO:0010025 | wax biosynthetic process(GO:0010025) |
| 0.0 | 0.2 | GO:0033206 | meiotic cytokinesis(GO:0033206) |
| 0.0 | 0.5 | GO:0009851 | auxin biosynthetic process(GO:0009851) |
| 0.0 | 0.6 | GO:0009904 | chloroplast accumulation movement(GO:0009904) |
| 0.0 | 0.1 | GO:0046345 | sesquiterpenoid catabolic process(GO:0016107) apocarotenoid catabolic process(GO:0043290) abscisic acid catabolic process(GO:0046345) |
| 0.0 | 0.1 | GO:1904961 | quiescent center organization(GO:1904961) |
| 0.0 | 0.3 | GO:0045040 | outer mitochondrial membrane organization(GO:0007008) protein import into mitochondrial outer membrane(GO:0045040) |
| 0.0 | 0.7 | GO:0018208 | peptidyl-proline modification(GO:0018208) |
| 0.0 | 0.2 | GO:0009423 | chorismate biosynthetic process(GO:0009423) |
| 0.0 | 0.3 | GO:0009773 | photosynthetic electron transport in photosystem I(GO:0009773) |
| 0.0 | 0.1 | GO:0051101 | regulation of DNA binding(GO:0051101) |
| 0.0 | 0.1 | GO:0035493 | SNARE complex assembly(GO:0035493) |
| 0.0 | 0.8 | GO:0019758 | S-glycoside biosynthetic process(GO:0016144) glycosinolate biosynthetic process(GO:0019758) glucosinolate biosynthetic process(GO:0019761) |
| 0.0 | 0.1 | GO:0044211 | CTP salvage(GO:0044211) |
| 0.0 | 1.3 | GO:0007018 | microtubule-based movement(GO:0007018) |
| 0.0 | 0.2 | GO:0033314 | mitotic DNA replication checkpoint(GO:0033314) |
| 0.0 | 0.6 | GO:0016129 | phytosteroid biosynthetic process(GO:0016129) brassinosteroid biosynthetic process(GO:0016132) |
| 0.0 | 0.1 | GO:0080119 | ER body organization(GO:0080119) |
| 0.0 | 0.2 | GO:0010037 | response to carbon dioxide(GO:0010037) |
| 0.0 | 0.1 | GO:0009972 | cytidine catabolic process(GO:0006216) cytidine deamination(GO:0009972) cytidine metabolic process(GO:0046087) |
| 0.0 | 0.5 | GO:1901068 | guanosine-containing compound metabolic process(GO:1901068) |
| 0.0 | 0.1 | GO:0010045 | response to nickel cation(GO:0010045) |
| 0.0 | 0.2 | GO:2000779 | regulation of double-strand break repair(GO:2000779) |
| 0.0 | 1.1 | GO:0007267 | cell-cell signaling(GO:0007267) |
| 0.0 | 0.2 | GO:0071051 | polyadenylation-dependent snoRNA 3'-end processing(GO:0071051) |
| 0.0 | 0.3 | GO:0030488 | tRNA methylation(GO:0030488) |
| 0.0 | 1.1 | GO:0009736 | cytokinin-activated signaling pathway(GO:0009736) |
| 0.0 | 0.1 | GO:0071731 | response to nitric oxide(GO:0071731) |
| 0.0 | 0.3 | GO:0008356 | asymmetric cell division(GO:0008356) |
| 0.0 | 0.4 | GO:0006268 | DNA unwinding involved in DNA replication(GO:0006268) |
| 0.0 | 0.1 | GO:0006107 | oxaloacetate metabolic process(GO:0006107) |
| 0.0 | 0.1 | GO:0034635 | glutathione transport(GO:0034635) tripeptide transport(GO:0042939) |
| 0.0 | 0.2 | GO:0009961 | response to 1-aminocyclopropane-1-carboxylic acid(GO:0009961) |
| 0.0 | 0.1 | GO:0006654 | phosphatidic acid biosynthetic process(GO:0006654) |
| 0.0 | 0.5 | GO:0010027 | thylakoid membrane organization(GO:0010027) |
| 0.0 | 1.1 | GO:0009664 | plant-type cell wall organization(GO:0009664) |
| 0.0 | 0.1 | GO:0051570 | regulation of histone H3-K9 methylation(GO:0051570) |
| 0.0 | 0.1 | GO:0051051 | negative regulation of transport(GO:0051051) |
| 0.0 | 0.1 | GO:0006751 | glutathione catabolic process(GO:0006751) |
| 0.0 | 0.1 | GO:0048579 | negative regulation of long-day photoperiodism, flowering(GO:0048579) |
| 0.0 | 0.3 | GO:0009299 | mRNA transcription(GO:0009299) |
| 0.0 | 0.1 | GO:0070370 | cellular heat acclimation(GO:0070370) |
| 0.0 | 0.1 | GO:0048577 | negative regulation of short-day photoperiodism, flowering(GO:0048577) |
| 0.0 | 0.1 | GO:0008544 | epidermis development(GO:0008544) epidermal cell differentiation(GO:0009913) epithelial cell differentiation(GO:0030855) |
| 0.0 | 0.1 | GO:0018026 | peptidyl-lysine monomethylation(GO:0018026) |
| 0.0 | 0.5 | GO:0000028 | ribosomal small subunit assembly(GO:0000028) |
| 0.0 | 0.1 | GO:1990481 | mRNA pseudouridine synthesis(GO:1990481) |
| 0.0 | 0.0 | GO:0031054 | pre-miRNA processing(GO:0031054) |
| 0.0 | 0.2 | GO:0010492 | maintenance of shoot apical meristem identity(GO:0010492) |
| 0.0 | 0.0 | GO:1901465 | positive regulation of tetrapyrrole biosynthetic process(GO:1901465) |
| 0.0 | 0.2 | GO:0016104 | triterpenoid biosynthetic process(GO:0016104) |
| 0.0 | 0.1 | GO:0010070 | zygote asymmetric cell division(GO:0010070) |
| 0.0 | 0.1 | GO:0042218 | 1-aminocyclopropane-1-carboxylate biosynthetic process(GO:0042218) |
| 0.0 | 0.4 | GO:0045165 | cell fate commitment(GO:0045165) |
| 0.0 | 0.5 | GO:0051225 | spindle assembly(GO:0051225) |
| 0.0 | 0.1 | GO:0006513 | protein monoubiquitination(GO:0006513) |
| 0.0 | 0.2 | GO:0018342 | protein prenylation(GO:0018342) prenylation(GO:0097354) |
| 0.0 | 0.1 | GO:0010364 | regulation of ethylene biosynthetic process(GO:0010364) regulation of sulfur amino acid metabolic process(GO:0031335) regulation of olefin metabolic process(GO:1900908) regulation of olefin biosynthetic process(GO:1900911) |
| 0.0 | 0.3 | GO:0010075 | regulation of meristem growth(GO:0010075) |
| 0.0 | 0.0 | GO:0006722 | triterpenoid metabolic process(GO:0006722) |
| 0.0 | 0.2 | GO:0009396 | folic acid-containing compound biosynthetic process(GO:0009396) tetrahydrofolate biosynthetic process(GO:0046654) |
| 0.0 | 0.1 | GO:0010023 | proanthocyanidin biosynthetic process(GO:0010023) |
| 0.0 | 0.2 | GO:0010103 | stomatal complex morphogenesis(GO:0010103) |
| 0.0 | 0.1 | GO:0046417 | chorismate metabolic process(GO:0046417) |
| 0.0 | 0.1 | GO:0055129 | L-proline biosynthetic process(GO:0055129) |
| 0.0 | 0.1 | GO:0008216 | spermidine metabolic process(GO:0008216) |
| 0.0 | 0.1 | GO:0070475 | rRNA base methylation(GO:0070475) |
| 0.0 | 0.3 | GO:0048574 | long-day photoperiodism, flowering(GO:0048574) |
| 0.0 | 0.1 | GO:0010345 | suberin biosynthetic process(GO:0010345) |
| 0.0 | 0.2 | GO:0009231 | riboflavin metabolic process(GO:0006771) riboflavin biosynthetic process(GO:0009231) |
| 0.0 | 0.2 | GO:0019853 | L-ascorbic acid biosynthetic process(GO:0019853) |
| 0.0 | 0.1 | GO:0051131 | chaperone-mediated protein complex assembly(GO:0051131) |
| 0.0 | 0.1 | GO:0070981 | L-asparagine biosynthetic process(GO:0070981) L-asparagine metabolic process(GO:0070982) |
| 0.0 | 0.3 | GO:0051085 | 'de novo' posttranslational protein folding(GO:0051084) chaperone mediated protein folding requiring cofactor(GO:0051085) |
| 0.0 | 0.1 | GO:0033619 | membrane protein proteolysis(GO:0033619) |
| 0.0 | 0.1 | GO:0009934 | regulation of meristem structural organization(GO:0009934) |
| 0.0 | 0.1 | GO:0032456 | endocytic recycling(GO:0032456) |
| 0.0 | 0.0 | GO:0071836 | nectar secretion(GO:0071836) |
| 0.0 | 0.0 | GO:0080051 | cutin transport(GO:0080051) |
| 0.0 | 0.1 | GO:0007155 | cell adhesion(GO:0007155) biological adhesion(GO:0022610) |
| 0.0 | 0.3 | GO:0009691 | cytokinin biosynthetic process(GO:0009691) |
| 0.0 | 0.0 | GO:2000014 | regulation of endosperm development(GO:2000014) |
| 0.0 | 0.2 | GO:0010582 | floral meristem determinacy(GO:0010582) |
| 0.0 | 0.1 | GO:0051103 | DNA ligation involved in DNA repair(GO:0051103) |
Gene overrepresentation in cellular component category:
| Log-likelihood per target | Total log-likelihood | Term | Description |
|---|---|---|---|
| 0.3 | 2.3 | GO:0030076 | thylakoid light-harvesting complex(GO:0009503) PSII associated light-harvesting complex II(GO:0009517) light-harvesting complex(GO:0030076) |
| 0.2 | 0.6 | GO:0030093 | chloroplast photosystem I(GO:0030093) |
| 0.2 | 1.2 | GO:0009533 | chloroplast stromal thylakoid(GO:0009533) |
| 0.1 | 0.6 | GO:0009509 | chromoplast(GO:0009509) |
| 0.1 | 0.4 | GO:0070505 | pollen coat(GO:0070505) |
| 0.1 | 0.3 | GO:0010316 | pyrophosphate-dependent phosphofructokinase complex(GO:0010316) |
| 0.1 | 0.4 | GO:0009897 | external side of plasma membrane(GO:0009897) |
| 0.1 | 0.4 | GO:0034426 | etioplast envelope(GO:0034425) etioplast membrane(GO:0034426) |
| 0.1 | 0.5 | GO:0005854 | nascent polypeptide-associated complex(GO:0005854) |
| 0.1 | 0.2 | GO:0043186 | P granule(GO:0043186) pole plasm(GO:0045495) germ plasm(GO:0060293) |
| 0.1 | 0.2 | GO:0016323 | basal plasma membrane(GO:0009925) basolateral plasma membrane(GO:0016323) basal part of cell(GO:0045178) |
| 0.1 | 1.0 | GO:0009531 | secondary cell wall(GO:0009531) |
| 0.1 | 0.3 | GO:0071818 | BAT3 complex(GO:0071818) |
| 0.1 | 0.5 | GO:0045252 | oxoglutarate dehydrogenase complex(GO:0045252) |
| 0.1 | 0.3 | GO:0090397 | stigma papilla(GO:0090397) |
| 0.1 | 0.2 | GO:0043240 | Fanconi anaemia nuclear complex(GO:0043240) |
| 0.1 | 0.2 | GO:0010330 | cellulose synthase complex(GO:0010330) |
| 0.1 | 0.6 | GO:0009522 | photosystem I(GO:0009522) |
| 0.0 | 0.2 | GO:0009317 | acetyl-CoA carboxylase complex(GO:0009317) |
| 0.0 | 0.1 | GO:0070382 | exocytic vesicle(GO:0070382) |
| 0.0 | 0.1 | GO:0033281 | TAT protein transport complex(GO:0033281) |
| 0.0 | 0.2 | GO:0048476 | Holliday junction resolvase complex(GO:0048476) |
| 0.0 | 0.6 | GO:0010598 | NAD(P)H dehydrogenase complex (plastoquinone)(GO:0010598) |
| 0.0 | 0.3 | GO:0005664 | origin recognition complex(GO:0000808) nuclear origin of replication recognition complex(GO:0005664) |
| 0.0 | 0.2 | GO:0033063 | Rad51B-Rad51C-Rad51D-XRCC2 complex(GO:0033063) |
| 0.0 | 0.4 | GO:0000427 | plastid-encoded plastid RNA polymerase complex(GO:0000427) |
| 0.0 | 0.8 | GO:0009574 | preprophase band(GO:0009574) |
| 0.0 | 0.2 | GO:0000938 | GARP complex(GO:0000938) |
| 0.0 | 0.5 | GO:0005880 | nuclear microtubule(GO:0005880) |
| 0.0 | 0.2 | GO:0042645 | mitochondrial nucleoid(GO:0042645) |
| 0.0 | 9.4 | GO:0048046 | apoplast(GO:0048046) |
| 0.0 | 0.1 | GO:0008622 | epsilon DNA polymerase complex(GO:0008622) |
| 0.0 | 0.3 | GO:0010168 | ER body(GO:0010168) |
| 0.0 | 1.2 | GO:0009543 | chloroplast thylakoid lumen(GO:0009543) plastid thylakoid lumen(GO:0031978) |
| 0.0 | 0.4 | GO:0000815 | ESCRT III complex(GO:0000815) |
| 0.0 | 0.4 | GO:0048500 | signal recognition particle(GO:0048500) |
| 0.0 | 4.0 | GO:0046658 | anchored component of plasma membrane(GO:0046658) |
| 0.0 | 0.4 | GO:0016324 | apical plasma membrane(GO:0016324) |
| 0.0 | 0.3 | GO:0032300 | mismatch repair complex(GO:0032300) |
| 0.0 | 0.2 | GO:0001401 | mitochondrial sorting and assembly machinery complex(GO:0001401) |
| 0.0 | 1.1 | GO:0031969 | chloroplast membrane(GO:0031969) |
| 0.0 | 0.1 | GO:0009513 | etioplast(GO:0009513) |
| 0.0 | 0.3 | GO:0009508 | plastid chromosome(GO:0009508) |
| 0.0 | 0.4 | GO:0009547 | plastid ribosome(GO:0009547) |
| 0.0 | 0.2 | GO:0005677 | chromatin silencing complex(GO:0005677) |
| 0.0 | 2.5 | GO:0031225 | anchored component of membrane(GO:0031225) |
| 0.0 | 1.0 | GO:0009707 | chloroplast outer membrane(GO:0009707) |
| 0.0 | 0.3 | GO:0042644 | chloroplast nucleoid(GO:0042644) |
| 0.0 | 0.1 | GO:0031350 | intrinsic component of plastid membrane(GO:0031350) integral component of plastid membrane(GO:0031351) |
| 0.0 | 0.1 | GO:0031588 | nucleotide-activated protein kinase complex(GO:0031588) |
| 0.0 | 3.0 | GO:0009505 | plant-type cell wall(GO:0009505) |
| 0.0 | 0.3 | GO:0000418 | DNA-directed RNA polymerase IV complex(GO:0000418) |
| 0.0 | 4.9 | GO:0009534 | chloroplast thylakoid(GO:0009534) |
| 0.0 | 0.1 | GO:0032807 | DNA ligase IV complex(GO:0032807) |
| 0.0 | 0.1 | GO:0030127 | COPII vesicle coat(GO:0030127) |
| 0.0 | 0.3 | GO:0005736 | DNA-directed RNA polymerase I complex(GO:0005736) |
| 0.0 | 0.3 | GO:0005793 | endoplasmic reticulum-Golgi intermediate compartment(GO:0005793) |
| 0.0 | 0.2 | GO:0035861 | site of double-strand break(GO:0035861) |
| 0.0 | 0.0 | GO:0005640 | nuclear outer membrane(GO:0005640) |
| 0.0 | 0.1 | GO:0009360 | DNA polymerase III complex(GO:0009360) |
| 0.0 | 0.3 | GO:0030660 | Golgi-associated vesicle membrane(GO:0030660) |
| 0.0 | 0.2 | GO:0000176 | nuclear exosome (RNase complex)(GO:0000176) |
| 0.0 | 0.1 | GO:0005655 | ribonuclease MRP complex(GO:0000172) nucleolar ribonuclease P complex(GO:0005655) multimeric ribonuclease P complex(GO:0030681) |
| 0.0 | 0.3 | GO:0005871 | kinesin complex(GO:0005871) |
| 0.0 | 0.1 | GO:0044613 | nuclear pore central transport channel(GO:0044613) |
| 0.0 | 0.1 | GO:0031209 | SCAR complex(GO:0031209) |
| 0.0 | 0.2 | GO:0010287 | plastoglobule(GO:0010287) |
| 0.0 | 0.1 | GO:0005787 | signal peptidase complex(GO:0005787) |
| 0.0 | 0.1 | GO:0031464 | Cul4A-RING E3 ubiquitin ligase complex(GO:0031464) |
| 0.0 | 0.1 | GO:0045263 | mitochondrial proton-transporting ATP synthase complex, coupling factor F(o)(GO:0000276) proton-transporting ATP synthase complex, coupling factor F(o)(GO:0045263) |
Gene overrepresentation in molecular function category:
| Log-likelihood per target | Total log-likelihood | Term | Description |
|---|---|---|---|
| 0.3 | 2.1 | GO:0019137 | thioglucosidase activity(GO:0019137) |
| 0.2 | 0.7 | GO:0004822 | isoleucine-tRNA ligase activity(GO:0004822) |
| 0.2 | 0.5 | GO:0004013 | adenosylhomocysteinase activity(GO:0004013) trialkylsulfonium hydrolase activity(GO:0016802) |
| 0.2 | 0.5 | GO:0045485 | omega-6 fatty acid desaturase activity(GO:0045485) |
| 0.2 | 0.7 | GO:0050734 | hydroxycinnamoyltransferase activity(GO:0050734) |
| 0.2 | 0.8 | GO:0015367 | oxoglutarate:malate antiporter activity(GO:0015367) |
| 0.2 | 0.6 | GO:0070402 | NADPH binding(GO:0070402) |
| 0.2 | 0.5 | GO:0003838 | sterol 24-C-methyltransferase activity(GO:0003838) |
| 0.2 | 0.5 | GO:0044540 | L-cystine L-cysteine-lyase (deaminating)(GO:0044540) |
| 0.2 | 0.9 | GO:0050017 | L-3-cyanoalanine synthase activity(GO:0050017) |
| 0.1 | 1.1 | GO:0010328 | auxin influx transmembrane transporter activity(GO:0010328) |
| 0.1 | 0.4 | GO:0016728 | ribonucleoside-diphosphate reductase activity, thioredoxin disulfide as acceptor(GO:0004748) oxidoreductase activity, acting on CH or CH2 groups, disulfide as acceptor(GO:0016728) ribonucleoside-diphosphate reductase activity(GO:0061731) |
| 0.1 | 0.5 | GO:0009784 | transmembrane receptor histidine kinase activity(GO:0009784) transmembrane histidine kinase cytokinin receptor activity(GO:0009885) |
| 0.1 | 0.4 | GO:0004462 | lactoylglutathione lyase activity(GO:0004462) |
| 0.1 | 0.5 | GO:0015245 | fatty acid transporter activity(GO:0015245) |
| 0.1 | 0.5 | GO:0031957 | very long-chain fatty acid-CoA ligase activity(GO:0031957) |
| 0.1 | 1.3 | GO:0047259 | glucomannan 4-beta-mannosyltransferase activity(GO:0047259) |
| 0.1 | 0.8 | GO:1990538 | xylan O-acetyltransferase activity(GO:1990538) |
| 0.1 | 0.3 | GO:0010283 | pinoresinol reductase activity(GO:0010283) |
| 0.1 | 0.4 | GO:0004729 | oxygen-dependent protoporphyrinogen oxidase activity(GO:0004729) protoporphyrinogen oxidase activity(GO:0070818) |
| 0.1 | 0.5 | GO:0004148 | dihydrolipoyl dehydrogenase activity(GO:0004148) |
| 0.1 | 0.3 | GO:0001130 | bacterial-type RNA polymerase transcription factor activity, sequence-specific DNA binding(GO:0001130) bacterial-type RNA polymerase transcriptional activator activity, sequence-specific DNA binding(GO:0001216) |
| 0.1 | 2.4 | GO:0016837 | carbon-oxygen lyase activity, acting on polysaccharides(GO:0016837) pectate lyase activity(GO:0030570) |
| 0.1 | 0.5 | GO:0034432 | bis(5'-adenosyl)-pentaphosphatase activity(GO:0034432) |
| 0.1 | 1.3 | GO:0004332 | fructose-bisphosphate aldolase activity(GO:0004332) |
| 0.1 | 0.7 | GO:0070696 | transmembrane receptor protein serine/threonine kinase binding(GO:0070696) |
| 0.1 | 0.6 | GO:0008169 | C-methyltransferase activity(GO:0008169) |
| 0.1 | 1.0 | GO:0103075 | indole-3-pyruvate monooxygenase activity(GO:0103075) |
| 0.1 | 0.3 | GO:0047334 | diphosphate-fructose-6-phosphate 1-phosphotransferase activity(GO:0047334) |
| 0.1 | 0.4 | GO:0016463 | cadmium-transporting ATPase activity(GO:0015434) zinc-exporting ATPase activity(GO:0016463) |
| 0.1 | 2.1 | GO:0004565 | beta-galactosidase activity(GO:0004565) |
| 0.1 | 2.1 | GO:0016168 | chlorophyll binding(GO:0016168) |
| 0.1 | 0.4 | GO:0016752 | sinapoyltransferase activity(GO:0016752) O-sinapoyltransferase activity(GO:0016753) |
| 0.1 | 0.3 | GO:0030410 | nicotianamine synthase activity(GO:0030410) |
| 0.1 | 2.6 | GO:0016762 | xyloglucan:xyloglucosyl transferase activity(GO:0016762) |
| 0.1 | 0.8 | GO:0008725 | alkylbase DNA N-glycosylase activity(GO:0003905) DNA-3-methyladenine glycosylase activity(GO:0008725) DNA-3-methylbase glycosylase activity(GO:0043733) |
| 0.1 | 0.1 | GO:0047517 | 1,4-beta-D-xylan synthase activity(GO:0047517) |
| 0.1 | 0.2 | GO:0047912 | galacturonokinase activity(GO:0047912) |
| 0.1 | 0.3 | GO:0080097 | L-tryptophan:pyruvate aminotransferase activity(GO:0080097) |
| 0.1 | 0.4 | GO:0010277 | chlorophyllide a oxygenase [overall] activity(GO:0010277) |
| 0.1 | 0.2 | GO:0000064 | L-ornithine transmembrane transporter activity(GO:0000064) |
| 0.1 | 0.2 | GO:0080045 | quercetin 3'-O-glucosyltransferase activity(GO:0080045) |
| 0.1 | 0.6 | GO:0008083 | growth factor activity(GO:0008083) |
| 0.1 | 0.4 | GO:0015288 | porin activity(GO:0015288) wide pore channel activity(GO:0022829) |
| 0.1 | 0.5 | GO:0052623 | ATP dimethylallyltransferase activity(GO:0052622) ADP dimethylallyltransferase activity(GO:0052623) |
| 0.1 | 0.6 | GO:0010329 | auxin efflux transmembrane transporter activity(GO:0010329) |
| 0.1 | 0.2 | GO:0009374 | biotin binding(GO:0009374) |
| 0.1 | 0.4 | GO:0016681 | ubiquinol-cytochrome-c reductase activity(GO:0008121) oxidoreductase activity, acting on diphenols and related substances as donors, cytochrome as acceptor(GO:0016681) |
| 0.1 | 0.2 | GO:0004412 | homoserine dehydrogenase activity(GO:0004412) |
| 0.1 | 0.7 | GO:0034485 | phosphatidylinositol-3,4,5-trisphosphate 5-phosphatase activity(GO:0034485) |
| 0.1 | 0.4 | GO:0017150 | tRNA dihydrouridine synthase activity(GO:0017150) |
| 0.1 | 0.2 | GO:0070330 | oxidoreductase activity, acting on paired donors, with incorporation or reduction of molecular oxygen, reduced flavin or flavoprotein as one donor, and incorporation of one atom of oxygen(GO:0016712) aromatase activity(GO:0070330) |
| 0.1 | 0.4 | GO:0046030 | inositol trisphosphate phosphatase activity(GO:0046030) |
| 0.1 | 1.8 | GO:0004089 | carbonate dehydratase activity(GO:0004089) |
| 0.1 | 1.9 | GO:0005179 | hormone activity(GO:0005179) |
| 0.1 | 0.3 | GO:0003979 | UDP-glucose 6-dehydrogenase activity(GO:0003979) |
| 0.1 | 0.2 | GO:0003849 | 3-deoxy-7-phosphoheptulonate synthase activity(GO:0003849) |
| 0.1 | 0.2 | GO:0004075 | biotin carboxylase activity(GO:0004075) |
| 0.1 | 0.2 | GO:0004400 | histidinol-phosphate transaminase activity(GO:0004400) |
| 0.1 | 0.2 | GO:0080116 | glucuronoxylan glucuronosyltransferase activity(GO:0080116) |
| 0.1 | 0.3 | GO:0004478 | methionine adenosyltransferase activity(GO:0004478) |
| 0.1 | 0.4 | GO:0003999 | adenine phosphoribosyltransferase activity(GO:0003999) |
| 0.0 | 0.2 | GO:0010313 | phytochrome binding(GO:0010313) |
| 0.0 | 1.0 | GO:0015250 | water transmembrane transporter activity(GO:0005372) water channel activity(GO:0015250) |
| 0.0 | 0.1 | GO:0090599 | alpha-glucosidase activity(GO:0090599) |
| 0.0 | 0.7 | GO:0031545 | procollagen-proline 4-dioxygenase activity(GO:0004656) procollagen-proline dioxygenase activity(GO:0019798) peptidyl-proline 4-dioxygenase activity(GO:0031545) |
| 0.0 | 0.6 | GO:0000774 | adenyl-nucleotide exchange factor activity(GO:0000774) |
| 0.0 | 0.2 | GO:0005354 | galactose transmembrane transporter activity(GO:0005354) |
| 0.0 | 0.4 | GO:0042299 | lupeol synthase activity(GO:0042299) |
| 0.0 | 0.4 | GO:0009979 | 16:0 monogalactosyldiacylglycerol desaturase activity(GO:0009979) |
| 0.0 | 0.1 | GO:1990404 | protein ADP-ribosylase activity(GO:1990404) |
| 0.0 | 0.2 | GO:0010285 | L,L-diaminopimelate aminotransferase activity(GO:0010285) |
| 0.0 | 0.2 | GO:0016707 | gibberellin 3-beta-dioxygenase activity(GO:0016707) |
| 0.0 | 0.2 | GO:0008395 | steroid hydroxylase activity(GO:0008395) |
| 0.0 | 0.3 | GO:0004024 | alcohol dehydrogenase activity, zinc-dependent(GO:0004024) |
| 0.0 | 0.1 | GO:0004353 | glutamate dehydrogenase [NAD(P)+] activity(GO:0004353) |
| 0.0 | 0.1 | GO:0004042 | acetyl-CoA:L-glutamate N-acetyltransferase activity(GO:0004042) |
| 0.0 | 0.1 | GO:0022858 | L-alanine transmembrane transporter activity(GO:0015180) alanine transmembrane transporter activity(GO:0022858) |
| 0.0 | 0.2 | GO:0030742 | GTP-dependent protein binding(GO:0030742) |
| 0.0 | 1.6 | GO:0016759 | cellulose synthase activity(GO:0016759) |
| 0.0 | 0.4 | GO:0016423 | tRNA (guanine) methyltransferase activity(GO:0016423) |
| 0.0 | 0.7 | GO:0003746 | translation elongation factor activity(GO:0003746) |
| 0.0 | 0.2 | GO:0050105 | L-gulonolactone oxidase activity(GO:0050105) |
| 0.0 | 0.4 | GO:0009378 | four-way junction helicase activity(GO:0009378) |
| 0.0 | 0.3 | GO:0001872 | (1->3)-beta-D-glucan binding(GO:0001872) |
| 0.0 | 0.1 | GO:0004156 | 2-amino-4-hydroxy-6-hydroxymethyldihydropteridine diphosphokinase activity(GO:0003848) dihydropteroate synthase activity(GO:0004156) |
| 0.0 | 4.1 | GO:0004252 | serine-type endopeptidase activity(GO:0004252) |
| 0.0 | 0.1 | GO:0052635 | C-20 gibberellin 2-beta-dioxygenase activity(GO:0052635) |
| 0.0 | 0.2 | GO:0050378 | UDP-glucuronate 4-epimerase activity(GO:0050378) |
| 0.0 | 0.2 | GO:0031177 | phosphopantetheine binding(GO:0031177) |
| 0.0 | 0.4 | GO:0008312 | 7S RNA binding(GO:0008312) |
| 0.0 | 0.4 | GO:0047429 | nucleoside-triphosphate diphosphatase activity(GO:0047429) |
| 0.0 | 0.2 | GO:0030943 | mitochondrion targeting sequence binding(GO:0030943) |
| 0.0 | 0.2 | GO:0036456 | L-methionine:thioredoxin-disulfide S-oxidoreductase activity(GO:0033744) L-methionine-(S)-S-oxide reductase activity(GO:0036456) |
| 0.0 | 0.3 | GO:0008175 | tRNA methyltransferase activity(GO:0008175) |
| 0.0 | 0.2 | GO:0016621 | cinnamoyl-CoA reductase activity(GO:0016621) |
| 0.0 | 0.4 | GO:0051747 | cytosine C-5 DNA demethylase activity(GO:0051747) |
| 0.0 | 0.2 | GO:0008835 | diaminohydroxyphosphoribosylaminopyrimidine deaminase activity(GO:0008835) |
| 0.0 | 0.3 | GO:0004526 | ribonuclease P activity(GO:0004526) |
| 0.0 | 0.9 | GO:0047262 | polygalacturonate 4-alpha-galacturonosyltransferase activity(GO:0047262) |
| 0.0 | 0.3 | GO:0004550 | nucleoside diphosphate kinase activity(GO:0004550) |
| 0.0 | 0.1 | GO:0004034 | aldose 1-epimerase activity(GO:0004034) |
| 0.0 | 0.1 | GO:0004679 | AMP-activated protein kinase activity(GO:0004679) |
| 0.0 | 0.1 | GO:1990883 | rRNA cytidine N-acetyltransferase activity(GO:1990883) |
| 0.0 | 0.1 | GO:0019789 | SUMO transferase activity(GO:0019789) |
| 0.0 | 0.1 | GO:0052381 | tRNA dimethylallyltransferase activity(GO:0052381) |
| 0.0 | 0.4 | GO:0042300 | beta-amyrin synthase activity(GO:0042300) |
| 0.0 | 0.3 | GO:0016464 | chloroplast protein-transporting ATPase activity(GO:0016464) |
| 0.0 | 0.1 | GO:0005460 | UDP-glucose transmembrane transporter activity(GO:0005460) |
| 0.0 | 0.4 | GO:1990939 | ATP-dependent microtubule motor activity(GO:1990939) |
| 0.0 | 0.5 | GO:0035250 | UDP-galactosyltransferase activity(GO:0035250) |
| 0.0 | 0.6 | GO:0102337 | 3-oxo-arachidoyl-CoA synthase activity(GO:0102336) 3-oxo-cerotoyl-CoA synthase activity(GO:0102337) 3-oxo-lignoceronyl-CoA synthase activity(GO:0102338) |
| 0.0 | 0.4 | GO:0004708 | MAP kinase kinase activity(GO:0004708) |
| 0.0 | 0.5 | GO:0015386 | potassium:proton antiporter activity(GO:0015386) |
| 0.0 | 0.3 | GO:0016161 | beta-amylase activity(GO:0016161) |
| 0.0 | 0.1 | GO:0010295 | (+)-abscisic acid 8'-hydroxylase activity(GO:0010295) |
| 0.0 | 0.1 | GO:0003987 | acetate-CoA ligase activity(GO:0003987) |
| 0.0 | 0.1 | GO:0032135 | DNA insertion or deletion binding(GO:0032135) |
| 0.0 | 0.2 | GO:0004559 | alpha-mannosidase activity(GO:0004559) |
| 0.0 | 0.2 | GO:0016646 | oxidoreductase activity, acting on the CH-NH group of donors, NAD or NADP as acceptor(GO:0016646) |
| 0.0 | 0.1 | GO:0004071 | aspartate-ammonia ligase activity(GO:0004071) |
| 0.0 | 0.2 | GO:0002094 | polyprenyltransferase activity(GO:0002094) |
| 0.0 | 0.1 | GO:0004829 | threonine-tRNA ligase activity(GO:0004829) |
| 0.0 | 0.9 | GO:0008171 | O-methyltransferase activity(GO:0008171) |
| 0.0 | 0.1 | GO:0004326 | tetrahydrofolylpolyglutamate synthase activity(GO:0004326) |
| 0.0 | 0.2 | GO:0032977 | membrane insertase activity(GO:0032977) |
| 0.0 | 0.2 | GO:0080046 | quercetin 4'-O-glucosyltransferase activity(GO:0080046) |
| 0.0 | 0.2 | GO:0004372 | glycine hydroxymethyltransferase activity(GO:0004372) serine binding(GO:0070905) |
| 0.0 | 0.1 | GO:0004849 | uridine kinase activity(GO:0004849) |
| 0.0 | 0.3 | GO:0080019 | fatty-acyl-CoA reductase (alcohol-forming) activity(GO:0080019) |
| 0.0 | 0.5 | GO:0080031 | methyl salicylate esterase activity(GO:0080031) methyl jasmonate esterase activity(GO:0080032) |
| 0.0 | 0.2 | GO:0015271 | outward rectifier potassium channel activity(GO:0015271) |
| 0.0 | 0.1 | GO:0002161 | aminoacyl-tRNA editing activity(GO:0002161) |
| 0.0 | 0.2 | GO:0031176 | endo-1,4-beta-xylanase activity(GO:0031176) |
| 0.0 | 0.1 | GO:0004049 | anthranilate synthase activity(GO:0004049) |
| 0.0 | 0.1 | GO:0004126 | cytidine deaminase activity(GO:0004126) |
| 0.0 | 0.2 | GO:0070180 | large ribosomal subunit rRNA binding(GO:0070180) |
| 0.0 | 0.1 | GO:0004350 | glutamate 5-kinase activity(GO:0004349) glutamate-5-semialdehyde dehydrogenase activity(GO:0004350) |
| 0.0 | 0.4 | GO:0005199 | structural constituent of cell wall(GO:0005199) |
| 0.0 | 2.7 | GO:0008017 | microtubule binding(GO:0008017) |
| 0.0 | 0.3 | GO:0047196 | long-chain-alcohol O-fatty-acyltransferase activity(GO:0047196) |
| 0.0 | 0.1 | GO:0017077 | oxidative phosphorylation uncoupler activity(GO:0017077) |
| 0.0 | 0.1 | GO:0004506 | squalene monooxygenase activity(GO:0004506) |
| 0.0 | 0.1 | GO:0008297 | single-stranded DNA exodeoxyribonuclease activity(GO:0008297) |
| 0.0 | 0.2 | GO:0017048 | Rho GTPase binding(GO:0017048) |
| 0.0 | 0.1 | GO:0008934 | inositol monophosphate 1-phosphatase activity(GO:0008934) inositol monophosphate phosphatase activity(GO:0052834) |
| 0.0 | 0.1 | GO:0000150 | recombinase activity(GO:0000150) four-way junction DNA binding(GO:0000400) |
| 0.0 | 1.1 | GO:0003755 | peptidyl-prolyl cis-trans isomerase activity(GO:0003755) |
| 0.0 | 0.1 | GO:0004106 | chorismate mutase activity(GO:0004106) |
| 0.0 | 0.1 | GO:0003913 | DNA photolyase activity(GO:0003913) |
| 0.0 | 0.2 | GO:0008318 | protein prenyltransferase activity(GO:0008318) |
| 0.0 | 0.2 | GO:0004312 | fatty acid synthase activity(GO:0004312) |
| 0.0 | 0.1 | GO:0005544 | calcium-dependent phospholipid binding(GO:0005544) |
| 0.0 | 0.5 | GO:0009975 | cyclase activity(GO:0009975) |
| 0.0 | 0.7 | GO:0000156 | phosphorelay response regulator activity(GO:0000156) |
| 0.0 | 0.4 | GO:0051087 | chaperone binding(GO:0051087) |
| 0.0 | 0.2 | GO:0010385 | double-stranded methylated DNA binding(GO:0010385) |
| 0.0 | 0.2 | GO:0030983 | mismatched DNA binding(GO:0030983) |
| 0.0 | 0.4 | GO:0032934 | sterol binding(GO:0032934) |
| 0.0 | 1.0 | GO:0046910 | pectinesterase inhibitor activity(GO:0046910) |
| 0.0 | 0.3 | GO:0005089 | Rho guanyl-nucleotide exchange factor activity(GO:0005089) |
| 0.0 | 0.0 | GO:0004150 | dihydroneopterin aldolase activity(GO:0004150) |
| 0.0 | 0.0 | GO:0008883 | glutamyl-tRNA reductase activity(GO:0008883) |
| 0.0 | 0.0 | GO:0004046 | aminoacylase activity(GO:0004046) |
| 0.0 | 0.1 | GO:0046923 | ER retention sequence binding(GO:0046923) |
| 0.0 | 0.2 | GO:0048029 | monosaccharide binding(GO:0048029) |
| 0.0 | 0.1 | GO:0016812 | hydrolase activity, acting on carbon-nitrogen (but not peptide) bonds, in cyclic amides(GO:0016812) |
| 0.0 | 0.0 | GO:0015026 | coreceptor activity(GO:0015026) |
| 0.0 | 0.2 | GO:0016844 | strictosidine synthase activity(GO:0016844) |
| 0.0 | 0.1 | GO:0003985 | acetyl-CoA C-acetyltransferase activity(GO:0003985) C-acetyltransferase activity(GO:0016453) |
| 0.0 | 0.1 | GO:0042500 | aspartic endopeptidase activity, intramembrane cleaving(GO:0042500) |
| 0.0 | 0.3 | GO:0016597 | amino acid binding(GO:0016597) |
| 0.0 | 0.0 | GO:0003852 | 2-isopropylmalate synthase activity(GO:0003852) |
| 0.0 | 0.1 | GO:0061505 | DNA topoisomerase type II (ATP-hydrolyzing) activity(GO:0003918) DNA topoisomerase II activity(GO:0061505) |
| 0.0 | 0.4 | GO:0016655 | oxidoreductase activity, acting on NAD(P)H, quinone or similar compound as acceptor(GO:0016655) |
| 0.0 | 0.4 | GO:0003714 | transcription corepressor activity(GO:0003714) |
| 0.0 | 0.0 | GO:0015119 | hexose phosphate transmembrane transporter activity(GO:0015119) glucose-6-phosphate transmembrane transporter activity(GO:0015152) |
| 0.0 | 0.1 | GO:0046577 | long-chain-alcohol oxidase activity(GO:0046577) |
| 0.0 | 0.1 | GO:0009927 | histidine phosphotransfer kinase activity(GO:0009927) |
| 0.0 | 0.2 | GO:0004564 | beta-fructofuranosidase activity(GO:0004564) |
| 0.0 | 0.2 | GO:0070290 | phospholipase D activity(GO:0004630) N-acylphosphatidylethanolamine-specific phospholipase D activity(GO:0070290) |
| 0.0 | 0.5 | GO:0003899 | DNA-directed RNA polymerase activity(GO:0003899) |
Gene overrepresentation in curated gene sets: canonical pathways category:
| Log-likelihood per target | Total log-likelihood | Term | Description |
|---|---|---|---|
| 0.1 | 0.3 | PID P53 REGULATION PATHWAY | p53 pathway |
| 0.1 | 0.2 | PID MYC REPRESS PATHWAY | Validated targets of C-MYC transcriptional repression |
| 0.0 | 0.1 | SA CASPASE CASCADE | Apoptosis is mediated by caspases, cysteine proteases arranged in a proteolytic cascade. |
| 0.0 | 0.2 | PID AP1 PATHWAY | AP-1 transcription factor network |
| 0.0 | 0.1 | PID ATM PATHWAY | ATM pathway |
| 0.0 | 0.2 | PID HIF1 TFPATHWAY | HIF-1-alpha transcription factor network |
| 0.0 | 0.1 | PID ARF 3PATHWAY | Arf1 pathway |
| 0.0 | 0.2 | PID FANCONI PATHWAY | Fanconi anemia pathway |
| 0.0 | 0.0 | PID HNF3B PATHWAY | FOXA2 and FOXA3 transcription factor networks |
| 0.0 | 0.0 | SA G1 AND S PHASES | Cdk2, 4, and 6 bind cyclin D in G1, while cdk2/cyclin E promotes the G1/S transition. |
Gene overrepresentation in curated gene sets: REACTOME pathways category:
| Log-likelihood per target | Total log-likelihood | Term | Description |
|---|---|---|---|
| 0.3 | 1.7 | REACTOME REVERSIBLE HYDRATION OF CARBON DIOXIDE | Genes involved in Reversible Hydration of Carbon Dioxide |
| 0.1 | 0.4 | REACTOME TRANSCRIPTIONAL ACTIVITY OF SMAD2 SMAD3 SMAD4 HETEROTRIMER | Genes involved in Transcriptional activity of SMAD2/SMAD3:SMAD4 heterotrimer |
| 0.1 | 0.6 | REACTOME GOLGI ASSOCIATED VESICLE BIOGENESIS | Genes involved in Golgi Associated Vesicle Biogenesis |
| 0.1 | 0.1 | REACTOME COPI MEDIATED TRANSPORT | Genes involved in COPI Mediated Transport |
| 0.1 | 0.2 | REACTOME ABACAVIR TRANSPORT AND METABOLISM | Genes involved in Abacavir transport and metabolism |
| 0.1 | 0.2 | REACTOME G2 M DNA DAMAGE CHECKPOINT | Genes involved in G2/M DNA damage checkpoint |
| 0.0 | 0.6 | REACTOME FACTORS INVOLVED IN MEGAKARYOCYTE DEVELOPMENT AND PLATELET PRODUCTION | Genes involved in Factors involved in megakaryocyte development and platelet production |
| 0.0 | 0.2 | REACTOME G1 S SPECIFIC TRANSCRIPTION | Genes involved in G1/S-Specific Transcription |
| 0.0 | 0.2 | REACTOME INNATE IMMUNE SYSTEM | Genes involved in Innate Immune System |
| 0.0 | 0.4 | REACTOME ABCA TRANSPORTERS IN LIPID HOMEOSTASIS | Genes involved in ABCA transporters in lipid homeostasis |
| 0.0 | 0.2 | REACTOME REMOVAL OF THE FLAP INTERMEDIATE FROM THE C STRAND | Genes involved in Removal of the Flap Intermediate from the C-strand |
| 0.0 | 0.1 | REACTOME GENERIC TRANSCRIPTION PATHWAY | Genes involved in Generic Transcription Pathway |
| 0.0 | 0.1 | REACTOME GASTRIN CREB SIGNALLING PATHWAY VIA PKC AND MAPK | Genes involved in Gastrin-CREB signalling pathway via PKC and MAPK |
| 0.0 | 0.1 | REACTOME ASSOCIATION OF LICENSING FACTORS WITH THE PRE REPLICATIVE COMPLEX | Genes involved in Association of licensing factors with the pre-replicative complex |