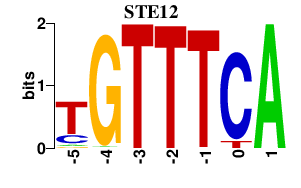
Results for STE12
Z-value: 2.89
Motif logo
Transcription factors associated with STE12
| Gene Symbol | Gene ID | Gene Info |
|---|---|---|
|
STE12
|
S000001126 | Transcription factor that is activated by a MAPK signaling cascade |
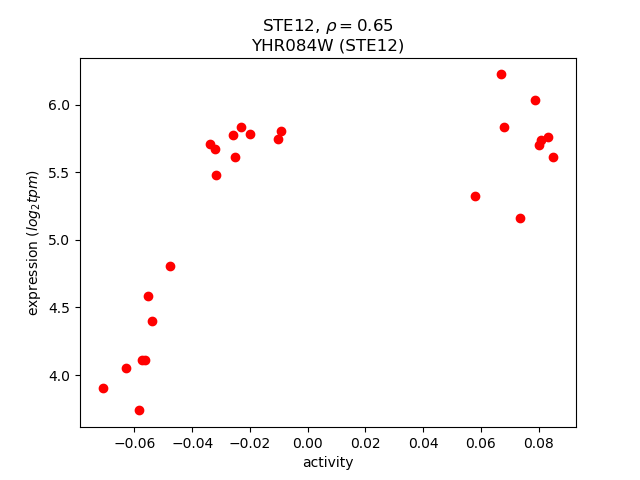
Activity-expression correlation:
Activity profile of STE12 motif
Sorted Z-values of STE12 motif
| Promoter | Log-likelihood | Transcript | Gene | Gene Info |
|---|---|---|---|---|
| YCR018C | 29.01 |
SRD1
|
Protein involved in the processing of pre-rRNA to mature rRNA; contains a C2/C2 zinc finger motif; srd1 mutation suppresses defects caused by the rrp1-1 mutation |
|
| YGR108W | 26.20 |
CLB1
|
B-type cyclin involved in cell cycle progression; activates Cdc28p to promote the transition from G2 to M phase; accumulates during G2 and M, then targeted via a destruction box motif for ubiquitin-mediated degradation by the proteasome |
|
| YFR055W | 22.54 |
IRC7
|
Putative cystathionine beta-lyase; involved in copper ion homeostasis and sulfur metabolism; null mutant displays increased levels of spontaneous Rad52p foci; expression induced by nitrogen limitation in a GLN3, GAT1-dependent manner |
|
| YFR056C | 20.34 |
Dubious open reading frame unlikely to encode a protein based on available experimental and comparative sequence data; partially overlaps the uncharacterized gene YFR055W |
||
| YPR119W | 19.81 |
CLB2
|
B-type cyclin involved in cell cycle progression; activates Cdc28p to promote the transition from G2 to M phase; accumulates during G2 and M, then targeted via a destruction box motif for ubiquitin-mediated degradation by the proteasome |
|
| YLR154C | 19.68 |
RNH203
|
Ribonuclease H2 subunit, required for RNase H2 activity |
|
| YIL052C | 19.39 |
RPL34B
|
Protein component of the large (60S) ribosomal subunit, nearly identical to Rpl34Ap and has similarity to rat L34 ribosomal protein |
|
| YGL097W | 18.41 |
SRM1
|
Nucleotide exchange factor for Gsp1p, localizes to the nucleus, required for nucleocytoplasmic trafficking of macromolecules; suppressor of the pheromone response pathway; potentially phosphorylated by Cdc28p |
|
| YLL045C | 18.30 |
RPL8B
|
Ribosomal protein L4 of the large (60S) ribosomal subunit, nearly identical to Rpl8Ap and has similarity to rat L7a ribosomal protein; mutation results in decreased amounts of free 60S subunits |
|
| YDR044W | 17.56 |
HEM13
|
Coproporphyrinogen III oxidase, an oxygen requiring enzyme that catalyzes the sixth step in the heme biosynthetic pathway; localizes to the mitochondrial inner membrane; transcription is repressed by oxygen and heme (via Rox1p and Hap1p) |
|
| YER102W | 16.92 |
RPS8B
|
Protein component of the small (40S) ribosomal subunit; identical to Rps8Ap and has similarity to rat S8 ribosomal protein |
|
| YNR054C | 16.03 |
ESF2
|
Essential nucleolar protein involved in pre-18S rRNA processing; binds to RNA and stimulates ATPase activity of Dbp8; involved in assembly of the small subunit (SSU) processome |
|
| YLR154W-A | 15.52 |
Dubious open reading frame unlikely to encode a protein; encoded within the the 25S rRNA gene on the opposite strand |
||
| YLR154W-B | 15.27 |
Dubious open reading frame unlikely to encode a protein; encoded within the the 25S rRNA gene on the opposite strand |
||
| YHR084W | 14.66 |
STE12
|
Transcription factor that is activated by a MAP kinase signaling cascade, activates genes involved in mating or pseudohyphal/invasive growth pathways; cooperates with Tec1p transcription factor to regulate genes specific for invasive growth |
|
| YCL055W | 14.27 |
KAR4
|
Transcription factor required for gene regulation in repsonse to pheromones; also required during meiosis; exists in two forms, a slower-migrating form more abundant during vegetative growth and a faster-migrating form induced by pheromone |
|
| YDR279W | 13.96 |
RNH202
|
Ribonuclease H2 subunit, required for RNase H2 activity |
|
| YGR040W | 13.70 |
KSS1
|
Mitogen-activated protein kinase (MAPK) involved in signal transduction pathways that control filamentous growth and pheromone response; the KSS1 gene is nonfunctional in S288C strains and functional in W303 strains |
|
| YLR061W | 12.52 |
RPL22A
|
Protein component of the large (60S) ribosomal subunit, has similarity to Rpl22Bp and to rat L22 ribosomal protein |
|
| YNL043C | 12.00 |
Dubious open reading frame unlikely to encode a protein, based on available experimental and comparative sequence data; partially overlaps the verified gene YIP3/YNL044W |
||
| YIR021W | 11.65 |
MRS1
|
Protein required for the splicing of two mitochondrial group I introns (BI3 in COB and AI5beta in COX1); forms a splicing complex, containing four subunits of Mrs1p and two subunits of the BI3-encoded maturase, that binds to the BI3 RNA |
|
| YHR181W | 11.63 |
SVP26
|
Integral membrane protein of the early Golgi apparatus and endoplasmic reticulum, involved in COP II vesicle transport; may also function to promote retention of proteins in the early Golgi compartment |
|
| YDL055C | 11.52 |
PSA1
|
GDP-mannose pyrophosphorylase (mannose-1-phosphate guanyltransferase), synthesizes GDP-mannose from GTP and mannose-1-phosphate in cell wall biosynthesis; required for normal cell wall structure |
|
| YOR096W | 11.47 |
RPS7A
|
Protein component of the small (40S) ribosomal subunit, nearly identical to Rps7Bp; interacts with Kti11p; deletion causes hypersensitivity to zymocin; has similarity to rat S7 and Xenopus S8 ribosomal proteins |
|
| YKL096W-A | 11.18 |
CWP2
|
Covalently linked cell wall mannoprotein, major constituent of the cell wall; plays a role in stabilizing the cell wall; involved in low pH resistance; precursor is GPI-anchored |
|
| YHR141C | 10.62 |
RPL42B
|
Protein component of the large (60S) ribosomal subunit, identical to Rpl42Ap and has similarity to rat L44; required for propagation of the killer toxin-encoding M1 double-stranded RNA satellite of the L-A double-stranded RNA virus |
|
| YFL026W | 10.46 |
STE2
|
Receptor for alpha-factor pheromone; seven transmembrane-domain GPCR that interacts with both pheromone and a heterotrimeric G protein to initiate the signaling response that leads to mating between haploid a and alpha cells |
|
| YNR044W | 10.42 |
AGA1
|
Anchorage subunit of a-agglutinin of a-cells, highly O-glycosylated protein with N-terminal secretion signal and C-terminal signal for addition of GPI anchor to cell wall, linked to adhesion subunit Aga2p via two disulfide bonds |
|
| YEL068C | 10.12 |
Dubious open reading frame unlikely to encode a functional protein, based on available experimental and comparative sequence data |
||
| YEL040W | 9.98 |
UTR2
|
Cell wall protein that functions in the transfer of chitin to beta(1-6)glucan; putative chitin transglycosidase; glycosylphosphatidylinositol (GPI)-anchored protein localized to the bud neck; has a role in cell wall maintenance |
|
| YKR041W | 9.81 |
Putative protein of unknown function; green fluorescent protein (GFP)-fusion protein localizes to the cytoplasm and nucleus |
||
| YLR154W-C | 9.75 |
TAR1
|
Mitochondrial protein of unknown function, overexpression suppresses an rpo41 mutation affecting mitochondrial RNA polymerase; encoded within the 25S rRNA gene on the opposite strand |
|
| YIL015W | 9.51 |
BAR1
|
Aspartyl protease secreted into the periplasmic space of mating type a cells, helps cells find mating partners, cleaves and inactivates alpha factor allowing cells to recover from alpha-factor-induced cell cycle arrest |
|
| YNR001W-A | 9.20 |
Dubious open reading frame unlikely to encode a functional protein; identified by homology |
||
| YKL218C | 8.98 |
SRY1
|
3-hydroxyaspartate dehydratase, deaminates L-threo-3-hydroxyaspartate to form oxaloacetate and ammonia; required for survival in the presence of hydroxyaspartate |
|
| YDR033W | 8.97 |
MRH1
|
Protein that localizes primarily to the plasma membrane, also found at the nuclear envelope; the authentic, non-tagged protein is detected in mitochondria in a phosphorylated state; has similarity to Hsp30p and Yro2p |
|
| YPL075W | 8.93 |
GCR1
|
Transcriptional activator of genes involved in glycolysis; DNA-binding protein that interacts and functions with the transcriptional activator Gcr2p |
|
| YBR158W | 8.88 |
AMN1
|
Protein required for daughter cell separation, multiple mitotic checkpoints, and chromosome stability; contains 12 degenerate leucine-rich repeat motifs; expression is induced by the Mitotic Exit Network (MEN) |
|
| YGR085C | 8.80 |
RPL11B
|
Protein component of the large (60S) ribosomal subunit, nearly identical to Rpl11Ap; involved in ribosomal assembly; depletion causes degradation of proteins and RNA of the 60S subunit; has similarity to E. coli L5 and rat L11 |
|
| YML046W | 8.78 |
PRP39
|
U1 snRNP protein involved in splicing, contains multiple tetriatricopeptide repeats |
|
| YIL009W | 8.70 |
FAA3
|
Long chain fatty acyl-CoA synthetase, has a preference for C16 and C18 fatty acids; green fluorescent protein (GFP)-fusion protein localizes to the cell periphery |
|
| YDR099W | 8.55 |
BMH2
|
14-3-3 protein, minor isoform; controls proteome at post-transcriptional level, binds proteins and DNA, involved in regulation of many processes including exocytosis, vesicle transport, Ras/MAPK signaling, and rapamycin-sensitive signaling |
|
| YHR180W-A | 8.19 |
Dubious open reading frame unlikely to encode a protein, based on available experimental and comparative sequence data; partially overlaps dubious ORF YHR180C-B and long terminal repeat YHRCsigma3 |
||
| YHR005C | 8.05 |
GPA1
|
GTP-binding alpha subunit of the heterotrimeric G protein that couples to pheromone receptors; negatively regulates the mating pathway by sequestering G(beta)gamma and by triggering an adaptive response; activates Vps34p at the endosome |
|
| YPR170W-B | 8.01 |
Putative protein of unknown function, conserved in fungi; partially overlaps the dubious genes YPR169W-A, YPR170W-A and YRP170C |
||
| YDR098C | 7.91 |
GRX3
|
Hydroperoxide and superoxide-radical responsive glutathione-dependent oxidoreductase; monothiol glutaredoxin subfamily member along with Grx4p and Grx5p; protects cells from oxidative damage |
|
| YOL039W | 7.84 |
RPP2A
|
Ribosomal protein P2 alpha, a component of the ribosomal stalk, which is involved in the interaction between translational elongation factors and the ribosome; regulates the accumulation of P1 (Rpp1Ap and Rpp1Bp) in the cytoplasm |
|
| YHR201C | 7.68 |
PPX1
|
Exopolyphosphatase, hydrolyzes inorganic polyphosphate (poly P) into Pi residues; located in the cytosol, plasma membrane, and mitochondrial matrix |
|
| YLR388W | 7.67 |
RPS29A
|
Protein component of the small (40S) ribosomal subunit; nearly identical to Rps29Bp and has similarity to rat S29 and E. coli S14 ribosomal proteins |
|
| YCR019W | 7.64 |
MAK32
|
Protein necessary for structural stability of L-A double-stranded RNA-containing particles |
|
| YPL250W-A | 7.63 |
Identified by fungal homology and RT-PCR |
||
| YLR257W | 7.56 |
Putative protein of unknown function |
||
| YJL169W | 7.54 |
Dubious open reading frame unlikely to encode a protein, based on available experimental and comparative sequence data; partially overlaps the verified gene YJL168C/SET2 |
||
| YHR010W | 7.46 |
RPL27A
|
Protein component of the large (60S) ribosomal subunit, nearly identical to Rpl27Bp and has similarity to rat L27 ribosomal protein |
|
| YPL163C | 7.34 |
SVS1
|
Cell wall and vacuolar protein, required for wild-type resistance to vanadate |
|
| YOL040C | 7.30 |
RPS15
|
Protein component of the small (40S) ribosomal subunit; has similarity to E. coli S19 and rat S15 ribosomal proteins |
|
| YGR027C | 7.27 |
RPS25A
|
Protein component of the small (40S) ribosomal subunit; nearly identical to Rps25Bp and has similarity to rat S25 ribosomal protein |
|
| YLR452C | 7.27 |
SST2
|
GTPase-activating protein for Gpa1p, regulates desensitization to alpha factor pheromone; also required to prevent receptor-independent signaling of the mating pathway; member of the RGS (regulator of G-protein signaling) family |
|
| YLR411W | 7.25 |
CTR3
|
High-affinity copper transporter of the plasma membrane, acts as a trimer; gene is disrupted by a Ty2 transposon insertion in many laboratory strains of S. cerevisiae |
|
| YCL027W | 7.18 |
FUS1
|
Membrane protein localized to the shmoo tip, required for cell fusion; expression regulated by mating pheromone; proposed to coordinate signaling, fusion, and polarization events required for fusion; potential Cdc28p substrate |
|
| YKL164C | 7.16 |
PIR1
|
O-glycosylated protein required for cell wall stability; attached to the cell wall via beta-1,3-glucan; mediates mitochondrial translocation of Apn1p; expression regulated by the cell integrity pathway and by Swi5p during the cell cycle |
|
| YEL066W | 7.05 |
HPA3
|
D-Amino acid N-acetyltransferase, catalyzes N-acetylation of D-amino acids through ordered bi-bi mechanism in which acetyl-CoA is first substrate bound and CoA is last product liberated; similar to Hpa2p, acetylates histones weakly in vitro |
|
| YPL273W | 7.00 |
SAM4
|
S-adenosylmethionine-homocysteine methyltransferase, functions along with Mht1p in the conversion of S-adenosylmethionine (AdoMet) to methionine to control the methionine/AdoMet ratio |
|
| YLR349W | 6.88 |
Dubious open reading frame unlikely to encode a protein, based on available experimental and comparative sequence data; overlaps the verified ORF DIC1/YLR348C |
||
| YPR170W-A | 6.88 |
Dubious open reading frame unlikely to encode a functional protein, based on available experimental and comparative sequence data; identified by expression profiling and mass spectrometry |
||
| YKL110C | 6.82 |
KTI12
|
Protein that plays a role, with Elongator complex, in modification of wobble nucleosides in tRNA; involved in sensitivity to G1 arrest induced by zymocin; interacts with chromatin throughout the genome; also interacts with Cdc19p |
|
| YDR278C | 6.75 |
Dubious open reading frame unlikely to encode a functional protein, based on available experimental and comparative sequence data |
||
| YIL009C-A | 6.74 |
EST3
|
Component of the telomerase holoenzyme, involved in telomere replication |
|
| YLR448W | 6.67 |
RPL6B
|
Protein component of the large (60S) ribosomal subunit, has similarity to Rpl6Ap and to rat L6 ribosomal protein; binds to 5.8S rRNA |
|
| YLR348C | 6.66 |
DIC1
|
Mitochondrial dicarboxylate carrier, integral membrane protein, catalyzes a dicarboxylate-phosphate exchange across the inner mitochondrial membrane, transports cytoplasmic dicarboxylates into the mitochondrial matrix |
|
| YOL101C | 6.65 |
IZH4
|
Membrane protein involved in zinc metabolism, member of the four-protein IZH family, expression induced by fatty acids and altered zinc levels; deletion reduces sensitivity to excess zinc; possible role in sterol metabolism |
|
| YKR092C | 6.42 |
SRP40
|
Nucleolar, serine-rich protein with a role in preribosome assembly or transport; may function as a chaperone of small nucleolar ribonucleoprotein particles (snoRNPs); immunologically and structurally to rat Nopp140 |
|
| YHL015W | 6.40 |
RPS20
|
Protein component of the small (40S) ribosomal subunit; overproduction suppresses mutations affecting RNA polymerase III-dependent transcription; has similarity to E. coli S10 and rat S20 ribosomal proteins |
|
| YER137C | 6.36 |
Putative protein of unknown function |
||
| YJL157C | 6.19 |
FAR1
|
Cyclin-dependent kinase inhibitor that mediates cell cycle arrest in response to pheromone; also forms a complex with Cdc24p, Ste4p, and Ste18p that may specify the direction of polarized growth during mating; potential Cdc28p substrate |
|
| YJL107C | 6.19 |
Putative protein of unknown function; expression is induced by activation of the HOG1 mitogen-activated signaling pathway and this induction is Hog1p/Pbs2p dependent; YJL107C and adjacent ORF, YJL108C are merged in related fungi |
||
| YBL072C | 6.13 |
RPS8A
|
Protein component of the small (40S) ribosomal subunit; identical to Rps8Bp and has similarity to rat S8 ribosomal protein |
|
| YER074W | 6.12 |
RPS24A
|
Protein component of the small (40S) ribosomal subunit; identical to Rps24Bp and has similarity to rat S24 ribosomal protein |
|
| YNL302C | 6.10 |
RPS19B
|
Protein component of the small (40S) ribosomal subunit, required for assembly and maturation of pre-40 S particles; mutations in human RPS19 are associated with Diamond Blackfan anemia; nearly identical to Rps19Ap |
|
| YGL201C | 6.05 |
MCM6
|
Protein involved in DNA replication; component of the Mcm2-7 hexameric complex that binds chromatin as a part of the pre-replicative complex |
|
| YGR189C | 5.95 |
CRH1
|
Putative chitin transglycosidase, cell wall protein that functions in the transfer of chitin to beta(1-6)glucan; localizes to sites of polarized growth; expression is induced under cell wall stress conditions |
|
| YDR345C | 5.94 |
HXT3
|
Low affinity glucose transporter of the major facilitator superfamily, expression is induced in low or high glucose conditions |
|
| YFR031C-A | 5.93 |
RPL2A
|
Protein component of the large (60S) ribosomal subunit, identical to Rpl2Bp and has similarity to E. coli L2 and rat L8 ribosomal proteins |
|
| YEL067C | 5.89 |
Putative protein of unknown function; the authentic, non-tagged protein is detected in highly purified mitochondria in high-throughput studies |
||
| YPR171W | 5.88 |
BSP1
|
Adapter that links synaptojanins Inp52p and Inp53p to the cortical actin cytoskeleton |
|
| YNL280C | 5.87 |
ERG24
|
C-14 sterol reductase, acts in ergosterol biosynthesis; mutants accumulate the abnormal sterol ignosterol (ergosta-8,14 dienol), and are viable under anaerobic growth conditions but inviable on rich medium under aerobic conditions |
|
| YOR342C | 5.76 |
Putative protein of unknown function; green fluorescent protein (GFP)-fusion protein localizes to the cytoplasm and the nucleus |
||
| YER001W | 5.76 |
MNN1
|
Alpha-1,3-mannosyltransferase, integral membrane glycoprotein of the Golgi complex, required for addition of alpha1,3-mannose linkages to N-linked and O-linked oligosaccharides, one of five S. cerevisiae proteins of the MNN1 family |
|
| YER131W | 5.75 |
RPS26B
|
Protein component of the small (40S) ribosomal subunit; nearly identical to Rps26Ap and has similarity to rat S26 ribosomal protein |
|
| YOR212W | 5.75 |
STE4
|
G protein beta subunit, forms a dimer with Ste18p to activate the mating signaling pathway, forms a heterotrimer with Gpa1p and Ste18p to dampen signaling; may recruit Rho1p to the polarized growth site during mating; contains WD40 repeats |
|
| YNL153C | 5.74 |
GIM3
|
Subunit of the heterohexameric cochaperone prefoldin complex which binds specifically to cytosolic chaperonin and transfers target proteins to it |
|
| YPL142C | 5.65 |
Dubious open reading frame unlikely to encode a protein, based on available experimental and comparative sequence data; completely overlaps the verified ORF RPL33A/YPL143W, a component of the large (60S) ribosomal subunit |
||
| YJL188C | 5.63 |
BUD19
|
Dubious open reading frame, unlikely to encode a protein; not conserved in closely related Saccharomyces species; 88% of ORF overlaps the verified gene RPL39; diploid mutant displays a weak budding pattern phenotype in a systematic assay |
|
| YNR067C | 5.63 |
DSE4
|
Daughter cell-specific secreted protein with similarity to glucanases, degrades cell wall from the daughter side causing daughter to separate from mother |
|
| YKL209C | 5.60 |
STE6
|
Plasma membrane ATP-binding cassette (ABC) transporter required for the export of a-factor, catalyzes ATP hydrolysis coupled to a-factor transport; contains 12 transmembrane domains and two ATP binding domains; expressed only in MATa cells |
|
| YGR106C | 5.56 |
VOA1
|
Putative protein of unknown function; green fluorescent protein (GFP)-fusion protein localizes to the vacuolar memebrane |
|
| YOL161C | 5.42 |
PAU20
|
Hypothetical protein |
|
| YPL141C | 5.38 |
Putative protein kinase; similar to Kin4p; green fluorescent protein (GFP)-fusion protein localizes to the cytoplasm; YPL141C is not an essential gene |
||
| YKR013W | 5.35 |
PRY2
|
Protein of unknown function, has similarity to Pry1p and Pry3p and to the plant PR-1 class of pathogen related proteins |
|
| YFR054C | 5.27 |
Dubious open reading frame unlikely to encode a functional protein, based on available experimental and comparative sequence data |
||
| YCL018W | 5.18 |
LEU2
|
Beta-isopropylmalate dehydrogenase (IMDH), catalyzes the third step in the leucine biosynthesis pathway |
|
| YOR181W | 5.17 |
LAS17
|
Actin assembly factor, activates the Arp2/3 protein complex that nucleates branched actin filaments; localizes with the Arp2/3 complex to actin patches; homolog of the human Wiskott-Aldrich syndrome protein (WASP) |
|
| YMR205C | 5.14 |
PFK2
|
Beta subunit of heterooctameric phosphofructokinase involved in glycolysis, indispensable for anaerobic growth, activated by fructose-2,6-bisphosphate and AMP, mutation inhibits glucose induction of cell cycle-related genes |
|
| YFL027C | 5.13 |
GYP8
|
GTPase-activating protein for yeast Rab family members; Ypt1p is the preferred in vitro substrate but also acts on Sec4p, Ypt31p and Ypt32p; involved in the regulation of ER to Golgi vesicle transport |
|
| YLR042C | 5.13 |
Protein of unknown function; localizes to the cytoplasm; YLL042C is not an essential gene |
||
| YMR183C | 5.13 |
SSO2
|
Plasma membrane t-SNARE involved in fusion of secretory vesicles at the plasma membrane; syntaxin homolog that is functionally redundant with Sso1p |
|
| YOR180C | 5.11 |
DCI1
|
Peroxisomal delta(3,5)-delta(2,4)-dienoyl-CoA isomerase, involved in fatty acid metabolism, contains peroxisome targeting signals at amino and carboxy termini |
|
| YPR014C | 5.08 |
Dubious open reading frame unlikely to encode a protein, based on available experimental and comparative sequence data; YPR014C is not an essential gene |
||
| YKL122C | 5.06 |
SRP21
|
Subunit of the signal recognition particle (SRP), which functions in protein targeting to the endoplasmic reticulum membrane; not found in mammalian SRP; forms a pre-SRP structure in the nucleolus that is translocated to the cytoplasm |
|
| YBR092C | 5.05 |
PHO3
|
Constitutively expressed acid phosphatase similar to Pho5p; brought to the cell surface by transport vesicles; hydrolyzes thiamin phosphates in the periplasmic space, increasing cellular thiamin uptake; expression is repressed by thiamin |
|
| YPR170C | 5.04 |
Dubious open reading frame unlikely to encode a protein, based on available experimental and comparative sequence data; partially overlaps the dubious ORFs YPR169W-A and YPR170W-B |
||
| YIL053W | 5.02 |
RHR2
|
Constitutively expressed isoform of DL-glycerol-3-phosphatase; involved in glycerol biosynthesis, induced in response to both anaerobic and, along with the Hor2p/Gpp2p isoform, osmotic stress |
|
| YGR208W | 4.96 |
SER2
|
Phosphoserine phosphatase of the phosphoglycerate pathway, involved in serine and glycine biosynthesis, expression is regulated by the available nitrogen source |
|
| YLR150W | 4.89 |
STM1
|
Protein that binds G4 quadruplex and purine motif triplex nucleic acid; acts with Cdc13p to maintain telomere structure; interacts with ribosomes and subtelomeric Y' DNA; multicopy suppressor of tom1 and pop2 mutations |
|
| YAR071W | 4.84 |
PHO11
|
One of three repressible acid phosphatases, a glycoprotein that is transported to the cell surface by the secretory pathway; induced by phosphate starvation and coordinately regulated by PHO4 and PHO2 |
|
| YOR226C | 4.83 |
ISU2
|
Conserved protein of the mitochondrial matrix, required for synthesis of mitochondrial and cytosolic iron-sulfur proteins, performs a scaffolding function in mitochondria during Fe/S cluster assembly; isu1 isu2 double mutant is inviable |
|
| YEL001C | 4.82 |
IRC22
|
Putative protein of unknown function; green fluorescent protein (GFP)-fusion localizes to the ER; YEL001C is non-essential; null mutant displays increased levels of spontaneous Rad52p foci |
|
| YJR009C | 4.75 |
TDH2
|
Glyceraldehyde-3-phosphate dehydrogenase, isozyme 2, involved in glycolysis and gluconeogenesis; tetramer that catalyzes the reaction of glyceraldehyde-3-phosphate to 1,3 bis-phosphoglycerate; detected in the cytoplasm and cell-wall |
|
| YGL032C | 4.69 |
AGA2
|
Adhesion subunit of a-agglutinin of a-cells, C-terminal sequence acts as a ligand for alpha-agglutinin (Sag1p) during agglutination, modified with O-linked oligomannosyl chains, linked to anchorage subunit Aga1p via two disulfide bonds |
|
| YHR143W | 4.69 |
DSE2
|
Daughter cell-specific secreted protein with similarity to glucanases, degrades cell wall from the daughter side causing daughter to separate from mother; expression is repressed by cAMP |
|
| YJL105W | 4.66 |
SET4
|
Protein of unknown function, contains a SET domain |
|
| YGR107W | 4.65 |
Dubious open reading frame unlikely to encode a protein, based on available experimental and comparative sequence data |
||
| YDR339C | 4.63 |
FCF1
|
Essential nucleolar protein that is a component of the SSU (small subunit) processome involved in the pre-rRNA processing steps of 40S ribosomal subunit biogenesis; contains a PINc domain; copurifies with Faf1p |
|
| YHR144C | 4.57 |
DCD1
|
Deoxycytidine monophosphate (dCMP) deaminase required for dCTP and dTTP synthesis; expression is NOT cell cycle regulated |
|
| YJL106W | 4.55 |
IME2
|
Serine/threonine protein kinase involved in activation of meiosis, associates with Ime1p and mediates its stability, activates Ndt80p; IME2 expression is positively regulated by Ime1p |
|
| YJL190C | 4.52 |
RPS22A
|
Protein component of the small (40S) ribosomal subunit; nearly identical to Rps22Bp and has similarity to E. coli S8 and rat S15a ribosomal proteins |
|
| YKR012C | 4.51 |
Dubious open reading frame unlikely to encode a protein, based on available experimental and comparative sequence data; partially overlaps the verified gene PRY2 |
||
| YNL141W | 4.45 |
AAH1
|
Adenine deaminase (adenine aminohydrolase), converts adenine to hypoxanthine; involved in purine salvage; transcriptionally regulated by nutrient levels and growth phase; Aah1p degraded upon entry into quiescence via SCF and the proteasome |
|
| YGR242W | 4.44 |
Dubious open reading frame unlikely to encode a protein, based on available experimental and comparative sequence data; partially overlaps the verified ORF YAP1802/YGR241C |
||
| YBR023C | 4.42 |
CHS3
|
Chitin synthase III, catalyzes the transfer of N-acetylglucosamine (GlcNAc) to chitin; required for synthesis of the majority of cell wall chitin, the chitin ring during bud emergence, and spore wall chitosan |
|
| YGR293C | 4.41 |
Dubious open reading frame unlikely to encode a protein, based on available experimental and comparative sequence data; partially overlaps the uncharacterized ORF YGR294W |
||
| YDR002W | 4.41 |
YRB1
|
Ran GTPase binding protein; involved in nuclear protein import and RNA export, ubiquitin-mediated protein degradation during the cell cycle; shuttles between the nucleus and cytoplasm; is essential; homolog of human RanBP1 |
|
| YHR030C | 4.39 |
SLT2
|
Serine/threonine MAP kinase involved in regulating the maintenance of cell wall integrity and progression through the cell cycle; regulated by the PKC1-mediated signaling pathway |
|
| YJL158C | 4.39 |
CIS3
|
Mannose-containing glycoprotein constituent of the cell wall; member of the PIR (proteins with internal repeats) family |
|
| YNL066W | 4.34 |
SUN4
|
Cell wall protein related to glucanases, possibly involved in cell wall septation; member of the SUN family |
|
| YDL228C | 4.34 |
Dubious open reading frame unlikely to encode a protein, based on available experimental and comparative sequence data; almost completely overlaps the verified gene SSB1 |
||
| YLR068W | 4.32 |
FYV7
|
Protein of unknown function, required for survival upon exposure to K1 killer toxin; involved in processing the 35S rRNA primary transcript to generate the 20S and 27SA2 pre-rRNA transcripts |
|
| YOL121C | 4.31 |
RPS19A
|
Protein component of the small (40S) ribosomal subunit, required for assembly and maturation of pre-40 S particles; mutations in human RPS19 are associated with Diamond Blackfan anemia; nearly identical to Rps19Bp |
|
| YLR292C | 4.30 |
SEC72
|
Non-essential subunit of Sec63 complex (Sec63p, Sec62p, Sec66p and Sec72p); with Sec61 complex, Kar2p/BiP and Lhs1p forms a channel competent for SRP-dependent and post-translational SRP-independent protein targeting and import into the ER |
|
| YKL182W | 4.22 |
FAS1
|
Beta subunit of fatty acid synthetase, which catalyzes the synthesis of long-chain saturated fatty acids; contains acetyltransacylase, dehydratase, enoyl reductase, malonyl transacylase, and palmitoyl transacylase activities |
|
| YER007C-A | 4.22 |
TMA20
|
Protein of unknown function that associates with ribosomes and has a putative RNA binding domain; interacts with Tma22p; null mutant exhibits translation defects; has homology to human oncogene MCT-1 |
|
| YKR038C | 4.20 |
KAE1
|
Putative glycoprotease proposed to be in transcription as a component of the EKC protein complex with Bud32p, Cgi121p, Pcc1p, and Gon7p; also identified as a component of the KEOPS protein complex |
|
| YJR123W | 4.16 |
RPS5
|
Protein component of the small (40S) ribosomal subunit, the least basic of the non-acidic ribosomal proteins; phosphorylated in vivo; essential for viability; has similarity to E. coli S7 and rat S5 ribosomal proteins |
|
| YKL153W | 4.16 |
Dubious open reading frame unlikely to encode a protein, based on available experimental and comparative sequence data; transcription of both YLK153W and the overlapping essential gene GPM1 is reduced in the gcr1 null mutant |
||
| YHR203C | 4.16 |
RPS4B
|
Protein component of the small (40S) ribosomal subunit; identical to Rps4Ap and has similarity to rat S4 ribosomal protein |
|
| YIL123W | 4.12 |
SIM1
|
Protein of the SUN family (Sim1p, Uth1p, Nca3p, Sun4p) that may participate in DNA replication, promoter contains SCB regulation box at -300 bp indicating that expression may be cell cycle-regulated |
|
| YDL211C | 4.11 |
Putative protein of unknown function; green fluorescent protein (GFP)-fusion protein localizes to the vacuole |
||
| YIL018W | 4.10 |
RPL2B
|
Protein component of the large (60S) ribosomal subunit, identical to Rpl2Ap and has similarity to E. coli L2 and rat L8 ribosomal proteins; expression is upregulated at low temperatures |
|
| YER048C | 4.10 |
CAJ1
|
Nuclear type II J heat shock protein of the E. coli dnaJ family, contains a leucine zipper-like motif, binds to non-native substrates for presentation to Ssa3p, may function during protein translocation, assembly and disassembly |
|
| YMR049C | 4.08 |
ERB1
|
Protein required for maturation of the 25S and 5.8S ribosomal RNAs; constituent of 66S pre-ribosomal particles; homologous to mammalian Bop1 |
|
| YOR108C-A | 4.07 |
Identified by gene-trapping, microarray-based expression analysis, and genome-wide homology searching |
||
| YMR305C | 4.05 |
SCW10
|
Cell wall protein with similarity to glucanases; may play a role in conjugation during mating based on mutant phenotype and its regulation by Ste12p |
|
| YOR101W | 4.05 |
RAS1
|
GTPase involved in G-protein signaling in the adenylate cyclase activating pathway, plays a role in cell proliferation; localized to the plasma membrane; homolog of mammalian RAS proto-oncogenes |
|
| YMR003W | 4.04 |
AIM34
|
Protein of unknown function; GFP-fusion protein localizes to the mitochondria; null mutant is viable and displays decreased frequency of mitochondrial genome loss (petite formation) and severe growth defect in minimal glycerol media |
|
| YGR279C | 4.02 |
SCW4
|
Cell wall protein with similarity to glucanases; scw4 scw10 double mutants exhibit defects in mating |
|
| YDR133C | 4.02 |
Dubious open reading frame unlikely to encode a protein, based on available experimental and comparative sequence data; partially overlaps YDR134C |
||
| YLR455W | 3.97 |
Putative protein of unknown function; green fluorescent protein (GFP)-fusion protein localizes to the nucleus; deletion confers sensitivity to 4-(N-(S-glutathionylacetyl)amino) phenylarsenoxide (GSAO) |
||
| YML074C | 3.97 |
FPR3
|
Nucleolar peptidyl-prolyl cis-trans isomerase (PPIase); FK506 binding protein; phosphorylated by casein kinase II (Cka1p-Cka2p-Ckb1p-Ckb2p) and dephosphorylated by Ptp1p |
|
| YBR181C | 3.96 |
RPS6B
|
Protein component of the small (40S) ribosomal subunit; identical to Rps6Ap and has similarity to rat S6 ribosomal protein |
|
| YGL253W | 3.95 |
HXK2
|
Hexokinase isoenzyme 2 that catalyzes phosphorylation of glucose in the cytosol; predominant hexokinase during growth on glucose; functions in the nucleus to repress expression of HXK1 and GLK1 and to induce expression of its own gene |
|
| YBR283C | 3.94 |
SSH1
|
Subunit of the Ssh1 translocon complex; Sec61p homolog involved in co-translational pathway of protein translocation; not essential |
|
| YDR417C | 3.93 |
Hypothetical protein |
||
| YDL132W | 3.92 |
CDC53
|
Cullin, structural protein of SCF complexes (which also contain Skp1p, Cdc34p, Hrt1p and an F-box protein) involved in ubiquitination; SCF promotes the G1-S transition by targeting G1 cyclins and the Cln-CDK inhibitor Sic1p for degradation |
|
| YLL043W | 3.91 |
FPS1
|
Plasma membrane channel, member of major intrinsic protein (MIP) family; involved in efflux of glycerol and in uptake of acetic acid and the trivalent metalloids arsenite and antimonite; phosphorylated by Hog1p MAPK under acetate stress |
|
| YPL177C | 3.81 |
CUP9
|
Homeodomain-containing transcriptional repressor of PTR2, which encodes a major peptide transporter; imported peptides activate ubiquitin-dependent proteolysis, resulting in degradation of Cup9p and de-repression of PTR2 transcription |
|
| YGR123C | 3.81 |
PPT1
|
Protein serine/threonine phosphatase with similarity to human phosphatase PP5; present in both the nucleus and cytoplasm; expressed during logarithmic growth; computational analyses suggest roles in phosphate metabolism and rRNA processing |
|
| YGR241C | 3.80 |
YAP1802
|
Protein involved in clathrin cage assembly; binds Pan1p and clathrin; homologous to Yap1801p, member of the AP180 protein family |
|
| YDR261C | 3.79 |
EXG2
|
Exo-1,3-beta-glucanase, involved in cell wall beta-glucan assembly; may be anchored to the plasma membrane via a glycosylphosphatidylinositol (GPI) anchor |
|
| YCR006C | 3.79 |
Dubious open reading frame unlikely to encode a protein, based on available experimental and comparative sequence data |
||
| YIL008W | 3.77 |
URM1
|
Ubiquitin-like protein with weak sequence similarity to ubiquitin; depends on the E1-like activating enzyme Uba4p; molecular function of the Urm1p pathway is unknown, but it is required for normal growth, particularly at high temperature |
|
| YPL050C | 3.75 |
MNN9
|
Subunit of Golgi mannosyltransferase complex also containing Anp1p, Mnn10p, Mnn11p, and Hoc1p that mediates elongation of the polysaccharide mannan backbone; forms a separate complex with Van1p that is also involved in backbone elongation |
|
| YJL115W | 3.74 |
ASF1
|
Nucleosome assembly factor, involved in chromatin assembly and disassembly, anti-silencing protein that causes derepression of silent loci when overexpressed; plays a role in regulating Ty1 transposition |
|
| YMR198W | 3.74 |
CIK1
|
Kinesin-associated protein required for both karyogamy and mitotic spindle organization, interacts stably and specifically with Kar3p and may function to target this kinesin to a specific cellular role; has similarity to Vik1p |
|
| YGR214W | 3.74 |
RPS0A
|
Protein component of the small (40S) ribosomal subunit, nearly identical to Rps0Bp; required for maturation of 18S rRNA along with Rps0Bp; deletion of either RPS0 gene reduces growth rate, deletion of both genes is lethal |
|
| YCR034W | 3.73 |
FEN1
|
Fatty acid elongase, involved in sphingolipid biosynthesis; acts on fatty acids of up to 24 carbons in length; mutations have regulatory effects on 1,3-beta-glucan synthase, vacuolar ATPase, and the secretory pathway |
|
| YNL178W | 3.73 |
RPS3
|
Protein component of the small (40S) ribosomal subunit, has apurinic/apyrimidinic (AP) endonuclease activity; essential for viability; has similarity to E. coli S3 and rat S3 ribosomal proteins |
|
| YER073W | 3.68 |
ALD5
|
Mitochondrial aldehyde dehydrogenase, involved in regulation or biosynthesis of electron transport chain components and acetate formation; activated by K+; utilizes NADP+ as the preferred coenzyme; constitutively expressed |
|
| YER048W-A | 3.65 |
ISD11
|
Protein required for mitochondrial iron-sulfur cluster biosynthesis |
|
| YLR286C | 3.64 |
CTS1
|
Endochitinase, required for cell separation after mitosis; transcriptional activation during late G and early M cell cycle phases is mediated by transcription factor Ace2p |
|
| YJL011C | 3.63 |
RPC17
|
RNA polymerase III subunit C17; physically interacts with C31, C11, and TFIIIB70; may be involved in the recruitment of pol III by the preinitiation complex |
|
| YDR183C-A | 3.63 |
Dubious open reading frame unlikely to encode a functional protein; identified by fungal homology and RT-PCR |
||
| YPR010C | 3.63 |
RPA135
|
RNA polymerase I subunit A135 |
|
| YMR072W | 3.61 |
ABF2
|
Mitochondrial DNA-binding protein involved in mitochondrial DNA replication and recombination, member of HMG1 DNA-binding protein family; activity may be regulated by protein kinase A phosphorylation |
|
| YDR381W | 3.61 |
YRA1
|
Nuclear protein that binds to RNA and to Mex67p, required for export of poly(A)+ mRNA from the nucleus; member of the REF (RNA and export factor binding proteins) family; another family member, Yra2p, can substitute for Yra1p function |
|
| YDL240W | 3.60 |
LRG1
|
Putative GTPase-activating protein (GAP) involved in the Pkc1p-mediated signaling pathway that controls cell wall integrity; appears to specifically regulate 1,3-beta-glucan synthesis |
|
| YGL147C | 3.59 |
RPL9A
|
Protein component of the large (60S) ribosomal subunit, nearly identical to Rpl9Bp and has similarity to E. coli L6 and rat L9 ribosomal proteins |
|
| YPL239W | 3.58 |
YAR1
|
Cytoplasmic ankyrin-repeat containing protein of unknown function, proposed to link the processes of 40S ribosomal subunit biogenesis and adaptation to osmotic and oxidative stress; expression repressed by heat shock |
|
| YML063W | 3.58 |
RPS1B
|
Ribosomal protein 10 (rp10) of the small (40S) subunit; nearly identical to Rps1Ap and has similarity to rat S3a ribosomal protein |
|
| YER070W | 3.56 |
RNR1
|
One of two large regulatory subunits of ribonucleotide-diphosphate reductase; the RNR complex catalyzes rate-limiting step in dNTP synthesis, regulated by DNA replication and DNA damage checkpoint pathways via localization of small subunits |
|
| YNL079C | 3.56 |
TPM1
|
Major isoform of tropomyosin; binds to and stabilizes actin cables and filaments, which direct polarized cell growth and the distribution of several organelles; acetylated by the NatB complex and acetylated form binds actin most efficiently |
|
| YLR210W | 3.55 |
CLB4
|
B-type cyclin involved in cell cycle progression; activates Cdc28p to promote the G2/M transition; may be involved in DNA replication and spindle assembly; accumulates during S phase and G2, then targeted for ubiquitin-mediated degradation |
|
| YJR054W | 3.55 |
Vacuolar protein of unknown function; potential Cdc28p substrate |
||
| YPL131W | 3.54 |
RPL5
|
Protein component of the large (60S) ribosomal subunit with similarity to E. coli L18 and rat L5 ribosomal proteins; binds 5S rRNA and is required for 60S subunit assembly |
|
| YDR471W | 3.54 |
RPL27B
|
Protein component of the large (60S) ribosomal subunit, nearly identical to Rpl27Ap and has similarity to rat L27 ribosomal protein |
|
| YDR091C | 3.54 |
RLI1
|
Essential iron-sulfur protein required for ribosome biogenesis and translation initiation; facilitates binding of a multifactor complex (MFC) of translation initiation factors to the small ribosomal subunit; predicted ABC family ATPase |
|
| YPL112C | 3.51 |
PEX25
|
Peripheral peroxisomal membrane peroxin required for the regulation of peroxisome size and maintenance, recruits GTPase Rho1p to peroxisomes, induced by oleate, interacts with homologous protein Pex27p |
|
| YGR251W | 3.51 |
Putative protein of unknown function; deletion mutant has defects in pre-rRNA processing; green fluorescent protein (GFP)-fusion protein localizes to both the nucleus and the nucleolus; YGR251W is an essential gene |
||
| YPL220W | 3.48 |
RPL1A
|
N-terminally acetylated protein component of the large (60S) ribosomal subunit, nearly identical to Rpl1Bp and has similarity to E. coli L1 and rat L10a ribosomal proteins; rpl1a rpl1b double null mutation is lethal |
|
| YKL219W | 3.48 |
COS9
|
Protein of unknown function, member of the DUP380 subfamily of conserved, often subtelomerically-encoded proteins |
|
| YGL148W | 3.46 |
ARO2
|
Bifunctional chorismate synthase and flavin reductase, catalyzes the conversion of 5-enolpyruvylshikimate 3-phosphate (EPSP) to form chorismate, which is a precursor to aromatic amino acids |
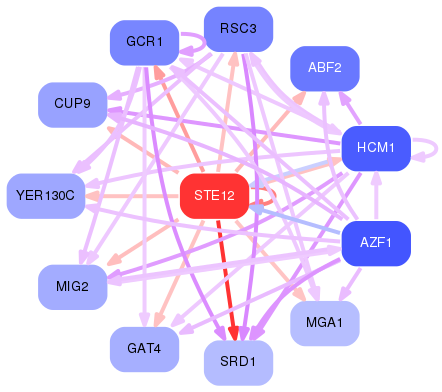
Network of associatons between targets according to the STRING database.

First level regulatory network of STE12
Gene Ontology Analysis
Gene overrepresentation in biological process category:
| Log-likelihood per target | Total log-likelihood | Term | Description |
|---|---|---|---|
| 7.3 | 21.9 | GO:0000098 | sulfur amino acid catabolic process(GO:0000098) |
| 6.9 | 48.1 | GO:0010696 | positive regulation of spindle pole body separation(GO:0010696) |
| 5.3 | 31.5 | GO:0009371 | positive regulation of transcription from RNA polymerase II promoter by pheromones(GO:0007329) positive regulation of transcription by pheromones(GO:0009371) |
| 5.2 | 36.5 | GO:0043137 | DNA replication, removal of RNA primer(GO:0043137) |
| 4.9 | 14.7 | GO:0031684 | heterotrimeric G-protein complex cycle(GO:0031684) |
| 3.8 | 11.5 | GO:0019673 | GDP-mannose biosynthetic process(GO:0009298) GDP-mannose metabolic process(GO:0019673) |
| 3.7 | 14.8 | GO:0014070 | response to organic cyclic compound(GO:0014070) response to cycloheximide(GO:0046898) |
| 3.5 | 63.7 | GO:0006407 | rRNA export from nucleus(GO:0006407) rRNA transport(GO:0051029) |
| 3.2 | 16.2 | GO:0000028 | ribosomal small subunit assembly(GO:0000028) |
| 3.2 | 22.2 | GO:0046501 | protoporphyrinogen IX biosynthetic process(GO:0006782) protoporphyrinogen IX metabolic process(GO:0046501) |
| 3.1 | 9.2 | GO:0072361 | regulation of glycolytic process by regulation of transcription from RNA polymerase II promoter(GO:0072361) regulation of glycolytic process by positive regulation of transcription from RNA polymerase II promoter(GO:0072363) |
| 2.9 | 8.6 | GO:0051439 | negative regulation of ubiquitin-protein ligase activity involved in mitotic cell cycle(GO:0051436) regulation of ubiquitin-protein ligase activity involved in mitotic cell cycle(GO:0051439) negative regulation of ubiquitin protein ligase activity(GO:1904667) |
| 2.8 | 8.3 | GO:0006798 | polyphosphate catabolic process(GO:0006798) |
| 2.7 | 13.5 | GO:0043433 | negative regulation of sequence-specific DNA binding transcription factor activity(GO:0043433) |
| 2.6 | 18.0 | GO:0030031 | cell projection organization(GO:0030030) cell projection assembly(GO:0030031) |
| 2.5 | 7.6 | GO:0046416 | D-amino acid metabolic process(GO:0046416) |
| 2.4 | 7.2 | GO:0038032 | termination of signal transduction(GO:0023021) termination of G-protein coupled receptor signaling pathway(GO:0038032) |
| 2.1 | 6.2 | GO:2000877 | regulation of oligopeptide transport by regulation of transcription from RNA polymerase II promoter(GO:0035950) negative regulation of oligopeptide transport by negative regulation of transcription from RNA polymerase II promoter(GO:0035952) regulation of dipeptide transport by regulation of transcription from RNA polymerase II promoter(GO:0035953) negative regulation of dipeptide transport by negative regulation of transcription from RNA polymerase II promoter(GO:0035955) negative regulation of oligopeptide transport(GO:2000877) negative regulation of dipeptide transport(GO:2000879) |
| 2.0 | 4.1 | GO:0007189 | adenylate cyclase-activating G-protein coupled receptor signaling pathway(GO:0007189) |
| 2.0 | 13.8 | GO:0043171 | peptide catabolic process(GO:0043171) |
| 2.0 | 21.6 | GO:0007109 | obsolete cytokinesis, completion of separation(GO:0007109) |
| 2.0 | 5.9 | GO:0009157 | deoxyribonucleoside monophosphate biosynthetic process(GO:0009157) deoxyribonucleoside monophosphate metabolic process(GO:0009162) pyrimidine deoxyribonucleoside monophosphate metabolic process(GO:0009176) pyrimidine deoxyribonucleoside monophosphate biosynthetic process(GO:0009177) |
| 1.9 | 3.8 | GO:0015909 | long-chain fatty acid transport(GO:0015909) |
| 1.9 | 7.5 | GO:0051457 | maintenance of protein location in nucleus(GO:0051457) |
| 1.9 | 26.2 | GO:0010383 | cell wall polysaccharide metabolic process(GO:0010383) |
| 1.9 | 9.3 | GO:0001676 | long-chain fatty acid metabolic process(GO:0001676) |
| 1.8 | 254.9 | GO:0002181 | cytoplasmic translation(GO:0002181) |
| 1.8 | 9.1 | GO:0042219 | cellular modified amino acid catabolic process(GO:0042219) |
| 1.8 | 8.9 | GO:0050667 | homocysteine metabolic process(GO:0050667) |
| 1.7 | 5.1 | GO:0046083 | adenine metabolic process(GO:0046083) |
| 1.7 | 5.0 | GO:0019401 | glycerol biosynthetic process(GO:0006114) alditol biosynthetic process(GO:0019401) |
| 1.6 | 8.2 | GO:0051125 | regulation of Arp2/3 complex-mediated actin nucleation(GO:0034315) regulation of actin nucleation(GO:0051125) |
| 1.6 | 9.5 | GO:0045292 | mRNA cis splicing, via spliceosome(GO:0045292) |
| 1.5 | 8.8 | GO:0043555 | regulation of translation in response to stress(GO:0043555) |
| 1.4 | 11.4 | GO:0000372 | Group I intron splicing(GO:0000372) RNA splicing, via transesterification reactions with guanosine as nucleophile(GO:0000376) |
| 1.4 | 6.9 | GO:0035434 | copper ion transmembrane transport(GO:0035434) |
| 1.3 | 5.2 | GO:0098742 | agglutination involved in conjugation with cellular fusion(GO:0000752) agglutination involved in conjugation(GO:0000771) heterophilic cell-cell adhesion via plasma membrane cell adhesion molecules(GO:0007157) cell-cell adhesion(GO:0098609) adhesion between unicellular organisms(GO:0098610) multi organism cell adhesion(GO:0098740) cell-cell adhesion via plasma-membrane adhesion molecules(GO:0098742) |
| 1.3 | 5.1 | GO:0030497 | fatty acid elongation(GO:0030497) |
| 1.3 | 5.1 | GO:0009423 | chorismate biosynthetic process(GO:0009423) |
| 1.3 | 8.8 | GO:0006835 | dicarboxylic acid transport(GO:0006835) |
| 1.2 | 3.7 | GO:0019413 | acetate biosynthetic process(GO:0019413) |
| 1.2 | 3.6 | GO:0071825 | lipid tube assembly(GO:0060988) protein-lipid complex assembly(GO:0065005) protein-lipid complex subunit organization(GO:0071825) |
| 1.2 | 7.1 | GO:0006491 | N-glycan processing(GO:0006491) |
| 1.2 | 1.2 | GO:0046417 | chorismate metabolic process(GO:0046417) |
| 1.2 | 4.7 | GO:0002143 | tRNA wobble position uridine thiolation(GO:0002143) |
| 1.2 | 4.7 | GO:0042990 | regulation of transcription factor import into nucleus(GO:0042990) |
| 1.2 | 4.6 | GO:0009240 | isopentenyl diphosphate biosynthetic process(GO:0009240) isopentenyl diphosphate biosynthetic process, mevalonate pathway(GO:0019287) isopentenyl diphosphate metabolic process(GO:0046490) |
| 1.1 | 2.2 | GO:0008612 | peptidyl-lysine modification to peptidyl-hypusine(GO:0008612) |
| 1.1 | 6.6 | GO:0006617 | SRP-dependent cotranslational protein targeting to membrane, signal sequence recognition(GO:0006617) |
| 1.1 | 3.3 | GO:0046677 | response to antibiotic(GO:0046677) |
| 1.1 | 5.4 | GO:0006564 | L-serine biosynthetic process(GO:0006564) |
| 1.0 | 10.2 | GO:0045053 | protein retention in Golgi apparatus(GO:0045053) |
| 1.0 | 2.0 | GO:0006571 | tyrosine biosynthetic process(GO:0006571) L-phenylalanine biosynthetic process(GO:0009094) erythrose 4-phosphate/phosphoenolpyruvate family amino acid biosynthetic process(GO:1902223) |
| 1.0 | 10.1 | GO:0007021 | tubulin complex assembly(GO:0007021) |
| 1.0 | 1.0 | GO:0006282 | regulation of DNA repair(GO:0006282) |
| 1.0 | 3.0 | GO:0009186 | deoxyribonucleoside diphosphate metabolic process(GO:0009186) |
| 1.0 | 2.0 | GO:0033262 | regulation of nuclear cell cycle DNA replication(GO:0033262) |
| 1.0 | 2.9 | GO:0019379 | sulfate assimilation, phosphoadenylyl sulfate reduction by phosphoadenylyl-sulfate reductase (thioredoxin)(GO:0019379) sulfate reduction(GO:0019419) |
| 1.0 | 3.8 | GO:0007119 | budding cell isotropic bud growth(GO:0007119) |
| 0.9 | 4.7 | GO:0070525 | tRNA threonylcarbamoyladenosine metabolic process(GO:0070525) |
| 0.9 | 2.8 | GO:1900101 | regulation of endoplasmic reticulum unfolded protein response(GO:1900101) |
| 0.9 | 2.8 | GO:0031114 | negative regulation of microtubule depolymerization(GO:0007026) regulation of microtubule depolymerization(GO:0031114) |
| 0.9 | 3.7 | GO:0006361 | transcription initiation from RNA polymerase I promoter(GO:0006361) |
| 0.9 | 2.7 | GO:0006529 | asparagine biosynthetic process(GO:0006529) |
| 0.9 | 2.6 | GO:0090220 | meiotic telomere clustering(GO:0045141) establishment of chromosome localization(GO:0051303) chromosome localization to nuclear envelope involved in homologous chromosome segregation(GO:0090220) |
| 0.9 | 4.3 | GO:1901985 | positive regulation of histone acetylation(GO:0035066) positive regulation of protein acetylation(GO:1901985) positive regulation of peptidyl-lysine acetylation(GO:2000758) |
| 0.9 | 2.6 | GO:0045901 | positive regulation of translational elongation(GO:0045901) |
| 0.8 | 2.5 | GO:0099515 | actin filament-based movement(GO:0030048) actin filament-based transport(GO:0099515) |
| 0.8 | 17.5 | GO:0002097 | tRNA wobble base modification(GO:0002097) tRNA wobble uridine modification(GO:0002098) |
| 0.8 | 1.6 | GO:0031571 | mitotic G1 DNA damage checkpoint(GO:0031571) mitotic G1/S transition checkpoint(GO:0044819) |
| 0.8 | 4.8 | GO:0009088 | threonine biosynthetic process(GO:0009088) |
| 0.8 | 7.7 | GO:0046015 | regulation of transcription by glucose(GO:0046015) |
| 0.8 | 3.0 | GO:0015867 | ATP transport(GO:0015867) |
| 0.7 | 9.0 | GO:0007120 | axial cellular bud site selection(GO:0007120) |
| 0.7 | 5.1 | GO:0006551 | leucine metabolic process(GO:0006551) leucine biosynthetic process(GO:0009098) |
| 0.7 | 10.7 | GO:0001100 | negative regulation of exit from mitosis(GO:0001100) |
| 0.7 | 12.6 | GO:0032508 | DNA duplex unwinding(GO:0032508) |
| 0.7 | 3.5 | GO:0060304 | regulation of phosphatidylinositol dephosphorylation(GO:0060304) endoplasmic reticulum membrane organization(GO:0090158) |
| 0.7 | 3.4 | GO:0051351 | positive regulation of ligase activity(GO:0051351) |
| 0.7 | 2.0 | GO:0031565 | obsolete cytokinesis checkpoint(GO:0031565) |
| 0.6 | 16.9 | GO:0006885 | regulation of pH(GO:0006885) |
| 0.6 | 2.6 | GO:0015883 | FAD transport(GO:0015883) |
| 0.6 | 1.9 | GO:1903530 | regulation of exocytosis(GO:0017157) regulation of secretion(GO:0051046) regulation of secretion by cell(GO:1903530) |
| 0.6 | 2.6 | GO:0034473 | U1 snRNA 3'-end processing(GO:0034473) |
| 0.6 | 3.8 | GO:0043457 | regulation of cellular respiration(GO:0043457) |
| 0.6 | 2.5 | GO:0034067 | protein localization to Golgi apparatus(GO:0034067) |
| 0.6 | 5.0 | GO:0031204 | posttranslational protein targeting to membrane, translocation(GO:0031204) |
| 0.6 | 4.3 | GO:0032042 | mitochondrial DNA metabolic process(GO:0032042) |
| 0.6 | 1.8 | GO:0046495 | nicotinamide riboside metabolic process(GO:0046495) pyridine nucleoside metabolic process(GO:0070637) |
| 0.6 | 1.8 | GO:0060277 | obsolete negative regulation of transcription involved in G1 phase of mitotic cell cycle(GO:0060277) |
| 0.6 | 2.4 | GO:0006072 | glycerol-3-phosphate metabolic process(GO:0006072) |
| 0.6 | 8.4 | GO:0042790 | transcription of nuclear large rRNA transcript from RNA polymerase I promoter(GO:0042790) |
| 0.6 | 3.6 | GO:0000743 | nuclear migration involved in conjugation with cellular fusion(GO:0000743) |
| 0.6 | 2.3 | GO:0000915 | assembly of actomyosin apparatus involved in cytokinesis(GO:0000912) actomyosin contractile ring assembly(GO:0000915) actomyosin structure organization(GO:0031032) actomyosin contractile ring organization(GO:0044837) |
| 0.6 | 2.9 | GO:0046656 | folic acid metabolic process(GO:0046655) folic acid biosynthetic process(GO:0046656) |
| 0.6 | 7.0 | GO:0015833 | peptide transport(GO:0015833) |
| 0.6 | 7.0 | GO:0006415 | translational termination(GO:0006415) |
| 0.6 | 2.3 | GO:0000296 | spermine transport(GO:0000296) |
| 0.6 | 1.7 | GO:0007535 | donor selection(GO:0007535) |
| 0.6 | 13.6 | GO:0006096 | glycolytic process(GO:0006096) ATP generation from ADP(GO:0006757) |
| 0.6 | 1.7 | GO:0015809 | arginine transport(GO:0015809) |
| 0.6 | 5.6 | GO:0055069 | cellular zinc ion homeostasis(GO:0006882) zinc ion homeostasis(GO:0055069) |
| 0.5 | 4.9 | GO:0090529 | barrier septum assembly(GO:0000917) cell septum assembly(GO:0090529) |
| 0.5 | 2.2 | GO:0006370 | 7-methylguanosine mRNA capping(GO:0006370) |
| 0.5 | 2.7 | GO:0042274 | ribosomal small subunit biogenesis(GO:0042274) |
| 0.5 | 3.7 | GO:0016559 | peroxisome fission(GO:0016559) |
| 0.5 | 2.6 | GO:0043007 | maintenance of rDNA(GO:0043007) |
| 0.5 | 14.5 | GO:0000472 | endonucleolytic cleavage to generate mature 5'-end of SSU-rRNA from (SSU-rRNA, 5.8S rRNA, LSU-rRNA)(GO:0000472) |
| 0.5 | 2.6 | GO:0051090 | regulation of sequence-specific DNA binding transcription factor activity(GO:0051090) |
| 0.5 | 2.1 | GO:0009636 | response to toxic substance(GO:0009636) |
| 0.5 | 1.5 | GO:0019255 | glucose 1-phosphate metabolic process(GO:0019255) |
| 0.5 | 14.3 | GO:0098876 | Golgi to plasma membrane transport(GO:0006893) vesicle-mediated transport to the plasma membrane(GO:0098876) |
| 0.5 | 1.0 | GO:0000916 | actomyosin contractile ring contraction(GO:0000916) contractile ring contraction(GO:0036213) |
| 0.5 | 3.9 | GO:0000056 | ribosomal small subunit export from nucleus(GO:0000056) |
| 0.5 | 3.0 | GO:0044038 | cell wall macromolecule biosynthetic process(GO:0044038) cellular component macromolecule biosynthetic process(GO:0070589) |
| 0.5 | 2.4 | GO:0015677 | copper ion import(GO:0015677) |
| 0.5 | 3.8 | GO:0006801 | superoxide metabolic process(GO:0006801) |
| 0.5 | 2.4 | GO:0000390 | spliceosomal complex disassembly(GO:0000390) |
| 0.5 | 3.8 | GO:0006384 | transcription initiation from RNA polymerase III promoter(GO:0006384) |
| 0.5 | 17.1 | GO:0043547 | positive regulation of GTPase activity(GO:0043547) |
| 0.5 | 1.4 | GO:0000101 | sulfur amino acid transport(GO:0000101) |
| 0.5 | 2.8 | GO:0051598 | meiotic cell cycle checkpoint(GO:0033313) meiotic recombination checkpoint(GO:0051598) |
| 0.5 | 1.4 | GO:0006021 | inositol biosynthetic process(GO:0006021) |
| 0.5 | 1.4 | GO:0042710 | biofilm formation(GO:0042710) |
| 0.5 | 2.3 | GO:0009073 | tryptophan biosynthetic process(GO:0000162) aromatic amino acid family biosynthetic process(GO:0009073) indole-containing compound biosynthetic process(GO:0042435) indolalkylamine biosynthetic process(GO:0046219) |
| 0.5 | 1.8 | GO:0002943 | tRNA dihydrouridine synthesis(GO:0002943) |
| 0.5 | 1.4 | GO:0043409 | negative regulation of MAPK cascade(GO:0043409) |
| 0.4 | 2.7 | GO:0006797 | polyphosphate metabolic process(GO:0006797) |
| 0.4 | 0.4 | GO:0071902 | positive regulation of protein serine/threonine kinase activity(GO:0071902) |
| 0.4 | 3.5 | GO:0034501 | protein localization to kinetochore(GO:0034501) |
| 0.4 | 13.6 | GO:0000462 | maturation of SSU-rRNA from tricistronic rRNA transcript (SSU-rRNA, 5.8S rRNA, LSU-rRNA)(GO:0000462) |
| 0.4 | 4.4 | GO:0031110 | regulation of microtubule polymerization or depolymerization(GO:0031110) |
| 0.4 | 3.4 | GO:0000321 | re-entry into mitotic cell cycle after pheromone arrest(GO:0000321) |
| 0.4 | 1.3 | GO:0035023 | regulation of Rho protein signal transduction(GO:0035023) |
| 0.4 | 1.7 | GO:0060628 | regulation of ER to Golgi vesicle-mediated transport(GO:0060628) |
| 0.4 | 1.6 | GO:0017182 | peptidyl-diphthamide metabolic process(GO:0017182) peptidyl-diphthamide biosynthetic process from peptidyl-histidine(GO:0017183) |
| 0.4 | 2.4 | GO:0001402 | signal transduction involved in filamentous growth(GO:0001402) |
| 0.4 | 2.8 | GO:0046513 | ceramide metabolic process(GO:0006672) ceramide biosynthetic process(GO:0046513) |
| 0.4 | 1.2 | GO:0006624 | vacuolar protein processing(GO:0006624) |
| 0.4 | 0.8 | GO:0070070 | proton-transporting V-type ATPase complex assembly(GO:0070070) vacuolar proton-transporting V-type ATPase complex assembly(GO:0070072) |
| 0.4 | 4.8 | GO:0006283 | transcription-coupled nucleotide-excision repair(GO:0006283) |
| 0.4 | 10.7 | GO:0006487 | protein N-linked glycosylation(GO:0006487) |
| 0.4 | 1.1 | GO:0045862 | positive regulation of proteolysis(GO:0045862) |
| 0.4 | 46.1 | GO:0006364 | rRNA processing(GO:0006364) |
| 0.4 | 0.4 | GO:0036260 | 7-methylguanosine RNA capping(GO:0009452) RNA capping(GO:0036260) |
| 0.4 | 1.8 | GO:0045860 | positive regulation of protein kinase activity(GO:0045860) |
| 0.4 | 5.6 | GO:0030488 | tRNA methylation(GO:0030488) |
| 0.4 | 2.5 | GO:0045996 | negative regulation of transcription by pheromones(GO:0045996) negative regulation of transcription from RNA polymerase II promoter by pheromones(GO:0046020) |
| 0.3 | 1.7 | GO:0006177 | GMP biosynthetic process(GO:0006177) |
| 0.3 | 0.7 | GO:0016578 | histone deubiquitination(GO:0016578) |
| 0.3 | 2.4 | GO:0034063 | stress granule assembly(GO:0034063) |
| 0.3 | 1.4 | GO:0070940 | dephosphorylation of RNA polymerase II C-terminal domain(GO:0070940) |
| 0.3 | 0.3 | GO:0031120 | snRNA pseudouridine synthesis(GO:0031120) snRNA modification(GO:0040031) |
| 0.3 | 1.4 | GO:0006596 | polyamine biosynthetic process(GO:0006596) |
| 0.3 | 8.0 | GO:0016129 | ergosterol biosynthetic process(GO:0006696) phytosteroid biosynthetic process(GO:0016129) cellular alcohol biosynthetic process(GO:0044108) cellular lipid biosynthetic process(GO:0097384) |
| 0.3 | 0.3 | GO:0048194 | Golgi vesicle budding(GO:0048194) |
| 0.3 | 2.9 | GO:0046685 | response to arsenic-containing substance(GO:0046685) |
| 0.3 | 1.9 | GO:0000921 | septin ring assembly(GO:0000921) |
| 0.3 | 1.3 | GO:0034314 | Arp2/3 complex-mediated actin nucleation(GO:0034314) |
| 0.3 | 1.3 | GO:0015939 | pantothenate metabolic process(GO:0015939) pantothenate biosynthetic process(GO:0015940) |
| 0.3 | 4.1 | GO:0031146 | SCF-dependent proteasomal ubiquitin-dependent protein catabolic process(GO:0031146) |
| 0.3 | 19.0 | GO:0016311 | dephosphorylation(GO:0016311) |
| 0.3 | 0.6 | GO:0097577 | intracellular sequestering of iron ion(GO:0006880) sequestering of metal ion(GO:0051238) sequestering of iron ion(GO:0097577) |
| 0.3 | 2.1 | GO:0007323 | peptide pheromone maturation(GO:0007323) |
| 0.3 | 1.5 | GO:0046391 | 5-phosphoribose 1-diphosphate biosynthetic process(GO:0006015) 5-phosphoribose 1-diphosphate metabolic process(GO:0046391) |
| 0.3 | 1.8 | GO:0042991 | transcription factor import into nucleus(GO:0042991) |
| 0.3 | 3.8 | GO:0031163 | iron-sulfur cluster assembly(GO:0016226) metallo-sulfur cluster assembly(GO:0031163) |
| 0.3 | 0.9 | GO:0046901 | tetrahydrofolylpolyglutamate metabolic process(GO:0046900) tetrahydrofolylpolyglutamate biosynthetic process(GO:0046901) |
| 0.3 | 4.1 | GO:0006446 | regulation of translational initiation(GO:0006446) |
| 0.3 | 3.1 | GO:0051666 | actin cortical patch localization(GO:0051666) |
| 0.3 | 1.1 | GO:0009099 | valine biosynthetic process(GO:0009099) |
| 0.3 | 2.5 | GO:0070481 | nuclear-transcribed mRNA catabolic process, non-stop decay(GO:0070481) |
| 0.3 | 3.8 | GO:0010499 | proteasomal ubiquitin-independent protein catabolic process(GO:0010499) |
| 0.3 | 2.7 | GO:0006273 | lagging strand elongation(GO:0006273) |
| 0.3 | 0.8 | GO:0071041 | antisense RNA transcript catabolic process(GO:0071041) |
| 0.3 | 1.0 | GO:0043242 | negative regulation of protein complex disassembly(GO:0043242) |
| 0.3 | 0.3 | GO:0035337 | fatty-acyl-CoA metabolic process(GO:0035337) |
| 0.2 | 0.7 | GO:0006517 | protein deglycosylation(GO:0006517) |
| 0.2 | 0.9 | GO:0042538 | hyperosmotic salinity response(GO:0042538) |
| 0.2 | 7.1 | GO:0090174 | organelle membrane fusion(GO:0090174) |
| 0.2 | 3.4 | GO:0000055 | ribosomal large subunit export from nucleus(GO:0000055) |
| 0.2 | 4.5 | GO:0006334 | nucleosome assembly(GO:0006334) |
| 0.2 | 0.4 | GO:0045128 | negative regulation of reciprocal meiotic recombination(GO:0045128) |
| 0.2 | 0.4 | GO:0031292 | gene conversion at mating-type locus, DNA double-strand break processing(GO:0031292) |
| 0.2 | 2.2 | GO:0006448 | regulation of translational elongation(GO:0006448) |
| 0.2 | 3.3 | GO:0006890 | retrograde vesicle-mediated transport, Golgi to ER(GO:0006890) |
| 0.2 | 2.1 | GO:0006526 | arginine biosynthetic process(GO:0006526) |
| 0.2 | 0.8 | GO:0060188 | regulation of protein desumoylation(GO:0060188) |
| 0.2 | 0.9 | GO:0071265 | L-methionine biosynthetic process from methylthioadenosine(GO:0019509) amino acid salvage(GO:0043102) L-methionine biosynthetic process(GO:0071265) L-methionine salvage(GO:0071267) |
| 0.2 | 0.5 | GO:0032781 | positive regulation of ATPase activity(GO:0032781) |
| 0.2 | 0.4 | GO:0032011 | ARF protein signal transduction(GO:0032011) regulation of ARF protein signal transduction(GO:0032012) |
| 0.2 | 0.2 | GO:0009202 | deoxyribonucleoside triphosphate biosynthetic process(GO:0009202) |
| 0.2 | 0.2 | GO:0034729 | histone H3-K79 methylation(GO:0034729) |
| 0.2 | 0.5 | GO:0043489 | RNA stabilization(GO:0043489) mRNA stabilization(GO:0048255) |
| 0.2 | 3.2 | GO:0006633 | fatty acid biosynthetic process(GO:0006633) |
| 0.2 | 1.3 | GO:0008298 | intracellular mRNA localization(GO:0008298) |
| 0.2 | 1.1 | GO:0000350 | generation of catalytic spliceosome for second transesterification step(GO:0000350) |
| 0.2 | 0.8 | GO:0000733 | DNA strand renaturation(GO:0000733) |
| 0.2 | 1.1 | GO:0009306 | protein secretion(GO:0009306) |
| 0.2 | 1.3 | GO:0030705 | establishment of localization by movement along microtubule(GO:0010970) nuclear migration along microtubule(GO:0030473) cytoskeleton-dependent intracellular transport(GO:0030705) organelle transport along microtubule(GO:0072384) |
| 0.2 | 2.4 | GO:0046785 | microtubule nucleation(GO:0007020) microtubule polymerization(GO:0046785) |
| 0.2 | 0.6 | GO:0019358 | nicotinate nucleotide biosynthetic process(GO:0019357) nicotinate nucleotide salvage(GO:0019358) pyridine nucleotide salvage(GO:0019365) nicotinate nucleotide metabolic process(GO:0046497) |
| 0.2 | 0.5 | GO:0000949 | aromatic amino acid family catabolic process to alcohol via Ehrlich pathway(GO:0000949) |
| 0.2 | 4.1 | GO:0042254 | ribosome biogenesis(GO:0042254) |
| 0.2 | 10.3 | GO:0051169 | nucleocytoplasmic transport(GO:0006913) nuclear transport(GO:0051169) |
| 0.1 | 1.6 | GO:0006414 | translational elongation(GO:0006414) |
| 0.1 | 3.6 | GO:0006413 | translational initiation(GO:0006413) |
| 0.1 | 0.9 | GO:0000947 | amino acid catabolic process to alcohol via Ehrlich pathway(GO:0000947) |
| 0.1 | 0.9 | GO:0030026 | cellular manganese ion homeostasis(GO:0030026) manganese ion homeostasis(GO:0055071) |
| 0.1 | 0.5 | GO:0018342 | protein prenylation(GO:0018342) prenylation(GO:0097354) |
| 0.1 | 0.4 | GO:0010978 | gene silencing involved in chronological cell aging(GO:0010978) gene silencing by RNA(GO:0031047) |
| 0.1 | 1.3 | GO:0006743 | ubiquinone metabolic process(GO:0006743) ubiquinone biosynthetic process(GO:0006744) ketone biosynthetic process(GO:0042181) quinone metabolic process(GO:1901661) quinone biosynthetic process(GO:1901663) |
| 0.1 | 0.9 | GO:0000349 | generation of catalytic spliceosome for first transesterification step(GO:0000349) |
| 0.1 | 0.4 | GO:0034389 | lipid particle organization(GO:0034389) |
| 0.1 | 3.4 | GO:0006418 | tRNA aminoacylation for protein translation(GO:0006418) |
| 0.1 | 2.3 | GO:0000183 | chromatin silencing at rDNA(GO:0000183) |
| 0.1 | 0.2 | GO:0016926 | protein desumoylation(GO:0016926) |
| 0.1 | 0.6 | GO:0016479 | negative regulation of transcription from RNA polymerase I promoter(GO:0016479) |
| 0.1 | 0.7 | GO:0070096 | mitochondrial outer membrane translocase complex assembly(GO:0070096) |
| 0.1 | 0.6 | GO:0048017 | inositol lipid-mediated signaling(GO:0048017) |
| 0.1 | 1.0 | GO:0000083 | regulation of transcription involved in G1/S transition of mitotic cell cycle(GO:0000083) |
| 0.1 | 0.2 | GO:0009249 | protein lipoylation(GO:0009249) |
| 0.1 | 1.4 | GO:0006891 | intra-Golgi vesicle-mediated transport(GO:0006891) |
| 0.1 | 1.2 | GO:0006337 | nucleosome disassembly(GO:0006337) chromatin disassembly(GO:0031498) protein-DNA complex disassembly(GO:0032986) |
| 0.1 | 0.3 | GO:0030847 | termination of RNA polymerase II transcription, exosome-dependent(GO:0030847) |
| 0.1 | 0.8 | GO:0019856 | pyrimidine nucleobase biosynthetic process(GO:0019856) |
| 0.1 | 0.4 | GO:0009164 | nucleoside catabolic process(GO:0009164) glycosyl compound catabolic process(GO:1901658) |
| 0.1 | 0.3 | GO:0030837 | negative regulation of actin filament polymerization(GO:0030837) negative regulation of protein polymerization(GO:0032272) |
| 0.1 | 0.4 | GO:0051668 | localization within membrane(GO:0051668) |
| 0.1 | 0.3 | GO:0046473 | phosphatidic acid biosynthetic process(GO:0006654) phosphatidic acid metabolic process(GO:0046473) |
| 0.1 | 0.8 | GO:0000105 | histidine biosynthetic process(GO:0000105) histidine metabolic process(GO:0006547) imidazole-containing compound metabolic process(GO:0052803) |
| 0.1 | 1.3 | GO:0009304 | tRNA transcription(GO:0009304) tRNA transcription from RNA polymerase III promoter(GO:0042797) |
| 0.1 | 0.2 | GO:0035269 | protein mannosylation(GO:0035268) protein O-linked mannosylation(GO:0035269) mannosylation(GO:0097502) |
| 0.1 | 0.6 | GO:0051050 | positive regulation of transport(GO:0051050) |
| 0.1 | 0.3 | GO:0016574 | histone ubiquitination(GO:0016574) |
| 0.1 | 0.3 | GO:0070588 | calcium ion transmembrane transport(GO:0070588) |
| 0.1 | 1.7 | GO:0045454 | cell redox homeostasis(GO:0045454) |
| 0.1 | 1.2 | GO:0015918 | sterol transport(GO:0015918) |
| 0.1 | 0.1 | GO:0051664 | nuclear pore distribution(GO:0031081) nuclear pore localization(GO:0051664) |
| 0.1 | 0.3 | GO:0031087 | deadenylation-independent decapping of nuclear-transcribed mRNA(GO:0031087) |
| 0.1 | 0.4 | GO:0048478 | replication fork protection(GO:0048478) |
| 0.1 | 0.2 | GO:0036010 | protein localization to endosome(GO:0036010) |
| 0.1 | 0.2 | GO:0034497 | protein localization to pre-autophagosomal structure(GO:0034497) |
| 0.1 | 0.6 | GO:0031365 | N-terminal protein amino acid modification(GO:0031365) |
| 0.1 | 0.5 | GO:0036388 | pre-replicative complex assembly involved in nuclear cell cycle DNA replication(GO:0006267) pre-replicative complex assembly(GO:0036388) pre-replicative complex assembly involved in cell cycle DNA replication(GO:1902299) |
| 0.1 | 0.3 | GO:0006488 | dolichol-linked oligosaccharide biosynthetic process(GO:0006488) |
| 0.1 | 0.5 | GO:0006887 | exocytosis(GO:0006887) |
| 0.1 | 0.3 | GO:0006284 | base-excision repair(GO:0006284) |
| 0.1 | 0.3 | GO:0070086 | ubiquitin-dependent endocytosis(GO:0070086) |
| 0.1 | 0.4 | GO:0006189 | 'de novo' IMP biosynthetic process(GO:0006189) |
| 0.1 | 0.5 | GO:0043094 | cellular metabolic compound salvage(GO:0043094) |
| 0.0 | 1.7 | GO:0006888 | ER to Golgi vesicle-mediated transport(GO:0006888) |
| 0.0 | 0.2 | GO:0070868 | heterochromatin organization involved in chromatin silencing(GO:0070868) chromatin organization involved in negative regulation of transcription(GO:0097549) |
| 0.0 | 0.2 | GO:0070058 | tRNA gene clustering(GO:0070058) |
| 0.0 | 0.3 | GO:0006895 | Golgi to endosome transport(GO:0006895) |
| 0.0 | 0.7 | GO:0006400 | tRNA modification(GO:0006400) |
| 0.0 | 0.2 | GO:0034661 | ncRNA catabolic process(GO:0034661) |
| 0.0 | 0.3 | GO:0045039 | protein import into mitochondrial inner membrane(GO:0045039) |
| 0.0 | 0.2 | GO:0072503 | cellular divalent inorganic cation homeostasis(GO:0072503) divalent inorganic cation homeostasis(GO:0072507) |
| 0.0 | 0.2 | GO:0042138 | meiotic DNA double-strand break formation(GO:0042138) |
| 0.0 | 0.5 | GO:0007015 | actin filament organization(GO:0007015) |
| 0.0 | 0.1 | GO:0006369 | termination of RNA polymerase II transcription(GO:0006369) |
| 0.0 | 0.1 | GO:0031335 | regulation of sulfur amino acid metabolic process(GO:0031335) |
| 0.0 | 0.2 | GO:0000245 | spliceosomal complex assembly(GO:0000245) |
| 0.0 | 0.0 | GO:0051785 | positive regulation of meiotic nuclear division(GO:0045836) positive regulation of meiotic cell cycle(GO:0051446) positive regulation of nuclear division(GO:0051785) |
| 0.0 | 0.1 | GO:0010526 | negative regulation of transposition, RNA-mediated(GO:0010526) negative regulation of transposition(GO:0010529) |
| 0.0 | 0.3 | GO:0006896 | Golgi to vacuole transport(GO:0006896) |
| 0.0 | 0.0 | GO:0000715 | nucleotide-excision repair, DNA damage recognition(GO:0000715) |
| 0.0 | 0.0 | GO:0009847 | spore germination(GO:0009847) |
| 0.0 | 0.1 | GO:0030007 | cellular potassium ion homeostasis(GO:0030007) potassium ion homeostasis(GO:0055075) |
Gene overrepresentation in cellular component category:
| Log-likelihood per target | Total log-likelihood | Term | Description |
|---|---|---|---|
| 11.2 | 33.6 | GO:0032299 | ribonuclease H2 complex(GO:0032299) |
| 3.8 | 11.4 | GO:0030428 | cell septum(GO:0030428) |
| 3.7 | 14.7 | GO:0005834 | heterotrimeric G-protein complex(GO:0005834) |
| 3.7 | 29.3 | GO:0042597 | periplasmic space(GO:0042597) |
| 2.2 | 183.5 | GO:0022625 | cytosolic large ribosomal subunit(GO:0022625) |
| 2.1 | 128.3 | GO:0022627 | cytosolic small ribosomal subunit(GO:0022627) |
| 1.7 | 3.4 | GO:0044453 | nuclear membrane part(GO:0044453) |
| 1.6 | 4.7 | GO:0000229 | cytoplasmic chromosome(GO:0000229) mitochondrial chromosome(GO:0000262) |
| 1.5 | 24.8 | GO:0000307 | cyclin-dependent protein kinase holoenzyme complex(GO:0000307) |
| 1.4 | 7.2 | GO:0000408 | EKC/KEOPS complex(GO:0000408) |
| 1.4 | 4.2 | GO:0045298 | polar microtubule(GO:0005827) tubulin complex(GO:0045298) |
| 1.4 | 4.1 | GO:0070545 | PeBoW complex(GO:0070545) |
| 1.4 | 4.1 | GO:0000814 | ESCRT II complex(GO:0000814) |
| 1.3 | 12.1 | GO:0000144 | cellular bud neck septin ring(GO:0000144) |
| 1.3 | 3.9 | GO:0071261 | Ssh1 translocon complex(GO:0071261) |
| 1.2 | 5.0 | GO:0031205 | endoplasmic reticulum Sec complex(GO:0031205) Sec62/Sec63 complex(GO:0031207) |
| 1.2 | 3.6 | GO:0097344 | Rix1 complex(GO:0097344) |
| 1.2 | 8.3 | GO:0016272 | prefoldin complex(GO:0016272) |
| 1.1 | 6.6 | GO:0005786 | signal recognition particle, endoplasmic reticulum targeting(GO:0005786) signal recognition particle(GO:0048500) |
| 1.1 | 11.8 | GO:0000243 | commitment complex(GO:0000243) |
| 1.0 | 8.4 | GO:0051233 | spindle midzone(GO:0051233) |
| 1.0 | 3.1 | GO:0017102 | methionyl glutamyl tRNA synthetase complex(GO:0017102) |
| 1.0 | 6.0 | GO:0032040 | small-subunit processome(GO:0032040) |
| 1.0 | 3.9 | GO:0070860 | RNA polymerase I core factor complex(GO:0070860) |
| 1.0 | 5.9 | GO:0042555 | MCM complex(GO:0042555) |
| 1.0 | 6.7 | GO:0005697 | telomerase holoenzyme complex(GO:0005697) |
| 0.9 | 6.6 | GO:0032432 | actin filament bundle(GO:0032432) |
| 0.9 | 3.7 | GO:0017053 | transcriptional repressor complex(GO:0017053) |
| 0.9 | 20.6 | GO:0030173 | integral component of Golgi membrane(GO:0030173) intrinsic component of Golgi membrane(GO:0031228) |
| 0.8 | 9.3 | GO:0005637 | nuclear inner membrane(GO:0005637) |
| 0.8 | 2.4 | GO:0009331 | glycerol-3-phosphate dehydrogenase complex(GO:0009331) |
| 0.8 | 5.4 | GO:0000221 | vacuolar proton-transporting V-type ATPase, V1 domain(GO:0000221) proton-transporting V-type ATPase, V1 domain(GO:0033180) |
| 0.8 | 3.8 | GO:0032545 | CURI complex(GO:0032545) |
| 0.7 | 3.0 | GO:0031428 | box C/D snoRNP complex(GO:0031428) |
| 0.7 | 2.9 | GO:0044426 | cell wall part(GO:0044426) external encapsulating structure part(GO:0044462) |
| 0.7 | 11.5 | GO:0022626 | cytosolic ribosome(GO:0022626) |
| 0.7 | 2.1 | GO:0042719 | mitochondrial intermembrane space protein transporter complex(GO:0042719) |
| 0.7 | 4.3 | GO:0005871 | kinesin complex(GO:0005871) |
| 0.6 | 9.1 | GO:0005736 | DNA-directed RNA polymerase I complex(GO:0005736) |
| 0.6 | 3.2 | GO:0005851 | eukaryotic translation initiation factor 2B complex(GO:0005851) |
| 0.6 | 1.9 | GO:0043625 | delta DNA polymerase complex(GO:0043625) |
| 0.6 | 4.3 | GO:0000346 | transcription export complex(GO:0000346) |
| 0.6 | 0.6 | GO:0005880 | nuclear microtubule(GO:0005880) |
| 0.6 | 13.2 | GO:0005887 | integral component of plasma membrane(GO:0005887) |
| 0.6 | 8.0 | GO:0000176 | nuclear exosome (RNase complex)(GO:0000176) |
| 0.5 | 28.9 | GO:0030686 | 90S preribosome(GO:0030686) |
| 0.5 | 2.1 | GO:0033551 | monopolin complex(GO:0033551) |
| 0.5 | 1.6 | GO:0030687 | preribosome, large subunit precursor(GO:0030687) |
| 0.5 | 0.5 | GO:0030689 | Noc complex(GO:0030689) |
| 0.5 | 1.5 | GO:0005850 | eukaryotic translation initiation factor 2 complex(GO:0005850) |
| 0.5 | 1.5 | GO:0030869 | RENT complex(GO:0030869) |
| 0.5 | 26.3 | GO:0000131 | incipient cellular bud site(GO:0000131) |
| 0.5 | 7.0 | GO:0000786 | nucleosome(GO:0000786) |
| 0.5 | 1.9 | GO:0005952 | cAMP-dependent protein kinase complex(GO:0005952) |
| 0.5 | 1.0 | GO:0033309 | SBF transcription complex(GO:0033309) |
| 0.5 | 1.0 | GO:0016363 | nuclear matrix(GO:0016363) |
| 0.5 | 63.2 | GO:0005933 | cellular bud(GO:0005933) |
| 0.5 | 0.5 | GO:0071819 | DUBm complex(GO:0071819) |
| 0.5 | 1.4 | GO:0005823 | central plaque of spindle pole body(GO:0005823) |
| 0.5 | 1.4 | GO:0000015 | phosphopyruvate hydratase complex(GO:0000015) |
| 0.4 | 2.2 | GO:0005641 | nuclear envelope lumen(GO:0005641) |
| 0.4 | 6.5 | GO:0005576 | extracellular region(GO:0005576) |
| 0.4 | 2.8 | GO:0019774 | proteasome core complex, beta-subunit complex(GO:0019774) |
| 0.4 | 0.8 | GO:1990316 | ATG1/ULK1 kinase complex(GO:1990316) |
| 0.4 | 0.8 | GO:0000159 | protein phosphatase type 2A complex(GO:0000159) |
| 0.4 | 2.6 | GO:0030126 | COPI vesicle coat(GO:0030126) |
| 0.4 | 3.8 | GO:0005666 | DNA-directed RNA polymerase III complex(GO:0005666) |
| 0.4 | 1.8 | GO:0016281 | eukaryotic translation initiation factor 4F complex(GO:0016281) |
| 0.4 | 1.4 | GO:0030907 | MBF transcription complex(GO:0030907) |
| 0.4 | 2.1 | GO:0072686 | mitotic spindle(GO:0072686) |
| 0.3 | 1.7 | GO:0005853 | eukaryotic translation elongation factor 1 complex(GO:0005853) |
| 0.3 | 1.0 | GO:0005793 | endoplasmic reticulum-Golgi intermediate compartment(GO:0005793) |
| 0.3 | 4.0 | GO:0031907 | peroxisomal matrix(GO:0005782) microbody lumen(GO:0031907) |
| 0.3 | 0.7 | GO:0097038 | perinuclear endoplasmic reticulum(GO:0097038) |
| 0.3 | 1.0 | GO:0070985 | TFIIK complex(GO:0070985) |
| 0.3 | 1.3 | GO:0030892 | mitotic cohesin complex(GO:0030892) nuclear mitotic cohesin complex(GO:0034990) |
| 0.3 | 4.1 | GO:0019005 | SCF ubiquitin ligase complex(GO:0019005) |
| 0.3 | 0.3 | GO:0000145 | exocyst(GO:0000145) |
| 0.3 | 1.5 | GO:0005720 | nuclear heterochromatin(GO:0005720) nuclear telomeric heterochromatin(GO:0005724) telomeric heterochromatin(GO:0031933) |
| 0.3 | 0.9 | GO:0070939 | Dsl1p complex(GO:0070939) |
| 0.3 | 2.3 | GO:0008250 | oligosaccharyltransferase complex(GO:0008250) |
| 0.3 | 1.7 | GO:0005852 | eukaryotic translation initiation factor 3 complex(GO:0005852) |
| 0.3 | 0.9 | GO:0005797 | Golgi medial cisterna(GO:0005797) |
| 0.3 | 2.0 | GO:0008540 | proteasome regulatory particle, base subcomplex(GO:0008540) |
| 0.3 | 1.4 | GO:0071008 | U2-type post-mRNA release spliceosomal complex(GO:0071008) |
| 0.3 | 1.1 | GO:0030867 | rough endoplasmic reticulum(GO:0005791) rough endoplasmic reticulum membrane(GO:0030867) |
| 0.3 | 1.1 | GO:0033597 | mitotic checkpoint complex(GO:0033597) |
| 0.3 | 5.2 | GO:0031201 | SNARE complex(GO:0031201) |
| 0.3 | 1.8 | GO:0005665 | DNA-directed RNA polymerase II, core complex(GO:0005665) |
| 0.3 | 9.7 | GO:0043332 | mating projection tip(GO:0043332) |
| 0.3 | 1.0 | GO:0042406 | extrinsic component of endoplasmic reticulum membrane(GO:0042406) |
| 0.3 | 53.6 | GO:0005829 | cytosol(GO:0005829) |
| 0.3 | 1.5 | GO:0000799 | condensin complex(GO:0000796) nuclear condensin complex(GO:0000799) |
| 0.2 | 6.0 | GO:0005844 | polysome(GO:0005844) |
| 0.2 | 4.5 | GO:0016586 | RSC complex(GO:0016586) |
| 0.2 | 0.7 | GO:0022624 | proteasome regulatory particle(GO:0005838) proteasome accessory complex(GO:0022624) |
| 0.2 | 2.2 | GO:0019897 | extrinsic component of plasma membrane(GO:0019897) |
| 0.2 | 4.9 | GO:0030134 | ER to Golgi transport vesicle(GO:0030134) |
| 0.2 | 2.5 | GO:0032541 | cortical endoplasmic reticulum(GO:0032541) |
| 0.2 | 1.8 | GO:0030130 | clathrin coat of trans-Golgi network vesicle(GO:0030130) |
| 0.2 | 28.8 | GO:0005730 | nucleolus(GO:0005730) |
| 0.2 | 0.9 | GO:0001401 | mitochondrial sorting and assembly machinery complex(GO:0001401) |
| 0.2 | 13.3 | GO:0009277 | fungal-type cell wall(GO:0009277) |
| 0.2 | 0.8 | GO:0033176 | vacuolar proton-transporting V-type ATPase complex(GO:0016471) proton-transporting V-type ATPase complex(GO:0033176) |
| 0.2 | 0.6 | GO:0016587 | Isw1 complex(GO:0016587) |
| 0.2 | 1.3 | GO:0005885 | Arp2/3 protein complex(GO:0005885) |
| 0.2 | 0.5 | GO:0005968 | Rab-protein geranylgeranyltransferase complex(GO:0005968) |
| 0.2 | 0.7 | GO:0033263 | HOPS complex(GO:0030897) CORVET complex(GO:0033263) |
| 0.2 | 0.8 | GO:0043527 | tRNA methyltransferase complex(GO:0043527) |
| 0.2 | 3.4 | GO:0005840 | ribosome(GO:0005840) |
| 0.2 | 14.1 | GO:0005635 | nuclear envelope(GO:0005635) |
| 0.1 | 0.3 | GO:0000111 | nucleotide-excision repair factor 2 complex(GO:0000111) |
| 0.1 | 9.4 | GO:0015630 | microtubule cytoskeleton(GO:0015630) |
| 0.1 | 0.4 | GO:0070823 | HDA1 complex(GO:0070823) |
| 0.1 | 0.6 | GO:0034448 | EGO complex(GO:0034448) |
| 0.1 | 0.4 | GO:0034044 | exomer complex(GO:0034044) |
| 0.1 | 0.3 | GO:0035649 | Nrd1 complex(GO:0035649) |
| 0.1 | 0.9 | GO:0017119 | Golgi transport complex(GO:0017119) |
| 0.1 | 0.3 | GO:0031417 | NatC complex(GO:0031417) |
| 0.1 | 0.7 | GO:0005671 | Ada2/Gcn5/Ada3 transcription activator complex(GO:0005671) |
| 0.1 | 25.3 | GO:0005783 | endoplasmic reticulum(GO:0005783) |
| 0.1 | 0.1 | GO:0031391 | Elg1 RFC-like complex(GO:0031391) |
| 0.1 | 4.3 | GO:0000139 | Golgi membrane(GO:0000139) |
| 0.1 | 1.1 | GO:0005686 | U2 snRNP(GO:0005686) |
| 0.1 | 0.4 | GO:0055087 | Ski complex(GO:0055087) |
| 0.1 | 0.5 | GO:0033588 | Elongator holoenzyme complex(GO:0033588) |
| 0.1 | 0.2 | GO:0034518 | RNA cap binding complex(GO:0034518) |
| 0.1 | 0.7 | GO:0036452 | ESCRT complex(GO:0036452) |
| 0.1 | 0.9 | GO:0046695 | SLIK (SAGA-like) complex(GO:0046695) |
| 0.1 | 0.3 | GO:0005658 | alpha DNA polymerase:primase complex(GO:0005658) |
| 0.1 | 0.2 | GO:0005960 | glycine cleavage complex(GO:0005960) |
| 0.1 | 0.5 | GO:0005656 | nuclear pre-replicative complex(GO:0005656) pre-replicative complex(GO:0036387) |
| 0.1 | 10.3 | GO:0005759 | mitochondrial matrix(GO:0005759) |
| 0.0 | 0.7 | GO:0000784 | nuclear chromosome, telomeric region(GO:0000784) |
| 0.0 | 0.2 | GO:0008622 | epsilon DNA polymerase complex(GO:0008622) |
| 0.0 | 0.4 | GO:0000502 | proteasome complex(GO:0000502) |
| 0.0 | 0.1 | GO:0000118 | histone deacetylase complex(GO:0000118) |
| 0.0 | 0.3 | GO:0030015 | CCR4-NOT core complex(GO:0030015) |
| 0.0 | 0.6 | GO:0005657 | replication fork(GO:0005657) |
| 0.0 | 0.3 | GO:0071010 | U2-type prespliceosome(GO:0071004) prespliceosome(GO:0071010) |
| 0.0 | 0.0 | GO:0008623 | CHRAC(GO:0008623) |
| 0.0 | 0.0 | GO:0005946 | alpha,alpha-trehalose-phosphate synthase complex (UDP-forming)(GO:0005946) |
| 0.0 | 0.8 | GO:0000790 | nuclear chromatin(GO:0000790) |
Gene overrepresentation in molecular function category:
| Log-likelihood per target | Total log-likelihood | Term | Description |
|---|---|---|---|
| 8.8 | 35.1 | GO:0004523 | RNA-DNA hybrid ribonuclease activity(GO:0004523) |
| 4.8 | 19.2 | GO:0016634 | oxidoreductase activity, acting on the CH-CH group of donors, oxygen as acceptor(GO:0016634) |
| 3.9 | 19.5 | GO:0004707 | MAP kinase activity(GO:0004707) |
| 3.8 | 11.5 | GO:0070568 | guanylyltransferase activity(GO:0070568) |
| 3.6 | 21.4 | GO:0016846 | carbon-sulfur lyase activity(GO:0016846) |
| 3.1 | 9.2 | GO:0031957 | very long-chain fatty acid-CoA ligase activity(GO:0031957) |
| 2.9 | 8.6 | GO:0051219 | phosphoprotein binding(GO:0051219) |
| 2.4 | 7.2 | GO:0015088 | copper uptake transmembrane transporter activity(GO:0015088) |
| 2.3 | 11.7 | GO:0003705 | transcription factor activity, RNA polymerase II distal enhancer sequence-specific binding(GO:0003705) |
| 2.2 | 8.8 | GO:0016841 | ammonia-lyase activity(GO:0016841) |
| 2.2 | 6.6 | GO:0015166 | polyol transmembrane transporter activity(GO:0015166) |
| 2.1 | 8.5 | GO:0031683 | G-protein beta/gamma-subunit complex binding(GO:0031683) |
| 2.0 | 6.1 | GO:0004861 | cyclin-dependent protein serine/threonine kinase inhibitor activity(GO:0004861) |
| 2.0 | 7.9 | GO:0042973 | glucan endo-1,3-beta-D-glucosidase activity(GO:0042973) |
| 1.9 | 9.6 | GO:0036002 | pre-mRNA binding(GO:0036002) |
| 1.9 | 43.0 | GO:0016538 | cyclin-dependent protein serine/threonine kinase regulator activity(GO:0016538) |
| 1.9 | 5.6 | GO:0015440 | peptide-transporting ATPase activity(GO:0015440) |
| 1.8 | 7.0 | GO:0008172 | S-methyltransferase activity(GO:0008172) |
| 1.7 | 5.2 | GO:0050839 | cell adhesion molecule binding(GO:0050839) |
| 1.7 | 1.7 | GO:0015248 | sterol transporter activity(GO:0015248) |
| 1.7 | 5.1 | GO:0009922 | fatty acid elongase activity(GO:0009922) |
| 1.7 | 10.1 | GO:0003993 | acid phosphatase activity(GO:0003993) |
| 1.5 | 4.6 | GO:0004338 | glucan exo-1,3-beta-glucosidase activity(GO:0004338) |
| 1.5 | 4.4 | GO:0004365 | glyceraldehyde-3-phosphate dehydrogenase (NAD+) (phosphorylating) activity(GO:0004365) glyceraldehyde-3-phosphate dehydrogenase (NAD(P)+) (phosphorylating) activity(GO:0043891) |
| 1.5 | 304.9 | GO:0003735 | structural constituent of ribosome(GO:0003735) |
| 1.4 | 5.8 | GO:0009378 | four-way junction helicase activity(GO:0009378) |
| 1.4 | 4.2 | GO:0051010 | microtubule plus-end binding(GO:0051010) |
| 1.4 | 11.0 | GO:0070001 | aspartic-type endopeptidase activity(GO:0004190) aspartic-type peptidase activity(GO:0070001) |
| 1.3 | 4.0 | GO:0019202 | amino acid kinase activity(GO:0019202) |
| 1.3 | 6.5 | GO:0008443 | phosphofructokinase activity(GO:0008443) |
| 1.3 | 3.9 | GO:0004930 | G-protein coupled receptor activity(GO:0004930) |
| 1.2 | 3.7 | GO:0008569 | ATP-dependent microtubule motor activity, minus-end-directed(GO:0008569) |
| 1.1 | 3.4 | GO:0016838 | carbon-oxygen lyase activity, acting on phosphates(GO:0016838) |
| 1.1 | 15.5 | GO:0001671 | ATPase activator activity(GO:0001671) |
| 1.1 | 4.4 | GO:0001046 | core promoter sequence-specific DNA binding(GO:0001046) |
| 1.1 | 6.6 | GO:0008312 | 7S RNA binding(GO:0008312) |
| 1.1 | 5.5 | GO:0017048 | Rho GTPase binding(GO:0017048) |
| 1.1 | 5.5 | GO:0000033 | alpha-1,3-mannosyltransferase activity(GO:0000033) |
| 1.1 | 3.3 | GO:0004690 | cyclic nucleotide-dependent protein kinase activity(GO:0004690) cAMP-dependent protein kinase activity(GO:0004691) |
| 1.1 | 3.2 | GO:0004100 | chitin synthase activity(GO:0004100) |
| 1.1 | 5.3 | GO:0005092 | GDP-dissociation inhibitor activity(GO:0005092) |
| 1.0 | 3.1 | GO:0016504 | peptidase activator activity(GO:0016504) |
| 1.0 | 5.2 | GO:0008536 | Ran GTPase binding(GO:0008536) |
| 1.0 | 3.1 | GO:0004619 | phosphoglycerate mutase activity(GO:0004619) |
| 1.0 | 4.0 | GO:0005528 | macrolide binding(GO:0005527) FK506 binding(GO:0005528) |
| 1.0 | 3.9 | GO:0016417 | S-acyltransferase activity(GO:0016417) |
| 1.0 | 5.8 | GO:0070300 | phosphatidic acid binding(GO:0070300) |
| 1.0 | 1.9 | GO:0016774 | phosphotransferase activity, carboxyl group as acceptor(GO:0016774) |
| 1.0 | 3.8 | GO:0016863 | intramolecular oxidoreductase activity, transposing C=C bonds(GO:0016863) |
| 0.9 | 28.8 | GO:0004553 | hydrolase activity, hydrolyzing O-glycosyl compounds(GO:0004553) |
| 0.9 | 6.3 | GO:0003756 | protein disulfide isomerase activity(GO:0003756) intramolecular oxidoreductase activity, transposing S-S bonds(GO:0016864) |
| 0.9 | 3.6 | GO:0008252 | nucleotidase activity(GO:0008252) |
| 0.9 | 3.5 | GO:0050291 | sphingosine N-acyltransferase activity(GO:0050291) |
| 0.9 | 5.3 | GO:0005545 | 1-phosphatidylinositol binding(GO:0005545) |
| 0.9 | 3.5 | GO:0008242 | omega peptidase activity(GO:0008242) |
| 0.8 | 3.1 | GO:0016886 | ligase activity, forming phosphoric ester bonds(GO:0016886) |
| 0.8 | 3.1 | GO:0051377 | mannose-ethanolamine phosphotransferase activity(GO:0051377) |
| 0.8 | 5.5 | GO:0030145 | manganese ion binding(GO:0030145) |
| 0.8 | 6.1 | GO:0005496 | steroid binding(GO:0005496) sterol binding(GO:0032934) |
| 0.8 | 9.1 | GO:0005199 | structural constituent of cell wall(GO:0005199) |
| 0.7 | 3.0 | GO:0003747 | translation release factor activity(GO:0003747) translation termination factor activity(GO:0008079) |
| 0.7 | 3.6 | GO:0042123 | glucanosyltransferase activity(GO:0042123) 1,3-beta-glucanosyltransferase activity(GO:0042124) |
| 0.7 | 5.7 | GO:0031490 | chromatin DNA binding(GO:0031490) |
| 0.7 | 2.8 | GO:0004614 | phosphoglucomutase activity(GO:0004614) |
| 0.7 | 2.7 | GO:0070273 | phosphatidylinositol-4-phosphate binding(GO:0070273) |
| 0.6 | 9.1 | GO:0001054 | RNA polymerase I activity(GO:0001054) |
| 0.6 | 2.6 | GO:0015230 | FAD transmembrane transporter activity(GO:0015230) |
| 0.6 | 4.4 | GO:0016778 | diphosphotransferase activity(GO:0016778) |
| 0.6 | 13.2 | GO:0042162 | telomeric DNA binding(GO:0042162) |
| 0.6 | 5.6 | GO:0005310 | dicarboxylic acid transmembrane transporter activity(GO:0005310) |
| 0.6 | 8.0 | GO:0051015 | actin filament binding(GO:0051015) |
| 0.6 | 5.5 | GO:0000009 | alpha-1,6-mannosyltransferase activity(GO:0000009) |
| 0.6 | 17.0 | GO:0015631 | tubulin binding(GO:0015631) |
| 0.6 | 5.3 | GO:0016628 | oxidoreductase activity, acting on the CH-CH group of donors, NAD or NADP as acceptor(GO:0016628) |
| 0.6 | 2.3 | GO:0000297 | spermine transmembrane transporter activity(GO:0000297) |
| 0.6 | 2.3 | GO:0005034 | osmosensor activity(GO:0005034) |
| 0.6 | 5.5 | GO:0005216 | ion channel activity(GO:0005216) |
| 0.5 | 3.8 | GO:0080025 | phosphatidylinositol-3,5-bisphosphate binding(GO:0080025) |
| 0.5 | 3.2 | GO:0003725 | double-stranded RNA binding(GO:0003725) |
| 0.5 | 22.1 | GO:0005096 | GTPase activator activity(GO:0005096) |
| 0.5 | 3.0 | GO:0004169 | dolichyl-phosphate-mannose-protein mannosyltransferase activity(GO:0004169) |
| 0.5 | 3.5 | GO:0031386 | protein tag(GO:0031386) |
| 0.5 | 1.0 | GO:0043142 | single-stranded DNA-dependent ATPase activity(GO:0043142) |
| 0.5 | 6.3 | GO:0051537 | 2 iron, 2 sulfur cluster binding(GO:0051537) |
| 0.5 | 3.8 | GO:0016423 | tRNA (guanine) methyltransferase activity(GO:0016423) |
| 0.5 | 5.7 | GO:0042803 | protein homodimerization activity(GO:0042803) |
| 0.5 | 2.4 | GO:0080130 | L-phenylalanine aminotransferase activity(GO:0070546) L-phenylalanine:2-oxoglutarate aminotransferase activity(GO:0080130) |
| 0.5 | 1.9 | GO:0008297 | single-stranded DNA exodeoxyribonuclease activity(GO:0008297) single-stranded DNA 3'-5' exodeoxyribonuclease activity(GO:0008310) |
| 0.5 | 0.9 | GO:0016840 | carbon-nitrogen lyase activity(GO:0016840) |
| 0.5 | 1.4 | GO:0016872 | intramolecular lyase activity(GO:0016872) |
| 0.5 | 1.8 | GO:0017150 | tRNA dihydrouridine synthase activity(GO:0017150) |
| 0.5 | 1.4 | GO:0004634 | phosphopyruvate hydratase activity(GO:0004634) |
| 0.5 | 1.8 | GO:0015198 | oligopeptide transporter activity(GO:0015198) |
| 0.5 | 1.8 | GO:0008353 | RNA polymerase II carboxy-terminal domain kinase activity(GO:0008353) |
| 0.4 | 4.4 | GO:0019239 | deaminase activity(GO:0019239) |
| 0.4 | 10.2 | GO:0004520 | endodeoxyribonuclease activity(GO:0004520) |
| 0.4 | 1.3 | GO:0019003 | GDP binding(GO:0019003) |
| 0.4 | 2.5 | GO:0008138 | protein tyrosine/serine/threonine phosphatase activity(GO:0008138) |
| 0.4 | 11.6 | GO:0004722 | protein serine/threonine phosphatase activity(GO:0004722) |
| 0.4 | 3.2 | GO:1901681 | sulfur compound binding(GO:1901681) |
| 0.4 | 15.6 | GO:0005085 | guanyl-nucleotide exchange factor activity(GO:0005085) |
| 0.4 | 3.1 | GO:0016861 | intramolecular oxidoreductase activity, interconverting aldoses and ketoses(GO:0016861) |
| 0.4 | 1.1 | GO:0031370 | eukaryotic initiation factor 4G binding(GO:0031370) |
| 0.4 | 1.1 | GO:0004312 | fatty acid synthase activity(GO:0004312) |
| 0.4 | 3.8 | GO:0001056 | RNA polymerase III activity(GO:0001056) |
| 0.4 | 1.1 | GO:0005519 | cytoskeletal regulatory protein binding(GO:0005519) |
| 0.4 | 0.7 | GO:0019842 | vitamin binding(GO:0019842) |
| 0.4 | 5.2 | GO:0051087 | chaperone binding(GO:0051087) |
| 0.4 | 1.1 | GO:0097027 | ubiquitin-protein transferase activator activity(GO:0097027) |
| 0.4 | 0.7 | GO:0001082 | transcription factor activity, RNA polymerase I transcription factor binding(GO:0001082) |
| 0.3 | 10.7 | GO:0030674 | protein binding, bridging(GO:0030674) binding, bridging(GO:0060090) |
| 0.3 | 1.4 | GO:0050072 | m7G(5')pppN diphosphatase activity(GO:0050072) |
| 0.3 | 0.7 | GO:0035591 | MAP-kinase scaffold activity(GO:0005078) signaling adaptor activity(GO:0035591) |
| 0.3 | 1.6 | GO:0004679 | AMP-activated protein kinase activity(GO:0004679) |
| 0.3 | 7.9 | GO:0003779 | actin binding(GO:0003779) |
| 0.3 | 19.4 | GO:0003924 | GTPase activity(GO:0003924) |
| 0.3 | 0.9 | GO:0003841 | 1-acylglycerol-3-phosphate O-acyltransferase activity(GO:0003841) |
| 0.3 | 0.9 | GO:0003680 | AT DNA binding(GO:0003680) |
| 0.3 | 0.6 | GO:0004467 | long-chain fatty acid-CoA ligase activity(GO:0004467) |
| 0.3 | 0.9 | GO:0004326 | tetrahydrofolylpolyglutamate synthase activity(GO:0004326) |
| 0.3 | 5.5 | GO:0051536 | iron-sulfur cluster binding(GO:0051536) metal cluster binding(GO:0051540) |
| 0.3 | 2.3 | GO:0004579 | oligosaccharyl transferase activity(GO:0004576) dolichyl-diphosphooligosaccharide-protein glycotransferase activity(GO:0004579) |
| 0.3 | 0.6 | GO:0016300 | tRNA (uracil) methyltransferase activity(GO:0016300) |
| 0.3 | 0.6 | GO:0005487 | nucleocytoplasmic transporter activity(GO:0005487) |
| 0.3 | 15.1 | GO:0008565 | protein transporter activity(GO:0008565) |
| 0.3 | 1.8 | GO:0003968 | RNA-directed RNA polymerase activity(GO:0003968) |
| 0.2 | 1.7 | GO:0008092 | cytoskeletal protein binding(GO:0008092) |
| 0.2 | 1.7 | GO:0030295 | kinase activator activity(GO:0019209) protein kinase activator activity(GO:0030295) |
| 0.2 | 0.2 | GO:0031369 | translation initiation factor binding(GO:0031369) |
| 0.2 | 1.9 | GO:0005516 | calmodulin binding(GO:0005516) |
| 0.2 | 0.5 | GO:0000403 | Y-form DNA binding(GO:0000403) |
| 0.2 | 1.0 | GO:0016728 | ribonucleoside-diphosphate reductase activity, thioredoxin disulfide as acceptor(GO:0004748) oxidoreductase activity, acting on CH or CH2 groups(GO:0016725) oxidoreductase activity, acting on CH or CH2 groups, disulfide as acceptor(GO:0016728) ribonucleoside-diphosphate reductase activity(GO:0061731) |
| 0.2 | 0.7 | GO:0000339 | RNA cap binding(GO:0000339) |
| 0.2 | 2.8 | GO:0000386 | second spliceosomal transesterification activity(GO:0000386) |
| 0.2 | 0.9 | GO:0004622 | lysophospholipase activity(GO:0004622) |
| 0.2 | 2.0 | GO:0019904 | protein domain specific binding(GO:0019904) |
| 0.2 | 0.7 | GO:0098518 | polynucleotide phosphatase activity(GO:0098518) |
| 0.2 | 6.2 | GO:0004004 | ATP-dependent RNA helicase activity(GO:0004004) |
| 0.2 | 1.5 | GO:0016668 | oxidoreductase activity, acting on a sulfur group of donors, NAD(P) as acceptor(GO:0016668) |
| 0.2 | 4.5 | GO:0005484 | SNAP receptor activity(GO:0005484) |
| 0.2 | 2.8 | GO:0016831 | carboxy-lyase activity(GO:0016831) |
| 0.2 | 1.4 | GO:0019237 | centromeric DNA binding(GO:0019237) |
| 0.2 | 5.4 | GO:0043130 | ubiquitin binding(GO:0043130) |
| 0.2 | 0.6 | GO:0008144 | drug binding(GO:0008144) |
| 0.2 | 3.8 | GO:0008047 | enzyme activator activity(GO:0008047) |
| 0.2 | 1.1 | GO:0005354 | galactose transmembrane transporter activity(GO:0005354) |
| 0.2 | 5.0 | GO:0046982 | protein heterodimerization activity(GO:0046982) |
| 0.2 | 7.7 | GO:0016791 | phosphatase activity(GO:0016791) |
| 0.2 | 6.2 | GO:0016765 | transferase activity, transferring alkyl or aryl (other than methyl) groups(GO:0016765) |
| 0.2 | 3.0 | GO:0042393 | histone binding(GO:0042393) |
| 0.2 | 2.7 | GO:0015616 | DNA translocase activity(GO:0015616) |
| 0.2 | 0.5 | GO:0016717 | oxidoreductase activity, acting on paired donors, with oxidation of a pair of donors resulting in the reduction of molecular oxygen to two molecules of water(GO:0016717) |
| 0.2 | 1.0 | GO:0016709 | oxidoreductase activity, acting on paired donors, with incorporation or reduction of molecular oxygen, NAD(P)H as one donor, and incorporation of one atom of oxygen(GO:0016709) |
| 0.2 | 1.3 | GO:0008375 | acetylglucosaminyltransferase activity(GO:0008375) |
| 0.2 | 0.8 | GO:0004026 | alcohol O-acetyltransferase activity(GO:0004026) alcohol O-acyltransferase activity(GO:0034318) |
| 0.2 | 3.1 | GO:0051287 | NAD binding(GO:0051287) |
| 0.2 | 0.6 | GO:0008106 | aldo-keto reductase (NADP) activity(GO:0004033) alcohol dehydrogenase (NADP+) activity(GO:0008106) |
| 0.2 | 2.2 | GO:0016866 | intramolecular transferase activity(GO:0016866) |
| 0.2 | 0.3 | GO:0008601 | protein phosphatase type 2A regulator activity(GO:0008601) |
| 0.2 | 3.2 | GO:0003743 | translation initiation factor activity(GO:0003743) |
| 0.1 | 0.9 | GO:0004022 | alcohol dehydrogenase (NAD) activity(GO:0004022) |
| 0.1 | 5.8 | GO:0016410 | N-acyltransferase activity(GO:0016410) |
| 0.1 | 0.5 | GO:0032403 | protein complex binding(GO:0032403) |
| 0.1 | 1.1 | GO:0070566 | adenylyltransferase activity(GO:0070566) |
| 0.1 | 1.0 | GO:0016705 | oxidoreductase activity, acting on paired donors, with incorporation or reduction of molecular oxygen(GO:0016705) |
| 0.1 | 3.9 | GO:0004812 | aminoacyl-tRNA ligase activity(GO:0004812) ligase activity, forming carbon-oxygen bonds(GO:0016875) ligase activity, forming aminoacyl-tRNA and related compounds(GO:0016876) |
| 0.1 | 0.3 | GO:0016433 | rRNA (adenine) methyltransferase activity(GO:0016433) |
| 0.1 | 1.9 | GO:0030515 | snoRNA binding(GO:0030515) |
| 0.1 | 0.2 | GO:0004375 | glycine dehydrogenase (decarboxylating) activity(GO:0004375) oxidoreductase activity, acting on the CH-NH2 group of donors, disulfide as acceptor(GO:0016642) |
| 0.1 | 0.5 | GO:0015173 | aromatic amino acid transmembrane transporter activity(GO:0015173) |
| 0.1 | 1.1 | GO:0005509 | calcium ion binding(GO:0005509) |
| 0.1 | 0.4 | GO:0005384 | manganese ion transmembrane transporter activity(GO:0005384) |
| 0.1 | 0.7 | GO:0016742 | hydroxymethyl-, formyl- and related transferase activity(GO:0016742) |
| 0.1 | 1.0 | GO:0046983 | protein dimerization activity(GO:0046983) |
| 0.1 | 2.1 | GO:0000030 | mannosyltransferase activity(GO:0000030) |
| 0.1 | 4.6 | GO:0008168 | methyltransferase activity(GO:0008168) |
| 0.1 | 0.8 | GO:0032947 | protein complex scaffold(GO:0032947) |
| 0.1 | 1.2 | GO:0004003 | ATP-dependent DNA helicase activity(GO:0004003) |
| 0.1 | 0.5 | GO:0004702 | receptor signaling protein serine/threonine kinase activity(GO:0004702) |
| 0.1 | 0.9 | GO:0045182 | translation regulator activity(GO:0045182) |
| 0.1 | 0.3 | GO:0016798 | hydrolase activity, acting on glycosyl bonds(GO:0016798) |
| 0.1 | 0.4 | GO:0004551 | nucleotide diphosphatase activity(GO:0004551) |
| 0.1 | 0.2 | GO:0042134 | rRNA primary transcript binding(GO:0042134) |
| 0.1 | 1.3 | GO:0005200 | structural constituent of cytoskeleton(GO:0005200) |
| 0.1 | 0.4 | GO:0017069 | snRNA binding(GO:0017069) |
| 0.1 | 1.0 | GO:0019001 | GTP binding(GO:0005525) guanyl nucleotide binding(GO:0019001) guanyl ribonucleotide binding(GO:0032561) |
| 0.1 | 0.4 | GO:0003777 | microtubule motor activity(GO:0003777) |
| 0.1 | 2.9 | GO:0008289 | lipid binding(GO:0008289) |
| 0.1 | 0.8 | GO:0016763 | transferase activity, transferring pentosyl groups(GO:0016763) |
| 0.1 | 0.3 | GO:0000099 | sulfur amino acid transmembrane transporter activity(GO:0000099) |
| 0.0 | 0.3 | GO:0008641 | small protein activating enzyme activity(GO:0008641) |
| 0.0 | 3.1 | GO:0003682 | chromatin binding(GO:0003682) |
| 0.0 | 0.3 | GO:0016896 | exoribonuclease activity(GO:0004532) exoribonuclease activity, producing 5'-phosphomonoesters(GO:0016896) |
| 0.0 | 0.4 | GO:0004298 | threonine-type endopeptidase activity(GO:0004298) threonine-type peptidase activity(GO:0070003) |
| 0.0 | 0.3 | GO:0044389 | ubiquitin protein ligase binding(GO:0031625) ubiquitin-like protein ligase binding(GO:0044389) |
| 0.0 | 0.2 | GO:0004713 | protein tyrosine kinase activity(GO:0004713) |
| 0.0 | 1.4 | GO:0005198 | structural molecule activity(GO:0005198) |
| 0.0 | 0.3 | GO:0008599 | protein phosphatase type 1 regulator activity(GO:0008599) |
| 0.0 | 3.6 | GO:0003723 | RNA binding(GO:0003723) |
| 0.0 | 0.0 | GO:0004143 | diacylglycerol kinase activity(GO:0004143) |
| 0.0 | 0.0 | GO:0005375 | copper ion transmembrane transporter activity(GO:0005375) |
| 0.0 | 0.0 | GO:0019206 | nucleoside kinase activity(GO:0019206) |
| 0.0 | 0.3 | GO:0019899 | enzyme binding(GO:0019899) |
Gene overrepresentation in curated gene sets: canonical pathways category:
| Log-likelihood per target | Total log-likelihood | Term | Description |
|---|---|---|---|
| 1.6 | 6.3 | NABA ECM GLYCOPROTEINS | Genes encoding structural ECM glycoproteins |
| 1.3 | 5.4 | PID UPA UPAR PATHWAY | Urokinase-type plasminogen activator (uPA) and uPAR-mediated signaling |
| 1.2 | 6.1 | PID CXCR4 PATHWAY | CXCR4-mediated signaling events |
| 1.2 | 3.5 | PID HIF1 TFPATHWAY | HIF-1-alpha transcription factor network |
| 1.1 | 3.3 | SA G1 AND S PHASES | Cdk2, 4, and 6 bind cyclin D in G1, while cdk2/cyclin E promotes the G1/S transition. |
| 1.0 | 3.1 | PID P38 ALPHA BETA DOWNSTREAM PATHWAY | Signaling mediated by p38-alpha and p38-beta |
| 0.7 | 0.7 | PID INTEGRIN A4B1 PATHWAY | Alpha4 beta1 integrin signaling events |
| 0.6 | 3.1 | PID PLK1 PATHWAY | PLK1 signaling events |
| 0.3 | 1.3 | PID E2F PATHWAY | E2F transcription factor network |
| 0.3 | 0.8 | PID MYC PATHWAY | C-MYC pathway |
| 0.1 | 0.3 | PID TRKR PATHWAY | Neurotrophic factor-mediated Trk receptor signaling |
| 0.1 | 0.3 | SIG INSULIN RECEPTOR PATHWAY IN CARDIAC MYOCYTES | Genes related to the insulin receptor pathway |
| 0.0 | 0.0 | PID CASPASE PATHWAY | Caspase cascade in apoptosis |
Gene overrepresentation in curated gene sets: REACTOME pathways category:
| Log-likelihood per target | Total log-likelihood | Term | Description |
|---|---|---|---|
| 3.0 | 24.2 | REACTOME FORMATION OF THE TERNARY COMPLEX AND SUBSEQUENTLY THE 43S COMPLEX | Genes involved in Formation of the ternary complex, and subsequently, the 43S complex |
| 1.8 | 5.3 | REACTOME SIGNALING BY RHO GTPASES | Genes involved in Signaling by Rho GTPases |
| 1.5 | 24.4 | REACTOME 3 UTR MEDIATED TRANSLATIONAL REGULATION | Genes involved in 3' -UTR-mediated translational regulation |
| 1.5 | 6.1 | REACTOME GLYCOLYSIS | Genes involved in Glycolysis |
| 1.0 | 4.0 | REACTOME PEPTIDE LIGAND BINDING RECEPTORS | Genes involved in Peptide ligand-binding receptors |
| 1.0 | 3.0 | REACTOME SYNTHESIS OF SUBSTRATES IN N GLYCAN BIOSYTHESIS | Genes involved in Synthesis of substrates in N-glycan biosythesis |
| 1.0 | 3.9 | REACTOME SYNTHESIS OF PIPS AT THE GOLGI MEMBRANE | Genes involved in Synthesis of PIPs at the Golgi membrane |
| 0.8 | 5.9 | REACTOME UNWINDING OF DNA | Genes involved in Unwinding of DNA |
| 0.8 | 4.1 | REACTOME ENDOSOMAL SORTING COMPLEX REQUIRED FOR TRANSPORT ESCRT | Genes involved in Endosomal Sorting Complex Required For Transport (ESCRT) |
| 0.6 | 2.4 | REACTOME GLYCEROPHOSPHOLIPID BIOSYNTHESIS | Genes involved in Glycerophospholipid biosynthesis |
| 0.6 | 3.4 | REACTOME DNA STRAND ELONGATION | Genes involved in DNA strand elongation |
| 0.6 | 2.3 | REACTOME CIRCADIAN CLOCK | Genes involved in Circadian Clock |
| 0.6 | 1.1 | REACTOME SCF BETA TRCP MEDIATED DEGRADATION OF EMI1 | Genes involved in SCF-beta-TrCP mediated degradation of Emi1 |
| 0.4 | 0.4 | REACTOME G1 PHASE | Genes involved in G1 Phase |
| 0.4 | 0.8 | REACTOME G1 S SPECIFIC TRANSCRIPTION | Genes involved in G1/S-Specific Transcription |
| 0.4 | 0.4 | REACTOME HIV INFECTION | Genes involved in HIV Infection |
| 0.3 | 4.9 | REACTOME METABOLISM OF LIPIDS AND LIPOPROTEINS | Genes involved in Metabolism of lipids and lipoproteins |
| 0.3 | 1.6 | REACTOME MITOCHONDRIAL PROTEIN IMPORT | Genes involved in Mitochondrial Protein Import |
| 0.3 | 2.9 | REACTOME MITOTIC PROMETAPHASE | Genes involved in Mitotic Prometaphase |
| 0.3 | 1.5 | REACTOME GLUCOSE METABOLISM | Genes involved in Glucose metabolism |
| 0.2 | 0.7 | REACTOME ETHANOL OXIDATION | Genes involved in Ethanol oxidation |
| 0.2 | 0.7 | REACTOME SULFUR AMINO ACID METABOLISM | Genes involved in Sulfur amino acid metabolism |
| 0.2 | 0.6 | REACTOME SIGNALLING TO ERKS | Genes involved in Signalling to ERKs |
| 0.2 | 0.5 | REACTOME CYTOKINE SIGNALING IN IMMUNE SYSTEM | Genes involved in Cytokine Signaling in Immune system |
| 0.2 | 0.6 | REACTOME CELL CYCLE MITOTIC | Genes involved in Cell Cycle, Mitotic |
| 0.2 | 0.3 | REACTOME SIGNALING BY ROBO RECEPTOR | Genes involved in Signaling by Robo receptor |
| 0.1 | 0.1 | REACTOME TRANSPORT OF MATURE TRANSCRIPT TO CYTOPLASM | Genes involved in Transport of Mature Transcript to Cytoplasm |
| 0.1 | 0.6 | REACTOME TRANSLATION | Genes involved in Translation |
| 0.1 | 1.2 | REACTOME TRANSCRIPTION | Genes involved in Transcription |