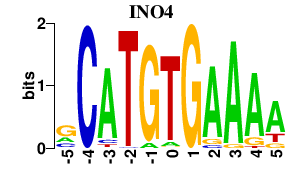
Results for INO4
Z-value: 0.83
Motif logo
Transcription factors associated with INO4
| Gene Symbol | Gene ID | Gene Info |
|---|---|---|
|
INO4
|
S000005468 | Transcription factor involved in phospholipid synthesis |
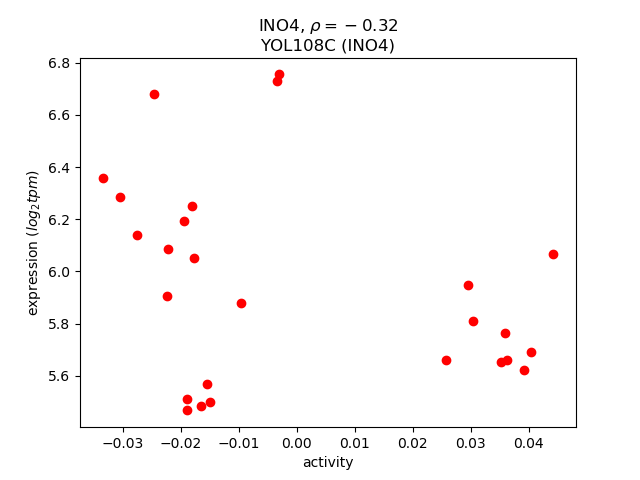
Activity-expression correlation:
Activity profile of INO4 motif
Sorted Z-values of INO4 motif
| Promoter | Log-likelihood | Transcript | Gene | Gene Info |
|---|---|---|---|---|
| YGR157W | 10.07 |
CHO2
|
Phosphatidylethanolamine methyltransferase (PEMT), catalyzes the first step in the conversion of phosphatidylethanolamine to phosphatidylcholine during the methylation pathway of phosphatidylcholine biosynthesis |
|
| YDR502C | 9.29 |
SAM2
|
S-adenosylmethionine synthetase, catalyzes transfer of the adenosyl group of ATP to the sulfur atom of methionine; one of two differentially regulated isozymes (Sam1p and Sam2p) |
|
| YKL182W | 8.03 |
FAS1
|
Beta subunit of fatty acid synthetase, which catalyzes the synthesis of long-chain saturated fatty acids; contains acetyltransacylase, dehydratase, enoyl reductase, malonyl transacylase, and palmitoyl transacylase activities |
|
| YDR497C | 7.60 |
ITR1
|
Myo-inositol transporter with strong similarity to the minor myo-inositol transporter Itr2p, member of the sugar transporter superfamily; expression is repressed by inositol and choline via Opi1p and derepressed via Ino2p and Ino4p |
|
| YIL118W | 7.56 |
RHO3
|
Non-essential small GTPase of the Rho/Rac subfamily of Ras-like proteins involved in the establishment of cell polarity; GTPase activity positively regulated by the GTPase activating protein (GAP) Rgd1p |
|
| YCR018C | 7.34 |
SRD1
|
Protein involved in the processing of pre-rRNA to mature rRNA; contains a C2/C2 zinc finger motif; srd1 mutation suppresses defects caused by the rrp1-1 mutation |
|
| YJL153C | 7.28 |
INO1
|
Inositol 1-phosphate synthase, involved in synthesis of inositol phosphates and inositol-containing phospholipids; transcription is coregulated with other phospholipid biosynthetic genes by Ino2p and Ino4p, which bind the UASINO DNA element |
|
| YFR055W | 7.02 |
IRC7
|
Putative cystathionine beta-lyase; involved in copper ion homeostasis and sulfur metabolism; null mutant displays increased levels of spontaneous Rad52p foci; expression induced by nitrogen limitation in a GLN3, GAT1-dependent manner |
|
| YFR056C | 6.23 |
Dubious open reading frame unlikely to encode a protein based on available experimental and comparative sequence data; partially overlaps the uncharacterized gene YFR055W |
||
| YNL178W | 6.18 |
RPS3
|
Protein component of the small (40S) ribosomal subunit, has apurinic/apyrimidinic (AP) endonuclease activity; essential for viability; has similarity to E. coli S3 and rat S3 ribosomal proteins |
|
| YJR105W | 6.15 |
ADO1
|
Adenosine kinase, required for the utilization of S-adenosylmethionine (AdoMet); may be involved in recycling adenosine produced through the methyl cycle |
|
| YAL003W | 5.33 |
EFB1
|
Translation elongation factor 1 beta; stimulates nucleotide exchange to regenerate EF-1 alpha-GTP for the next elongation cycle; part of the EF-1 complex, which facilitates binding of aminoacyl-tRNA to the ribosomal A site |
|
| YKL218C | 4.89 |
SRY1
|
3-hydroxyaspartate dehydratase, deaminates L-threo-3-hydroxyaspartate to form oxaloacetate and ammonia; required for survival in the presence of hydroxyaspartate |
|
| YEL040W | 4.28 |
UTR2
|
Cell wall protein that functions in the transfer of chitin to beta(1-6)glucan; putative chitin transglycosidase; glycosylphosphatidylinositol (GPI)-anchored protein localized to the bud neck; has a role in cell wall maintenance |
|
| YPR170W-B | 3.88 |
Putative protein of unknown function, conserved in fungi; partially overlaps the dubious genes YPR169W-A, YPR170W-A and YRP170C |
||
| YML026C | 3.87 |
RPS18B
|
Protein component of the small (40S) ribosomal subunit; nearly identical to Rps18Ap and has similarity to E. coli S13 and rat S18 ribosomal proteins |
|
| YBR029C | 3.39 |
CDS1
|
Phosphatidate cytidylyltransferase (CDP-diglyceride synthetase); an enzyme that catalyzes that conversion of CTP + phosphate into diphosphate + CDP-diaclglyerol, a critical step in the synthesis of all major yeast phospholipids |
|
| YMR123W | 3.19 |
PKR1
|
V-ATPase assembly factor, functions with other V-ATPase assembly factors in the ER to efficiently assemble the V-ATPase membrane sector (V0); overproduction confers resistance to Pichia farinosa killer toxin |
|
| YER043C | 3.18 |
SAH1
|
S-adenosyl-L-homocysteine hydrolase, catabolizes S-adenosyl-L-homocysteine which is formed after donation of the activated methyl group of S-adenosyl-L-methionine (AdoMet) to an acceptor |
|
| YPR170W-A | 3.13 |
Dubious open reading frame unlikely to encode a functional protein, based on available experimental and comparative sequence data; identified by expression profiling and mass spectrometry |
||
| YPL231W | 3.12 |
FAS2
|
Alpha subunit of fatty acid synthetase, which catalyzes the synthesis of long-chain saturated fatty acids; contains beta-ketoacyl reductase and beta-ketoacyl synthase activities; phosphorylated |
|
| YGL077C | 3.08 |
HNM1
|
Choline/ethanolamine transporter; involved in the uptake of nitrogen mustard and the uptake of glycine betaine during hypersaline stress; co-regulated with phospholipid biosynthetic genes and negatively regulated by choline and myo-inositol |
|
| YPR069C | 3.06 |
SPE3
|
Spermidine synthase, involved in biosynthesis of spermidine and also in biosynthesis of pantothenic acid; spermidine is required for growth of wild-type cells |
|
| YPL037C | 3.03 |
EGD1
|
Subunit beta1 of the nascent polypeptide-associated complex (NAC) involved in protein targeting, associated with cytoplasmic ribosomes; enhances DNA binding of the Gal4p activator; homolog of human BTF3b |
|
| YGR052W | 2.96 |
FMP48
|
Putative protein of unknown function; the authentic, non-tagged protein is detected in highly purified mitochondria in high-throughput studies; induced by treatment with 8-methoxypsoralen and UVA irradiation |
|
| YER026C | 2.82 |
CHO1
|
Phosphatidylserine synthase, functions in phospholipid biosynthesis; catalyzes the reaction CDP-diaclyglycerol + L-serine = CMP + L-1-phosphatidylserine, transcriptionally repressed by myo-inositol and choline |
|
| YBR210W | 2.81 |
ERV15
|
Protein involved in export of proteins from the endoplasmic reticulum, has similarity to Erv14p |
|
| YLR154C | 2.74 |
RNH203
|
Ribonuclease H2 subunit, required for RNase H2 activity |
|
| YDR044W | 2.73 |
HEM13
|
Coproporphyrinogen III oxidase, an oxygen requiring enzyme that catalyzes the sixth step in the heme biosynthetic pathway; localizes to the mitochondrial inner membrane; transcription is repressed by oxygen and heme (via Rox1p and Hap1p) |
|
| YHR123W | 2.71 |
EPT1
|
sn-1,2-diacylglycerol ethanolamine- and cholinephosphotranferase; not essential for viability |
|
| YDR033W | 2.68 |
MRH1
|
Protein that localizes primarily to the plasma membrane, also found at the nuclear envelope; the authentic, non-tagged protein is detected in mitochondria in a phosphorylated state; has similarity to Hsp30p and Yro2p |
|
| YGR155W | 2.63 |
CYS4
|
Cystathionine beta-synthase, catalyzes the synthesis of cystathionine from serine and homocysteine, the first committed step in cysteine biosynthesis |
|
| YDR072C | 2.55 |
IPT1
|
Inositolphosphotransferase 1, involved in synthesis of mannose-(inositol-P)2-ceramide (M(IP)2C), which is the most abundant sphingolipid in cells, mutation confers resistance to the antifungals syringomycin E and DmAMP1 in some growth media |
|
| YCR031C | 2.45 |
RPS14A
|
Ribosomal protein 59 of the small subunit, required for ribosome assembly and 20S pre-rRNA processing; mutations confer cryptopleurine resistance; nearly identical to Rps14Bp and similar to E. coli S11 and rat S14 ribosomal proteins |
|
| YKL119C | 2.40 |
VPH2
|
Integral membrane protein required for vacuolar H+-ATPase (V-ATPase) function, although not an actual component of the V-ATPase complex; functions in the assembly of the V-ATPase; localized to the endoplasmic reticulum (ER) |
|
| YMR290C | 2.37 |
HAS1
|
ATP-dependent RNA helicase; localizes to both the nuclear periphery and nucleolus; highly enriched in nuclear pore complex fractions; constituent of 66S pre-ribosomal particles |
|
| YLR132C | 2.36 |
Protein of unknown function; green fluorescent protein (GFP)-tagged protein localizes to mitochondria and nucleus; YLR132C is an essential gene |
||
| YMR290W-A | 2.36 |
Dubious open reading frame unlikely to encode a functional protein, based on available experimental and comparative sequence data; overlaps 5' end of essential HAS1 gene which encodes an ATP-dependent RNA helicase |
||
| YER117W | 2.33 |
RPL23B
|
Protein component of the large (60S) ribosomal subunit, identical to Rpl23Ap and has similarity to E. coli L14 and rat L23 ribosomal proteins |
|
| YPR010C | 2.30 |
RPA135
|
RNA polymerase I subunit A135 |
|
| YHR208W | 2.25 |
BAT1
|
Mitochondrial branched-chain amino acid aminotransferase, homolog of murine ECA39; highly expressed during logarithmic phase and repressed during stationary phase |
|
| YOR108W | 2.24 |
LEU9
|
Alpha-isopropylmalate synthase II (2-isopropylmalate synthase), catalyzes the first step in the leucine biosynthesis pathway; the minor isozyme, responsible for the residual alpha-IPMS activity detected in a leu4 null mutant |
|
| YDR344C | 2.24 |
Dubious open reading frame unlikely to encode a functional protein, based on available experimental and comparative sequence data |
||
| YGR050C | 2.24 |
Dubious open reading frame unlikely to encode a protein, based on available experimental and comparative sequence data |
||
| YNL141W | 2.24 |
AAH1
|
Adenine deaminase (adenine aminohydrolase), converts adenine to hypoxanthine; involved in purine salvage; transcriptionally regulated by nutrient levels and growth phase; Aah1p degraded upon entry into quiescence via SCF and the proteasome |
|
| YDR345C | 2.23 |
HXT3
|
Low affinity glucose transporter of the major facilitator superfamily, expression is induced in low or high glucose conditions |
|
| YER102W | 2.21 |
RPS8B
|
Protein component of the small (40S) ribosomal subunit; identical to Rps8Ap and has similarity to rat S8 ribosomal protein |
|
| YBR030W | 2.19 |
Putative protein of unknown function; predicted protein contains a SET domain (S-adenosyl-L-methionine-binding fold) |
||
| YLR109W | 2.18 |
AHP1
|
Thiol-specific peroxiredoxin, reduces hydroperoxides to protect against oxidative damage; function in vivo requires covalent conjugation to Urm1p |
|
| YNR016C | 2.18 |
ACC1
|
Acetyl-CoA carboxylase, biotin containing enzyme that catalyzes the carboxylation of acetyl-CoA to form malonyl-CoA; required for de novo biosynthesis of long-chain fatty acids |
|
| YMR318C | 2.18 |
ADH6
|
NADPH-dependent medium chain alcohol dehydrogenase with broad substrate specificity; member of the cinnamyl family of alcohol dehydrogenases; may be involved in fusel alcohol synthesis or in aldehyde tolerance |
|
| YCR034W | 2.10 |
FEN1
|
Fatty acid elongase, involved in sphingolipid biosynthesis; acts on fatty acids of up to 24 carbons in length; mutations have regulatory effects on 1,3-beta-glucan synthase, vacuolar ATPase, and the secretory pathway |
|
| YDR041W | 2.09 |
RSM10
|
Mitochondrial ribosomal protein of the small subunit, has similarity to E. coli S10 ribosomal protein; essential for viability, unlike most other mitoribosomal proteins |
|
| YLR154W-B | 2.07 |
Dubious open reading frame unlikely to encode a protein; encoded within the the 25S rRNA gene on the opposite strand |
||
| YNL066W | 2.06 |
SUN4
|
Cell wall protein related to glucanases, possibly involved in cell wall septation; member of the SUN family |
|
| YDR050C | 2.03 |
TPI1
|
Triose phosphate isomerase, abundant glycolytic enzyme; mRNA half-life is regulated by iron availability; transcription is controlled by activators Reb1p, Gcr1p, and Rap1p through binding sites in the 5' non-coding region |
|
| YGR159C | 2.03 |
NSR1
|
Nucleolar protein that binds nuclear localization sequences, required for pre-rRNA processing and ribosome biogenesis |
|
| YLR154W-A | 1.99 |
Dubious open reading frame unlikely to encode a protein; encoded within the the 25S rRNA gene on the opposite strand |
||
| YJR070C | 1.97 |
LIA1
|
Deoxyhypusine hydroxylase, a HEAT-repeat containing metalloenzyme that catalyses hypusine formation; binds to and is required for the modification of Hyp2p (eIF5A); complements S. pombe mmd1 mutants defective in mitochondrial positioning |
|
| YBR093C | 1.95 |
PHO5
|
Repressible acid phosphatase (1 of 3) that also mediates extracellular nucleotide-derived phosphate hydrolysis; secretory pathway derived cell surface glycoprotein; induced by phosphate starvation and coordinately regulated by PHO4 and PHO2 |
|
| YDR279W | 1.94 |
RNH202
|
Ribonuclease H2 subunit, required for RNase H2 activity |
|
| YGL120C | 1.93 |
PRP43
|
RNA helicase in the DEAH-box family, functions in both RNA polymerase I and polymerase II transcript metabolism, involved in release of the lariat-intron from the spliceosome |
|
| YJR071W | 1.93 |
Dubious open reading frame unlikely to encode a functional protein, based on available experimental and comparative sequence data |
||
| YOR212W | 1.93 |
STE4
|
G protein beta subunit, forms a dimer with Ste18p to activate the mating signaling pathway, forms a heterotrimer with Gpa1p and Ste18p to dampen signaling; may recruit Rho1p to the polarized growth site during mating; contains WD40 repeats |
|
| YMR246W | 1.92 |
FAA4
|
Long chain fatty acyl-CoA synthetase, regulates protein modification during growth in the presence of ethanol, functions to incorporate palmitic acid into phospholipids and neutral lipids |
|
| YMR011W | 1.92 |
HXT2
|
High-affinity glucose transporter of the major facilitator superfamily, expression is induced by low levels of glucose and repressed by high levels of glucose |
|
| YNL169C | 1.90 |
PSD1
|
Phosphatidylserine decarboxylase of the mitochondrial inner membrane, converts phosphatidylserine to phosphatidylethanolamine |
|
| YDR531W | 1.90 |
Pantothenate kinase (ATP:D-pantothenate 4'-phosphotransferase, EC 2.7.1.33); catalyzes the first committed step in the universal biosynthetic pathway leading to coenzyme A1 |
||
| YOL124C | 1.87 |
TRM11
|
Catalytic subunit of an adoMet-dependent tRNA methyltransferase complex (Trm11p-Trm112p), required for the methylation of the guanosine nucleotide at position 10 (m2G10) in tRNAs; contains a THUMP domain and a methyltransferase domain |
|
| YLR249W | 1.86 |
YEF3
|
Translational elongation factor 3, stimulates the binding of aminoacyl-tRNA (AA-tRNA) to ribosomes by releasing EF-1 alpha from the ribosomal complex; contains two ABC cassettes; binds and hydrolyses ATP |
|
| YLR286C | 1.85 |
CTS1
|
Endochitinase, required for cell separation after mitosis; transcriptional activation during late G and early M cell cycle phases is mediated by transcription factor Ace2p |
|
| YKL118W | 1.84 |
Dubious open reading frame, unlikely to encode a protein; partially overlaps the verified gene VPH2 |
||
| YEL053W-A | 1.84 |
Dubious open reading frame unlikely to encode a protein, based on available experimental and comparative sequence data; partially overlaps the verified gene YEL054C |
||
| YGR151C | 1.81 |
Dubious open reading frame unlikely to encode a protein, based on available experimental and comparative sequence data; overlaps almost completely with the verified ORF RSR1/BUD1/YGR152C |
||
| YNL044W | 1.80 |
YIP3
|
Protein localized to COPII vesicles, proposed to be involved in ER to Golgi transport; interacts with members of the Rab GTPase family and Yip1p; also interacts with Rtn1p |
|
| YNL069C | 1.79 |
RPL16B
|
N-terminally acetylated protein component of the large (60S) ribosomal subunit, binds to 5.8 S rRNA; has similarity to Rpl16Ap, E. coli L13 and rat L13a ribosomal proteins; transcriptionally regulated by Rap1p |
|
| YDL226C | 1.78 |
GCS1
|
ADP-ribosylation factor GTPase activating protein (ARF GAP), involved in ER-Golgi transport; shares functional similarity with Glo3p |
|
| YBR158W | 1.75 |
AMN1
|
Protein required for daughter cell separation, multiple mitotic checkpoints, and chromosome stability; contains 12 degenerate leucine-rich repeat motifs; expression is induced by the Mitotic Exit Network (MEN) |
|
| YHR032W-A | 1.74 |
Dubious open reading frame unlikely to encode a protein, based on available experimental and comparative sequence data; partially overlaps the dubious ORF YHR032C-A |
||
| YDR040C | 1.72 |
ENA1
|
P-type ATPase sodium pump, involved in Na+ and Li+ efflux to allow salt tolerance |
|
| YOL013W-A | 1.72 |
Putative protein of unknown function; identified by SAGE |
||
| YGR285C | 1.72 |
ZUO1
|
Cytosolic ribosome-associated chaperone that acts, together with Ssz1p and the Ssb proteins, as a chaperone for nascent polypeptide chains; contains a DnaJ domain and functions as a J-protein partner for Ssb1p and Ssb2p |
|
| YHR143W-A | 1.70 |
RPC10
|
RNA polymerase subunit, found in RNA polymerase complexes I, II, and III |
|
| YNL130C | 1.67 |
CPT1
|
Cholinephosphotransferase, required for phosphatidylcholine biosynthesis and for inositol-dependent regulation of EPT1 transcription |
|
| YOL107W | 1.66 |
Putative protein of unknown function; green fluorescent protein (GFP)-fusion protein localizes to the cytoplasm and colocalizes in a punctate pattern with the early golgi/COPI vesicles; YOL107W is not an essential protein |
||
| YBL085W | 1.66 |
BOI1
|
Protein implicated in polar growth, functionally redundant with Boi2p; interacts with bud-emergence protein Bem1p; contains an SH3 (src homology 3) domain and a PH (pleckstrin homology) domain |
|
| YHR181W | 1.66 |
SVP26
|
Integral membrane protein of the early Golgi apparatus and endoplasmic reticulum, involved in COP II vesicle transport; may also function to promote retention of proteins in the early Golgi compartment |
|
| YJL167W | 1.64 |
ERG20
|
Farnesyl pyrophosphate synthetase, has both dimethylallyltranstransferase and geranyltranstransferase activities; catalyzes the formation of C15 farnesyl pyrophosphate units for isoprenoid and sterol biosynthesis |
|
| YGR234W | 1.63 |
YHB1
|
Nitric oxide oxidoreductase, flavohemoglobin involved in nitric oxide detoxification; plays a role in the oxidative and nitrosative stress responses |
|
| YGR051C | 1.62 |
Dubious open reading frame unlikely to encode a protein, based on available experimental and comparative sequence data; YGR051C is not an essential gene |
||
| YLR108C | 1.61 |
Protein of unknown function; green fluorescent protein (GFP)-fusion protein localizes to the nucleus; YLR108C is not an esssential gene |
||
| YER019C-A | 1.59 |
SBH2
|
Ssh1p-Sss1p-Sbh2p complex component, involved in protein translocation into the endoplasmic reticulum; homologous to Sbh1p |
|
| YKR038C | 1.59 |
KAE1
|
Putative glycoprotease proposed to be in transcription as a component of the EKC protein complex with Bud32p, Cgi121p, Pcc1p, and Gon7p; also identified as a component of the KEOPS protein complex |
|
| YOR272W | 1.58 |
YTM1
|
Constituent of 66S pre-ribosomal particles, required for maturation of the large ribosomal subunit |
|
| YOR029W | 1.55 |
Dubious open reading frame unlikely to encode a functional protein; based on available experimental and comparative sequence data |
||
| YOR234C | 1.53 |
RPL33B
|
Ribosomal protein L37 of the large (60S) ribosomal subunit, nearly identical to Rpl33Ap and has similarity to rat L35a; rpl33b null mutant exhibits normal growth while rpl33a rpl33b double null mutant is inviable |
|
| YPR036W | 1.53 |
VMA13
|
Subunit H of the eight-subunit V1 peripheral membrane domain of the vacuolar H+-ATPase (V-ATPase), an electrogenic proton pump found throughout the endomembrane system; serves as an activator or a structural stabilizer of the V-ATPase |
|
| YHL020C | 1.52 |
OPI1
|
Transcriptional regulator of a variety of genes; phosphorylation by protein kinase A stimulates Opi1p function in negative regulation of phospholipid biosynthetic genes; involved in telomere maintenance |
|
| YPR170C | 1.51 |
Dubious open reading frame unlikely to encode a protein, based on available experimental and comparative sequence data; partially overlaps the dubious ORFs YPR169W-A and YPR170W-B |
||
| YFR054C | 1.51 |
Dubious open reading frame unlikely to encode a functional protein, based on available experimental and comparative sequence data |
||
| YNR018W | 1.50 |
AIM38
|
Putative protein of unknown function; non-tagged protein is detected in purified mitochondria; null mutant displays decreased frequency of mitochondrial genome loss (petite formation) and severe growth defect in minimal glycerol media |
|
| YLR257W | 1.50 |
Putative protein of unknown function |
||
| YFL015W-A | 1.49 |
Dubious open reading frame unlikely to encode a functional protein, based on available experimental and comparative sequence data |
||
| YJR102C | 1.48 |
VPS25
|
Component of the ESCRT-II complex, which is involved in ubiquitin-dependent sorting of proteins into the endosome |
|
| YFL015C | 1.47 |
Dubious open reading frame unlikely to encode a protein; partially overlaps dubious ORF YFL015W-A; YFL015C is not an essential gene |
||
| YDR073W | 1.47 |
SNF11
|
Subunit of the SWI/SNF chromatin remodeling complex involved in transcriptional regulation; interacts with a highly conserved 40-residue sequence of Snf2p |
|
| YLR011W | 1.46 |
LOT6
|
FMN-dependent NAD(P)H:quinone reductase that may be involved in quinone detoxification; gene expression increases in cultures shifted to a lower temperature |
|
| YKL068W-A | 1.46 |
Putative protein of unknown function; identified by homology to Ashbya gossypii |
||
| YGL148W | 1.45 |
ARO2
|
Bifunctional chorismate synthase and flavin reductase, catalyzes the conversion of 5-enolpyruvylshikimate 3-phosphate (EPSP) to form chorismate, which is a precursor to aromatic amino acids |
|
| YPR171W | 1.44 |
BSP1
|
Adapter that links synaptojanins Inp52p and Inp53p to the cortical actin cytoskeleton |
|
| YML088W | 1.44 |
UFO1
|
F-box receptor protein, subunit of the Skp1-Cdc53-F-box receptor (SCF) E3 ubiquitin ligase complex; binds to phosphorylated Ho endonuclease, allowing its ubiquitylation by SCF and subsequent degradation |
|
| YER137C | 1.44 |
Putative protein of unknown function |
||
| YOR108C-A | 1.43 |
Identified by gene-trapping, microarray-based expression analysis, and genome-wide homology searching |
||
| YGR177C | 1.42 |
ATF2
|
Alcohol acetyltransferase, may play a role in steroid detoxification; forms volatile esters during fermentation, which is important in brewing |
|
| YHR025W | 1.42 |
THR1
|
Homoserine kinase, conserved protein required for threonine biosynthesis; expression is regulated by the GCN4-mediated general amino acid control pathway |
|
| YJL200C | 1.39 |
ACO2
|
Putative mitochondrial aconitase isozyme; similarity to Aco1p, an aconitase required for the TCA cycle; expression induced during growth on glucose, by amino acid starvation via Gcn4p, and repressed on ethanol |
|
| YLR372W | 1.38 |
SUR4
|
Elongase, involved in fatty acid and sphingolipid biosynthesis; synthesizes very long chain 20-26-carbon fatty acids from C18-CoA primers; involved in regulation of sphingolipid biosynthesis |
|
| YMR199W | 1.36 |
CLN1
|
G1 cyclin involved in regulation of the cell cycle; activates Cdc28p kinase to promote the G1 to S phase transition; late G1 specific expression depends on transcription factor complexes, MBF (Swi6p-Mbp1p) and SBF (Swi6p-Swi4p) |
|
| YKL117W | 1.36 |
SBA1
|
Co-chaperone that binds to and regulates Hsp90 family chaperones; important for pp60v-src activity in yeast; homologous to the mammalian p23 proteins and like p23 can regulate telomerase activity |
|
| YBR023C | 1.36 |
CHS3
|
Chitin synthase III, catalyzes the transfer of N-acetylglucosamine (GlcNAc) to chitin; required for synthesis of the majority of cell wall chitin, the chitin ring during bud emergence, and spore wall chitosan |
|
| YPR033C | 1.36 |
HTS1
|
Cytoplasmic and mitochondrial histidine tRNA synthetase; encoded by a single nuclear gene that specifies two messages; efficient mitochondrial localization requires both a presequence and an amino-terminal sequence |
|
| YMR194W | 1.36 |
RPL36A
|
N-terminally acetylated protein component of the large (60S) ribosomal subunit, nearly identical to Rpl36Bp and has similarity to rat L36 ribosomal protein; binds to 5.8 S rRNA |
|
| YER009W | 1.36 |
NTF2
|
Nuclear envelope protein, interacts with GDP-bound Gsp1p and with proteins of the nuclear pore to transport Gsp1p into the nucleus where it is an essential player in nucleocytoplasmic transport |
|
| YOR028C | 1.36 |
CIN5
|
Basic leucine zipper transcriptional factor of the yAP-1 family that mediates pleiotropic drug resistance and salt tolerance; localizes constitutively to the nucleus |
|
| YHR136C | 1.36 |
SPL2
|
Protein with similarity to cyclin-dependent kinase inhibitors, overproduction suppresses a plc1 null mutation; green fluorescent protein (GFP)-fusion protein localizes to the cytoplasm in a punctate pattern |
|
| YAR020C | 1.34 |
PAU7
|
Part of 23-member seripauperin multigene family, active during alcoholic fermentation, regulated by anaerobiosis, inhibited by oxygen, repressed by heme |
|
| YNL256W | 1.33 |
FOL1
|
Multifunctional enzyme of the folic acid biosynthesis pathway, has dihydropteroate synthetase, dihydro-6-hydroxymethylpterin pyrophosphokinase, and dihydroneopterin aldolase activities |
|
| YBR182C-A | 1.33 |
Putative protein of unknown function; identified by gene-trapping, microarray-based expression analysis, and genome-wide homology searching |
||
| YGR004W | 1.32 |
PEX31
|
Peroxisomal integral membrane protein, involved in negative regulation of peroxisome size; partially functionally redundant with Pex30p and Pex32p; probably acts at a step downstream of steps mediated by Pex28p and Pex29p |
|
| YBR143C | 1.30 |
SUP45
|
Polypeptide release factor involved in translation termination; mutant form acts as a recessive omnipotent suppressor |
|
| YNL028W | 1.29 |
Dubious open reading frame unlikely to encode a protein, based on available experimental and comparative sequence data |
||
| YGR251W | 1.29 |
Putative protein of unknown function; deletion mutant has defects in pre-rRNA processing; green fluorescent protein (GFP)-fusion protein localizes to both the nucleus and the nucleolus; YGR251W is an essential gene |
||
| YCR019W | 1.28 |
MAK32
|
Protein necessary for structural stability of L-A double-stranded RNA-containing particles |
|
| YHR067W | 1.27 |
HTD2
|
Mitochondrial 3-hydroxyacyl-thioester dehydratase involved in fatty acid biosynthesis, required for respiratory growth and for normal mitochondrial morphology |
|
| YGR018C | 1.26 |
Dubious open reading frame unlikely to encode a protein, based on available experimental and comparative sequence data; partially overlaps the uncharacterized ORF YGR017W |
||
| YLR206W | 1.26 |
ENT2
|
Epsin-like protein required for endocytosis and actin patch assembly and functionally redundant with Ent1p; contains clathrin-binding motif at C-terminus |
|
| YGR280C | 1.26 |
PXR1
|
Essential protein involved in rRNA and snoRNA maturation; competes with TLC1 RNA for binding to Est2p, suggesting a role in negative regulation of telomerase; human homolog inhibits telomerase; contains a G-patch RNA interacting domain |
|
| YDR146C | 1.25 |
SWI5
|
Transcription factor that activates transcription of genes expressed at the M/G1 phase boundary and in G1 phase; localization to the nucleus occurs during G1 and appears to be regulated by phosphorylation by Cdc28p kinase |
|
| YHR018C | 1.24 |
ARG4
|
Argininosuccinate lyase, catalyzes the final step in the arginine biosynthesis pathway |
|
| YHR216W | 1.24 |
IMD2
|
Inosine monophosphate dehydrogenase, catalyzes the first step of GMP biosynthesis, expression is induced by mycophenolic acid resulting in resistance to the drug, expression is repressed by nutrient limitation |
|
| YNL234W | 1.24 |
Similar to globins and has a functional heme-binding domain; involved in glucose signaling or metabolism; regulated by Rgt1p |
||
| YLR191W | 1.22 |
PEX13
|
Integral peroxisomal membrane required for the translocation of peroxisomal matrix proteins, interacts with the PTS1 signal recognition factor Pex5p and the PTS2 signal recognition factor Pex7p, forms a complex with Pex14p and Pex17p |
|
| YPL163C | 1.21 |
SVS1
|
Cell wall and vacuolar protein, required for wild-type resistance to vanadate |
|
| YGL032C | 1.21 |
AGA2
|
Adhesion subunit of a-agglutinin of a-cells, C-terminal sequence acts as a ligand for alpha-agglutinin (Sag1p) during agglutination, modified with O-linked oligomannosyl chains, linked to anchorage subunit Aga1p via two disulfide bonds |
|
| YPL062W | 1.20 |
Dubious open reading frame unlikely to encode a protein, based on available experimental and comparative sequence data; YPL062W is not an essential gene; homozygous diploid mutant shows a decrease in glycogen accumulation |
||
| YHR180W-A | 1.20 |
Dubious open reading frame unlikely to encode a protein, based on available experimental and comparative sequence data; partially overlaps dubious ORF YHR180C-B and long terminal repeat YHRCsigma3 |
||
| YER001W | 1.20 |
MNN1
|
Alpha-1,3-mannosyltransferase, integral membrane glycoprotein of the Golgi complex, required for addition of alpha1,3-mannose linkages to N-linked and O-linked oligosaccharides, one of five S. cerevisiae proteins of the MNN1 family |
|
| YJR123W | 1.18 |
RPS5
|
Protein component of the small (40S) ribosomal subunit, the least basic of the non-acidic ribosomal proteins; phosphorylated in vivo; essential for viability; has similarity to E. coli S7 and rat S5 ribosomal proteins |
|
| YJL048C | 1.16 |
UBX6
|
UBX (ubiquitin regulatory X) domain-containing protein that interacts with Cdc48p, transcription is repressed when cells are grown in media containing inositol and choline |
|
| YML075C | 1.16 |
HMG1
|
One of two isozymes of HMG-CoA reductase that catalyzes the conversion of HMG-CoA to mevalonate, which is a rate-limiting step in sterol biosynthesis; localizes to the nuclear envelope; overproduction induces the formation of karmellae |
|
| YER049W | 1.16 |
TPA1
|
Protein of unknown function; interacts with Sup45p (eRF1), Sup35p (eRF3) and Pab1p; has a role in translation termination efficiency, mRNA poly(A) tail length and mRNA stability |
|
| YNL029C | 1.16 |
KTR5
|
Putative mannosyltransferase involved in protein glycosylation; member of the KRE2/MNT1 mannosyltransferase family |
|
| YEL001C | 1.15 |
IRC22
|
Putative protein of unknown function; green fluorescent protein (GFP)-fusion localizes to the ER; YEL001C is non-essential; null mutant displays increased levels of spontaneous Rad52p foci |
|
| YPR157W | 1.15 |
Putative protein of unknown function; induced by treatment with 8-methoxypsoralen and UVA irradiation |
||
| YMR009W | 1.14 |
ADI1
|
Acireductone dioxygenease involved in the methionine salvage pathway; ortholog of human MTCBP-1; transcribed with YMR010W and regulated post-transcriptionally by RNase III (Rnt1p) cleavage; ADI1 mRNA is induced in heat shock conditions |
|
| YOR284W | 1.14 |
HUA2
|
Cytoplasmic protein of unknown function; computational analysis of large-scale protein-protein interaction data suggests a possible role in actin patch assembly |
|
| YIR013C | 1.12 |
GAT4
|
Protein containing GATA family zinc finger motifs |
|
| YOR376W-A | 1.11 |
Putative protein of unknown function; identified by fungal homology and RT-PCR |
||
| YDL023C | 1.11 |
Dubious open reading frame, unlikely to encode a protein; not conserved in other Saccharomyces species; overlaps the verified gene GPD1; deletion confers sensitivity to GSAO; deletion in cyr1 mutant results in loss of stress resistance |
||
| YLR301W | 1.10 |
Protein of unknown function that interacts with Sec72p |
||
| YDL022C-A | 1.10 |
Dubious open reading frame unlikely to encode a protein; partially overlaps the verified gene DIA3; identified by fungal homology and RT-PCR |
||
| YJR094W-A | 1.09 |
RPL43B
|
Protein component of the large (60S) ribosomal subunit, identical to Rpl43Ap and has similarity to rat L37a ribosomal protein |
|
| YOR247W | 1.09 |
SRL1
|
Mannoprotein that exhibits a tight association with the cell wall, required for cell wall stability in the absence of GPI-anchored mannoproteins; has a high serine-threonine content; expression is induced in cell wall mutants |
|
| YOR271C | 1.08 |
FSF1
|
Putative protein, predicted to be an alpha-isopropylmalate carrier; belongs to the sideroblastic-associated protein family; non-tagged protein is detected in purified mitochondria; likely to play a role in iron homeostasis |
|
| YMR321C | 1.08 |
Putative protein of unknown function |
||
| YMR049C | 1.06 |
ERB1
|
Protein required for maturation of the 25S and 5.8S ribosomal RNAs; constituent of 66S pre-ribosomal particles; homologous to mammalian Bop1 |
|
| YPL256C | 1.04 |
CLN2
|
G1 cyclin involved in regulation of the cell cycle; activates Cdc28p kinase to promote the G1 to S phase transition; late G1 specific expression depends on transcription factor complexes, MBF (Swi6p-Mbp1p) and SBF (Swi6p-Swi4p) |
|
| YEL056W | 1.03 |
HAT2
|
Subunit of the Hat1p-Hat2p histone acetyltransferase complex; required for high affinity binding of the complex to free histone H4, thereby enhancing Hat1p activity; similar to human RbAp46 and 48; has a role in telomeric silencing |
|
| YEL034C-A | 1.03 |
Dubious open reading frame unlikely to encode a protein, based on experimental and comparative sequence data; completely overlaps HYP2/YEL034W, a verified gene that encodes eiF-5A |
||
| YPR014C | 1.03 |
Dubious open reading frame unlikely to encode a protein, based on available experimental and comparative sequence data; YPR014C is not an essential gene |
||
| YOR063W | 1.02 |
RPL3
|
Protein component of the large (60S) ribosomal subunit, has similarity to E. coli L3 and rat L3 ribosomal proteins; involved in the replication and maintenance of killer double stranded RNA virus |
|
| YJL198W | 1.02 |
PHO90
|
Low-affinity phosphate transporter; deletion of pho84, pho87, pho89, pho90, and pho91 causes synthetic lethality; transcription independent of Pi and Pho4p activity; overexpression results in vigorous growth |
|
| YDL211C | 1.02 |
Putative protein of unknown function; green fluorescent protein (GFP)-fusion protein localizes to the vacuole |
||
| YER107W-A | 1.01 |
Dubious open reading frame unlikely to encode a protein, partially overlaps verified ORF GLE2/YER107C |
||
| YIL078W | 1.01 |
THS1
|
Threonyl-tRNA synthetase, essential cytoplasmic protein |
|
| YGR055W | 1.01 |
MUP1
|
High affinity methionine permease, integral membrane protein with 13 putative membrane-spanning regions; also involved in cysteine uptake |
|
| YOL103W | 1.00 |
ITR2
|
Myo-inositol transporter with strong similarity to the major myo-inositol transporter Itr1p, member of the sugar transporter superfamily; expressed constitutively |
|
| YER091C | 1.00 |
MET6
|
Cobalamin-independent methionine synthase, involved in amino acid biosynthesis; requires a minimum of two glutamates on the methyltetrahydrofolate substrate, similar to bacterial metE homologs |
|
| YLR416C | 0.99 |
Dubious open reading frame unlikely to encode a functional protein, based on available experimental and comparative sequence data |
||
| YDR321W | 0.99 |
ASP1
|
Cytosolic L-asparaginase, involved in asparagine catabolism |
|
| YOL123W | 0.99 |
HRP1
|
Subunit of cleavage factor I, a five-subunit complex required for the cleavage and polyadenylation of pre-mRNA 3' ends; RRM-containing heteronuclear RNA binding protein and hnRNPA/B family member that binds to poly (A) signal sequences |
|
| YJL188C | 0.98 |
BUD19
|
Dubious open reading frame, unlikely to encode a protein; not conserved in closely related Saccharomyces species; 88% of ORF overlaps the verified gene RPL39; diploid mutant displays a weak budding pattern phenotype in a systematic assay |
|
| YNR072W | 0.96 |
HXT17
|
Hexose transporter, up-regulated in media containing raffinose and galactose at pH 7.7 versus pH 4.7, repressed by high levels of glucose |
|
| YDR212W | 0.96 |
TCP1
|
Alpha subunit of chaperonin-containing T-complex, which mediates protein folding in the cytosol; involved in maintenance of actin cytoskeleton; homolog to Drosophila melanogaster and mouse tailless complex polypeptide |
|
| YBR171W | 0.95 |
SEC66
|
Non-essential subunit of Sec63 complex (Sec63p, Sec62p, Sec66p and Sec72p); with Sec61 complex, Kar2p/BiP and Lhs1p forms a channel competent for SRP-dependent and post-translational SRP-independent protein targeting and import into the ER |
|
| YCL059C | 0.95 |
KRR1
|
Essential nucleolar protein required for the synthesis of 18S rRNA and for the assembly of 40S ribosomal subunit |
|
| YBR106W | 0.94 |
PHO88
|
Probable membrane protein, involved in phosphate transport; pho88 pho86 double null mutant exhibits enhanced synthesis of repressible acid phosphatase at high inorganic phosphate concentrations |
|
| YML103C | 0.94 |
NUP188
|
Subunit of the nuclear pore complex (NPC), involved in the structural organization of the complex and of the nuclear envelope, also involved in nuclear envelope permeability, interacts with Pom152p and Nic96p |
|
| YJL168C | 0.94 |
SET2
|
Histone methyltransferase with a role in transcriptional elongation, methylates a lysine residue of histone H3; associates with the C-terminal domain of Rpo21p; histone methylation activity is regulated by phosphorylation status of Rpo21p |
|
| YIL119C | 0.94 |
RPI1
|
Putative transcriptional regulator; overexpression suppresses the heat shock sensitivity of wild-type RAS2 overexpression and also suppresses the cell lysis defect of an mpk1 mutation |
|
| YDR211W | 0.93 |
GCD6
|
Catalytic epsilon subunit of the translation initiation factor eIF2B, the guanine-nucleotide exchange factor for eIF2; activity subsequently regulated by phosphorylated eIF2; first identified as a negative regulator of GCN4 expression |
|
| YER107C | 0.93 |
GLE2
|
Component of the nuclear pore complex required for polyadenylated RNA export but not for protein import, homologous to S. pombe Rae1p |
|
| YOL127W | 0.92 |
RPL25
|
Primary rRNA-binding ribosomal protein component of the large (60S) ribosomal subunit, has similarity to E. coli L23 and rat L23a ribosomal proteins; binds to 26S rRNA via a conserved C-terminal motif |
|
| YOR273C | 0.91 |
TPO4
|
Polyamine transport protein, recognizes spermine, putrescine, and spermidine; localizes to the plasma membrane; member of the major facilitator superfamily |
|
| YDR324C | 0.91 |
UTP4
|
Nucleolar protein, component of the small subunit (SSU) processome containing the U3 snoRNA that is involved in processing of pre-18S rRNA |
|
| YGR017W | 0.91 |
Putative protein of unknown function; green fluorescent protein (GFP)-fusion protein localizes to both the nucleus and the cytoplasm |
||
| YFR025C | 0.91 |
HIS2
|
Histidinolphosphatase, catalyzes the eighth step in histidine biosynthesis; mutations cause histidine auxotrophy and sensitivity to Cu, Co, and Ni salts; transcription is regulated by general amino acid control |
|
| YDL022W | 0.91 |
GPD1
|
NAD-dependent glycerol-3-phosphate dehydrogenase, key enzyme of glycerol synthesis, essential for growth under osmotic stress; expression regulated by high-osmolarity glycerol response pathway; homolog of Gpd2p |
|
| YLR180W | 0.91 |
SAM1
|
S-adenosylmethionine synthetase, catalyzes transfer of the adenosyl group of ATP to the sulfur atom of methionine; one of two differentially regulated isozymes (Sam1p and Sam2p) |
|
| YPL131W | 0.90 |
RPL5
|
Protein component of the large (60S) ribosomal subunit with similarity to E. coli L18 and rat L5 ribosomal proteins; binds 5S rRNA and is required for 60S subunit assembly |
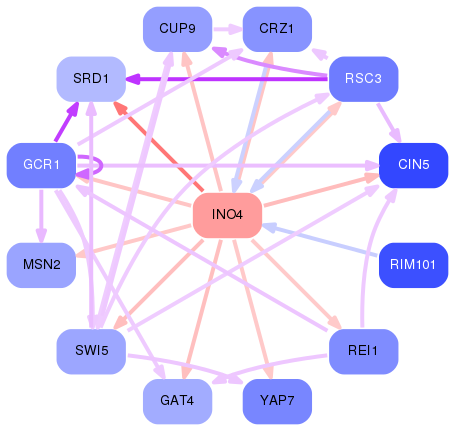
Network of associatons between targets according to the STRING database.

First level regulatory network of INO4
Gene Ontology Analysis
Gene overrepresentation in biological process category:
| Log-likelihood per target | Total log-likelihood | Term | Description |
|---|---|---|---|
| 2.5 | 10.2 | GO:0046500 | S-adenosylmethionine metabolic process(GO:0046500) |
| 2.4 | 7.1 | GO:0000098 | sulfur amino acid catabolic process(GO:0000098) |
| 1.9 | 7.6 | GO:0090338 | regulation of formin-nucleated actin cable assembly(GO:0090337) positive regulation of formin-nucleated actin cable assembly(GO:0090338) |
| 1.8 | 5.5 | GO:0044209 | AMP salvage(GO:0044209) |
| 1.8 | 3.6 | GO:0006658 | phosphatidylserine metabolic process(GO:0006658) |
| 1.5 | 8.9 | GO:0006646 | phosphatidylethanolamine biosynthetic process(GO:0006646) |
| 1.4 | 5.6 | GO:0070070 | proton-transporting V-type ATPase complex assembly(GO:0070070) vacuolar proton-transporting V-type ATPase complex assembly(GO:0070072) |
| 1.3 | 11.9 | GO:0006656 | phosphatidylcholine biosynthetic process(GO:0006656) |
| 1.3 | 2.5 | GO:0046083 | adenine metabolic process(GO:0046083) |
| 1.3 | 7.6 | GO:0006021 | inositol biosynthetic process(GO:0006021) |
| 1.2 | 4.8 | GO:0035337 | fatty-acyl-CoA metabolic process(GO:0035337) |
| 1.1 | 7.6 | GO:0015791 | polyol transport(GO:0015791) |
| 1.0 | 2.9 | GO:0008216 | spermidine metabolic process(GO:0008216) |
| 0.9 | 3.5 | GO:0030497 | fatty acid elongation(GO:0030497) |
| 0.7 | 3.7 | GO:0070814 | hydrogen sulfide metabolic process(GO:0070813) hydrogen sulfide biosynthetic process(GO:0070814) |
| 0.7 | 2.1 | GO:0031684 | heterotrimeric G-protein complex cycle(GO:0031684) |
| 0.7 | 5.0 | GO:0043137 | DNA replication, removal of RNA primer(GO:0043137) |
| 0.7 | 12.4 | GO:0051029 | rRNA export from nucleus(GO:0006407) rRNA transport(GO:0051029) |
| 0.7 | 5.5 | GO:0042219 | cellular modified amino acid catabolic process(GO:0042219) |
| 0.7 | 0.7 | GO:2000879 | regulation of oligopeptide transport by regulation of transcription from RNA polymerase II promoter(GO:0035950) negative regulation of oligopeptide transport by negative regulation of transcription from RNA polymerase II promoter(GO:0035952) regulation of dipeptide transport by regulation of transcription from RNA polymerase II promoter(GO:0035953) negative regulation of dipeptide transport by negative regulation of transcription from RNA polymerase II promoter(GO:0035955) negative regulation of oligopeptide transport(GO:2000877) negative regulation of dipeptide transport(GO:2000879) |
| 0.7 | 2.0 | GO:0008612 | peptidyl-lysine modification to peptidyl-hypusine(GO:0008612) |
| 0.7 | 3.3 | GO:0051083 | 'de novo' cotranslational protein folding(GO:0051083) |
| 0.6 | 4.5 | GO:0009098 | leucine biosynthetic process(GO:0009098) |
| 0.6 | 1.2 | GO:0009240 | isopentenyl diphosphate biosynthetic process(GO:0009240) isopentenyl diphosphate biosynthetic process, mevalonate pathway(GO:0019287) isopentenyl diphosphate metabolic process(GO:0046490) |
| 0.5 | 13.1 | GO:0006633 | fatty acid biosynthetic process(GO:0006633) |
| 0.5 | 3.2 | GO:0072337 | modified amino acid transport(GO:0072337) |
| 0.5 | 2.0 | GO:0016036 | cellular response to phosphate starvation(GO:0016036) |
| 0.5 | 1.5 | GO:0042992 | negative regulation of transcription factor import into nucleus(GO:0042992) |
| 0.5 | 7.7 | GO:0006037 | cell wall chitin metabolic process(GO:0006037) |
| 0.5 | 0.9 | GO:0032239 | regulation of mRNA export from nucleus(GO:0010793) regulation of nucleobase-containing compound transport(GO:0032239) regulation of RNA export from nucleus(GO:0046831) regulation of ribonucleoprotein complex localization(GO:2000197) |
| 0.5 | 1.9 | GO:0046348 | aminoglycan catabolic process(GO:0006026) chitin catabolic process(GO:0006032) amino sugar catabolic process(GO:0046348) glucosamine-containing compound catabolic process(GO:1901072) |
| 0.4 | 6.2 | GO:0000028 | ribosomal small subunit assembly(GO:0000028) |
| 0.4 | 0.9 | GO:0000101 | sulfur amino acid transport(GO:0000101) |
| 0.4 | 2.9 | GO:0006782 | protoporphyrinogen IX biosynthetic process(GO:0006782) protoporphyrinogen IX metabolic process(GO:0046501) |
| 0.4 | 1.2 | GO:0045896 | regulation of transcription during mitosis(GO:0045896) |
| 0.4 | 1.6 | GO:0000771 | agglutination involved in conjugation with cellular fusion(GO:0000752) agglutination involved in conjugation(GO:0000771) heterophilic cell-cell adhesion via plasma membrane cell adhesion molecules(GO:0007157) cell-cell adhesion(GO:0098609) adhesion between unicellular organisms(GO:0098610) multi organism cell adhesion(GO:0098740) cell-cell adhesion via plasma-membrane adhesion molecules(GO:0098742) |
| 0.4 | 1.2 | GO:0030037 | actin filament reorganization involved in cell cycle(GO:0030037) actin filament reorganization(GO:0090527) |
| 0.4 | 1.9 | GO:0071267 | L-methionine biosynthetic process from methylthioadenosine(GO:0019509) amino acid salvage(GO:0043102) L-methionine salvage(GO:0071267) |
| 0.4 | 3.1 | GO:1904356 | regulation of telomere maintenance via telomerase(GO:0032210) regulation of telomere maintenance via telomere lengthening(GO:1904356) regulation of DNA biosynthetic process(GO:2000278) |
| 0.4 | 1.5 | GO:0000296 | spermine transport(GO:0000296) |
| 0.4 | 1.5 | GO:0009423 | chorismate biosynthetic process(GO:0009423) |
| 0.4 | 1.8 | GO:0000390 | spliceosomal complex disassembly(GO:0000390) |
| 0.3 | 4.3 | GO:0006415 | translational termination(GO:0006415) |
| 0.3 | 2.0 | GO:0046037 | GMP metabolic process(GO:0046037) |
| 0.3 | 1.6 | GO:0045338 | terpenoid metabolic process(GO:0006721) terpenoid biosynthetic process(GO:0016114) farnesyl diphosphate biosynthetic process(GO:0045337) farnesyl diphosphate metabolic process(GO:0045338) |
| 0.3 | 1.8 | GO:0051597 | response to methylmercury(GO:0051597) cellular response to methylmercury(GO:0071406) |
| 0.3 | 0.6 | GO:0000751 | mitotic cell cycle arrest in response to pheromone(GO:0000751) mitotic cell cycle arrest(GO:0071850) |
| 0.3 | 4.1 | GO:0006972 | hyperosmotic response(GO:0006972) |
| 0.3 | 0.9 | GO:0061647 | histone H3 acetylation(GO:0043966) histone H3-K9 acetylation(GO:0043970) histone H3-K14 acetylation(GO:0044154) histone H3-K9 modification(GO:0061647) |
| 0.3 | 1.7 | GO:0009088 | threonine biosynthetic process(GO:0009088) |
| 0.3 | 2.8 | GO:0007109 | obsolete cytokinesis, completion of separation(GO:0007109) |
| 0.3 | 1.1 | GO:0006528 | asparagine metabolic process(GO:0006528) |
| 0.3 | 12.0 | GO:0006414 | translational elongation(GO:0006414) |
| 0.2 | 4.4 | GO:0009636 | response to toxic substance(GO:0009636) |
| 0.2 | 1.2 | GO:0022615 | protein import into peroxisome matrix, docking(GO:0016560) protein to membrane docking(GO:0022615) |
| 0.2 | 1.2 | GO:0006491 | N-glycan processing(GO:0006491) |
| 0.2 | 3.1 | GO:0007120 | axial cellular bud site selection(GO:0007120) |
| 0.2 | 0.2 | GO:0046855 | phosphorylated carbohydrate dephosphorylation(GO:0046838) inositol phosphate dephosphorylation(GO:0046855) inositol phosphate catabolic process(GO:0071545) |
| 0.2 | 2.1 | GO:0000433 | negative regulation of transcription from RNA polymerase II promoter by glucose(GO:0000433) negative regulation of transcription by glucose(GO:0045014) |
| 0.2 | 2.7 | GO:0090529 | barrier septum assembly(GO:0000917) cell septum assembly(GO:0090529) |
| 0.2 | 3.7 | GO:0042790 | transcription of nuclear large rRNA transcript from RNA polymerase I promoter(GO:0042790) |
| 0.2 | 1.2 | GO:0045292 | mRNA cis splicing, via spliceosome(GO:0045292) |
| 0.2 | 1.0 | GO:0046655 | folic acid metabolic process(GO:0046655) folic acid biosynthetic process(GO:0046656) |
| 0.2 | 1.8 | GO:0000320 | re-entry into mitotic cell cycle(GO:0000320) |
| 0.2 | 0.6 | GO:0071044 | histone mRNA metabolic process(GO:0008334) histone mRNA catabolic process(GO:0071044) |
| 0.2 | 0.5 | GO:0009186 | deoxyribonucleoside diphosphate metabolic process(GO:0009186) deoxyribonucleoside triphosphate biosynthetic process(GO:0009202) |
| 0.2 | 2.4 | GO:0006555 | methionine metabolic process(GO:0006555) |
| 0.2 | 0.5 | GO:0010674 | negative regulation of transcription from RNA polymerase II promoter involved in meiotic cell cycle(GO:0010674) |
| 0.2 | 0.5 | GO:0015680 | intracellular copper ion transport(GO:0015680) |
| 0.2 | 1.3 | GO:0070525 | tRNA threonylcarbamoyladenosine metabolic process(GO:0070525) |
| 0.2 | 1.7 | GO:0045053 | protein retention in Golgi apparatus(GO:0045053) |
| 0.2 | 1.3 | GO:0000105 | histidine biosynthetic process(GO:0000105) histidine metabolic process(GO:0006547) imidazole-containing compound metabolic process(GO:0052803) |
| 0.2 | 0.8 | GO:0034723 | DNA replication-dependent nucleosome assembly(GO:0006335) DNA replication-dependent nucleosome organization(GO:0034723) |
| 0.2 | 1.2 | GO:0006591 | ornithine metabolic process(GO:0006591) |
| 0.1 | 2.6 | GO:0042797 | tRNA transcription(GO:0009304) tRNA transcription from RNA polymerase III promoter(GO:0042797) |
| 0.1 | 4.5 | GO:0006505 | GPI anchor metabolic process(GO:0006505) |
| 0.1 | 0.4 | GO:0019255 | glucose 1-phosphate metabolic process(GO:0019255) |
| 0.1 | 1.5 | GO:0015991 | energy coupled proton transmembrane transport, against electrochemical gradient(GO:0015988) ATP hydrolysis coupled proton transport(GO:0015991) ATP hydrolysis coupled transmembrane transport(GO:0090662) |
| 0.1 | 0.4 | GO:0046416 | D-amino acid metabolic process(GO:0046416) |
| 0.1 | 0.3 | GO:0007189 | adenylate cyclase-activating G-protein coupled receptor signaling pathway(GO:0007189) |
| 0.1 | 4.0 | GO:0000027 | ribosomal large subunit assembly(GO:0000027) |
| 0.1 | 0.5 | GO:0018279 | peptidyl-asparagine modification(GO:0018196) protein N-linked glycosylation via asparagine(GO:0018279) |
| 0.1 | 2.4 | GO:0030488 | tRNA methylation(GO:0030488) |
| 0.1 | 0.4 | GO:0070623 | regulation of vitamin metabolic process(GO:0030656) positive regulation of vitamin metabolic process(GO:0046136) positive regulation of sulfur metabolic process(GO:0051176) regulation of thiamine biosynthetic process(GO:0070623) positive regulation of thiamine biosynthetic process(GO:0090180) |
| 0.1 | 0.4 | GO:0070637 | nicotinamide riboside metabolic process(GO:0046495) pyridine nucleoside metabolic process(GO:0070637) |
| 0.1 | 0.4 | GO:0045948 | positive regulation of translational initiation(GO:0045948) |
| 0.1 | 0.4 | GO:0060188 | regulation of protein desumoylation(GO:0060188) |
| 0.1 | 3.4 | GO:0006418 | tRNA aminoacylation for protein translation(GO:0006418) |
| 0.1 | 0.4 | GO:0019673 | GDP-mannose biosynthetic process(GO:0009298) GDP-mannose metabolic process(GO:0019673) |
| 0.1 | 0.6 | GO:0006564 | L-serine biosynthetic process(GO:0006564) |
| 0.1 | 0.7 | GO:0070096 | mitochondrial outer membrane translocase complex assembly(GO:0070096) |
| 0.1 | 1.1 | GO:0006272 | leading strand elongation(GO:0006272) |
| 0.1 | 0.9 | GO:0034501 | protein localization to kinetochore(GO:0034501) |
| 0.1 | 0.5 | GO:0006015 | 5-phosphoribose 1-diphosphate biosynthetic process(GO:0006015) 5-phosphoribose 1-diphosphate metabolic process(GO:0046391) |
| 0.1 | 0.8 | GO:0030846 | termination of RNA polymerase II transcription, poly(A)-coupled(GO:0030846) |
| 0.1 | 0.2 | GO:0009847 | spore germination(GO:0009847) |
| 0.1 | 1.1 | GO:0007121 | bipolar cellular bud site selection(GO:0007121) |
| 0.1 | 0.1 | GO:0033239 | negative regulation of cellular amine metabolic process(GO:0033239) |
| 0.1 | 0.4 | GO:0042255 | ribosome assembly(GO:0042255) |
| 0.1 | 0.3 | GO:0002188 | translation reinitiation(GO:0002188) |
| 0.1 | 1.4 | GO:0000184 | nuclear-transcribed mRNA catabolic process, nonsense-mediated decay(GO:0000184) |
| 0.1 | 0.2 | GO:0048211 | Golgi vesicle docking(GO:0048211) |
| 0.1 | 9.8 | GO:0002181 | cytoplasmic translation(GO:0002181) |
| 0.1 | 1.0 | GO:0034498 | early endosome to Golgi transport(GO:0034498) |
| 0.1 | 1.5 | GO:0019682 | pentose-phosphate shunt(GO:0006098) glyceraldehyde-3-phosphate metabolic process(GO:0019682) |
| 0.1 | 1.2 | GO:0051666 | actin cortical patch localization(GO:0051666) |
| 0.1 | 16.3 | GO:0006364 | rRNA processing(GO:0006364) |
| 0.1 | 0.2 | GO:0006566 | threonine metabolic process(GO:0006566) |
| 0.1 | 1.2 | GO:0046856 | phosphatidylinositol dephosphorylation(GO:0046856) |
| 0.1 | 0.3 | GO:0033262 | regulation of nuclear cell cycle DNA replication(GO:0033262) |
| 0.1 | 1.0 | GO:0044396 | actin cortical patch assembly(GO:0000147) actin cortical patch organization(GO:0044396) |
| 0.1 | 1.3 | GO:0034620 | endoplasmic reticulum unfolded protein response(GO:0030968) cellular response to unfolded protein(GO:0034620) |
| 0.1 | 0.9 | GO:0006446 | regulation of translational initiation(GO:0006446) |
| 0.1 | 0.2 | GO:0000492 | box C/D snoRNP assembly(GO:0000492) |
| 0.1 | 0.8 | GO:0034249 | negative regulation of translation(GO:0017148) negative regulation of cellular amide metabolic process(GO:0034249) |
| 0.1 | 0.7 | GO:0006474 | N-terminal protein amino acid acetylation(GO:0006474) |
| 0.1 | 1.4 | GO:0006469 | negative regulation of protein kinase activity(GO:0006469) |
| 0.1 | 0.4 | GO:0043433 | negative regulation of sequence-specific DNA binding transcription factor activity(GO:0043433) |
| 0.1 | 0.5 | GO:0006783 | porphyrin-containing compound biosynthetic process(GO:0006779) heme biosynthetic process(GO:0006783) tetrapyrrole biosynthetic process(GO:0033014) |
| 0.1 | 1.3 | GO:0010038 | response to metal ion(GO:0010038) |
| 0.1 | 0.3 | GO:0070588 | calcium ion transmembrane transport(GO:0070588) |
| 0.1 | 0.4 | GO:0046351 | trehalose biosynthetic process(GO:0005992) oligosaccharide biosynthetic process(GO:0009312) disaccharide biosynthetic process(GO:0046351) |
| 0.1 | 0.4 | GO:0006549 | isoleucine metabolic process(GO:0006549) branched-chain amino acid biosynthetic process(GO:0009082) |
| 0.1 | 0.2 | GO:0015693 | magnesium ion transport(GO:0015693) |
| 0.1 | 0.4 | GO:0000743 | nuclear migration involved in conjugation with cellular fusion(GO:0000743) |
| 0.1 | 2.0 | GO:0045047 | protein targeting to ER(GO:0045047) |
| 0.1 | 0.3 | GO:0006621 | protein retention in ER lumen(GO:0006621) maintenance of protein localization in endoplasmic reticulum(GO:0035437) |
| 0.1 | 0.3 | GO:0034354 | 'de novo' NAD biosynthetic process from tryptophan(GO:0034354) 'de novo' NAD biosynthetic process(GO:0034627) |
| 0.1 | 0.2 | GO:0006654 | phosphatidic acid biosynthetic process(GO:0006654) phosphatidic acid metabolic process(GO:0046473) |
| 0.1 | 1.5 | GO:0000054 | ribosomal subunit export from nucleus(GO:0000054) ribosome localization(GO:0033750) establishment of ribosome localization(GO:0033753) rRNA-containing ribonucleoprotein complex export from nucleus(GO:0071428) |
| 0.1 | 1.1 | GO:0031163 | iron-sulfur cluster assembly(GO:0016226) metallo-sulfur cluster assembly(GO:0031163) |
| 0.1 | 0.1 | GO:0043634 | polyadenylation-dependent ncRNA catabolic process(GO:0043634) nuclear ncRNA surveillance(GO:0071029) nuclear polyadenylation-dependent rRNA catabolic process(GO:0071035) nuclear polyadenylation-dependent ncRNA catabolic process(GO:0071046) |
| 0.1 | 0.5 | GO:0030011 | maintenance of cell polarity(GO:0030011) |
| 0.1 | 0.5 | GO:0000921 | septin ring assembly(GO:0000921) |
| 0.1 | 0.8 | GO:0032986 | nucleosome disassembly(GO:0006337) chromatin disassembly(GO:0031498) protein-DNA complex disassembly(GO:0032986) |
| 0.1 | 0.3 | GO:0055069 | cellular zinc ion homeostasis(GO:0006882) zinc ion homeostasis(GO:0055069) |
| 0.1 | 0.2 | GO:0060277 | obsolete negative regulation of transcription involved in G1 phase of mitotic cell cycle(GO:0060277) |
| 0.1 | 0.2 | GO:0000957 | mitochondrial RNA catabolic process(GO:0000957) |
| 0.1 | 0.7 | GO:0031110 | regulation of microtubule polymerization or depolymerization(GO:0031110) |
| 0.1 | 1.6 | GO:0051170 | protein import into nucleus(GO:0006606) nuclear import(GO:0051170) single-organism nuclear import(GO:1902593) |
| 0.0 | 0.3 | GO:0006855 | drug transmembrane transport(GO:0006855) |
| 0.0 | 0.1 | GO:0071456 | cellular response to hypoxia(GO:0071456) |
| 0.0 | 1.9 | GO:0006400 | tRNA modification(GO:0006400) |
| 0.0 | 0.7 | GO:0001100 | negative regulation of exit from mitosis(GO:0001100) |
| 0.0 | 0.4 | GO:0016973 | poly(A)+ mRNA export from nucleus(GO:0016973) |
| 0.0 | 0.4 | GO:0000742 | karyogamy involved in conjugation with cellular fusion(GO:0000742) |
| 0.0 | 0.1 | GO:0006458 | 'de novo' protein folding(GO:0006458) |
| 0.0 | 0.1 | GO:0016320 | endoplasmic reticulum membrane fusion(GO:0016320) |
| 0.0 | 0.9 | GO:0042254 | ribosome biogenesis(GO:0042254) |
| 0.0 | 0.2 | GO:0018344 | protein geranylgeranylation(GO:0018344) |
| 0.0 | 0.2 | GO:0042435 | tryptophan biosynthetic process(GO:0000162) indole-containing compound biosynthetic process(GO:0042435) indolalkylamine biosynthetic process(GO:0046219) |
| 0.0 | 0.2 | GO:0006493 | protein O-linked glycosylation(GO:0006493) |
| 0.0 | 0.2 | GO:0034503 | protein localization to nucleolar rDNA repeats(GO:0034503) |
| 0.0 | 0.2 | GO:0015883 | FAD transport(GO:0015883) |
| 0.0 | 0.3 | GO:0006797 | polyphosphate metabolic process(GO:0006797) |
| 0.0 | 0.5 | GO:0006891 | intra-Golgi vesicle-mediated transport(GO:0006891) |
| 0.0 | 0.2 | GO:0043457 | regulation of cellular respiration(GO:0043457) |
| 0.0 | 2.5 | GO:0006888 | ER to Golgi vesicle-mediated transport(GO:0006888) |
| 0.0 | 0.9 | GO:0006487 | protein N-linked glycosylation(GO:0006487) |
| 0.0 | 0.1 | GO:0070868 | heterochromatin organization involved in chromatin silencing(GO:0070868) chromatin organization involved in negative regulation of transcription(GO:0097549) |
| 0.0 | 0.1 | GO:0007329 | positive regulation of transcription from RNA polymerase II promoter by pheromones(GO:0007329) positive regulation of transcription by pheromones(GO:0009371) |
| 0.0 | 0.1 | GO:0009411 | response to UV(GO:0009411) |
| 0.0 | 0.6 | GO:0000422 | mitophagy(GO:0000422) mitochondrion disassembly(GO:0061726) |
| 0.0 | 0.2 | GO:0006771 | riboflavin metabolic process(GO:0006771) riboflavin biosynthetic process(GO:0009231) |
| 0.0 | 0.1 | GO:0045836 | positive regulation of meiotic nuclear division(GO:0045836) positive regulation of meiotic cell cycle(GO:0051446) |
| 0.0 | 0.2 | GO:0009303 | rRNA transcription(GO:0009303) |
| 0.0 | 0.3 | GO:0008298 | intracellular mRNA localization(GO:0008298) |
| 0.0 | 0.1 | GO:0046341 | CDP-diacylglycerol biosynthetic process(GO:0016024) CDP-diacylglycerol metabolic process(GO:0046341) |
| 0.0 | 0.2 | GO:0009395 | phospholipid catabolic process(GO:0009395) |
| 0.0 | 0.3 | GO:0007076 | mitotic chromosome condensation(GO:0007076) |
| 0.0 | 0.1 | GO:0010978 | gene silencing involved in chronological cell aging(GO:0010978) gene silencing by RNA(GO:0031047) |
| 0.0 | 0.2 | GO:0007009 | plasma membrane organization(GO:0007009) |
| 0.0 | 0.2 | GO:0035335 | peptidyl-tyrosine dephosphorylation(GO:0035335) |
| 0.0 | 0.1 | GO:0048255 | RNA stabilization(GO:0043489) mRNA stabilization(GO:0048255) |
| 0.0 | 0.0 | GO:0009249 | protein lipoylation(GO:0009249) |
| 0.0 | 0.1 | GO:0006517 | protein deglycosylation(GO:0006517) |
| 0.0 | 0.8 | GO:0006333 | chromatin assembly or disassembly(GO:0006333) |
| 0.0 | 0.1 | GO:1903726 | negative regulation of phospholipid biosynthetic process(GO:0071072) negative regulation of phospholipid metabolic process(GO:1903726) |
| 0.0 | 0.1 | GO:0000372 | Group I intron splicing(GO:0000372) RNA splicing, via transesterification reactions with guanosine as nucleophile(GO:0000376) |
| 0.0 | 0.4 | GO:0032511 | late endosome to vacuole transport via multivesicular body sorting pathway(GO:0032511) |
| 0.0 | 0.1 | GO:0015740 | C4-dicarboxylate transport(GO:0015740) |
| 0.0 | 0.3 | GO:0042147 | retrograde transport, endosome to Golgi(GO:0042147) |
| 0.0 | 0.1 | GO:0007323 | peptide pheromone maturation(GO:0007323) |
| 0.0 | 0.1 | GO:0000350 | generation of catalytic spliceosome for second transesterification step(GO:0000350) |
| 0.0 | 0.1 | GO:0006114 | glycerol biosynthetic process(GO:0006114) alditol biosynthetic process(GO:0019401) |
| 0.0 | 0.3 | GO:0030150 | protein import into mitochondrial matrix(GO:0030150) |
| 0.0 | 0.2 | GO:0010499 | proteasomal ubiquitin-independent protein catabolic process(GO:0010499) |
| 0.0 | 0.2 | GO:0006749 | glutathione metabolic process(GO:0006749) |
| 0.0 | 0.2 | GO:0043094 | cellular metabolic compound salvage(GO:0043094) |
| 0.0 | 0.1 | GO:0055070 | cellular copper ion homeostasis(GO:0006878) copper ion homeostasis(GO:0055070) |
| 0.0 | 0.2 | GO:0006283 | transcription-coupled nucleotide-excision repair(GO:0006283) |
| 0.0 | 0.1 | GO:0006086 | acetyl-CoA biosynthetic process from pyruvate(GO:0006086) |
| 0.0 | 0.1 | GO:0000707 | meiotic DNA recombinase assembly(GO:0000707) DNA recombinase assembly(GO:0000730) |
| 0.0 | 0.1 | GO:0016574 | histone ubiquitination(GO:0016574) |
| 0.0 | 0.1 | GO:0000379 | tRNA-type intron splice site recognition and cleavage(GO:0000379) |
| 0.0 | 0.0 | GO:0009435 | NAD biosynthetic process(GO:0009435) |
| 0.0 | 0.1 | GO:0051320 | mitotic S phase(GO:0000084) S phase(GO:0051320) |
| 0.0 | 1.0 | GO:0032543 | mitochondrial translation(GO:0032543) |
| 0.0 | 0.0 | GO:0043619 | regulation of transcription from RNA polymerase II promoter in response to oxidative stress(GO:0043619) |
| 0.0 | 0.1 | GO:0032889 | regulation of vacuole fusion, non-autophagic(GO:0032889) regulation of vacuole organization(GO:0044088) |
| 0.0 | 0.1 | GO:0070816 | phosphorylation of RNA polymerase II C-terminal domain(GO:0070816) |
Gene overrepresentation in cellular component category:
| Log-likelihood per target | Total log-likelihood | Term | Description |
|---|---|---|---|
| 1.6 | 4.7 | GO:0032299 | ribonuclease H2 complex(GO:0032299) |
| 1.0 | 5.2 | GO:0005853 | eukaryotic translation elongation factor 1 complex(GO:0005853) |
| 1.0 | 3.0 | GO:0005854 | nascent polypeptide-associated complex(GO:0005854) |
| 1.0 | 2.9 | GO:0070545 | PeBoW complex(GO:0070545) |
| 0.7 | 2.2 | GO:0000814 | ESCRT II complex(GO:0000814) |
| 0.6 | 6.8 | GO:0030688 | preribosome, small subunit precursor(GO:0030688) |
| 0.6 | 5.1 | GO:0000144 | cellular bud neck septin ring(GO:0000144) |
| 0.5 | 1.6 | GO:0071261 | Ssh1 translocon complex(GO:0071261) |
| 0.5 | 1.8 | GO:0005834 | heterotrimeric G-protein complex(GO:0005834) |
| 0.4 | 1.8 | GO:0005793 | endoplasmic reticulum-Golgi intermediate compartment(GO:0005793) |
| 0.4 | 5.1 | GO:0005736 | DNA-directed RNA polymerase I complex(GO:0005736) |
| 0.4 | 2.1 | GO:0043527 | tRNA methyltransferase complex(GO:0043527) |
| 0.3 | 1.6 | GO:0000408 | EKC/KEOPS complex(GO:0000408) |
| 0.3 | 0.8 | GO:0097344 | Rix1 complex(GO:0097344) |
| 0.3 | 0.5 | GO:0030008 | TRAPP complex(GO:0030008) |
| 0.3 | 10.0 | GO:0005811 | lipid particle(GO:0005811) |
| 0.3 | 0.5 | GO:0008541 | proteasome regulatory particle, lid subcomplex(GO:0008541) |
| 0.3 | 1.8 | GO:0033180 | vacuolar proton-transporting V-type ATPase, V1 domain(GO:0000221) proton-transporting V-type ATPase, V1 domain(GO:0033180) |
| 0.2 | 1.9 | GO:0071014 | post-mRNA release spliceosomal complex(GO:0071014) |
| 0.2 | 0.9 | GO:0031207 | endoplasmic reticulum Sec complex(GO:0031205) Sec62/Sec63 complex(GO:0031207) |
| 0.2 | 0.9 | GO:0044611 | nuclear pore inner ring(GO:0044611) |
| 0.2 | 0.7 | GO:0030689 | Noc complex(GO:0030689) |
| 0.2 | 13.1 | GO:0022627 | cytosolic small ribosomal subunit(GO:0022627) |
| 0.2 | 7.5 | GO:0030134 | ER to Golgi transport vesicle(GO:0030134) |
| 0.2 | 1.1 | GO:0034518 | RNA cap binding complex(GO:0034518) |
| 0.2 | 0.6 | GO:0031415 | NatA complex(GO:0031415) |
| 0.2 | 16.1 | GO:0022625 | cytosolic large ribosomal subunit(GO:0022625) |
| 0.2 | 0.9 | GO:0005851 | eukaryotic translation initiation factor 2B complex(GO:0005851) |
| 0.2 | 0.6 | GO:0009331 | glycerol-3-phosphate dehydrogenase complex(GO:0009331) |
| 0.2 | 0.7 | GO:0001401 | mitochondrial sorting and assembly machinery complex(GO:0001401) |
| 0.2 | 2.2 | GO:0022626 | cytosolic ribosome(GO:0022626) |
| 0.2 | 0.6 | GO:0031428 | box C/D snoRNP complex(GO:0031428) |
| 0.2 | 0.8 | GO:0005663 | DNA replication factor C complex(GO:0005663) Rad17 RFC-like complex(GO:0031389) Elg1 RFC-like complex(GO:0031391) |
| 0.2 | 0.6 | GO:0034990 | mitotic cohesin complex(GO:0030892) nuclear mitotic cohesin complex(GO:0034990) |
| 0.1 | 0.4 | GO:0000015 | phosphopyruvate hydratase complex(GO:0000015) |
| 0.1 | 0.4 | GO:0033186 | CAF-1 complex(GO:0033186) |
| 0.1 | 0.9 | GO:0034455 | t-UTP complex(GO:0034455) |
| 0.1 | 0.4 | GO:0045298 | polar microtubule(GO:0005827) tubulin complex(GO:0045298) |
| 0.1 | 1.0 | GO:0005852 | eukaryotic translation initiation factor 3 complex(GO:0005852) |
| 0.1 | 0.8 | GO:0017059 | serine C-palmitoyltransferase complex(GO:0017059) SPOTS complex(GO:0035339) |
| 0.1 | 2.6 | GO:0030133 | transport vesicle(GO:0030133) |
| 0.1 | 4.7 | GO:0030176 | integral component of endoplasmic reticulum membrane(GO:0030176) |
| 0.1 | 1.3 | GO:0016514 | SWI/SNF complex(GO:0016514) BAF-type complex(GO:0090544) |
| 0.1 | 2.7 | GO:0005844 | polysome(GO:0005844) |
| 0.1 | 0.5 | GO:0005641 | nuclear envelope lumen(GO:0005641) |
| 0.1 | 0.5 | GO:0044615 | nuclear pore nuclear basket(GO:0044615) |
| 0.1 | 1.2 | GO:0034399 | nuclear periphery(GO:0034399) |
| 0.1 | 0.4 | GO:0005946 | alpha,alpha-trehalose-phosphate synthase complex (UDP-forming)(GO:0005946) |
| 0.1 | 0.9 | GO:0005666 | DNA-directed RNA polymerase III complex(GO:0005666) |
| 0.1 | 1.9 | GO:0005849 | mRNA cleavage factor complex(GO:0005849) |
| 0.1 | 0.7 | GO:0008250 | oligosaccharyltransferase complex(GO:0008250) |
| 0.1 | 1.3 | GO:0019005 | SCF ubiquitin ligase complex(GO:0019005) |
| 0.1 | 0.6 | GO:0032432 | actin filament bundle(GO:0032432) |
| 0.1 | 0.9 | GO:0048471 | perinuclear region of cytoplasm(GO:0048471) |
| 0.1 | 0.5 | GO:0048500 | signal recognition particle, endoplasmic reticulum targeting(GO:0005786) signal recognition particle(GO:0048500) |
| 0.1 | 1.0 | GO:0005744 | mitochondrial inner membrane presequence translocase complex(GO:0005744) |
| 0.1 | 1.0 | GO:0005779 | integral component of peroxisomal membrane(GO:0005779) intrinsic component of peroxisomal membrane(GO:0031231) |
| 0.1 | 26.2 | GO:0005783 | endoplasmic reticulum(GO:0005783) |
| 0.1 | 0.2 | GO:0005825 | half bridge of spindle pole body(GO:0005825) |
| 0.1 | 0.2 | GO:1990316 | ATG1/ULK1 kinase complex(GO:1990316) |
| 0.1 | 0.2 | GO:0032045 | guanyl-nucleotide exchange factor complex(GO:0032045) |
| 0.1 | 2.6 | GO:0030687 | preribosome, large subunit precursor(GO:0030687) |
| 0.1 | 0.2 | GO:0031518 | CBF3 complex(GO:0031518) |
| 0.1 | 0.6 | GO:0042597 | periplasmic space(GO:0042597) |
| 0.1 | 0.3 | GO:0070209 | ASTRA complex(GO:0070209) |
| 0.1 | 0.2 | GO:0043625 | delta DNA polymerase complex(GO:0043625) |
| 0.1 | 15.2 | GO:0005829 | cytosol(GO:0005829) |
| 0.1 | 0.2 | GO:0031315 | extrinsic component of mitochondrial outer membrane(GO:0031315) |
| 0.1 | 0.1 | GO:0000111 | nucleotide-excision repair factor 2 complex(GO:0000111) |
| 0.1 | 0.3 | GO:0017053 | transcriptional repressor complex(GO:0017053) |
| 0.1 | 0.5 | GO:0017119 | Golgi transport complex(GO:0017119) |
| 0.1 | 5.4 | GO:0043332 | mating projection tip(GO:0043332) |
| 0.1 | 0.4 | GO:0005665 | DNA-directed RNA polymerase II, core complex(GO:0005665) |
| 0.1 | 0.6 | GO:0042729 | DASH complex(GO:0042729) |
| 0.1 | 2.0 | GO:0015935 | small ribosomal subunit(GO:0015935) |
| 0.1 | 1.3 | GO:0032040 | small-subunit processome(GO:0032040) |
| 0.1 | 0.4 | GO:0000346 | transcription export complex(GO:0000346) |
| 0.1 | 0.1 | GO:0034274 | Atg12-Atg5-Atg16 complex(GO:0034274) |
| 0.1 | 0.2 | GO:0000811 | GINS complex(GO:0000811) |
| 0.1 | 0.3 | GO:0005871 | kinesin complex(GO:0005871) |
| 0.1 | 0.2 | GO:0030869 | RENT complex(GO:0030869) |
| 0.1 | 1.0 | GO:0000131 | incipient cellular bud site(GO:0000131) |
| 0.0 | 0.2 | GO:0033597 | mitotic checkpoint complex(GO:0033597) |
| 0.0 | 0.3 | GO:0030126 | COPI vesicle coat(GO:0030126) |
| 0.0 | 0.2 | GO:0000938 | GARP complex(GO:0000938) |
| 0.0 | 0.5 | GO:0000176 | nuclear exosome (RNase complex)(GO:0000176) |
| 0.0 | 0.3 | GO:0005688 | U6 snRNP(GO:0005688) |
| 0.0 | 0.1 | GO:0005850 | eukaryotic translation initiation factor 2 complex(GO:0005850) |
| 0.0 | 0.1 | GO:0000220 | vacuolar proton-transporting V-type ATPase, V0 domain(GO:0000220) proton-transporting V-type ATPase, V0 domain(GO:0033179) |
| 0.0 | 0.2 | GO:0000439 | core TFIIH complex(GO:0000439) |
| 0.0 | 0.2 | GO:0005801 | cis-Golgi network(GO:0005801) |
| 0.0 | 0.5 | GO:0016586 | RSC complex(GO:0016586) |
| 0.0 | 2.0 | GO:0005635 | nuclear envelope(GO:0005635) |
| 0.0 | 3.8 | GO:0005730 | nucleolus(GO:0005730) |
| 0.0 | 0.4 | GO:0005802 | trans-Golgi network(GO:0005802) |
| 0.0 | 0.1 | GO:0070823 | HDA1 complex(GO:0070823) |
| 0.0 | 0.5 | GO:0005887 | integral component of plasma membrane(GO:0005887) |
| 0.0 | 0.1 | GO:0030907 | MBF transcription complex(GO:0030907) |
| 0.0 | 0.2 | GO:0005778 | peroxisomal membrane(GO:0005778) microbody membrane(GO:0031903) |
| 0.0 | 0.1 | GO:0042555 | MCM complex(GO:0042555) |
| 0.0 | 0.1 | GO:0031414 | N-terminal protein acetyltransferase complex(GO:0031414) |
| 0.0 | 0.1 | GO:0008622 | epsilon DNA polymerase complex(GO:0008622) |
| 0.0 | 0.3 | GO:0031306 | intrinsic component of mitochondrial outer membrane(GO:0031306) integral component of mitochondrial outer membrane(GO:0031307) |
| 0.0 | 0.1 | GO:0045254 | mitochondrial pyruvate dehydrogenase complex(GO:0005967) pyruvate dehydrogenase complex(GO:0045254) |
| 0.0 | 0.2 | GO:0000502 | proteasome complex(GO:0000502) |
| 0.0 | 0.1 | GO:0000214 | tRNA-intron endonuclease complex(GO:0000214) |
| 0.0 | 0.1 | GO:0000243 | commitment complex(GO:0000243) |
| 0.0 | 0.3 | GO:0005741 | mitochondrial outer membrane(GO:0005741) outer membrane(GO:0019867) organelle outer membrane(GO:0031968) |
Gene overrepresentation in molecular function category:
| Log-likelihood per target | Total log-likelihood | Term | Description |
|---|---|---|---|
| 2.9 | 8.6 | GO:0015166 | polyol transmembrane transporter activity(GO:0015166) |
| 2.4 | 7.3 | GO:0016872 | intramolecular lyase activity(GO:0016872) |
| 2.0 | 8.0 | GO:0016417 | S-acyltransferase activity(GO:0016417) |
| 1.5 | 6.1 | GO:0019206 | nucleoside kinase activity(GO:0019206) |
| 1.4 | 7.1 | GO:0017169 | CDP-alcohol phosphatidyltransferase activity(GO:0017169) |
| 1.2 | 4.9 | GO:0016841 | ammonia-lyase activity(GO:0016841) racemase and epimerase activity(GO:0016854) |
| 1.2 | 4.7 | GO:0004523 | RNA-DNA hybrid ribonuclease activity(GO:0004523) |
| 1.2 | 3.5 | GO:0009922 | fatty acid elongase activity(GO:0009922) |
| 1.1 | 6.5 | GO:0016846 | carbon-sulfur lyase activity(GO:0016846) |
| 1.0 | 6.3 | GO:0003906 | DNA-(apurinic or apyrimidinic site) lyase activity(GO:0003906) |
| 1.0 | 3.0 | GO:0008897 | holo-[acyl-carrier-protein] synthase activity(GO:0008897) |
| 0.9 | 2.7 | GO:0070567 | cytidylyltransferase activity(GO:0070567) |
| 0.8 | 3.4 | GO:0015665 | alcohol transmembrane transporter activity(GO:0015665) |
| 0.7 | 0.7 | GO:0008309 | double-stranded DNA exodeoxyribonuclease activity(GO:0008309) |
| 0.7 | 2.7 | GO:0016634 | oxidoreductase activity, acting on the CH-CH group of donors, oxygen as acceptor(GO:0016634) |
| 0.7 | 2.6 | GO:0004467 | long-chain fatty acid-CoA ligase activity(GO:0004467) |
| 0.6 | 2.6 | GO:0015146 | pentose transmembrane transporter activity(GO:0015146) |
| 0.6 | 1.2 | GO:0016840 | carbon-nitrogen lyase activity(GO:0016840) |
| 0.6 | 1.9 | GO:0004809 | tRNA (guanine-N2-)-methyltransferase activity(GO:0004809) |
| 0.6 | 1.7 | GO:0019202 | amino acid kinase activity(GO:0019202) |
| 0.5 | 2.2 | GO:0016885 | ligase activity, forming carbon-carbon bonds(GO:0016885) |
| 0.5 | 1.5 | GO:0003938 | IMP dehydrogenase activity(GO:0003938) |
| 0.5 | 1.5 | GO:0016838 | carbon-oxygen lyase activity, acting on phosphates(GO:0016838) |
| 0.5 | 7.0 | GO:0003746 | translation elongation factor activity(GO:0003746) |
| 0.5 | 1.4 | GO:0051219 | phosphoprotein binding(GO:0051219) |
| 0.5 | 10.6 | GO:0008170 | N-methyltransferase activity(GO:0008170) |
| 0.5 | 16.4 | GO:0016765 | transferase activity, transferring alkyl or aryl (other than methyl) groups(GO:0016765) |
| 0.5 | 1.4 | GO:0004100 | chitin synthase activity(GO:0004100) |
| 0.4 | 1.3 | GO:0010521 | telomerase inhibitor activity(GO:0010521) |
| 0.4 | 1.2 | GO:0050839 | cell adhesion molecule binding(GO:0050839) |
| 0.4 | 1.9 | GO:0034318 | alcohol O-acetyltransferase activity(GO:0004026) alcohol O-acyltransferase activity(GO:0034318) |
| 0.4 | 4.2 | GO:0051213 | dioxygenase activity(GO:0051213) |
| 0.4 | 1.5 | GO:0000297 | spermine transmembrane transporter activity(GO:0000297) |
| 0.4 | 5.1 | GO:0001054 | RNA polymerase I activity(GO:0001054) |
| 0.3 | 2.0 | GO:0003993 | acid phosphatase activity(GO:0003993) |
| 0.3 | 1.0 | GO:0034596 | phosphatidylinositol phosphate 4-phosphatase activity(GO:0034596) phosphatidylinositol-4-phosphate phosphatase activity(GO:0043812) |
| 0.3 | 1.3 | GO:0003747 | translation release factor activity(GO:0003747) translation termination factor activity(GO:0008079) |
| 0.3 | 2.2 | GO:0008379 | thioredoxin peroxidase activity(GO:0008379) |
| 0.3 | 0.9 | GO:0008097 | 5S rRNA binding(GO:0008097) |
| 0.3 | 1.5 | GO:0016655 | oxidoreductase activity, acting on NAD(P)H, quinone or similar compound as acceptor(GO:0016655) |
| 0.3 | 2.3 | GO:0016861 | intramolecular oxidoreductase activity, interconverting aldoses and ketoses(GO:0016861) |
| 0.3 | 1.4 | GO:0000033 | alpha-1,3-mannosyltransferase activity(GO:0000033) |
| 0.3 | 0.8 | GO:0043023 | ribosomal large subunit binding(GO:0043023) |
| 0.3 | 1.6 | GO:0008106 | aldo-keto reductase (NADP) activity(GO:0004033) alcohol dehydrogenase (NADP+) activity(GO:0008106) |
| 0.3 | 1.4 | GO:0008536 | Ran GTPase binding(GO:0008536) |
| 0.3 | 0.8 | GO:0031370 | eukaryotic initiation factor 4G binding(GO:0031370) |
| 0.3 | 0.8 | GO:0016671 | oxidoreductase activity, acting on a sulfur group of donors, disulfide as acceptor(GO:0016671) |
| 0.3 | 5.7 | GO:0016836 | hydro-lyase activity(GO:0016836) |
| 0.3 | 1.0 | GO:0004622 | lysophospholipase activity(GO:0004622) |
| 0.2 | 1.0 | GO:0008172 | S-methyltransferase activity(GO:0008172) |
| 0.2 | 0.7 | GO:0033592 | RNA strand annealing activity(GO:0033592) annealing activity(GO:0097617) |
| 0.2 | 2.2 | GO:0019239 | deaminase activity(GO:0019239) |
| 0.2 | 8.6 | GO:0004553 | hydrolase activity, hydrolyzing O-glycosyl compounds(GO:0004553) |
| 0.2 | 0.8 | GO:0015037 | glutathione-disulfide reductase activity(GO:0004362) peptide disulfide oxidoreductase activity(GO:0015037) glutathione disulfide oxidoreductase activity(GO:0015038) |
| 0.2 | 0.4 | GO:0001181 | transcription factor activity, core RNA polymerase I binding(GO:0001181) |
| 0.2 | 1.4 | GO:0005086 | ARF guanyl-nucleotide exchange factor activity(GO:0005086) |
| 0.2 | 1.9 | GO:0005216 | ion channel activity(GO:0005216) |
| 0.2 | 0.6 | GO:0000339 | RNA cap binding(GO:0000339) |
| 0.2 | 1.7 | GO:0001133 | RNA polymerase II transcription factor activity, sequence-specific transcription regulatory region DNA binding(GO:0001133) |
| 0.2 | 1.6 | GO:0004497 | monooxygenase activity(GO:0004497) |
| 0.2 | 0.6 | GO:0036002 | pre-mRNA binding(GO:0036002) |
| 0.2 | 6.0 | GO:0019843 | rRNA binding(GO:0019843) |
| 0.1 | 0.7 | GO:0070546 | L-phenylalanine aminotransferase activity(GO:0070546) L-phenylalanine:2-oxoglutarate aminotransferase activity(GO:0080130) |
| 0.1 | 0.4 | GO:0003841 | 1-acylglycerol-3-phosphate O-acyltransferase activity(GO:0003841) |
| 0.1 | 1.6 | GO:0004860 | protein kinase inhibitor activity(GO:0004860) |
| 0.1 | 1.7 | GO:0030276 | clathrin binding(GO:0030276) |
| 0.1 | 1.4 | GO:0031490 | chromatin DNA binding(GO:0031490) |
| 0.1 | 0.3 | GO:0017070 | U6 snRNA binding(GO:0017070) |
| 0.1 | 0.4 | GO:0016832 | aldehyde-lyase activity(GO:0016832) |
| 0.1 | 1.0 | GO:0019201 | nucleotide kinase activity(GO:0019201) |
| 0.1 | 5.5 | GO:0030674 | protein binding, bridging(GO:0030674) |
| 0.1 | 0.7 | GO:0030943 | mitochondrion targeting sequence binding(GO:0030943) |
| 0.1 | 23.5 | GO:0003735 | structural constituent of ribosome(GO:0003735) |
| 0.1 | 0.8 | GO:0033170 | DNA clamp loader activity(GO:0003689) protein-DNA loading ATPase activity(GO:0033170) |
| 0.1 | 0.8 | GO:0070300 | phosphatidic acid binding(GO:0070300) |
| 0.1 | 0.6 | GO:0003705 | transcription factor activity, RNA polymerase II distal enhancer sequence-specific binding(GO:0003705) |
| 0.1 | 3.7 | GO:0004004 | ATP-dependent RNA helicase activity(GO:0004004) |
| 0.1 | 0.4 | GO:0003825 | alpha,alpha-trehalose-phosphate synthase (UDP-forming) activity(GO:0003825) |
| 0.1 | 0.4 | GO:0048038 | quinone binding(GO:0048038) |
| 0.1 | 0.4 | GO:0070568 | guanylyltransferase activity(GO:0070568) |
| 0.1 | 1.7 | GO:0042803 | protein homodimerization activity(GO:0042803) |
| 0.1 | 0.5 | GO:0034450 | ubiquitin-ubiquitin ligase activity(GO:0034450) |
| 0.1 | 3.9 | GO:0016875 | aminoacyl-tRNA ligase activity(GO:0004812) ligase activity, forming carbon-oxygen bonds(GO:0016875) ligase activity, forming aminoacyl-tRNA and related compounds(GO:0016876) |
| 0.1 | 2.1 | GO:0051087 | chaperone binding(GO:0051087) |
| 0.1 | 0.5 | GO:0004749 | ribose phosphate diphosphokinase activity(GO:0004749) |
| 0.1 | 0.5 | GO:0008312 | 7S RNA binding(GO:0008312) |
| 0.1 | 0.4 | GO:0004614 | phosphoglucomutase activity(GO:0004614) |
| 0.1 | 0.5 | GO:0004679 | AMP-activated protein kinase activity(GO:0004679) |
| 0.1 | 0.8 | GO:0003727 | single-stranded RNA binding(GO:0003727) |
| 0.1 | 1.1 | GO:0005048 | signal sequence binding(GO:0005048) |
| 0.1 | 0.9 | GO:0001056 | RNA polymerase III activity(GO:0001056) |
| 0.1 | 0.7 | GO:0004576 | oligosaccharyl transferase activity(GO:0004576) dolichyl-diphosphooligosaccharide-protein glycotransferase activity(GO:0004579) |
| 0.1 | 0.4 | GO:0001132 | RNA polymerase II transcription factor activity, TBP-class protein binding, involved in preinitiation complex assembly(GO:0001129) RNA polymerase II transcription factor activity, TBP-class protein binding(GO:0001132) |
| 0.1 | 0.9 | GO:0001671 | ATPase activator activity(GO:0001671) |
| 0.1 | 0.7 | GO:0004596 | peptide alpha-N-acetyltransferase activity(GO:0004596) |
| 0.1 | 0.4 | GO:0004707 | MAP kinase activity(GO:0004707) |
| 0.1 | 0.4 | GO:0042123 | glucanosyltransferase activity(GO:0042123) 1,3-beta-glucanosyltransferase activity(GO:0042124) |
| 0.1 | 0.4 | GO:0018456 | aryl-alcohol dehydrogenase (NAD+) activity(GO:0018456) |
| 0.1 | 2.4 | GO:0003779 | actin binding(GO:0003779) |
| 0.1 | 0.2 | GO:0004602 | glutathione peroxidase activity(GO:0004602) phospholipid-hydroperoxide glutathione peroxidase activity(GO:0047066) |
| 0.1 | 2.1 | GO:0003743 | translation initiation factor activity(GO:0003743) |
| 0.1 | 0.8 | GO:0005199 | structural constituent of cell wall(GO:0005199) |
| 0.1 | 0.4 | GO:0019211 | phosphatase activator activity(GO:0019211) |
| 0.1 | 3.7 | GO:0003924 | GTPase activity(GO:0003924) |
| 0.1 | 0.2 | GO:0097027 | ubiquitin-protein transferase activator activity(GO:0097027) |
| 0.1 | 3.7 | GO:0051082 | unfolded protein binding(GO:0051082) |
| 0.1 | 0.5 | GO:0032934 | steroid binding(GO:0005496) sterol binding(GO:0032934) |
| 0.1 | 0.2 | GO:0004128 | cytochrome-b5 reductase activity, acting on NAD(P)H(GO:0004128) |
| 0.1 | 0.3 | GO:0001139 | transcription factor activity, core RNA polymerase II recruiting(GO:0001139) |
| 0.1 | 0.3 | GO:0016423 | tRNA (guanine) methyltransferase activity(GO:0016423) |
| 0.1 | 0.5 | GO:0017112 | Rab guanyl-nucleotide exchange factor activity(GO:0017112) |
| 0.1 | 0.6 | GO:0046906 | heme binding(GO:0020037) tetrapyrrole binding(GO:0046906) |
| 0.1 | 0.2 | GO:0008310 | single-stranded DNA exodeoxyribonuclease activity(GO:0008297) single-stranded DNA 3'-5' exodeoxyribonuclease activity(GO:0008310) |
| 0.1 | 2.0 | GO:0000030 | mannosyltransferase activity(GO:0000030) |
| 0.1 | 0.3 | GO:0008443 | phosphofructokinase activity(GO:0008443) |
| 0.1 | 0.3 | GO:0003923 | GPI-anchor transamidase activity(GO:0003923) |
| 0.1 | 0.2 | GO:0043141 | 5'-3' DNA helicase activity(GO:0043139) ATP-dependent 5'-3' DNA helicase activity(GO:0043141) |
| 0.0 | 0.3 | GO:0019237 | centromeric DNA binding(GO:0019237) |
| 0.0 | 0.4 | GO:0005516 | calmodulin binding(GO:0005516) |
| 0.0 | 0.2 | GO:0050072 | m7G(5')pppN diphosphatase activity(GO:0050072) |
| 0.0 | 0.7 | GO:0015616 | DNA translocase activity(GO:0015616) |
| 0.0 | 0.6 | GO:0003714 | transcription corepressor activity(GO:0003714) |
| 0.0 | 1.0 | GO:0005085 | guanyl-nucleotide exchange factor activity(GO:0005085) |
| 0.0 | 0.5 | GO:0046912 | transferase activity, transferring acyl groups, acyl groups converted into alkyl on transfer(GO:0046912) |
| 0.0 | 0.4 | GO:0019209 | kinase activator activity(GO:0019209) protein kinase activator activity(GO:0030295) |
| 0.0 | 0.1 | GO:0005519 | cytoskeletal regulatory protein binding(GO:0005519) |
| 0.0 | 0.3 | GO:0004012 | phospholipid-translocating ATPase activity(GO:0004012) |
| 0.0 | 0.2 | GO:0008526 | phosphatidylcholine transporter activity(GO:0008525) phosphatidylinositol transporter activity(GO:0008526) |
| 0.0 | 0.2 | GO:0015230 | FAD transmembrane transporter activity(GO:0015230) |
| 0.0 | 1.0 | GO:0004722 | protein serine/threonine phosphatase activity(GO:0004722) |
| 0.0 | 0.1 | GO:0019776 | Atg8 ligase activity(GO:0019776) |
| 0.0 | 1.2 | GO:0043130 | ubiquitin binding(GO:0043130) |
| 0.0 | 0.3 | GO:0019904 | protein domain specific binding(GO:0019904) |
| 0.0 | 0.1 | GO:0016531 | copper chaperone activity(GO:0016531) |
| 0.0 | 0.6 | GO:0005506 | iron ion binding(GO:0005506) |
| 0.0 | 1.6 | GO:0008565 | protein transporter activity(GO:0008565) |
| 0.0 | 0.3 | GO:0003777 | microtubule motor activity(GO:0003777) |
| 0.0 | 0.1 | GO:0004112 | cyclic-nucleotide phosphodiesterase activity(GO:0004112) |
| 0.0 | 0.2 | GO:0008409 | 5'-3' exonuclease activity(GO:0008409) |
| 0.0 | 0.2 | GO:0017176 | phosphatidylinositol N-acetylglucosaminyltransferase activity(GO:0017176) |
| 0.0 | 0.1 | GO:0017137 | Rab GTPase binding(GO:0017137) |
| 0.0 | 0.4 | GO:0016769 | transaminase activity(GO:0008483) transferase activity, transferring nitrogenous groups(GO:0016769) |
| 0.0 | 0.4 | GO:0030515 | snoRNA binding(GO:0030515) |
| 0.0 | 0.2 | GO:0008138 | protein tyrosine/serine/threonine phosphatase activity(GO:0008138) |
| 0.0 | 0.6 | GO:0017056 | structural constituent of nuclear pore(GO:0017056) |
| 0.0 | 0.8 | GO:0005200 | structural constituent of cytoskeleton(GO:0005200) |
| 0.0 | 0.2 | GO:0009982 | pseudouridine synthase activity(GO:0009982) |
| 0.0 | 0.6 | GO:0019887 | protein kinase regulator activity(GO:0019887) |
| 0.0 | 0.1 | GO:0005092 | GDP-dissociation inhibitor activity(GO:0005092) |
| 0.0 | 0.1 | GO:0003725 | double-stranded RNA binding(GO:0003725) |
| 0.0 | 0.0 | GO:0004375 | glycine dehydrogenase (decarboxylating) activity(GO:0004375) oxidoreductase activity, acting on the CH-NH2 group of donors, disulfide as acceptor(GO:0016642) |
| 0.0 | 1.0 | GO:0016791 | phosphatase activity(GO:0016791) |
| 0.0 | 0.1 | GO:0004197 | cysteine-type endopeptidase activity(GO:0004197) |
| 0.0 | 0.1 | GO:0042277 | peptide binding(GO:0042277) |
| 0.0 | 0.1 | GO:0004738 | pyruvate dehydrogenase activity(GO:0004738) |
| 0.0 | 0.6 | GO:0016853 | isomerase activity(GO:0016853) |
| 0.0 | 0.7 | GO:0004871 | signal transducer activity(GO:0004871) |
| 0.0 | 0.1 | GO:0072349 | modified amino acid transmembrane transporter activity(GO:0072349) |
| 0.0 | 0.1 | GO:0001055 | RNA polymerase II activity(GO:0001055) |
| 0.0 | 1.5 | GO:0003682 | chromatin binding(GO:0003682) |
| 0.0 | 0.2 | GO:0000990 | transcription factor activity, core RNA polymerase binding(GO:0000990) |
| 0.0 | 0.1 | GO:0004652 | polynucleotide adenylyltransferase activity(GO:0004652) |
| 0.0 | 0.2 | GO:0004298 | threonine-type endopeptidase activity(GO:0004298) threonine-type peptidase activity(GO:0070003) |
| 0.0 | 0.1 | GO:0003724 | RNA helicase activity(GO:0003724) |
| 0.0 | 0.1 | GO:0016780 | phosphotransferase activity, for other substituted phosphate groups(GO:0016780) |
| 0.0 | 0.1 | GO:0015556 | C4-dicarboxylate transmembrane transporter activity(GO:0015556) |
| 0.0 | 0.1 | GO:0016742 | hydroxymethyl-, formyl- and related transferase activity(GO:0016742) |
| 0.0 | 0.1 | GO:0000386 | second spliceosomal transesterification activity(GO:0000386) |
| 0.0 | 0.1 | GO:0000213 | tRNA-intron endonuclease activity(GO:0000213) |
| 0.0 | 0.1 | GO:0004177 | aminopeptidase activity(GO:0004177) |
Gene overrepresentation in curated gene sets: canonical pathways category:
| Log-likelihood per target | Total log-likelihood | Term | Description |
|---|---|---|---|
| 0.5 | 1.4 | PID CDC42 PATHWAY | CDC42 signaling events |
| 0.5 | 0.5 | PID VEGFR1 PATHWAY | VEGFR1 specific signals |
| 0.1 | 0.4 | PID HIF1 TFPATHWAY | HIF-1-alpha transcription factor network |
| 0.1 | 0.6 | PID ERA GENOMIC PATHWAY | Validated nuclear estrogen receptor alpha network |
| 0.1 | 0.2 | PID DELTA NP63 PATHWAY | Validated transcriptional targets of deltaNp63 isoforms |
| 0.1 | 0.3 | PID E2F PATHWAY | E2F transcription factor network |
| 0.1 | 0.4 | NABA CORE MATRISOME | Ensemble of genes encoding core extracellular matrix including ECM glycoproteins, collagens and proteoglycans |
| 0.1 | 0.3 | PID LKB1 PATHWAY | LKB1 signaling events |
| 0.1 | 0.8 | PID ATR PATHWAY | ATR signaling pathway |
| 0.1 | 0.2 | PID ATM PATHWAY | ATM pathway |
| 0.1 | 0.2 | PID INTEGRIN A4B1 PATHWAY | Alpha4 beta1 integrin signaling events |
| 0.0 | 0.2 | PID PLK1 PATHWAY | PLK1 signaling events |
| 0.0 | 0.1 | ST FAS SIGNALING PATHWAY | Fas Signaling Pathway |
| 0.0 | 0.1 | PID PDGFRB PATHWAY | PDGFR-beta signaling pathway |
Gene overrepresentation in curated gene sets: REACTOME pathways category:
| Log-likelihood per target | Total log-likelihood | Term | Description |
|---|---|---|---|
| 1.8 | 7.0 | REACTOME GLYCEROPHOSPHOLIPID BIOSYNTHESIS | Genes involved in Glycerophospholipid biosynthesis |
| 0.9 | 7.4 | REACTOME FORMATION OF THE TERNARY COMPLEX AND SUBSEQUENTLY THE 43S COMPLEX | Genes involved in Formation of the ternary complex, and subsequently, the 43S complex |
| 0.6 | 2.5 | REACTOME GLYCOLYSIS | Genes involved in Glycolysis |
| 0.6 | 1.2 | REACTOME MYD88 MAL CASCADE INITIATED ON PLASMA MEMBRANE | Genes involved in MyD88:Mal cascade initiated on plasma membrane |
| 0.6 | 1.8 | REACTOME ETHANOL OXIDATION | Genes involved in Ethanol oxidation |
| 0.5 | 1.4 | REACTOME CITRIC ACID CYCLE TCA CYCLE | Genes involved in Citric acid cycle (TCA cycle) |
| 0.4 | 2.2 | REACTOME ENDOSOMAL SORTING COMPLEX REQUIRED FOR TRANSPORT ESCRT | Genes involved in Endosomal Sorting Complex Required For Transport (ESCRT) |
| 0.4 | 1.1 | REACTOME SULFUR AMINO ACID METABOLISM | Genes involved in Sulfur amino acid metabolism |
| 0.3 | 1.4 | REACTOME METABOLISM OF NON CODING RNA | Genes involved in Metabolism of non-coding RNA |
| 0.3 | 1.7 | REACTOME LAGGING STRAND SYNTHESIS | Genes involved in Lagging Strand Synthesis |
| 0.2 | 3.9 | REACTOME INFLUENZA LIFE CYCLE | Genes involved in Influenza Life Cycle |
| 0.2 | 1.2 | REACTOME FORMATION OF TUBULIN FOLDING INTERMEDIATES BY CCT TRIC | Genes involved in Formation of tubulin folding intermediates by CCT/TriC |
| 0.1 | 0.7 | REACTOME PLATELET ACTIVATION SIGNALING AND AGGREGATION | Genes involved in Platelet activation, signaling and aggregation |
| 0.1 | 0.2 | REACTOME SCF BETA TRCP MEDIATED DEGRADATION OF EMI1 | Genes involved in SCF-beta-TrCP mediated degradation of Emi1 |
| 0.1 | 0.3 | REACTOME MITOCHONDRIAL PROTEIN IMPORT | Genes involved in Mitochondrial Protein Import |
| 0.1 | 0.1 | REACTOME NEGATIVE REGULATORS OF RIG I MDA5 SIGNALING | Genes involved in Negative regulators of RIG-I/MDA5 signaling |
| 0.0 | 0.3 | REACTOME MRNA DECAY BY 5 TO 3 EXORIBONUCLEASE | Genes involved in mRNA Decay by 5' to 3' Exoribonuclease |
| 0.0 | 0.1 | REACTOME AXON GUIDANCE | Genes involved in Axon guidance |
| 0.0 | 0.6 | REACTOME METABOLISM OF LIPIDS AND LIPOPROTEINS | Genes involved in Metabolism of lipids and lipoproteins |
| 0.0 | 0.2 | REACTOME TRANSLATION | Genes involved in Translation |
| 0.0 | 0.2 | REACTOME MITOTIC PROMETAPHASE | Genes involved in Mitotic Prometaphase |
| 0.0 | 0.1 | REACTOME DNA STRAND ELONGATION | Genes involved in DNA strand elongation |
| 0.0 | 0.2 | REACTOME TRANSCRIPTION | Genes involved in Transcription |