Project
GSE53960: rat RNA-Seq transcriptomic Bodymap
Navigation
Downloads
Results for Zfp105
Z-value: 0.59
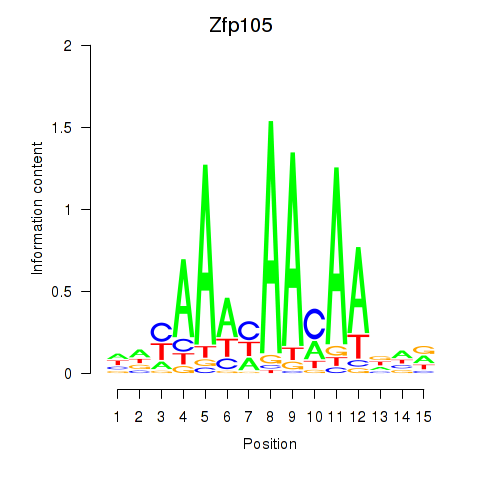
Motif logo
Transcription factors associated with Zfp105
| Gene Symbol | Gene ID | Gene Info |
|---|---|---|
|
Zfp105
|
ENSRNOG00000032919 | zinc finger protein 105 |
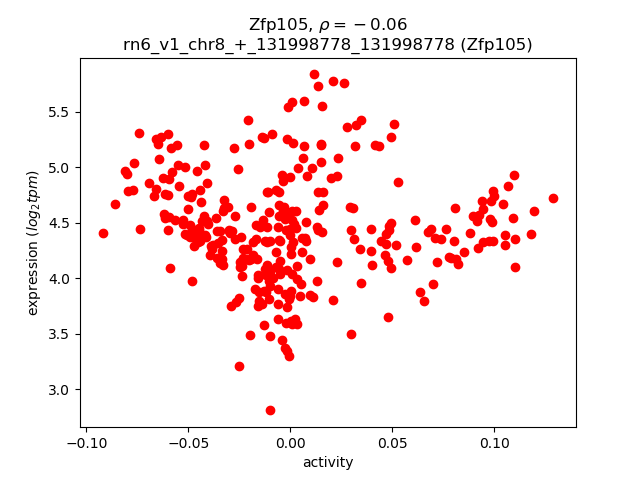
Activity-expression correlation:
| Gene | Promoter | Pearson corr. coef. | P-value | Plot |
|---|---|---|---|---|
| Zfp105 | rn6_v1_chr8_+_131998778_131998778 | -0.06 | 2.9e-01 | Click! |
Activity profile of Zfp105 motif
Sorted Z-values of Zfp105 motif
| Promoter | Log-likelihood | Transcript | Gene | Gene Info |
|---|---|---|---|---|
| chr4_-_177196180 | 25.84 |
ENSRNOT00000018999
|
St8sia1
|
ST8 alpha-N-acetyl-neuraminide alpha-2,8-sialyltransferase 1 |
| chr9_+_2202511 | 15.92 |
ENSRNOT00000017556
|
Satb1
|
SATB homeobox 1 |
| chr15_-_24199341 | 12.55 |
ENSRNOT00000015553
|
Dlgap5
|
DLG associated protein 5 |
| chr5_-_160405050 | 12.00 |
ENSRNOT00000081899
|
Ctrc
|
chymotrypsin C |
| chr11_-_82366505 | 8.19 |
ENSRNOT00000041326
|
RGD1559972
|
similar to ribosomal protein L27a |
| chr5_+_161889342 | 8.06 |
ENSRNOT00000040481
|
LOC100362684
|
ribosomal protein S20-like |
| chr17_+_78876111 | 7.69 |
ENSRNOT00000057895
|
Rpl34-ps1
|
ribosomal protein L34, pseudogene 1 |
| chr9_-_1012450 | 7.52 |
ENSRNOT00000051449
|
LOC100359951
|
ribosomal protein S20-like |
| chr10_-_57275708 | 7.40 |
ENSRNOT00000005370
|
Pfn1
|
profilin 1 |
| chr7_-_23953002 | 7.32 |
ENSRNOT00000047587
|
RGD1563124
|
similar to 40S ribosomal protein S20 |
| chr3_+_22964230 | 6.94 |
ENSRNOT00000041813
|
LOC100362149
|
ribosomal protein S20-like |
| chr13_+_91334004 | 5.73 |
ENSRNOT00000041384
|
LOC108352650
|
40S ribosomal protein S29 |
| chr1_-_31528083 | 5.65 |
ENSRNOT00000061041
|
Rpl26-ps2
|
ribosomal protein L26, pseudogene 2 |
| chr20_+_8486265 | 5.32 |
ENSRNOT00000072213
|
LOC100909911
|
40S ribosomal protein S20-like |
| chr2_-_199479309 | 5.30 |
ENSRNOT00000042661
|
Rpl38
|
ribosomal protein L38 |
| chr1_-_219395623 | 5.24 |
ENSRNOT00000040261
|
Rpl35a
|
ribosomal protein L35a |
| chr7_-_2961873 | 4.90 |
ENSRNOT00000067441
|
Rps15-ps2
|
ribosomal protein S15, pseudogene 2 |
| chrX_+_74824504 | 4.59 |
ENSRNOT00000048963
|
LOC680353
|
similar to 60S ribosomal protein L38 |
| chr6_-_103605256 | 4.44 |
ENSRNOT00000006005
|
Dcaf5
|
DDB1 and CUL4 associated factor 5 |
| chrX_-_115496045 | 4.43 |
ENSRNOT00000051134
|
LOC100361854
|
ribosomal protein S26-like |
| chr8_+_67295727 | 4.43 |
ENSRNOT00000020443
|
Anp32a
|
acidic nuclear phosphoprotein 32 family member A |
| chr15_+_28439317 | 4.39 |
ENSRNOT00000060519
|
LOC690384
|
similar to ribosomal protein L31 |
| chr3_+_98695503 | 4.12 |
ENSRNOT00000042764
|
AABR07053304.1
|
|
| chr9_+_81535483 | 3.77 |
ENSRNOT00000077285
|
Arpc2
|
actin related protein 2/3 complex, subunit 2 |
| chr4_-_162680757 | 3.55 |
ENSRNOT00000085918
|
Klra5
|
killer cell lectin-like receptor, subfamily A, member 5 |
| chr7_-_143167772 | 3.49 |
ENSRNOT00000011374
|
Krt85
|
keratin 85 |
| chr7_-_80457816 | 3.43 |
ENSRNOT00000039430
|
AABR07057617.1
|
|
| chr8_+_39164916 | 3.42 |
ENSRNOT00000011309
|
Acrv1
|
acrosomal vesicle protein 1 |
| chrX_-_157200981 | 3.41 |
ENSRNOT00000087364
|
AABR07071935.1
|
|
| chr10_+_87846947 | 2.74 |
ENSRNOT00000077436
|
Krtap9-5
|
keratin associated protein 9-5 |
| chr1_-_246110218 | 2.46 |
ENSRNOT00000077544
|
Rfx3
|
regulatory factor X3 |
| chr10_-_61088827 | 2.24 |
ENSRNOT00000047421
|
Olr1517
|
olfactory receptor 1517 |
| chr9_+_61552374 | 2.18 |
ENSRNOT00000050090
|
Tmem258b
|
transmembrane protein 258 B |
| chr15_-_93765498 | 1.98 |
ENSRNOT00000093297
|
Mycbp2
|
MYC binding protein 2, E3 ubiquitin protein ligase |
| chr7_+_144503534 | 1.73 |
ENSRNOT00000021543
|
Tbca
|
tubulin folding cofactor A |
| chr10_+_92769031 | 1.66 |
ENSRNOT00000090759
|
AABR07030543.1
|
|
| chr1_-_209641123 | 1.45 |
ENSRNOT00000021702
|
Ebf3
|
early B-cell factor 3 |
| chr1_-_149441437 | 0.98 |
ENSRNOT00000041780
|
Vom2r41
|
vomeronasal 2 receptor, 41 |
| chr3_-_78112770 | 0.11 |
ENSRNOT00000008396
|
Olr694
|
olfactory receptor 694 |
| chr13_-_104156454 | 0.11 |
ENSRNOT00000031419
|
AABR07022046.1
|
|
| chr3_-_74631883 | 0.08 |
ENSRNOT00000013215
|
Olr539
|
olfactory receptor 539 |
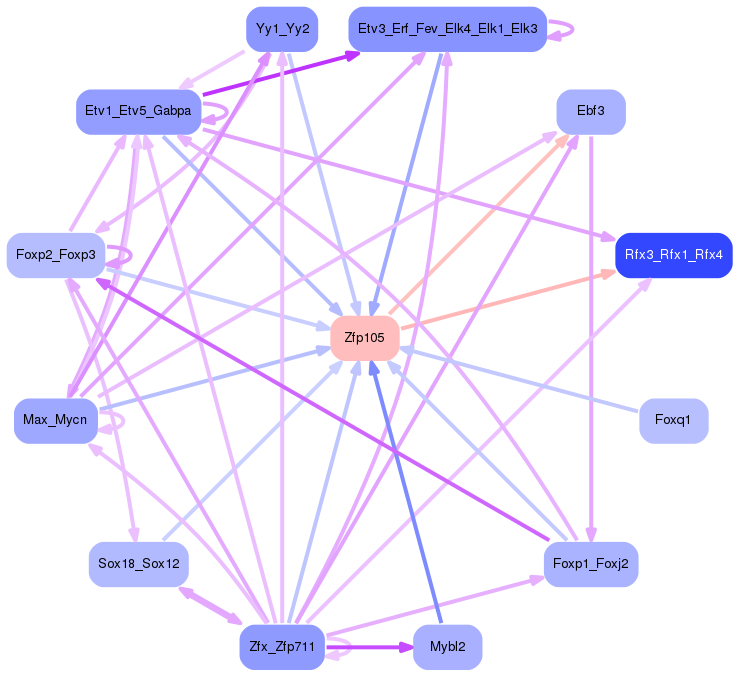
Network of associatons between targets according to the STRING database.

First level regulatory network of Zfp105
Gene Ontology Analysis
Gene overrepresentation in biological process category:
| Log-likelihood per target | Total log-likelihood | Term | Description |
|---|---|---|---|
| 1.2 | 25.8 | GO:0097503 | sialylation(GO:0097503) |
| 1.1 | 15.9 | GO:0043374 | CD8-positive, alpha-beta T cell differentiation(GO:0043374) |
| 0.9 | 3.8 | GO:2000814 | positive regulation of barbed-end actin filament capping(GO:2000814) |
| 0.8 | 2.5 | GO:0002071 | glandular epithelial cell maturation(GO:0002071) positive regulation of type B pancreatic cell development(GO:2000078) |
| 0.7 | 7.4 | GO:1900029 | positive regulation of ruffle assembly(GO:1900029) |
| 0.7 | 5.3 | GO:0048318 | axial mesoderm development(GO:0048318) |
| 0.2 | 1.7 | GO:0007021 | tubulin complex assembly(GO:0007021) |
| 0.2 | 4.4 | GO:0035067 | negative regulation of histone acetylation(GO:0035067) |
| 0.2 | 2.0 | GO:0021785 | branchiomotor neuron axon guidance(GO:0021785) |
| 0.1 | 4.4 | GO:0033119 | negative regulation of RNA splicing(GO:0033119) |
| 0.1 | 5.2 | GO:0042273 | ribosomal large subunit biogenesis(GO:0042273) |
| 0.0 | 3.5 | GO:0030101 | natural killer cell activation(GO:0030101) |
| 0.0 | 28.3 | GO:0006412 | translation(GO:0006412) |
| 0.0 | 12.6 | GO:0006470 | protein dephosphorylation(GO:0006470) |
Gene overrepresentation in cellular component category:
| Log-likelihood per target | Total log-likelihood | Term | Description |
|---|---|---|---|
| 0.9 | 12.6 | GO:0031616 | spindle pole centrosome(GO:0031616) |
| 0.6 | 3.8 | GO:0036195 | muscle cell projection(GO:0036194) muscle cell projection membrane(GO:0036195) |
| 0.5 | 25.8 | GO:0030173 | integral component of Golgi membrane(GO:0030173) |
| 0.3 | 15.9 | GO:0005720 | nuclear heterochromatin(GO:0005720) |
| 0.2 | 4.4 | GO:0080008 | Cul4-RING E3 ubiquitin ligase complex(GO:0080008) |
| 0.1 | 10.5 | GO:0022625 | cytosolic large ribosomal subunit(GO:0022625) |
| 0.1 | 4.4 | GO:0022627 | cytosolic small ribosomal subunit(GO:0022627) |
| 0.1 | 7.4 | GO:0072562 | blood microparticle(GO:0072562) |
| 0.0 | 3.5 | GO:0045095 | keratin filament(GO:0045095) |
| 0.0 | 4.4 | GO:0016363 | nuclear matrix(GO:0016363) |
| 0.0 | 3.4 | GO:0001669 | acrosomal vesicle(GO:0001669) |
Gene overrepresentation in molecular function category:
| Log-likelihood per target | Total log-likelihood | Term | Description |
|---|---|---|---|
| 1.1 | 25.8 | GO:0008373 | sialyltransferase activity(GO:0008373) |
| 0.7 | 7.4 | GO:0000774 | adenyl-nucleotide exchange factor activity(GO:0000774) |
| 0.6 | 3.8 | GO:0035650 | AP-1 adaptor complex binding(GO:0035650) |
| 0.2 | 43.2 | GO:0003735 | structural constituent of ribosome(GO:0003735) |
| 0.1 | 12.6 | GO:0004721 | phosphoprotein phosphatase activity(GO:0004721) |
| 0.1 | 12.0 | GO:0004252 | serine-type endopeptidase activity(GO:0004252) |
| 0.0 | 9.2 | GO:0001227 | transcriptional repressor activity, RNA polymerase II transcription regulatory region sequence-specific binding(GO:0001227) |
| 0.0 | 1.7 | GO:0048487 | beta-tubulin binding(GO:0048487) |
| 0.0 | 4.4 | GO:0005178 | integrin binding(GO:0005178) |
| 0.0 | 3.9 | GO:0000978 | RNA polymerase II core promoter proximal region sequence-specific DNA binding(GO:0000978) |
| 0.0 | 3.5 | GO:0030246 | carbohydrate binding(GO:0030246) |
Gene overrepresentation in curated gene sets: canonical pathways category:
| Log-likelihood per target | Total log-likelihood | Term | Description |
|---|---|---|---|
| 0.3 | 12.6 | PID AURORA A PATHWAY | Aurora A signaling |
| 0.2 | 15.9 | PID CASPASE PATHWAY | Caspase cascade in apoptosis |
| 0.2 | 12.0 | PID UPA UPAR PATHWAY | Urokinase-type plasminogen activator (uPA) and uPAR-mediated signaling |
| 0.2 | 7.4 | SIG REGULATION OF THE ACTIN CYTOSKELETON BY RHO GTPASES | Genes related to regulation of the actin cytoskeleton |
| 0.1 | 3.8 | PID RAC1 PATHWAY | RAC1 signaling pathway |
| 0.1 | 4.4 | PID ERA GENOMIC PATHWAY | Validated nuclear estrogen receptor alpha network |
Gene overrepresentation in curated gene sets: REACTOME pathways category:
| Log-likelihood per target | Total log-likelihood | Term | Description |
|---|---|---|---|
| 0.3 | 15.9 | REACTOME APOPTOTIC CLEAVAGE OF CELLULAR PROTEINS | Genes involved in Apoptotic cleavage of cellular proteins |
| 0.1 | 7.4 | REACTOME SIGNALING BY ROBO RECEPTOR | Genes involved in Signaling by Robo receptor |
| 0.1 | 10.5 | REACTOME PEPTIDE CHAIN ELONGATION | Genes involved in Peptide chain elongation |
| 0.1 | 1.7 | REACTOME POST CHAPERONIN TUBULIN FOLDING PATHWAY | Genes involved in Post-chaperonin tubulin folding pathway |
| 0.0 | 4.4 | REACTOME REGULATION OF MRNA STABILITY BY PROTEINS THAT BIND AU RICH ELEMENTS | Genes involved in Regulation of mRNA Stability by Proteins that Bind AU-rich Elements |