Project
GSE53960: rat RNA-Seq transcriptomic Bodymap
Navigation
Downloads
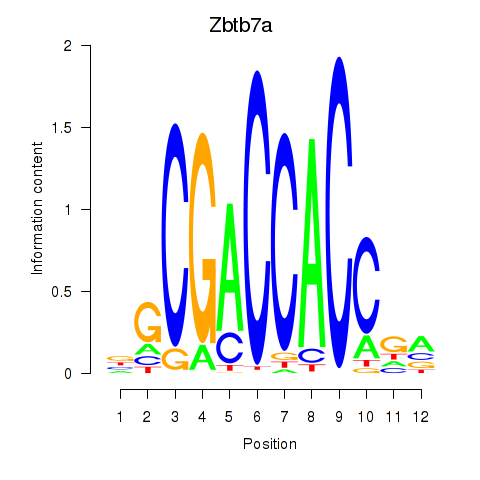
Results for Zbtb7a
Z-value: 0.81
Motif logo
Transcription factors associated with Zbtb7a
| Gene Symbol | Gene ID | Gene Info |
|---|---|---|
|
Zbtb7a
|
ENSRNOG00000020161 | zinc finger and BTB domain containing 7a |
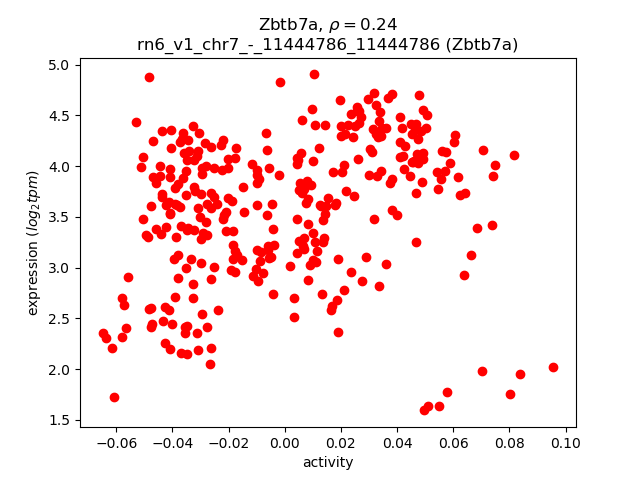
Activity-expression correlation:
| Gene | Promoter | Pearson corr. coef. | P-value | Plot |
|---|---|---|---|---|
| Zbtb7a | rn6_v1_chr7_-_11444786_11444786 | 0.24 | 1.6e-05 | Click! |
Activity profile of Zbtb7a motif
Sorted Z-values of Zbtb7a motif
| Promoter | Log-likelihood | Transcript | Gene | Gene Info |
|---|---|---|---|---|
| chr10_-_57671080 | 23.97 |
ENSRNOT00000082511
|
LOC691995
|
hypothetical protein LOC691995 |
| chr8_-_59239954 | 21.76 |
ENSRNOT00000016104
|
Acsbg1
|
acyl-CoA synthetase bubblegum family member 1 |
| chr17_-_78962476 | 20.39 |
ENSRNOT00000030228
|
Nmt2
|
N-myristoyltransferase 2 |
| chr1_+_211423022 | 19.56 |
ENSRNOT00000029587
|
Dpysl4
|
dihydropyrimidinase-like 4 |
| chr8_+_56179816 | 19.01 |
ENSRNOT00000059078
|
Arhgap20
|
Rho GTPase activating protein 20 |
| chr7_-_70552897 | 17.83 |
ENSRNOT00000080594
|
Kif5a
|
kinesin family member 5A |
| chr1_+_122981755 | 17.45 |
ENSRNOT00000013468
|
Ndn
|
necdin, MAGE family member |
| chr16_-_20860767 | 16.09 |
ENSRNOT00000027275
ENSRNOT00000092417 |
Gdf1
Cers1
|
growth differentiation factor 1 ceramide synthase 1 |
| chr11_+_86512797 | 16.01 |
ENSRNOT00000051680
|
Gp1bb
|
glycoprotein Ib platelet beta subunit |
| chr19_+_52086325 | 15.68 |
ENSRNOT00000020341
|
Necab2
|
N-terminal EF-hand calcium binding protein 2 |
| chr8_+_119566509 | 15.67 |
ENSRNOT00000028633
|
Trank1
|
tetratricopeptide repeat and ankyrin repeat containing 1 |
| chr12_+_22026075 | 15.26 |
ENSRNOT00000029041
|
LOC100910838
|
neuronal tyrosine-phosphorylated phosphoinositide-3-kinase adapter 1-like |
| chr2_-_187372652 | 15.23 |
ENSRNOT00000025496
ENSRNOT00000083116 |
Bcan
|
brevican |
| chr2_+_207923775 | 15.14 |
ENSRNOT00000019997
ENSRNOT00000051835 |
Kcnd3
|
potassium voltage-gated channel subfamily D member 3 |
| chr2_-_24923128 | 15.02 |
ENSRNOT00000044087
|
Pde8b
|
phosphodiesterase 8B |
| chr10_-_58924137 | 15.00 |
ENSRNOT00000066740
|
Tekt1
|
tektin 1 |
| chr11_+_14005732 | 14.66 |
ENSRNOT00000047240
|
Rbm11
|
RNA binding motif protein 11 |
| chr7_-_113937941 | 14.09 |
ENSRNOT00000012408
|
Kcnk9
|
potassium two pore domain channel subfamily K member 9 |
| chr16_-_5795825 | 14.01 |
ENSRNOT00000048043
|
Cacna2d3
|
calcium voltage-gated channel auxiliary subunit alpha2delta 3 |
| chr2_-_29768750 | 12.73 |
ENSRNOT00000023460
|
Map1b
|
microtubule-associated protein 1B |
| chr1_+_100447998 | 12.72 |
ENSRNOT00000026259
|
Lrrc4b
|
leucine rich repeat containing 4B |
| chr13_-_72367980 | 12.51 |
ENSRNOT00000003928
|
Cacna1e
|
calcium voltage-gated channel subunit alpha1 E |
| chr3_-_160301552 | 12.39 |
ENSRNOT00000014498
|
Rims4
|
regulating synaptic membrane exocytosis 4 |
| chr6_+_132246602 | 12.33 |
ENSRNOT00000009896
|
Cyp46a1
|
cytochrome P450, family 46, subfamily a, polypeptide 1 |
| chr10_-_97582188 | 12.15 |
ENSRNOT00000005076
|
Rgs9
|
regulator of G-protein signaling 9 |
| chr5_+_103479767 | 12.10 |
ENSRNOT00000008999
|
Sh3gl2
|
SH3 domain-containing GRB2-like 2 |
| chr1_-_170397191 | 11.60 |
ENSRNOT00000090181
|
Apbb1
|
amyloid beta precursor protein binding family B member 1 |
| chr4_+_142453013 | 11.46 |
ENSRNOT00000056573
|
AABR07061755.1
|
|
| chr5_-_40237591 | 11.41 |
ENSRNOT00000011393
|
Fut9
|
fucosyltransferase 9 |
| chr6_+_44009872 | 11.39 |
ENSRNOT00000082657
|
Mboat2
|
membrane bound O-acyltransferase domain containing 2 |
| chr3_+_154043873 | 11.02 |
ENSRNOT00000072502
ENSRNOT00000034166 |
Nnat
|
neuronatin |
| chr12_-_46920952 | 10.97 |
ENSRNOT00000001532
|
Msi1
|
musashi RNA-binding protein 1 |
| chr7_-_116607408 | 10.81 |
ENSRNOT00000076009
ENSRNOT00000056554 |
Ly6h
|
lymphocyte antigen 6 complex, locus H |
| chr1_+_266953139 | 10.76 |
ENSRNOT00000054696
|
Neurl1
|
neuralized E3 ubiquitin protein ligase 1 |
| chr1_+_81373340 | 10.69 |
ENSRNOT00000026814
|
Zfp428
|
zinc finger protein 428 |
| chr2_-_229718659 | 10.57 |
ENSRNOT00000012676
|
Ugt8
|
UDP glycosyltransferase 8 |
| chr3_-_147143576 | 10.57 |
ENSRNOT00000091811
ENSRNOT00000012727 |
Snph
|
syntaphilin |
| chr3_+_2262253 | 10.44 |
ENSRNOT00000042100
ENSRNOT00000061303 ENSRNOT00000048137 ENSRNOT00000048353 ENSRNOT00000012129 |
Nsmf
|
NMDA receptor synaptonuclear signaling and neuronal migration factor |
| chr1_+_266952561 | 10.37 |
ENSRNOT00000076452
|
Neurl1
|
neuralized E3 ubiquitin protein ligase 1 |
| chr2_-_56679955 | 9.95 |
ENSRNOT00000016722
|
Egflam
|
EGF-like, fibronectin type III and laminin G domains |
| chr8_-_108880879 | 9.85 |
ENSRNOT00000020610
|
Slc35g2
|
solute carrier family 35, member G2 |
| chr10_-_18942540 | 9.80 |
ENSRNOT00000007187
|
Kcnip1
|
potassium voltage-gated channel interacting protein 1 |
| chr2_-_196402106 | 9.75 |
ENSRNOT00000028664
|
Mllt11
|
myeloid/lymphoid or mixed-lineage leukemia; translocated to, 11 |
| chr10_+_89089646 | 9.64 |
ENSRNOT00000027505
|
Cntnap1
|
contactin associated protein 1 |
| chr8_-_36760742 | 9.56 |
ENSRNOT00000017307
|
Ddx25
|
DEAD-box helicase 25 |
| chrX_+_76083549 | 9.52 |
ENSRNOT00000003573
|
Magee1
|
MAGE family member E1 |
| chr1_-_64350338 | 8.84 |
ENSRNOT00000078444
|
Cacng8
|
calcium voltage-gated channel auxiliary subunit gamma 8 |
| chr10_-_14056169 | 8.74 |
ENSRNOT00000017833
|
Syngr3
|
synaptogyrin 3 |
| chr15_+_45712821 | 8.67 |
ENSRNOT00000083381
ENSRNOT00000045833 |
Fam124a
|
family with sequence similarity 124 member A |
| chr7_+_12247498 | 8.52 |
ENSRNOT00000022358
|
Pcsk4
|
proprotein convertase subtilisin/kexin type 4 |
| chr16_-_21338771 | 8.35 |
ENSRNOT00000014265
|
Pbx4
|
PBX homeobox 4 |
| chr4_-_16130848 | 8.32 |
ENSRNOT00000042914
|
Cacna2d1
|
calcium voltage-gated channel auxiliary subunit alpha2delta 1 |
| chr4_+_32373641 | 8.19 |
ENSRNOT00000076086
|
Dlx6
|
distal-less homeobox 6 |
| chr1_+_226435979 | 8.15 |
ENSRNOT00000048704
ENSRNOT00000036232 ENSRNOT00000035576 ENSRNOT00000036180 ENSRNOT00000036168 ENSRNOT00000047964 ENSRNOT00000036283 ENSRNOT00000007429 |
Syt7
|
synaptotagmin 7 |
| chr12_-_30033357 | 8.12 |
ENSRNOT00000001198
|
Kctd7
|
potassium channel tetramerization domain containing 7 |
| chr17_-_21353134 | 8.03 |
ENSRNOT00000067898
|
Smim13
|
small integral membrane protein 13 |
| chr3_-_95418679 | 8.00 |
ENSRNOT00000018074
|
Rcn1
|
reticulocalbin 1 |
| chr3_+_113319456 | 7.93 |
ENSRNOT00000051354
|
Ckmt1
|
creatine kinase, mitochondrial 1 |
| chr8_+_56179637 | 7.78 |
ENSRNOT00000035989
|
Arhgap20
|
Rho GTPase activating protein 20 |
| chr2_+_242882306 | 7.67 |
ENSRNOT00000013661
|
Ddit4l
|
DNA-damage-inducible transcript 4-like |
| chr18_-_28454756 | 7.60 |
ENSRNOT00000040091
|
Spata24
|
spermatogenesis associated 24 |
| chr6_-_122897997 | 7.60 |
ENSRNOT00000057601
|
Eml5
|
echinoderm microtubule associated protein like 5 |
| chr3_+_160231914 | 7.45 |
ENSRNOT00000014411
|
Kcnk15
|
potassium two pore domain channel subfamily K member 15 |
| chr13_-_109552589 | 7.41 |
ENSRNOT00000005095
|
Vash2
|
vasohibin 2 |
| chr13_+_50873605 | 7.39 |
ENSRNOT00000004382
|
Fmod
|
fibromodulin |
| chr5_+_26493212 | 7.36 |
ENSRNOT00000061328
|
Triqk
|
triple QxxK/R motif containing |
| chr2_+_30346069 | 7.30 |
ENSRNOT00000076577
|
Serf1
|
small EDRK-rich factor 1 |
| chr14_-_37770059 | 7.18 |
ENSRNOT00000029721
|
Slc10a4
|
solute carrier family 10, member 4 |
| chr5_+_152681101 | 7.10 |
ENSRNOT00000076052
ENSRNOT00000022574 |
Stmn1
|
stathmin 1 |
| chr1_-_84812486 | 6.86 |
ENSRNOT00000078369
|
AABR07002779.1
|
|
| chr9_-_79898912 | 6.84 |
ENSRNOT00000022076
|
March4
|
membrane associated ring-CH-type finger 4 |
| chrX_+_65796787 | 6.83 |
ENSRNOT00000076029
|
Gpr165
|
G protein-coupled receptor 165 |
| chr3_+_173953869 | 6.78 |
ENSRNOT00000091212
|
Fam217b
|
family with sequence similarity 217, member B |
| chr2_-_149563905 | 6.68 |
ENSRNOT00000086186
|
Igsf10
|
immunoglobulin superfamily, member 10 |
| chr3_-_3574787 | 6.55 |
ENSRNOT00000087651
|
Nacc2
|
NACC family member 2 |
| chr7_+_12192088 | 6.54 |
ENSRNOT00000040170
|
Mex3d
|
mex-3 RNA binding family member D |
| chr14_-_80732010 | 6.45 |
ENSRNOT00000012322
|
Adra2c
|
adrenoceptor alpha 2C |
| chr7_+_59039720 | 6.44 |
ENSRNOT00000006401
|
Ptprr
|
protein tyrosine phosphatase, receptor type, R |
| chr5_+_139597731 | 6.44 |
ENSRNOT00000072427
|
Cited4
|
Cbp/p300-interacting transactivator, with Glu/Asp-rich carboxy-terminal domain, 4 |
| chr12_+_24158766 | 6.41 |
ENSRNOT00000001963
|
Ccl26
|
C-C motif chemokine ligand 26 |
| chr10_-_20622600 | 6.37 |
ENSRNOT00000020554
|
Fbll1
|
fibrillarin-like 1 |
| chr3_+_146582752 | 6.28 |
ENSRNOT00000010157
|
Pygb
|
glycogen phosphorylase B |
| chr1_+_245237736 | 6.26 |
ENSRNOT00000035814
|
Vldlr
|
very low density lipoprotein receptor |
| chr5_-_149996334 | 6.26 |
ENSRNOT00000036148
|
Ptpru
|
protein tyrosine phosphatase, receptor type, U |
| chr9_+_94362299 | 6.22 |
ENSRNOT00000021168
|
Efhd1
|
EF-hand domain family, member D1 |
| chr5_+_135029955 | 6.18 |
ENSRNOT00000074860
|
LOC100911669
|
uncharacterized LOC100911669 |
| chr1_-_112811936 | 6.15 |
ENSRNOT00000093339
|
Gabrg3
|
gamma-aminobutyric acid type A receptor gamma 3 subunit |
| chr5_-_33182147 | 6.14 |
ENSRNOT00000080358
|
Maged2
|
MAGE family member D2 |
| chr1_+_203971152 | 6.07 |
ENSRNOT00000075540
|
Gpr26
|
G protein-coupled receptor 26 |
| chr1_-_261669584 | 6.05 |
ENSRNOT00000020568
ENSRNOT00000076555 |
Crtac1
|
cartilage acidic protein 1 |
| chr11_+_54404446 | 6.01 |
ENSRNOT00000002678
|
Dzip3
|
DAZ interacting zinc finger protein 3 |
| chr1_+_79982639 | 5.95 |
ENSRNOT00000071916
|
Dmwd
|
dystrophia myotonica, WD repeat containing |
| chr19_-_869490 | 5.93 |
ENSRNOT00000080433
|
Cmtm1
|
CKLF-like MARVEL transmembrane domain containing 1 |
| chr11_+_34598492 | 5.86 |
ENSRNOT00000065600
|
Ttc3
|
tetratricopeptide repeat domain 3 |
| chr6_-_59950586 | 5.81 |
ENSRNOT00000005800
|
Arl4a
|
ADP-ribosylation factor like GTPase 4A |
| chr8_+_49676540 | 5.80 |
ENSRNOT00000022032
ENSRNOT00000082205 |
Fxyd6
|
FXYD domain-containing ion transport regulator 6 |
| chr7_+_117351648 | 5.76 |
ENSRNOT00000056421
|
Smpd5
|
sphingomyelin phosphodiesterase 5 |
| chr10_-_91302155 | 5.75 |
ENSRNOT00000004371
|
Spata32
|
spermatogenesis associated 32 |
| chr1_+_28454966 | 5.75 |
ENSRNOT00000078841
ENSRNOT00000030327 |
Tpd52l1
|
tumor protein D52-like 1 |
| chr16_-_55132191 | 5.62 |
ENSRNOT00000017025
|
Micu3
|
mitochondrial calcium uptake family, member 3 |
| chr18_-_40134504 | 5.61 |
ENSRNOT00000022294
|
Trim36
|
tripartite motif-containing 36 |
| chr1_-_81144024 | 5.60 |
ENSRNOT00000088431
|
Zfp94
|
zinc finger protein 94 |
| chr5_-_135677432 | 5.60 |
ENSRNOT00000024393
|
Hpdl
|
4-hydroxyphenylpyruvate dioxygenase-like |
| chr5_+_155649217 | 5.56 |
ENSRNOT00000018064
|
Wnt4
|
wingless-type MMTV integration site family, member 4 |
| chr3_+_3325770 | 5.56 |
ENSRNOT00000023542
|
Kcnt1
|
potassium sodium-activated channel subfamily T member 1 |
| chr4_+_118655728 | 5.40 |
ENSRNOT00000043082
|
Aak1
|
AP2 associated kinase 1 |
| chr14_+_81725513 | 5.26 |
ENSRNOT00000020154
|
Zfyve28
|
zinc finger FYVE-type containing 28 |
| chr8_+_72029489 | 5.25 |
ENSRNOT00000089336
|
Herc1
|
HECT and RLD domain containing E3 ubiquitin protein ligase family member 1 |
| chr3_-_63535991 | 5.23 |
ENSRNOT00000015722
|
Fkbp7
|
FK506 binding protein 7 |
| chr16_+_80826681 | 5.22 |
ENSRNOT00000000123
|
Coprs
|
coordinator of PRMT5 and differentiation stimulator |
| chr18_+_65388685 | 5.19 |
ENSRNOT00000080844
|
Tcf4
|
transcription factor 4 |
| chr6_+_28571351 | 5.16 |
ENSRNOT00000005389
|
Adcy3
|
adenylate cyclase 3 |
| chr4_+_148199102 | 5.16 |
ENSRNOT00000083563
|
Zfand4
|
zinc finger AN1-type containing 4 |
| chr10_+_49259194 | 5.12 |
ENSRNOT00000091100
ENSRNOT00000004390 |
Fbxw10
|
F-box and WD repeat domain containing 10 |
| chr8_+_59900651 | 5.07 |
ENSRNOT00000020410
|
Tmem266
|
transmembrane protein 266 |
| chr10_+_94207336 | 5.05 |
ENSRNOT00000010816
|
Kcnh6
|
potassium voltage-gated channel subfamily H member 6 |
| chr18_+_59096643 | 5.01 |
ENSRNOT00000025325
|
Wdr7
|
WD repeat domain 7 |
| chr14_+_85814824 | 4.87 |
ENSRNOT00000090046
ENSRNOT00000083756 |
Ankrd36
|
ankyrin repeat domain 36 |
| chr10_+_11392625 | 4.80 |
ENSRNOT00000072802
|
Adcy9
|
adenylate cyclase 9 |
| chr1_-_220883062 | 4.80 |
ENSRNOT00000084065
|
LOC102551929
|
melanoma-associated antigen G1-like |
| chr1_-_165680176 | 4.73 |
ENSRNOT00000025245
ENSRNOT00000082697 |
Plekhb1
|
pleckstrin homology domain containing B1 |
| chrX_+_73390903 | 4.70 |
ENSRNOT00000077002
|
Zfp449
|
zinc finger protein 449 |
| chr5_-_157535664 | 4.61 |
ENSRNOT00000072299
|
Nbl1
|
neuroblastoma 1, DAN family BMP antagonist |
| chr10_-_13580821 | 4.60 |
ENSRNOT00000009735
|
Ntn3
|
netrin 3 |
| chr2_-_196415530 | 4.60 |
ENSRNOT00000064238
|
RGD1359334
|
similar to hypothetical protein FLJ20519 |
| chr19_+_55929609 | 4.58 |
ENSRNOT00000068231
ENSRNOT00000077701 |
Cpne7
|
copine 7 |
| chr2_+_187322416 | 4.54 |
ENSRNOT00000025183
|
Crabp2
|
cellular retinoic acid binding protein 2 |
| chr9_-_46475040 | 4.49 |
ENSRNOT00000078196
|
Rfx8
|
RFX family member 8, lacking RFX DNA binding domain |
| chr4_+_114776797 | 4.47 |
ENSRNOT00000089635
|
LOC103692167
|
polycomb group RING finger protein 1 |
| chr6_+_72359791 | 4.43 |
ENSRNOT00000007365
|
Coch
|
cochlin |
| chr17_+_78915604 | 4.42 |
ENSRNOT00000057855
|
Rpp38
|
ribonuclease P/MRP 38 subunit |
| chr19_-_26084679 | 4.40 |
ENSRNOT00000046181
|
Rnaseh2a
|
ribonuclease H2, subunit A |
| chr3_+_172856733 | 4.39 |
ENSRNOT00000009826
|
Edn3
|
endothelin 3 |
| chr1_-_220644636 | 4.38 |
ENSRNOT00000027632
|
Pacs1
|
phosphofurin acidic cluster sorting protein 1 |
| chr1_+_102915655 | 4.30 |
ENSRNOT00000090520
ENSRNOT00000082718 ENSRNOT00000079440 ENSRNOT00000083079 ENSRNOT00000088892 ENSRNOT00000092180 |
Ldhc
|
lactate dehydrogenase C |
| chr18_-_28017925 | 4.27 |
ENSRNOT00000075420
|
Lrrtm2
|
leucine rich repeat transmembrane neuronal 2 |
| chr6_+_138432550 | 4.23 |
ENSRNOT00000056829
|
Adam6
|
a disintegrin and metallopeptidase domain 6 |
| chr1_-_281756159 | 4.22 |
ENSRNOT00000013170
|
Prlhr
|
prolactin releasing hormone receptor |
| chrX_+_19270181 | 4.18 |
ENSRNOT00000029397
|
Usp51
|
ubiquitin specific peptidase 51 |
| chr3_+_3767394 | 4.17 |
ENSRNOT00000067840
|
Gpsm1
|
G-protein signaling modulator 1 |
| chr14_-_84978255 | 4.16 |
ENSRNOT00000078179
|
Cabp7
|
calcium binding protein 7 |
| chr16_-_62483137 | 4.12 |
ENSRNOT00000020683
|
Purg
|
purine-rich element binding protein G |
| chr4_+_170347410 | 4.09 |
ENSRNOT00000040508
|
LOC500350
|
LRRGT00139 |
| chr3_+_155297566 | 4.06 |
ENSRNOT00000021435
ENSRNOT00000084866 |
Dhx35
|
DEAH-box helicase 35 |
| chr1_-_103256823 | 4.06 |
ENSRNOT00000018860
|
Ptpn5
|
protein tyrosine phosphatase, non-receptor type 5 |
| chr1_+_239266921 | 4.03 |
ENSRNOT00000044486
|
Abhd17b
|
abhydrolase domain containing 17B |
| chr16_-_20686317 | 3.99 |
ENSRNOT00000060097
|
Crlf1
|
cytokine receptor-like factor 1 |
| chr4_+_168976859 | 3.94 |
ENSRNOT00000068663
|
Fam234b
|
family with sequence similarity 234, member B |
| chr1_-_143278485 | 3.92 |
ENSRNOT00000026009
|
Cpeb1
|
cytoplasmic polyadenylation element binding protein 1 |
| chr2_-_120316600 | 3.92 |
ENSRNOT00000084521
|
Ccdc39
|
coiled-coil domain containing 39 |
| chr12_+_7454884 | 3.89 |
ENSRNOT00000077328
|
LOC100910196
|
katanin p60 ATPase-containing subunit A-like 1-like |
| chr9_-_99299715 | 3.87 |
ENSRNOT00000027622
|
Hdac4
|
histone deacetylase 4 |
| chr10_-_47630799 | 3.73 |
ENSRNOT00000057907
|
Slc47a2
|
solute carrier family 47 member 2 |
| chr10_+_91217079 | 3.72 |
ENSRNOT00000004218
|
Hexim2
|
hexamethylene bis-acetamide inducible 2 |
| chr4_+_57034675 | 3.67 |
ENSRNOT00000080223
|
Smo
|
smoothened, frizzled class receptor |
| chr7_+_13039781 | 3.66 |
ENSRNOT00000067771
ENSRNOT00000090048 |
Mier2
|
mesoderm induction early response 1, family member 2 |
| chr8_-_127782070 | 3.60 |
ENSRNOT00000045493
|
Plcd1
|
phospholipase C, delta 1 |
| chr19_-_52252587 | 3.54 |
ENSRNOT00000020990
|
Taf1c
|
TATA-box binding protein associated factor, RNA polymerase 1 subunit C |
| chr1_-_89559960 | 3.54 |
ENSRNOT00000092133
|
Scn1b
|
sodium voltage-gated channel beta subunit 1 |
| chr3_+_121596791 | 3.52 |
ENSRNOT00000024694
|
Ttl
|
tubulin tyrosine ligase |
| chr20_+_41083317 | 3.51 |
ENSRNOT00000000660
|
Tspyl1
|
TSPY-like 1 |
| chr6_-_109004598 | 3.51 |
ENSRNOT00000007790
|
Pgf
|
placental growth factor |
| chr7_-_12793711 | 3.50 |
ENSRNOT00000013762
|
Palm
|
paralemmin |
| chr7_-_139907640 | 3.47 |
ENSRNOT00000045473
|
Zfp641
|
zinc finger protein 641 |
| chr9_-_38196273 | 3.46 |
ENSRNOT00000044452
|
Dst
|
dystonin |
| chr15_+_19603288 | 3.44 |
ENSRNOT00000035491
|
LOC102552640
|
REST corepressor 2-like |
| chr5_+_133864798 | 3.39 |
ENSRNOT00000091977
|
Tal1
|
TAL bHLH transcription factor 1, erythroid differentiation factor |
| chr10_-_57309298 | 3.38 |
ENSRNOT00000056622
|
Camta2
|
calmodulin binding transcription activator 2 |
| chr10_+_65448950 | 3.37 |
ENSRNOT00000082348
ENSRNOT00000037016 |
Rab34
|
RAB34, member RAS oncogene family |
| chr3_-_110140756 | 3.30 |
ENSRNOT00000007882
|
Gpr176
|
G protein-coupled receptor 176 |
| chr2_-_148838441 | 3.28 |
ENSRNOT00000018294
|
Erich6
|
glutamate-rich 6 |
| chr12_+_22835019 | 3.27 |
ENSRNOT00000059530
|
Col26a1
|
collagen type XXVI alpha 1 chain |
| chr14_-_11198194 | 3.17 |
ENSRNOT00000003083
|
Enoph1
|
enolase-phosphatase 1 |
| chr1_-_56982554 | 3.17 |
ENSRNOT00000047157
ENSRNOT00000078312 |
Tcte3
|
t-complex-associated testis expressed 3 |
| chr13_-_83842051 | 3.13 |
ENSRNOT00000004376
|
Mpzl1
|
myelin protein zero-like 1 |
| chr10_+_55642070 | 3.11 |
ENSRNOT00000008507
|
Borcs6
|
BLOC-1 related complex subunit 6 |
| chr12_+_13734429 | 3.09 |
ENSRNOT00000001479
|
Fbxl18
|
F-box and leucine-rich repeat protein 18 |
| chr2_+_225310624 | 3.08 |
ENSRNOT00000015836
|
F3
|
coagulation factor III, tissue factor |
| chr2_+_34312766 | 3.06 |
ENSRNOT00000060962
|
Cenpk
|
centromere protein K |
| chr6_+_104718512 | 3.05 |
ENSRNOT00000007947
|
Smoc1
|
SPARC related modular calcium binding 1 |
| chr18_-_27159693 | 3.04 |
ENSRNOT00000027345
|
Reep5
|
receptor accessory protein 5 |
| chr10_+_37458452 | 3.03 |
ENSRNOT00000079411
|
Cdkl3
|
cyclin-dependent kinase-like 3 |
| chr8_+_65733400 | 2.97 |
ENSRNOT00000089126
|
Uaca
|
uveal autoantigen with coiled-coil domains and ankyrin repeats |
| chr3_+_22640545 | 2.92 |
ENSRNOT00000064507
ENSRNOT00000014452 |
Lhx2
|
LIM homeobox 2 |
| chr1_-_199823386 | 2.90 |
ENSRNOT00000027375
|
Rgs10
|
regulator of G-protein signaling 10 |
| chr1_+_226077120 | 2.90 |
ENSRNOT00000027611
|
Rab3il1
|
RAB3A interacting protein-like 1 |
| chr1_+_31835000 | 2.88 |
ENSRNOT00000020780
|
Cep72
|
centrosomal protein 72 |
| chr3_-_153188915 | 2.88 |
ENSRNOT00000079893
|
Soga1
|
suppressor of glucose, autophagy associated 1 |
| chr13_-_88943592 | 2.87 |
ENSRNOT00000032218
|
LOC100361087
|
hypothetical LOC100361087 |
| chr14_-_10749120 | 2.85 |
ENSRNOT00000003046
|
Cops4
|
COP9 signalosome subunit 4 |
| chr19_+_57650163 | 2.84 |
ENSRNOT00000038257
ENSRNOT00000083572 |
Sprtn
|
SprT-like N-terminal domain |
| chr7_-_117257402 | 2.82 |
ENSRNOT00000081021
|
Plec
|
plectin |
| chr1_-_59732409 | 2.82 |
ENSRNOT00000014824
|
Has1
|
hyaluronan synthase 1 |
| chr4_-_147742114 | 2.82 |
ENSRNOT00000041464
|
Efcab12
|
EF-hand calcium binding domain 12 |
| chr16_+_71629525 | 2.81 |
ENSRNOT00000035347
ENSRNOT00000088462 |
Tacc1
|
transforming, acidic coiled-coil containing protein 1 |
| chr10_+_108630823 | 2.77 |
ENSRNOT00000078478
ENSRNOT00000004966 |
Endov
|
endonuclease V |
| chr16_+_73584521 | 2.75 |
ENSRNOT00000024301
|
Gins4
|
GINS complex subunit 4 |
| chr10_-_13996565 | 2.70 |
ENSRNOT00000016221
ENSRNOT00000052138 |
Tsc2
|
tuberous sclerosis 2 |
| chrX_-_71313513 | 2.70 |
ENSRNOT00000004972
ENSRNOT00000076008 ENSRNOT00000076042 |
Zmym3
|
zinc finger MYM-type containing 3 |
| chr2_+_244058186 | 2.67 |
ENSRNOT00000021381
|
Tspan5
|
tetraspanin 5 |
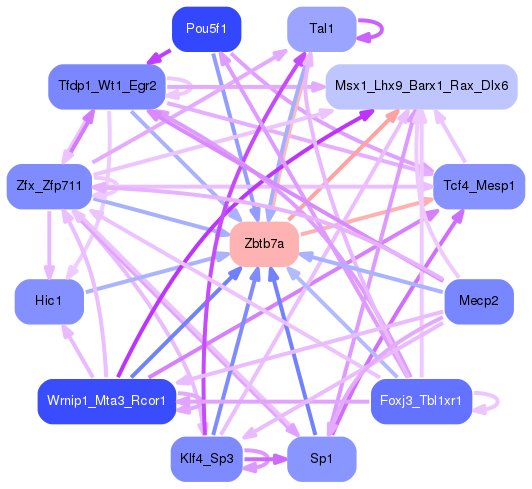
Network of associatons between targets according to the STRING database.

First level regulatory network of Zbtb7a
Gene Ontology Analysis
Gene overrepresentation in biological process category:
| Log-likelihood per target | Total log-likelihood | Term | Description |
|---|---|---|---|
| 6.8 | 20.4 | GO:0018201 | peptidyl-glycine modification(GO:0018201) |
| 5.9 | 17.8 | GO:0098971 | anterograde dendritic transport of neurotransmitter receptor complex(GO:0098971) |
| 5.4 | 16.1 | GO:0072720 | response to dithiothreitol(GO:0072720) |
| 4.4 | 21.8 | GO:0001552 | ovarian follicle atresia(GO:0001552) |
| 3.5 | 10.6 | GO:0006682 | galactosylceramide biosynthetic process(GO:0006682) galactolipid biosynthetic process(GO:0019375) |
| 3.0 | 15.0 | GO:0035106 | operant conditioning(GO:0035106) |
| 2.7 | 8.1 | GO:1990926 | short-term synaptic potentiation(GO:1990926) |
| 2.1 | 6.4 | GO:0018364 | peptidyl-glutamine methylation(GO:0018364) |
| 1.9 | 5.6 | GO:0030237 | female sex determination(GO:0030237) |
| 1.8 | 7.1 | GO:0070494 | regulation of thrombin receptor signaling pathway(GO:0070494) negative regulation of thrombin receptor signaling pathway(GO:0070495) |
| 1.7 | 27.6 | GO:0045741 | positive regulation of epidermal growth factor-activated receptor activity(GO:0045741) |
| 1.6 | 6.4 | GO:0038128 | ERBB2 signaling pathway(GO:0038128) |
| 1.6 | 6.3 | GO:0034436 | glycoprotein transport(GO:0034436) |
| 1.6 | 12.5 | GO:0090273 | regulation of somatostatin secretion(GO:0090273) |
| 1.5 | 12.1 | GO:0016191 | synaptic vesicle uncoating(GO:0016191) |
| 1.4 | 4.3 | GO:0019244 | lactate biosynthetic process from pyruvate(GO:0019244) |
| 1.4 | 8.3 | GO:0086048 | membrane depolarization during bundle of His cell action potential(GO:0086048) positive regulation of high voltage-gated calcium channel activity(GO:1901843) |
| 1.4 | 9.6 | GO:0002175 | protein localization to paranode region of axon(GO:0002175) |
| 1.3 | 5.2 | GO:0008355 | olfactory learning(GO:0008355) |
| 1.3 | 15.1 | GO:0097623 | potassium ion export across plasma membrane(GO:0097623) |
| 1.2 | 9.9 | GO:0019800 | peptide cross-linking via chondroitin 4-sulfate glycosaminoglycan(GO:0019800) |
| 1.2 | 3.5 | GO:0086047 | membrane depolarization during Purkinje myocyte cell action potential(GO:0086047) |
| 1.2 | 12.7 | GO:0031915 | positive regulation of synaptic plasticity(GO:0031915) |
| 1.1 | 4.5 | GO:0035582 | sequestering of BMP in extracellular matrix(GO:0035582) |
| 1.1 | 4.4 | GO:0014826 | vein smooth muscle contraction(GO:0014826) |
| 1.0 | 5.2 | GO:0043985 | histone H4-R3 methylation(GO:0043985) |
| 1.0 | 3.1 | GO:0002541 | activation of plasma proteins involved in acute inflammatory response(GO:0002541) |
| 1.0 | 2.9 | GO:0033566 | gamma-tubulin complex localization(GO:0033566) |
| 0.9 | 3.7 | GO:0007228 | positive regulation of hh target transcription factor activity(GO:0007228) |
| 0.9 | 1.8 | GO:0000189 | MAPK import into nucleus(GO:0000189) |
| 0.9 | 12.5 | GO:0036065 | fucosylation(GO:0036065) |
| 0.9 | 15.0 | GO:0060294 | cilium movement involved in cell motility(GO:0060294) |
| 0.9 | 12.3 | GO:0016127 | cholesterol catabolic process(GO:0006707) sterol catabolic process(GO:0016127) |
| 0.9 | 3.5 | GO:0060160 | negative regulation of dopamine receptor signaling pathway(GO:0060160) |
| 0.9 | 2.6 | GO:0045799 | positive regulation of chromatin assembly or disassembly(GO:0045799) |
| 0.8 | 26.2 | GO:0007413 | axonal fasciculation(GO:0007413) |
| 0.8 | 9.8 | GO:0051901 | positive regulation of mitochondrial depolarization(GO:0051901) |
| 0.8 | 4.0 | GO:2000672 | negative regulation of motor neuron apoptotic process(GO:2000672) |
| 0.8 | 6.1 | GO:0070294 | renal sodium ion absorption(GO:0070294) |
| 0.8 | 24.2 | GO:0098926 | postsynaptic signal transduction(GO:0098926) |
| 0.7 | 2.2 | GO:1900126 | negative regulation of hyaluronan biosynthetic process(GO:1900126) |
| 0.7 | 3.6 | GO:0032962 | positive regulation of inositol trisphosphate biosynthetic process(GO:0032962) |
| 0.7 | 2.8 | GO:0045226 | extracellular polysaccharide biosynthetic process(GO:0045226) extracellular polysaccharide metabolic process(GO:0046379) |
| 0.7 | 5.6 | GO:0002091 | negative regulation of receptor internalization(GO:0002091) |
| 0.7 | 4.1 | GO:2001025 | positive regulation of response to drug(GO:2001025) |
| 0.7 | 2.0 | GO:0070084 | protein initiator methionine removal(GO:0070084) |
| 0.6 | 1.3 | GO:0051012 | microtubule sliding(GO:0051012) |
| 0.6 | 1.7 | GO:1904219 | regulation of CDP-diacylglycerol-serine O-phosphatidyltransferase activity(GO:1904217) positive regulation of CDP-diacylglycerol-serine O-phosphatidyltransferase activity(GO:1904219) positive regulation of serine C-palmitoyltransferase activity(GO:1904222) |
| 0.6 | 3.9 | GO:0060285 | cilium or flagellum-dependent cell motility(GO:0001539) cilium-dependent cell motility(GO:0060285) |
| 0.5 | 2.7 | GO:0000727 | double-strand break repair via break-induced replication(GO:0000727) |
| 0.5 | 2.7 | GO:0048550 | protein transport into plasma membrane raft(GO:0044861) negative regulation of pinocytosis(GO:0048550) |
| 0.5 | 2.1 | GO:0042322 | negative regulation of circadian sleep/wake cycle, REM sleep(GO:0042322) |
| 0.5 | 3.2 | GO:0019509 | L-methionine biosynthetic process from methylthioadenosine(GO:0019509) |
| 0.5 | 1.6 | GO:1902595 | regulation of DNA replication origin binding(GO:1902595) |
| 0.5 | 2.6 | GO:0030382 | sperm mitochondrion organization(GO:0030382) |
| 0.5 | 9.8 | GO:0045760 | positive regulation of action potential(GO:0045760) |
| 0.5 | 2.0 | GO:0051542 | elastin biosynthetic process(GO:0051542) |
| 0.5 | 2.5 | GO:0014878 | response to electrical stimulus involved in regulation of muscle adaptation(GO:0014878) |
| 0.5 | 4.0 | GO:0014054 | positive regulation of gamma-aminobutyric acid secretion(GO:0014054) |
| 0.5 | 3.5 | GO:0060754 | positive regulation of mast cell chemotaxis(GO:0060754) |
| 0.5 | 2.0 | GO:0002337 | B-1a B cell differentiation(GO:0002337) |
| 0.5 | 1.0 | GO:0035520 | monoubiquitinated protein deubiquitination(GO:0035520) |
| 0.5 | 1.4 | GO:0016344 | meiotic chromosome movement towards spindle pole(GO:0016344) |
| 0.5 | 8.7 | GO:0031581 | hemidesmosome assembly(GO:0031581) |
| 0.4 | 2.2 | GO:0009298 | GDP-mannose biosynthetic process(GO:0009298) |
| 0.4 | 5.3 | GO:0007175 | negative regulation of epidermal growth factor-activated receptor activity(GO:0007175) |
| 0.4 | 6.5 | GO:1902231 | positive regulation of intrinsic apoptotic signaling pathway in response to DNA damage(GO:1902231) |
| 0.4 | 3.9 | GO:2000766 | negative regulation of cytoplasmic translation(GO:2000766) |
| 0.4 | 2.5 | GO:0002536 | respiratory burst involved in inflammatory response(GO:0002536) |
| 0.4 | 0.8 | GO:1990792 | response to glial cell derived neurotrophic factor(GO:1990790) cellular response to glial cell derived neurotrophic factor(GO:1990792) |
| 0.4 | 0.8 | GO:0061734 | parkin-mediated mitophagy in response to mitochondrial depolarization(GO:0061734) |
| 0.4 | 1.2 | GO:0042197 | chlorinated hydrocarbon metabolic process(GO:0042196) halogenated hydrocarbon metabolic process(GO:0042197) |
| 0.4 | 3.9 | GO:0034983 | peptidyl-lysine deacetylation(GO:0034983) |
| 0.4 | 3.4 | GO:0044351 | macropinocytosis(GO:0044351) |
| 0.4 | 5.2 | GO:0042118 | endothelial cell activation(GO:0042118) |
| 0.4 | 4.8 | GO:0072711 | response to hydroxyurea(GO:0072710) cellular response to hydroxyurea(GO:0072711) |
| 0.4 | 1.1 | GO:0002840 | T cell mediated immune response to tumor cell(GO:0002424) regulation of T cell mediated immune response to tumor cell(GO:0002840) |
| 0.4 | 8.5 | GO:0048240 | sperm capacitation(GO:0048240) |
| 0.4 | 18.0 | GO:0000381 | regulation of alternative mRNA splicing, via spliceosome(GO:0000381) |
| 0.3 | 5.4 | GO:2000369 | regulation of clathrin-mediated endocytosis(GO:2000369) |
| 0.3 | 1.0 | GO:1903588 | negative regulation of blood vessel endothelial cell proliferation involved in sprouting angiogenesis(GO:1903588) |
| 0.3 | 5.3 | GO:0021702 | cerebellar Purkinje cell differentiation(GO:0021702) |
| 0.3 | 2.6 | GO:0044828 | negative regulation by host of viral genome replication(GO:0044828) |
| 0.3 | 4.5 | GO:0016102 | retinoic acid biosynthetic process(GO:0002138) diterpenoid biosynthetic process(GO:0016102) |
| 0.3 | 4.8 | GO:0071880 | adenylate cyclase-activating adrenergic receptor signaling pathway(GO:0071880) |
| 0.3 | 4.9 | GO:0010818 | T cell chemotaxis(GO:0010818) |
| 0.3 | 0.6 | GO:2000409 | positive regulation of T cell extravasation(GO:2000409) |
| 0.3 | 3.9 | GO:0051013 | microtubule severing(GO:0051013) |
| 0.3 | 7.2 | GO:0015721 | bile acid and bile salt transport(GO:0015721) |
| 0.3 | 3.6 | GO:1904424 | regulation of GTP binding(GO:1904424) |
| 0.3 | 0.9 | GO:0038031 | non-canonical Wnt signaling pathway via JNK cascade(GO:0038031) |
| 0.3 | 12.4 | GO:2000300 | regulation of synaptic vesicle exocytosis(GO:2000300) |
| 0.3 | 10.9 | GO:0007212 | dopamine receptor signaling pathway(GO:0007212) |
| 0.3 | 2.8 | GO:0000338 | protein deneddylation(GO:0000338) |
| 0.3 | 13.9 | GO:0045739 | positive regulation of DNA repair(GO:0045739) |
| 0.3 | 4.4 | GO:0000042 | protein targeting to Golgi(GO:0000042) |
| 0.3 | 1.8 | GO:0030579 | ubiquitin-dependent SMAD protein catabolic process(GO:0030579) |
| 0.3 | 1.8 | GO:0000492 | box C/D snoRNP assembly(GO:0000492) |
| 0.3 | 0.8 | GO:0090158 | endoplasmic reticulum membrane organization(GO:0090158) |
| 0.2 | 4.7 | GO:0070932 | histone H3 deacetylation(GO:0070932) |
| 0.2 | 1.7 | GO:0001766 | membrane raft polarization(GO:0001766) membrane raft distribution(GO:0031580) |
| 0.2 | 0.9 | GO:1902606 | regulation of large conductance calcium-activated potassium channel activity(GO:1902606) positive regulation of large conductance calcium-activated potassium channel activity(GO:1902608) |
| 0.2 | 6.2 | GO:0060716 | labyrinthine layer blood vessel development(GO:0060716) |
| 0.2 | 1.8 | GO:0098789 | pre-mRNA cleavage required for polyadenylation(GO:0098789) |
| 0.2 | 2.9 | GO:0045199 | maintenance of epithelial cell apical/basal polarity(GO:0045199) |
| 0.2 | 2.9 | GO:0045721 | negative regulation of gluconeogenesis(GO:0045721) |
| 0.2 | 2.2 | GO:0071688 | striated muscle myosin thick filament assembly(GO:0071688) |
| 0.2 | 1.3 | GO:0042989 | sequestering of actin monomers(GO:0042989) |
| 0.2 | 0.4 | GO:1903281 | positive regulation of calcium:sodium antiporter activity(GO:1903281) |
| 0.2 | 0.8 | GO:0021526 | medial motor column neuron differentiation(GO:0021526) |
| 0.2 | 1.0 | GO:0070940 | dephosphorylation of RNA polymerase II C-terminal domain(GO:0070940) |
| 0.2 | 3.7 | GO:0006855 | drug transmembrane transport(GO:0006855) |
| 0.2 | 2.1 | GO:1990403 | embryonic brain development(GO:1990403) |
| 0.2 | 2.8 | GO:0022027 | interkinetic nuclear migration(GO:0022027) |
| 0.2 | 8.7 | GO:0021762 | substantia nigra development(GO:0021762) |
| 0.2 | 3.7 | GO:0006298 | mismatch repair(GO:0006298) |
| 0.2 | 0.5 | GO:1903595 | positive regulation of histamine secretion by mast cell(GO:1903595) |
| 0.2 | 2.5 | GO:0031573 | intra-S DNA damage checkpoint(GO:0031573) |
| 0.2 | 7.1 | GO:1904893 | negative regulation of JAK-STAT cascade(GO:0046426) negative regulation of STAT cascade(GO:1904893) |
| 0.2 | 0.8 | GO:0044340 | canonical Wnt signaling pathway involved in regulation of cell proliferation(GO:0044340) |
| 0.2 | 22.6 | GO:0035023 | regulation of Rho protein signal transduction(GO:0035023) |
| 0.2 | 1.6 | GO:0090070 | positive regulation of ribosome biogenesis(GO:0090070) positive regulation of rRNA processing(GO:2000234) |
| 0.2 | 3.7 | GO:0045736 | negative regulation of cyclin-dependent protein serine/threonine kinase activity(GO:0045736) |
| 0.2 | 8.0 | GO:0014065 | phosphatidylinositol 3-kinase signaling(GO:0014065) |
| 0.2 | 5.9 | GO:0007214 | gamma-aminobutyric acid signaling pathway(GO:0007214) |
| 0.1 | 0.4 | GO:1905065 | positive regulation of vascular smooth muscle cell differentiation(GO:1905065) |
| 0.1 | 1.6 | GO:0051127 | positive regulation of actin nucleation(GO:0051127) |
| 0.1 | 3.0 | GO:0042347 | negative regulation of NF-kappaB import into nucleus(GO:0042347) |
| 0.1 | 5.6 | GO:0007340 | acrosome reaction(GO:0007340) |
| 0.1 | 0.6 | GO:1903225 | negative regulation of endodermal cell differentiation(GO:1903225) |
| 0.1 | 2.2 | GO:1901663 | ubiquinone biosynthetic process(GO:0006744) quinone biosynthetic process(GO:1901663) |
| 0.1 | 0.3 | GO:0072054 | establishment or maintenance of polarity of embryonic epithelium(GO:0016332) renal outer medulla development(GO:0072054) |
| 0.1 | 1.7 | GO:0007076 | mitotic chromosome condensation(GO:0007076) |
| 0.1 | 5.3 | GO:0030199 | collagen fibril organization(GO:0030199) |
| 0.1 | 3.6 | GO:0006335 | DNA replication-dependent nucleosome assembly(GO:0006335) DNA replication-dependent nucleosome organization(GO:0034723) |
| 0.1 | 0.5 | GO:0033578 | protein glycosylation in Golgi(GO:0033578) |
| 0.1 | 2.3 | GO:0010569 | regulation of double-strand break repair via homologous recombination(GO:0010569) |
| 0.1 | 1.8 | GO:0090129 | positive regulation of synapse maturation(GO:0090129) |
| 0.1 | 3.0 | GO:0030517 | negative regulation of axon extension(GO:0030517) |
| 0.1 | 9.2 | GO:0032024 | positive regulation of insulin secretion(GO:0032024) |
| 0.1 | 7.3 | GO:0048168 | regulation of neuronal synaptic plasticity(GO:0048168) |
| 0.1 | 5.8 | GO:2000649 | regulation of sodium ion transmembrane transporter activity(GO:2000649) |
| 0.1 | 6.8 | GO:0071427 | mRNA export from nucleus(GO:0006406) mRNA-containing ribonucleoprotein complex export from nucleus(GO:0071427) |
| 0.1 | 1.6 | GO:0033235 | positive regulation of protein sumoylation(GO:0033235) |
| 0.1 | 1.6 | GO:0019532 | oxalate transport(GO:0019532) sulfate transmembrane transport(GO:1902358) |
| 0.1 | 6.3 | GO:0034394 | protein localization to cell surface(GO:0034394) |
| 0.1 | 0.3 | GO:1900220 | semaphorin-plexin signaling pathway involved in bone trabecula morphogenesis(GO:1900220) |
| 0.1 | 1.8 | GO:0070208 | protein heterotrimerization(GO:0070208) |
| 0.1 | 4.6 | GO:0071277 | cellular response to calcium ion(GO:0071277) |
| 0.1 | 0.2 | GO:0060982 | coronary artery morphogenesis(GO:0060982) |
| 0.1 | 3.3 | GO:0030818 | negative regulation of cAMP biosynthetic process(GO:0030818) |
| 0.1 | 4.5 | GO:0000413 | protein peptidyl-prolyl isomerization(GO:0000413) |
| 0.1 | 14.0 | GO:0019722 | calcium-mediated signaling(GO:0019722) |
| 0.1 | 20.0 | GO:0071805 | cellular potassium ion transport(GO:0071804) potassium ion transmembrane transport(GO:0071805) |
| 0.1 | 0.9 | GO:0018410 | C-terminal protein amino acid modification(GO:0018410) |
| 0.1 | 1.7 | GO:0002183 | cytoplasmic translational initiation(GO:0002183) |
| 0.1 | 0.8 | GO:0051182 | folic acid transport(GO:0015884) coenzyme transport(GO:0051182) |
| 0.1 | 1.4 | GO:0090005 | negative regulation of establishment of protein localization to plasma membrane(GO:0090005) |
| 0.1 | 0.5 | GO:0035610 | protein side chain deglutamylation(GO:0035610) |
| 0.1 | 8.3 | GO:1903955 | positive regulation of protein targeting to mitochondrion(GO:1903955) |
| 0.1 | 7.6 | GO:0060021 | palate development(GO:0060021) |
| 0.1 | 2.4 | GO:0050772 | positive regulation of axonogenesis(GO:0050772) |
| 0.1 | 14.8 | GO:0097485 | neuron projection guidance(GO:0097485) |
| 0.1 | 4.6 | GO:0070936 | protein K48-linked ubiquitination(GO:0070936) |
| 0.1 | 2.7 | GO:0045747 | positive regulation of Notch signaling pathway(GO:0045747) |
| 0.1 | 2.4 | GO:0006270 | DNA replication initiation(GO:0006270) |
| 0.1 | 6.0 | GO:0032091 | negative regulation of protein binding(GO:0032091) |
| 0.1 | 3.5 | GO:0030516 | regulation of axon extension(GO:0030516) |
| 0.1 | 1.4 | GO:0016578 | histone deubiquitination(GO:0016578) |
| 0.1 | 0.9 | GO:0035871 | protein K11-linked deubiquitination(GO:0035871) |
| 0.1 | 1.4 | GO:0045987 | positive regulation of smooth muscle contraction(GO:0045987) |
| 0.1 | 2.0 | GO:0046825 | regulation of protein export from nucleus(GO:0046825) |
| 0.1 | 1.5 | GO:0061157 | mRNA destabilization(GO:0061157) |
| 0.1 | 15.3 | GO:0070588 | calcium ion transmembrane transport(GO:0070588) |
| 0.1 | 2.2 | GO:0008593 | regulation of Notch signaling pathway(GO:0008593) |
| 0.1 | 2.3 | GO:0006779 | porphyrin-containing compound biosynthetic process(GO:0006779) |
| 0.1 | 7.6 | GO:0000209 | protein polyubiquitination(GO:0000209) |
| 0.1 | 0.7 | GO:0017121 | phospholipid scrambling(GO:0017121) |
| 0.1 | 0.9 | GO:0043968 | histone H2A acetylation(GO:0043968) |
| 0.1 | 5.5 | GO:0000086 | G2/M transition of mitotic cell cycle(GO:0000086) |
| 0.1 | 1.7 | GO:0045214 | sarcomere organization(GO:0045214) |
| 0.1 | 4.3 | GO:0016579 | protein deubiquitination(GO:0016579) |
| 0.1 | 3.4 | GO:0008277 | regulation of G-protein coupled receptor protein signaling pathway(GO:0008277) |
| 0.1 | 1.2 | GO:2000179 | positive regulation of neural precursor cell proliferation(GO:2000179) |
| 0.0 | 3.4 | GO:0007218 | neuropeptide signaling pathway(GO:0007218) |
| 0.0 | 0.5 | GO:0010960 | magnesium ion homeostasis(GO:0010960) |
| 0.0 | 0.4 | GO:0018231 | peptidyl-L-cysteine S-palmitoylation(GO:0018230) peptidyl-S-diacylglycerol-L-cysteine biosynthetic process from peptidyl-cysteine(GO:0018231) |
| 0.0 | 3.5 | GO:0006334 | nucleosome assembly(GO:0006334) |
| 0.0 | 0.6 | GO:0097499 | protein localization to nonmotile primary cilium(GO:0097499) |
| 0.0 | 0.8 | GO:0045116 | protein neddylation(GO:0045116) |
| 0.0 | 1.0 | GO:0006378 | mRNA polyadenylation(GO:0006378) |
| 0.0 | 0.3 | GO:0051571 | positive regulation of histone H3-K4 methylation(GO:0051571) |
| 0.0 | 6.7 | GO:0042742 | defense response to bacterium(GO:0042742) |
| 0.0 | 4.1 | GO:0046546 | male gonad development(GO:0008584) development of primary male sexual characteristics(GO:0046546) |
| 0.0 | 4.7 | GO:0008654 | phospholipid biosynthetic process(GO:0008654) |
| 0.0 | 1.2 | GO:0034698 | response to gonadotropin(GO:0034698) |
| 0.0 | 0.1 | GO:0051792 | medium-chain fatty acid biosynthetic process(GO:0051792) |
| 0.0 | 0.3 | GO:1904262 | negative regulation of TORC1 signaling(GO:1904262) |
| 0.0 | 5.6 | GO:0007018 | microtubule-based movement(GO:0007018) |
| 0.0 | 0.9 | GO:0051123 | RNA polymerase II transcriptional preinitiation complex assembly(GO:0051123) |
| 0.0 | 0.8 | GO:0000387 | spliceosomal snRNP assembly(GO:0000387) |
| 0.0 | 0.1 | GO:0006431 | methionyl-tRNA aminoacylation(GO:0006431) |
| 0.0 | 0.2 | GO:0006465 | signal peptide processing(GO:0006465) |
| 0.0 | 0.6 | GO:0001580 | detection of chemical stimulus involved in sensory perception of bitter taste(GO:0001580) |
| 0.0 | 0.2 | GO:0006003 | fructose 2,6-bisphosphate metabolic process(GO:0006003) |
| 0.0 | 0.4 | GO:0048701 | embryonic cranial skeleton morphogenesis(GO:0048701) |
| 0.0 | 0.4 | GO:0000470 | maturation of LSU-rRNA(GO:0000470) |
| 0.0 | 0.5 | GO:0032418 | lysosome localization(GO:0032418) |
Gene overrepresentation in cellular component category:
| Log-likelihood per target | Total log-likelihood | Term | Description |
|---|---|---|---|
| 2.9 | 11.6 | GO:1990812 | growth cone lamellipodium(GO:1990761) growth cone filopodium(GO:1990812) |
| 1.5 | 49.4 | GO:0097440 | apical dendrite(GO:0097440) |
| 1.3 | 4.0 | GO:0097058 | CRLF-CLCF1 complex(GO:0097058) |
| 1.3 | 12.7 | GO:0044300 | cerebellar mossy fiber(GO:0044300) |
| 1.2 | 6.0 | GO:0000835 | ER ubiquitin ligase complex(GO:0000835) Hrd1p ubiquitin ligase complex(GO:0000836) |
| 1.2 | 3.6 | GO:0033186 | CAF-1 complex(GO:0033186) |
| 1.1 | 4.4 | GO:0032299 | ribonuclease H2 complex(GO:0032299) |
| 0.9 | 2.7 | GO:0000811 | GINS complex(GO:0000811) |
| 0.9 | 2.7 | GO:0033596 | TSC1-TSC2 complex(GO:0033596) |
| 0.9 | 2.6 | GO:0002944 | cyclin K-CDK12 complex(GO:0002944) cyclin K-CDK13 complex(GO:0002945) |
| 0.9 | 17.1 | GO:0097038 | perinuclear endoplasmic reticulum(GO:0097038) |
| 0.8 | 6.4 | GO:0031428 | box C/D snoRNP complex(GO:0031428) |
| 0.8 | 35.5 | GO:0005891 | voltage-gated calcium channel complex(GO:0005891) |
| 0.8 | 2.3 | GO:0031372 | UBC13-MMS2 complex(GO:0031372) |
| 0.7 | 8.1 | GO:0032009 | early phagosome(GO:0032009) |
| 0.7 | 4.4 | GO:0030681 | nucleolar ribonuclease P complex(GO:0005655) ribonuclease P complex(GO:0030677) multimeric ribonuclease P complex(GO:0030681) |
| 0.7 | 3.5 | GO:0000120 | RNA polymerase I transcription factor complex(GO:0000120) |
| 0.7 | 12.7 | GO:0043196 | varicosity(GO:0043196) |
| 0.6 | 2.4 | GO:0005606 | laminin-1 complex(GO:0005606) laminin-10 complex(GO:0043259) |
| 0.6 | 6.0 | GO:1990635 | proximal dendrite(GO:1990635) |
| 0.6 | 4.8 | GO:0030915 | Smc5-Smc6 complex(GO:0030915) |
| 0.6 | 3.0 | GO:0043293 | apoptosome(GO:0043293) |
| 0.6 | 1.7 | GO:0042585 | germinal vesicle(GO:0042585) |
| 0.5 | 5.4 | GO:0071439 | clathrin complex(GO:0071439) |
| 0.5 | 9.6 | GO:0033391 | chromatoid body(GO:0033391) |
| 0.5 | 1.8 | GO:0005726 | perichromatin fibrils(GO:0005726) |
| 0.4 | 8.4 | GO:0001741 | XY body(GO:0001741) |
| 0.4 | 8.0 | GO:0090665 | dystrophin-associated glycoprotein complex(GO:0016010) glycoprotein complex(GO:0090665) |
| 0.4 | 2.4 | GO:0030896 | checkpoint clamp complex(GO:0030896) |
| 0.4 | 10.0 | GO:0008074 | guanylate cyclase complex, soluble(GO:0008074) |
| 0.4 | 2.3 | GO:0008091 | spectrin(GO:0008091) spectrin-associated cytoskeleton(GO:0014731) |
| 0.4 | 2.2 | GO:0032280 | symmetric synapse(GO:0032280) |
| 0.4 | 2.2 | GO:1990393 | 3M complex(GO:1990393) |
| 0.4 | 9.6 | GO:0033270 | paranode region of axon(GO:0033270) |
| 0.4 | 3.9 | GO:0072687 | meiotic spindle(GO:0072687) |
| 0.3 | 3.7 | GO:0044294 | dendritic growth cone(GO:0044294) |
| 0.3 | 6.3 | GO:0034385 | very-low-density lipoprotein particle(GO:0034361) triglyceride-rich lipoprotein particle(GO:0034385) |
| 0.3 | 2.2 | GO:0097197 | tetraspanin-enriched microdomain(GO:0097197) |
| 0.3 | 4.1 | GO:0000276 | mitochondrial proton-transporting ATP synthase complex, coupling factor F(o)(GO:0000276) |
| 0.3 | 8.5 | GO:0002080 | acrosomal membrane(GO:0002080) |
| 0.3 | 8.7 | GO:0032281 | AMPA glutamate receptor complex(GO:0032281) |
| 0.3 | 1.4 | GO:1990726 | Lsm1-7-Pat1 complex(GO:1990726) |
| 0.3 | 11.4 | GO:0005834 | heterotrimeric G-protein complex(GO:0005834) |
| 0.3 | 3.5 | GO:0033268 | node of Ranvier(GO:0033268) |
| 0.3 | 1.6 | GO:0089701 | U2AF(GO:0089701) |
| 0.3 | 2.4 | GO:0005664 | origin recognition complex(GO:0000808) nuclear origin of replication recognition complex(GO:0005664) |
| 0.3 | 1.0 | GO:0097165 | nuclear stress granule(GO:0097165) |
| 0.3 | 0.8 | GO:0014701 | junctional sarcoplasmic reticulum membrane(GO:0014701) |
| 0.2 | 1.4 | GO:0030478 | actin cap(GO:0030478) |
| 0.2 | 12.4 | GO:0048786 | presynaptic active zone(GO:0048786) |
| 0.2 | 3.5 | GO:0031527 | filopodium membrane(GO:0031527) |
| 0.2 | 1.7 | GO:0033290 | eukaryotic 43S preinitiation complex(GO:0016282) eukaryotic 48S preinitiation complex(GO:0033290) eukaryotic translation initiation factor 3 complex, eIF3m(GO:0071541) |
| 0.2 | 3.0 | GO:0005847 | mRNA cleavage and polyadenylation specificity factor complex(GO:0005847) |
| 0.2 | 12.6 | GO:0031594 | neuromuscular junction(GO:0031594) |
| 0.2 | 12.9 | GO:0005881 | cytoplasmic microtubule(GO:0005881) |
| 0.2 | 10.2 | GO:0005844 | polysome(GO:0005844) |
| 0.2 | 1.8 | GO:0031143 | pseudopodium(GO:0031143) |
| 0.2 | 4.2 | GO:0032588 | trans-Golgi network membrane(GO:0032588) |
| 0.2 | 2.2 | GO:0032433 | filopodium tip(GO:0032433) |
| 0.2 | 17.2 | GO:0036126 | sperm flagellum(GO:0036126) |
| 0.2 | 15.4 | GO:0031225 | anchored component of membrane(GO:0031225) |
| 0.1 | 2.8 | GO:0030056 | hemidesmosome(GO:0030056) |
| 0.1 | 1.3 | GO:0005742 | mitochondrial outer membrane translocase complex(GO:0005742) |
| 0.1 | 0.9 | GO:0005672 | transcription factor TFIIA complex(GO:0005672) |
| 0.1 | 1.6 | GO:0030688 | preribosome, small subunit precursor(GO:0030688) |
| 0.1 | 0.6 | GO:0005588 | collagen type V trimer(GO:0005588) |
| 0.1 | 17.4 | GO:0005795 | Golgi stack(GO:0005795) |
| 0.1 | 0.9 | GO:1990909 | Wnt signalosome(GO:1990909) |
| 0.1 | 1.7 | GO:0005916 | fascia adherens(GO:0005916) |
| 0.1 | 11.0 | GO:0008076 | voltage-gated potassium channel complex(GO:0008076) |
| 0.1 | 20.8 | GO:0008021 | synaptic vesicle(GO:0008021) |
| 0.1 | 0.8 | GO:0090571 | RNA polymerase II transcription repressor complex(GO:0090571) |
| 0.1 | 5.9 | GO:0034707 | chloride channel complex(GO:0034707) |
| 0.1 | 10.2 | GO:0005604 | basement membrane(GO:0005604) |
| 0.1 | 8.2 | GO:0001669 | acrosomal vesicle(GO:0001669) |
| 0.1 | 2.9 | GO:0034451 | centriolar satellite(GO:0034451) |
| 0.1 | 4.3 | GO:0031514 | motile cilium(GO:0031514) |
| 0.1 | 5.2 | GO:0005930 | axoneme(GO:0005930) ciliary plasm(GO:0097014) |
| 0.1 | 0.9 | GO:0000812 | Swr1 complex(GO:0000812) |
| 0.1 | 2.9 | GO:0030286 | dynein complex(GO:0030286) |
| 0.1 | 1.2 | GO:0032391 | photoreceptor connecting cilium(GO:0032391) |
| 0.1 | 1.6 | GO:0032839 | dendrite cytoplasm(GO:0032839) |
| 0.1 | 14.5 | GO:0005578 | proteinaceous extracellular matrix(GO:0005578) |
| 0.1 | 1.9 | GO:0030686 | 90S preribosome(GO:0030686) |
| 0.1 | 2.9 | GO:0031901 | early endosome membrane(GO:0031901) |
| 0.0 | 0.3 | GO:0016593 | Cdc73/Paf1 complex(GO:0016593) |
| 0.0 | 1.8 | GO:0042734 | presynaptic membrane(GO:0042734) |
| 0.0 | 3.3 | GO:0071013 | catalytic step 2 spliceosome(GO:0071013) |
| 0.0 | 1.0 | GO:0051233 | spindle midzone(GO:0051233) |
| 0.0 | 0.8 | GO:0001891 | phagocytic cup(GO:0001891) |
| 0.0 | 0.1 | GO:0032301 | MutSalpha complex(GO:0032301) |
| 0.0 | 0.4 | GO:0005890 | sodium:potassium-exchanging ATPase complex(GO:0005890) |
| 0.0 | 0.2 | GO:0005787 | signal peptidase complex(GO:0005787) |
| 0.0 | 1.8 | GO:0000118 | histone deacetylase complex(GO:0000118) |
| 0.0 | 7.8 | GO:0016607 | nuclear speck(GO:0016607) |
| 0.0 | 2.5 | GO:0030018 | Z disc(GO:0030018) |
| 0.0 | 7.9 | GO:0005813 | centrosome(GO:0005813) |
| 0.0 | 4.0 | GO:0032993 | protein-DNA complex(GO:0032993) |
| 0.0 | 0.9 | GO:0017053 | transcriptional repressor complex(GO:0017053) |
| 0.0 | 1.7 | GO:0043204 | perikaryon(GO:0043204) |
| 0.0 | 1.7 | GO:0001650 | fibrillar center(GO:0001650) |
Gene overrepresentation in molecular function category:
| Log-likelihood per target | Total log-likelihood | Term | Description |
|---|---|---|---|
| 3.0 | 15.1 | GO:0005250 | A-type (transient outward) potassium channel activity(GO:0005250) |
| 2.8 | 8.3 | GO:0086057 | voltage-gated calcium channel activity involved in bundle of His cell action potential(GO:0086057) |
| 2.6 | 10.6 | GO:0008489 | UDP-galactose:glucosylceramide beta-1,4-galactosyltransferase activity(GO:0008489) |
| 2.5 | 12.5 | GO:0008332 | low voltage-gated calcium channel activity(GO:0008332) |
| 2.2 | 21.8 | GO:0031957 | very long-chain fatty acid-CoA ligase activity(GO:0031957) |
| 2.2 | 6.5 | GO:0004938 | alpha2-adrenergic receptor activity(GO:0004938) |
| 2.1 | 6.4 | GO:0031728 | CCR3 chemokine receptor binding(GO:0031728) |
| 2.1 | 6.3 | GO:0034437 | glycoprotein transporter activity(GO:0034437) |
| 2.1 | 12.5 | GO:0046920 | alpha-(1->3)-fucosyltransferase activity(GO:0046920) |
| 2.0 | 16.1 | GO:0050291 | sphingosine N-acyltransferase activity(GO:0050291) |
| 1.7 | 5.2 | GO:0001011 | transcription factor activity, sequence-specific DNA binding, RNA polymerase recruiting(GO:0001011) transcription factor activity, TFIIB-class binding(GO:0001087) |
| 1.5 | 4.6 | GO:0016015 | morphogen activity(GO:0016015) |
| 1.5 | 4.4 | GO:0031708 | endothelin B receptor binding(GO:0031708) |
| 1.2 | 25.6 | GO:0008266 | poly(U) RNA binding(GO:0008266) |
| 1.2 | 7.2 | GO:0008508 | bile acid:sodium symporter activity(GO:0008508) |
| 1.1 | 7.9 | GO:0004111 | creatine kinase activity(GO:0004111) |
| 1.1 | 17.8 | GO:0008574 | ATP-dependent microtubule motor activity, plus-end-directed(GO:0008574) |
| 1.1 | 21.8 | GO:0031005 | filamin binding(GO:0031005) |
| 1.1 | 4.3 | GO:0004459 | L-lactate dehydrogenase activity(GO:0004459) |
| 0.9 | 3.7 | GO:0019784 | NEDD8-specific protease activity(GO:0019784) |
| 0.9 | 4.4 | GO:0004523 | RNA-DNA hybrid ribonuclease activity(GO:0004523) |
| 0.9 | 3.5 | GO:0031750 | D3 dopamine receptor binding(GO:0031750) |
| 0.9 | 5.2 | GO:0008294 | calcium- and calmodulin-responsive adenylate cyclase activity(GO:0008294) |
| 0.8 | 5.8 | GO:0004767 | sphingomyelin phosphodiesterase activity(GO:0004767) |
| 0.8 | 10.8 | GO:0030550 | acetylcholine receptor inhibitor activity(GO:0030550) |
| 0.7 | 3.5 | GO:0086062 | voltage-gated sodium channel activity involved in Purkinje myocyte action potential(GO:0086062) |
| 0.7 | 4.0 | GO:0005127 | ciliary neurotrophic factor receptor binding(GO:0005127) |
| 0.6 | 11.5 | GO:0004115 | 3',5'-cyclic-AMP phosphodiesterase activity(GO:0004115) |
| 0.6 | 6.0 | GO:1904264 | ubiquitin protein ligase activity involved in ERAD pathway(GO:1904264) |
| 0.6 | 2.8 | GO:0050501 | hyaluronan synthase activity(GO:0050501) |
| 0.6 | 2.2 | GO:0016492 | G-protein coupled neurotensin receptor activity(GO:0016492) |
| 0.6 | 11.6 | GO:0048156 | tau protein binding(GO:0048156) |
| 0.5 | 17.4 | GO:0043015 | gamma-tubulin binding(GO:0043015) |
| 0.5 | 3.7 | GO:0097322 | 7SK snRNA binding(GO:0097322) |
| 0.5 | 23.5 | GO:0005245 | voltage-gated calcium channel activity(GO:0005245) |
| 0.5 | 6.4 | GO:0008649 | rRNA methyltransferase activity(GO:0008649) |
| 0.5 | 13.1 | GO:0005540 | hyaluronic acid binding(GO:0005540) |
| 0.5 | 21.8 | GO:0045182 | translation regulator activity(GO:0045182) |
| 0.5 | 1.4 | GO:0032427 | GBD domain binding(GO:0032427) |
| 0.4 | 3.5 | GO:0001163 | RNA polymerase I regulatory region sequence-specific DNA binding(GO:0001163) RNA polymerase I CORE element sequence-specific DNA binding(GO:0001164) |
| 0.4 | 5.2 | GO:0005528 | macrolide binding(GO:0005527) FK506 binding(GO:0005528) |
| 0.4 | 5.4 | GO:0035612 | AP-2 adaptor complex binding(GO:0035612) |
| 0.4 | 1.6 | GO:0008187 | poly-pyrimidine tract binding(GO:0008187) |
| 0.4 | 3.7 | GO:0005113 | patched binding(GO:0005113) |
| 0.4 | 6.2 | GO:0008568 | microtubule-severing ATPase activity(GO:0008568) |
| 0.4 | 1.9 | GO:0052629 | phosphatidylinositol-3,5-bisphosphate 3-phosphatase activity(GO:0052629) |
| 0.4 | 1.1 | GO:0016971 | flavin-linked sulfhydryl oxidase activity(GO:0016971) |
| 0.4 | 3.9 | GO:0001025 | RNA polymerase III transcription factor binding(GO:0001025) |
| 0.4 | 4.2 | GO:0004983 | neuropeptide Y receptor activity(GO:0004983) |
| 0.3 | 4.5 | GO:0019841 | retinol binding(GO:0019841) |
| 0.3 | 10.6 | GO:0017075 | syntaxin-1 binding(GO:0017075) |
| 0.3 | 4.3 | GO:0042043 | neurexin family protein binding(GO:0042043) |
| 0.3 | 2.4 | GO:0043208 | glycosphingolipid binding(GO:0043208) |
| 0.3 | 6.5 | GO:0017091 | AU-rich element binding(GO:0017091) |
| 0.3 | 3.5 | GO:0005172 | vascular endothelial growth factor receptor binding(GO:0005172) |
| 0.3 | 4.2 | GO:0005092 | GDP-dissociation inhibitor activity(GO:0005092) |
| 0.3 | 2.8 | GO:0016888 | endodeoxyribonuclease activity, producing 5'-phosphomonoesters(GO:0016888) |
| 0.3 | 2.2 | GO:0032184 | SUMO polymer binding(GO:0032184) |
| 0.3 | 2.1 | GO:0070087 | chromo shadow domain binding(GO:0070087) |
| 0.3 | 1.8 | GO:0048495 | Roundabout binding(GO:0048495) |
| 0.3 | 3.6 | GO:0070679 | inositol 1,4,5 trisphosphate binding(GO:0070679) |
| 0.3 | 4.8 | GO:0004383 | guanylate cyclase activity(GO:0004383) |
| 0.2 | 37.6 | GO:0005267 | potassium channel activity(GO:0005267) |
| 0.2 | 5.9 | GO:0004890 | GABA-A receptor activity(GO:0004890) |
| 0.2 | 4.1 | GO:0017160 | Ral GTPase binding(GO:0017160) |
| 0.2 | 2.2 | GO:0016861 | intramolecular oxidoreductase activity, interconverting aldoses and ketoses(GO:0016861) |
| 0.2 | 1.4 | GO:0008273 | calcium, potassium:sodium antiporter activity(GO:0008273) |
| 0.2 | 4.1 | GO:0046933 | proton-transporting ATP synthase activity, rotational mechanism(GO:0046933) |
| 0.2 | 2.4 | GO:0008046 | axon guidance receptor activity(GO:0008046) |
| 0.2 | 5.6 | GO:0004693 | cyclin-dependent protein serine/threonine kinase activity(GO:0004693) |
| 0.2 | 2.0 | GO:0050811 | GABA receptor binding(GO:0050811) |
| 0.2 | 19.8 | GO:0017048 | Rho GTPase binding(GO:0017048) |
| 0.2 | 1.6 | GO:0035033 | histone deacetylase regulator activity(GO:0035033) |
| 0.2 | 8.7 | GO:0042169 | SH2 domain binding(GO:0042169) |
| 0.2 | 2.4 | GO:0003688 | DNA replication origin binding(GO:0003688) |
| 0.2 | 3.5 | GO:0016881 | acid-amino acid ligase activity(GO:0016881) |
| 0.2 | 2.7 | GO:0043138 | 3'-5' DNA helicase activity(GO:0043138) |
| 0.2 | 6.7 | GO:0001784 | phosphotyrosine binding(GO:0001784) |
| 0.2 | 2.2 | GO:0051371 | muscle alpha-actinin binding(GO:0051371) |
| 0.2 | 20.4 | GO:0016410 | N-acyltransferase activity(GO:0016410) |
| 0.2 | 3.6 | GO:0051010 | microtubule plus-end binding(GO:0051010) |
| 0.2 | 1.6 | GO:0035325 | Toll-like receptor binding(GO:0035325) |
| 0.2 | 0.5 | GO:1990460 | leptin receptor binding(GO:1990460) |
| 0.2 | 5.2 | GO:0030506 | ankyrin binding(GO:0030506) |
| 0.2 | 1.0 | GO:0008420 | CTD phosphatase activity(GO:0008420) |
| 0.2 | 8.1 | GO:0001786 | phosphatidylserine binding(GO:0001786) |
| 0.2 | 2.2 | GO:0001206 | transcriptional repressor activity, RNA polymerase II distal enhancer sequence-specific binding(GO:0001206) |
| 0.2 | 3.7 | GO:0015238 | drug transmembrane transporter activity(GO:0015238) |
| 0.2 | 1.7 | GO:0022889 | L-serine transmembrane transporter activity(GO:0015194) serine transmembrane transporter activity(GO:0022889) |
| 0.2 | 5.8 | GO:0005109 | frizzled binding(GO:0005109) |
| 0.2 | 2.1 | GO:0051378 | serotonin binding(GO:0051378) |
| 0.1 | 1.3 | GO:0015266 | protein channel activity(GO:0015266) |
| 0.1 | 5.8 | GO:0017080 | sodium channel regulator activity(GO:0017080) |
| 0.1 | 3.8 | GO:0032266 | phosphatidylinositol-3-phosphate binding(GO:0032266) |
| 0.1 | 1.7 | GO:0019911 | structural constituent of myelin sheath(GO:0019911) |
| 0.1 | 5.1 | GO:0016709 | oxidoreductase activity, acting on paired donors, with incorporation or reduction of molecular oxygen, NAD(P)H as one donor, and incorporation of one atom of oxygen(GO:0016709) |
| 0.1 | 0.5 | GO:0015165 | pyrimidine nucleotide-sugar transmembrane transporter activity(GO:0015165) |
| 0.1 | 7.9 | GO:0048306 | calcium-dependent protein binding(GO:0048306) |
| 0.1 | 12.5 | GO:0044325 | ion channel binding(GO:0044325) |
| 0.1 | 0.9 | GO:0004966 | galanin receptor activity(GO:0004966) |
| 0.1 | 1.8 | GO:0015643 | toxic substance binding(GO:0015643) |
| 0.1 | 7.6 | GO:0008186 | RNA helicase activity(GO:0003724) ATP-dependent RNA helicase activity(GO:0004004) RNA-dependent ATPase activity(GO:0008186) |
| 0.1 | 1.6 | GO:0019531 | oxalate transmembrane transporter activity(GO:0019531) |
| 0.1 | 20.5 | GO:0008017 | microtubule binding(GO:0008017) |
| 0.1 | 2.1 | GO:0099589 | G-protein coupled serotonin receptor activity(GO:0004993) serotonin receptor activity(GO:0099589) |
| 0.1 | 0.9 | GO:1990405 | protein antigen binding(GO:1990405) |
| 0.1 | 0.8 | GO:0008517 | folic acid transporter activity(GO:0008517) |
| 0.1 | 0.5 | GO:0009019 | tRNA (guanine-N1-)-methyltransferase activity(GO:0009019) |
| 0.1 | 2.5 | GO:0001965 | G-protein alpha-subunit binding(GO:0001965) |
| 0.1 | 0.3 | GO:1990269 | RNA polymerase II C-terminal domain phosphoserine binding(GO:1990269) |
| 0.1 | 2.0 | GO:0070006 | metalloaminopeptidase activity(GO:0070006) |
| 0.1 | 2.4 | GO:0003777 | microtubule motor activity(GO:0003777) |
| 0.1 | 7.1 | GO:0004860 | protein kinase inhibitor activity(GO:0004860) |
| 0.1 | 1.1 | GO:0030296 | protein tyrosine kinase activator activity(GO:0030296) |
| 0.1 | 0.4 | GO:0004716 | receptor signaling protein tyrosine kinase activity(GO:0004716) |
| 0.1 | 2.0 | GO:0005154 | epidermal growth factor receptor binding(GO:0005154) |
| 0.1 | 1.7 | GO:0005545 | 1-phosphatidylinositol binding(GO:0005545) |
| 0.1 | 0.7 | GO:0047429 | nucleoside-triphosphate diphosphatase activity(GO:0047429) |
| 0.1 | 0.7 | GO:0042609 | CD4 receptor binding(GO:0042609) |
| 0.1 | 1.6 | GO:0001671 | ATPase activator activity(GO:0001671) |
| 0.1 | 2.9 | GO:0015631 | tubulin binding(GO:0015631) |
| 0.1 | 2.6 | GO:0070888 | E-box binding(GO:0070888) |
| 0.1 | 35.9 | GO:0005509 | calcium ion binding(GO:0005509) |
| 0.1 | 1.3 | GO:0005546 | phosphatidylinositol-4,5-bisphosphate binding(GO:0005546) |
| 0.1 | 9.8 | GO:0042393 | histone binding(GO:0042393) |
| 0.1 | 0.1 | GO:0032142 | single guanine insertion binding(GO:0032142) |
| 0.1 | 23.9 | GO:0004842 | ubiquitin-protein transferase activity(GO:0004842) |
| 0.0 | 2.4 | GO:0008408 | 3'-5' exonuclease activity(GO:0008408) |
| 0.0 | 0.9 | GO:0071889 | 14-3-3 protein binding(GO:0071889) |
| 0.0 | 0.4 | GO:0005049 | nuclear export signal receptor activity(GO:0005049) |
| 0.0 | 0.6 | GO:0033038 | bitter taste receptor activity(GO:0033038) |
| 0.0 | 1.4 | GO:0030515 | snoRNA binding(GO:0030515) |
| 0.0 | 0.6 | GO:0048407 | platelet-derived growth factor binding(GO:0048407) |
| 0.0 | 2.3 | GO:0005518 | collagen binding(GO:0005518) |
| 0.0 | 0.1 | GO:0004315 | 3-oxoacyl-[acyl-carrier-protein] synthase activity(GO:0004315) |
| 0.0 | 0.9 | GO:0031369 | translation initiation factor binding(GO:0031369) |
| 0.0 | 2.7 | GO:0002020 | protease binding(GO:0002020) |
| 0.0 | 2.7 | GO:0004222 | metalloendopeptidase activity(GO:0004222) |
| 0.0 | 0.9 | GO:0017025 | RNA polymerase II repressing transcription factor binding(GO:0001103) TBP-class protein binding(GO:0017025) |
| 0.0 | 0.1 | GO:0004825 | methionine-tRNA ligase activity(GO:0004825) |
| 0.0 | 0.3 | GO:0017154 | semaphorin receptor activity(GO:0017154) |
| 0.0 | 1.5 | GO:0005089 | Rho guanyl-nucleotide exchange factor activity(GO:0005089) |
| 0.0 | 0.5 | GO:0003746 | translation elongation factor activity(GO:0003746) |
| 0.0 | 1.6 | GO:0008565 | protein transporter activity(GO:0008565) |
| 0.0 | 0.2 | GO:0003873 | 6-phosphofructo-2-kinase activity(GO:0003873) fructose-2,6-bisphosphate 2-phosphatase activity(GO:0004331) |
| 0.0 | 1.2 | GO:0001948 | glycoprotein binding(GO:0001948) |
| 0.0 | 1.0 | GO:0004197 | cysteine-type endopeptidase activity(GO:0004197) |
| 0.0 | 0.5 | GO:0003727 | single-stranded RNA binding(GO:0003727) |
Gene overrepresentation in curated gene sets: canonical pathways category:
| Log-likelihood per target | Total log-likelihood | Term | Description |
|---|---|---|---|
| 0.6 | 6.3 | ST JAK STAT PATHWAY | Jak-STAT Pathway |
| 0.5 | 20.5 | PID REELIN PATHWAY | Reelin signaling pathway |
| 0.5 | 20.5 | NABA PROTEOGLYCANS | Genes encoding proteoglycans |
| 0.5 | 10.0 | PID LPA4 PATHWAY | LPA4-mediated signaling events |
| 0.5 | 12.1 | PID RHODOPSIN PATHWAY | Visual signal transduction: Rods |
| 0.3 | 3.9 | PID RANBP2 PATHWAY | Sumoylation by RanBP2 regulates transcriptional repression |
| 0.3 | 3.5 | PID VEGF VEGFR PATHWAY | VEGF and VEGFR signaling network |
| 0.3 | 3.0 | PID P38 GAMMA DELTA PATHWAY | Signaling mediated by p38-gamma and p38-delta |
| 0.2 | 12.1 | PID RHOA PATHWAY | RhoA signaling pathway |
| 0.2 | 6.7 | PID AURORA A PATHWAY | Aurora A signaling |
| 0.2 | 8.8 | NABA BASEMENT MEMBRANES | Genes encoding structural components of basement membranes |
| 0.2 | 3.8 | PID PRL SIGNALING EVENTS PATHWAY | Signaling events mediated by PRL |
| 0.1 | 2.5 | PID FOXO PATHWAY | FoxO family signaling |
| 0.1 | 11.2 | PID P75 NTR PATHWAY | p75(NTR)-mediated signaling |
| 0.1 | 10.8 | PID ERA GENOMIC PATHWAY | Validated nuclear estrogen receptor alpha network |
| 0.1 | 3.8 | NABA COLLAGENS | Genes encoding collagen proteins |
| 0.1 | 2.2 | PID ARF 3PATHWAY | Arf1 pathway |
| 0.1 | 2.0 | PID ERBB NETWORK PATHWAY | ErbB receptor signaling network |
| 0.1 | 1.1 | PID SYNDECAN 3 PATHWAY | Syndecan-3-mediated signaling events |
| 0.1 | 4.9 | PID HEDGEHOG GLI PATHWAY | Hedgehog signaling events mediated by Gli proteins |
| 0.1 | 3.9 | PID DELTA NP63 PATHWAY | Validated transcriptional targets of deltaNp63 isoforms |
| 0.1 | 1.6 | PID IL1 PATHWAY | IL1-mediated signaling events |
| 0.1 | 9.6 | NABA CORE MATRISOME | Ensemble of genes encoding core extracellular matrix including ECM glycoproteins, collagens and proteoglycans |
| 0.1 | 1.8 | PID TAP63 PATHWAY | Validated transcriptional targets of TAp63 isoforms |
| 0.1 | 0.6 | SA B CELL RECEPTOR COMPLEXES | Antigen binding to B cell receptors activates protein tyrosine kinases, such as the Src family, which ultimate activate MAP kinases. |
| 0.0 | 14.7 | NABA SECRETED FACTORS | Genes encoding secreted soluble factors |
| 0.0 | 2.1 | PID INSULIN PATHWAY | Insulin Pathway |
| 0.0 | 2.5 | PID AR PATHWAY | Coregulation of Androgen receptor activity |
| 0.0 | 1.4 | SIG REGULATION OF THE ACTIN CYTOSKELETON BY RHO GTPASES | Genes related to regulation of the actin cytoskeleton |
| 0.0 | 0.4 | PID KIT PATHWAY | Signaling events mediated by Stem cell factor receptor (c-Kit) |
| 0.0 | 1.0 | PID FANCONI PATHWAY | Fanconi anemia pathway |
Gene overrepresentation in curated gene sets: REACTOME pathways category:
| Log-likelihood per target | Total log-likelihood | Term | Description |
|---|---|---|---|
| 2.3 | 20.4 | REACTOME MEMBRANE BINDING AND TARGETTING OF GAG PROTEINS | Genes involved in Membrane binding and targetting of GAG proteins |
| 1.3 | 16.0 | REACTOME PLATELET ADHESION TO EXPOSED COLLAGEN | Genes involved in Platelet Adhesion to exposed collagen |
| 1.1 | 19.6 | REACTOME CRMPS IN SEMA3A SIGNALING | Genes involved in CRMPs in Sema3A signaling |
| 1.1 | 14.1 | REACTOME TANDEM PORE DOMAIN POTASSIUM CHANNELS | Genes involved in Tandem pore domain potassium channels |
| 1.1 | 15.1 | REACTOME CS DS DEGRADATION | Genes involved in CS/DS degradation |
| 1.0 | 12.3 | REACTOME SYNTHESIS OF BILE ACIDS AND BILE SALTS VIA 24 HYDROXYCHOLESTEROL | Genes involved in Synthesis of bile acids and bile salts via 24-hydroxycholesterol |
| 0.8 | 14.3 | REACTOME RETROGRADE NEUROTROPHIN SIGNALLING | Genes involved in Retrograde neurotrophin signalling |
| 0.7 | 16.1 | REACTOME SIGNALING BY NODAL | Genes involved in Signaling by NODAL |
| 0.7 | 10.0 | REACTOME ADENYLATE CYCLASE ACTIVATING PATHWAY | Genes involved in Adenylate cyclase activating pathway |
| 0.6 | 17.8 | REACTOME KINESINS | Genes involved in Kinesins |
| 0.5 | 4.4 | REACTOME NEF MEDIATED DOWNREGULATION OF MHC CLASS I COMPLEX CELL SURFACE EXPRESSION | Genes involved in Nef mediated downregulation of MHC class I complex cell surface expression |
| 0.5 | 0.5 | REACTOME TRANSPORT OF MATURE MRNA DERIVED FROM AN INTRONLESS TRANSCRIPT | Genes involved in Transport of Mature mRNA Derived from an Intronless Transcript |
| 0.4 | 5.3 | REACTOME KERATAN SULFATE DEGRADATION | Genes involved in Keratan sulfate degradation |
| 0.4 | 11.4 | REACTOME ACYL CHAIN REMODELLING OF PE | Genes involved in Acyl chain remodelling of PE |
| 0.4 | 6.2 | REACTOME GABA A RECEPTOR ACTIVATION | Genes involved in GABA A receptor activation |
| 0.3 | 15.9 | REACTOME VOLTAGE GATED POTASSIUM CHANNELS | Genes involved in Voltage gated Potassium channels |
| 0.3 | 2.7 | REACTOME REGULATION OF RHEB GTPASE ACTIVITY BY AMPK | Genes involved in Regulation of Rheb GTPase activity by AMPK |
| 0.3 | 3.9 | REACTOME SEROTONIN RECEPTORS | Genes involved in Serotonin receptors |
| 0.3 | 9.8 | REACTOME MYOGENESIS | Genes involved in Myogenesis |
| 0.3 | 3.7 | REACTOME BILE SALT AND ORGANIC ANION SLC TRANSPORTERS | Genes involved in Bile salt and organic anion SLC transporters |
| 0.3 | 3.4 | REACTOME ACTIVATION OF THE AP1 FAMILY OF TRANSCRIPTION FACTORS | Genes involved in Activation of the AP-1 family of transcription factors |
| 0.3 | 9.5 | REACTOME CLASS B 2 SECRETIN FAMILY RECEPTORS | Genes involved in Class B/2 (Secretin family receptors) |
| 0.2 | 2.7 | REACTOME UNWINDING OF DNA | Genes involved in Unwinding of DNA |
| 0.2 | 2.4 | REACTOME E2F ENABLED INHIBITION OF PRE REPLICATION COMPLEX FORMATION | Genes involved in E2F-enabled inhibition of pre-replication complex formation |
| 0.2 | 1.0 | REACTOME FORMATION OF THE HIV1 EARLY ELONGATION COMPLEX | Genes involved in Formation of the HIV-1 Early Elongation Complex |
| 0.2 | 18.0 | REACTOME L1CAM INTERACTIONS | Genes involved in L1CAM interactions |
| 0.2 | 5.0 | REACTOME TRAFFICKING OF AMPA RECEPTORS | Genes involved in Trafficking of AMPA receptors |
| 0.2 | 2.8 | REACTOME HYALURONAN METABOLISM | Genes involved in Hyaluronan metabolism |
| 0.2 | 3.2 | REACTOME METABOLISM OF POLYAMINES | Genes involved in Metabolism of polyamines |
| 0.1 | 1.0 | REACTOME REGULATION OF THE FANCONI ANEMIA PATHWAY | Genes involved in Regulation of the Fanconi anemia pathway |
| 0.1 | 10.8 | REACTOME PEPTIDE LIGAND BINDING RECEPTORS | Genes involved in Peptide ligand-binding receptors |
| 0.1 | 1.4 | REACTOME SYNTHESIS OF PIPS AT THE LATE ENDOSOME MEMBRANE | Genes involved in Synthesis of PIPs at the late endosome membrane |
| 0.1 | 1.2 | REACTOME SIGNALING BY WNT | Genes involved in Signaling by Wnt |
| 0.1 | 2.7 | REACTOME RNA POL I TRANSCRIPTION TERMINATION | Genes involved in RNA Polymerase I Transcription Termination |
| 0.1 | 3.1 | REACTOME FORMATION OF FIBRIN CLOT CLOTTING CASCADE | Genes involved in Formation of Fibrin Clot (Clotting Cascade) |
| 0.1 | 2.8 | REACTOME CASPASE MEDIATED CLEAVAGE OF CYTOSKELETAL PROTEINS | Genes involved in Caspase-mediated cleavage of cytoskeletal proteins |
| 0.1 | 2.0 | REACTOME SHC1 EVENTS IN ERBB4 SIGNALING | Genes involved in SHC1 events in ERBB4 signaling |
| 0.1 | 1.4 | REACTOME MRNA DECAY BY 5 TO 3 EXORIBONUCLEASE | Genes involved in mRNA Decay by 5' to 3' Exoribonuclease |
| 0.1 | 3.9 | REACTOME GOLGI ASSOCIATED VESICLE BIOGENESIS | Genes involved in Golgi Associated Vesicle Biogenesis |
| 0.1 | 1.8 | REACTOME PROCESSING OF INTRONLESS PRE MRNAS | Genes involved in Processing of Intronless Pre-mRNAs |
| 0.1 | 12.4 | REACTOME TRANSMISSION ACROSS CHEMICAL SYNAPSES | Genes involved in Transmission across Chemical Synapses |
| 0.1 | 2.4 | REACTOME NCAM1 INTERACTIONS | Genes involved in NCAM1 interactions |
| 0.1 | 1.1 | REACTOME HS GAG DEGRADATION | Genes involved in HS-GAG degradation |
| 0.1 | 3.1 | REACTOME DEPOSITION OF NEW CENPA CONTAINING NUCLEOSOMES AT THE CENTROMERE | Genes involved in Deposition of New CENPA-containing Nucleosomes at the Centromere |
| 0.1 | 8.1 | REACTOME SIGNALING BY RHO GTPASES | Genes involved in Signaling by Rho GTPases |
| 0.1 | 8.2 | REACTOME G ALPHA I SIGNALLING EVENTS | Genes involved in G alpha (i) signalling events |
| 0.0 | 0.9 | REACTOME POST CHAPERONIN TUBULIN FOLDING PATHWAY | Genes involved in Post-chaperonin tubulin folding pathway |
| 0.0 | 0.9 | REACTOME RNA POL II TRANSCRIPTION PRE INITIATION AND PROMOTER OPENING | Genes involved in RNA Polymerase II Transcription Pre-Initiation And Promoter Opening |
| 0.0 | 1.6 | REACTOME IL1 SIGNALING | Genes involved in Interleukin-1 signaling |
| 0.0 | 0.8 | REACTOME SIGNALING BY HIPPO | Genes involved in Signaling by Hippo |
| 0.0 | 0.4 | REACTOME REGULATION OF KIT SIGNALING | Genes involved in Regulation of KIT signaling |
| 0.0 | 0.6 | REACTOME REGULATION OF INSULIN LIKE GROWTH FACTOR IGF ACTIVITY BY INSULIN LIKE GROWTH FACTOR BINDING PROTEINS IGFBPS | Genes involved in Regulation of Insulin-like Growth Factor (IGF) Activity by Insulin-like Growth Factor Binding Proteins (IGFBPs) |
| 0.0 | 1.7 | REACTOME LOSS OF NLP FROM MITOTIC CENTROSOMES | Genes involved in Loss of Nlp from mitotic centrosomes |
| 0.0 | 0.8 | REACTOME SIGNALING BY ROBO RECEPTOR | Genes involved in Signaling by Robo receptor |
| 0.0 | 1.9 | REACTOME G ALPHA S SIGNALLING EVENTS | Genes involved in G alpha (s) signalling events |
| 0.0 | 0.5 | REACTOME SYNTHESIS OF PIPS AT THE PLASMA MEMBRANE | Genes involved in Synthesis of PIPs at the plasma membrane |
| 0.0 | 0.3 | REACTOME SYNTHESIS OF SUBSTRATES IN N GLYCAN BIOSYTHESIS | Genes involved in Synthesis of substrates in N-glycan biosythesis |
| 0.0 | 0.4 | REACTOME BASIGIN INTERACTIONS | Genes involved in Basigin interactions |
| 0.0 | 0.4 | REACTOME ZINC TRANSPORTERS | Genes involved in Zinc transporters |
| 0.0 | 1.0 | REACTOME NOTCH1 INTRACELLULAR DOMAIN REGULATES TRANSCRIPTION | Genes involved in NOTCH1 Intracellular Domain Regulates Transcription |
| 0.0 | 0.3 | REACTOME SEMA4D INDUCED CELL MIGRATION AND GROWTH CONE COLLAPSE | Genes involved in Sema4D induced cell migration and growth-cone collapse |
| 0.0 | 0.2 | REACTOME SYNTHESIS SECRETION AND DEACYLATION OF GHRELIN | Genes involved in Synthesis, Secretion, and Deacylation of Ghrelin |
| 0.0 | 0.2 | REACTOME ANTIGEN PRESENTATION FOLDING ASSEMBLY AND PEPTIDE LOADING OF CLASS I MHC | Genes involved in Antigen Presentation: Folding, assembly and peptide loading of class I MHC |