Project
GSE53960: rat RNA-Seq transcriptomic Bodymap
Navigation
Downloads
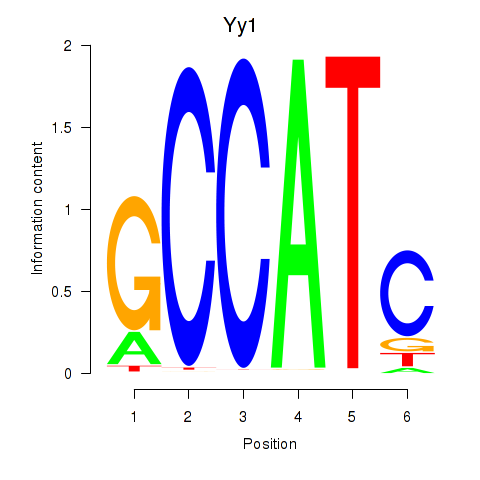
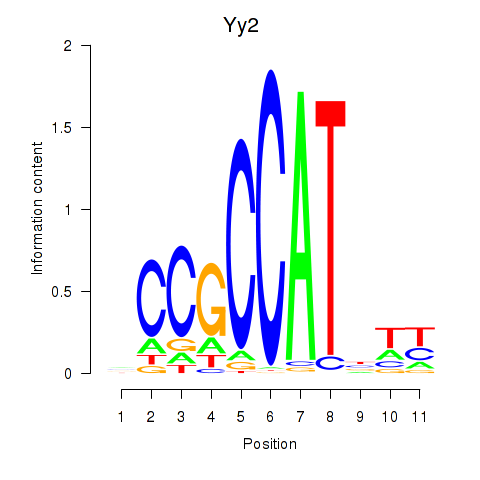
Results for Yy1_Yy2
Z-value: 2.49
Motif logo
Transcription factors associated with Yy1_Yy2
| Gene Symbol | Gene ID | Gene Info |
|---|---|---|
|
Yy1
|
ENSRNOG00000004339 | YY1 transcription factor |
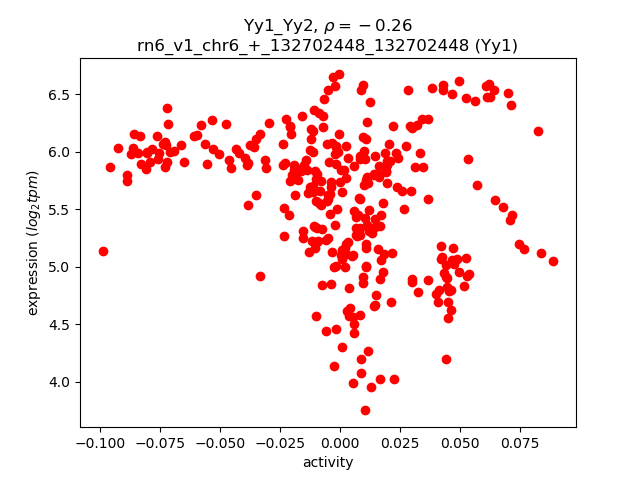
Activity-expression correlation:
| Gene | Promoter | Pearson corr. coef. | P-value | Plot |
|---|---|---|---|---|
| Yy1 | rn6_v1_chr6_+_132702448_132702448 | -0.26 | 3.6e-06 | Click! |
Activity profile of Yy1_Yy2 motif
Sorted Z-values of Yy1_Yy2 motif
| Promoter | Log-likelihood | Transcript | Gene | Gene Info |
|---|---|---|---|---|
| chr10_+_13836128 | 27.23 |
ENSRNOT00000012720
|
Pgp
|
phosphoglycolate phosphatase |
| chr1_-_169321075 | 23.58 |
ENSRNOT00000055216
|
RGD1562433
|
similar to ubiquilin 1 isoform 2 |
| chr1_+_89408935 | 22.86 |
ENSRNOT00000075068
|
LOC100909893
|
protein FAM187B-like |
| chr1_-_88066101 | 22.72 |
ENSRNOT00000079473
ENSRNOT00000027893 |
Ryr1
|
ryanodine receptor 1 |
| chr10_+_53781239 | 22.15 |
ENSRNOT00000082871
|
Myh2
|
myosin heavy chain 2 |
| chr10_-_13168217 | 19.90 |
ENSRNOT00000087768
|
Elob
|
elongin B |
| chr16_+_90613870 | 18.52 |
ENSRNOT00000079334
|
Shcbp1
|
SHC binding and spindle associated 1 |
| chr4_+_153774486 | 18.02 |
ENSRNOT00000074096
|
Tuba8
|
tubulin, alpha 8 |
| chr8_+_116708027 | 17.73 |
ENSRNOT00000047309
|
Actl11
|
actin-like 11 |
| chr9_+_24095751 | 17.45 |
ENSRNOT00000018177
|
Pgk2
|
phosphoglycerate kinase 2 |
| chr18_+_51785111 | 17.26 |
ENSRNOT00000019351
|
Lmnb1
|
lamin B1 |
| chr3_+_168345152 | 17.24 |
ENSRNOT00000017654
|
Dok5
|
docking protein 5 |
| chr18_+_32964763 | 17.13 |
ENSRNOT00000019467
|
Pabpc2
|
poly(A) binding protein, cytoplasmic 2 |
| chr7_-_116781766 | 17.05 |
ENSRNOT00000010084
|
Mafa
|
MAF bZIP transcription factor A |
| chr10_+_91217079 | 16.96 |
ENSRNOT00000004218
|
Hexim2
|
hexamethylene bis-acetamide inducible 2 |
| chr4_-_181486090 | 16.75 |
ENSRNOT00000075453
|
AABR07062535.1
|
|
| chr9_+_20213588 | 16.71 |
ENSRNOT00000089341
|
LOC100911515
|
triosephosphate isomerase-like |
| chr10_+_70242874 | 16.40 |
ENSRNOT00000010924
|
Fndc8
|
fibronectin type III domain containing 8 |
| chr1_+_102414625 | 16.30 |
ENSRNOT00000089488
|
Kcnc1
|
potassium voltage-gated channel subfamily C member 1 |
| chr14_-_86047162 | 16.22 |
ENSRNOT00000018227
|
Pgam2
|
phosphoglycerate mutase 2 |
| chr13_-_73704480 | 16.16 |
ENSRNOT00000005296
|
Tor1aip1
|
torsin 1A interacting protein 1 |
| chr10_+_92245442 | 16.02 |
ENSRNOT00000006808
|
Sppl2c
|
signal peptide peptidase like 2C |
| chr7_-_20118466 | 15.84 |
ENSRNOT00000080523
|
RGD1565071
|
similar to hypothetical protein 4930509O22 |
| chr10_+_34185898 | 15.82 |
ENSRNOT00000003339
|
Trim7
|
tripartite motif-containing 7 |
| chr9_+_12633990 | 15.53 |
ENSRNOT00000066517
ENSRNOT00000077532 |
Dazl
|
deleted in azoospermia-like |
| chr3_+_8450275 | 15.25 |
ENSRNOT00000020073
|
Odf2
|
outer dense fiber of sperm tails 2 |
| chr1_-_101198801 | 15.25 |
ENSRNOT00000037998
|
Ccdc155
|
coiled-coil domain containing 155 |
| chr10_+_97647111 | 15.12 |
ENSRNOT00000055062
|
Gna13
|
G protein subunit alpha 13 |
| chr3_+_138174054 | 14.94 |
ENSRNOT00000007946
|
Banf2
|
barrier to autointegration factor 2 |
| chr11_+_64488194 | 14.73 |
ENSRNOT00000030268
|
RGD1306995
|
similar to hypothetical protein FLJ32859 |
| chr1_+_211205903 | 14.66 |
ENSRNOT00000023139
|
Ppp2r2d
|
protein phosphatase 2, regulatory subunit B, delta |
| chr3_+_143129248 | 14.61 |
ENSRNOT00000006667
|
Cst8
|
cystatin 8 |
| chrX_+_130007087 | 14.57 |
ENSRNOT00000074996
|
Tex13c
|
TEX13 family member C |
| chr3_+_138974871 | 14.49 |
ENSRNOT00000012524
|
Scp2d1
|
SCP2 sterol-binding domain containing 1 |
| chr3_-_151548995 | 14.48 |
ENSRNOT00000071825
|
LOC102550306
|
uncharacterized LOC102550306 |
| chr3_+_112242270 | 14.41 |
ENSRNOT00000080533
ENSRNOT00000082876 |
Capn3
|
calpain 3 |
| chr17_-_8619737 | 14.33 |
ENSRNOT00000065217
|
RGD1562024
|
RGD1562024 |
| chrX_-_43781586 | 14.29 |
ENSRNOT00000051551
|
Cldn34b
|
claudin 34B |
| chr13_-_73704678 | 14.15 |
ENSRNOT00000005280
|
Tor1aip1
|
torsin 1A interacting protein 1 |
| chr6_+_30074303 | 13.97 |
ENSRNOT00000070908
|
Fam228a
|
family with sequence similarity 228, member A |
| chr18_-_786674 | 13.97 |
ENSRNOT00000021955
|
Cetn1
|
centrin 1 |
| chr8_+_117620317 | 13.92 |
ENSRNOT00000084220
|
Celsr3
|
cadherin, EGF LAG seven-pass G-type receptor 3 |
| chr2_+_29598344 | 13.91 |
ENSRNOT00000088580
ENSRNOT00000023286 |
Mrps27
|
mitochondrial ribosomal protein S27 |
| chr3_+_171743929 | 13.80 |
ENSRNOT00000079113
ENSRNOT00000064400 |
Rab22a
|
RAB22A, member RAS oncogene family |
| chr8_-_127871192 | 13.72 |
ENSRNOT00000055928
|
Slc22a14
|
solute carrier family 22, member 14 |
| chr10_-_16689321 | 13.63 |
ENSRNOT00000028173
|
Bnip1
|
BCL2/adenovirus E1B interacting protein 1 |
| chr12_-_50213400 | 13.55 |
ENSRNOT00000048541
|
LOC102552378
|
trichohyalin-like |
| chr7_+_11769400 | 13.46 |
ENSRNOT00000044417
|
Jsrp1
|
junctional sarcoplasmic reticulum protein 1 |
| chr7_-_59514939 | 13.42 |
ENSRNOT00000085579
|
Kcnmb4
|
potassium calcium-activated channel subfamily M regulatory beta subunit 4 |
| chr12_-_18274515 | 13.33 |
ENSRNOT00000078075
|
LOC100361826
|
sialophorin-like |
| chr5_+_154976165 | 13.28 |
ENSRNOT00000029077
|
LOC102552669
|
uncharacterized LOC102552669 |
| chr15_+_28319136 | 13.28 |
ENSRNOT00000048723
|
Tppp2
|
tubulin polymerization-promoting protein family member 2 |
| chr7_-_139872900 | 13.22 |
ENSRNOT00000046402
|
H1fnt
|
H1 histone family, member N, testis-specific |
| chr13_-_109490772 | 13.20 |
ENSRNOT00000085932
|
AABR07022134.1
|
|
| chr9_-_10182676 | 13.20 |
ENSRNOT00000074894
|
LOC316124
|
similar to gonadotropin-regulated long chain acyl-CoA synthetase |
| chr12_+_24473981 | 13.12 |
ENSRNOT00000001973
|
Fzd9
|
frizzled class receptor 9 |
| chr16_-_54533871 | 13.07 |
ENSRNOT00000015144
|
LOC100910977
|
disintegrin and metalloproteinase domain-containing protein 25-like |
| chr2_-_22147115 | 12.99 |
ENSRNOT00000017408
|
Spz1
|
spermatogenic leucine zipper 1 |
| chr20_+_8109635 | 12.97 |
ENSRNOT00000000609
|
Armc12
|
armadillo repeat containing 12 |
| chr4_-_101393329 | 12.96 |
ENSRNOT00000007636
|
RGD1562515
|
similar to RIKEN cDNA 4931417E11 |
| chr2_-_29598277 | 12.93 |
ENSRNOT00000034992
|
Ptcd2
|
pentatricopeptide repeat domain 2 |
| chr7_-_113228439 | 12.78 |
ENSRNOT00000034672
|
Col22a1
|
collagen type XXII alpha 1 chain |
| chr10_-_53037816 | 12.77 |
ENSRNOT00000057509
|
Shisa6
|
shisa family member 6 |
| chr10_+_4951557 | 12.70 |
ENSRNOT00000003451
|
Prm3
|
protamine 3 |
| chr20_+_30791422 | 12.64 |
ENSRNOT00000047394
ENSRNOT00000000683 |
Tbata
|
thymus, brain and testes associated |
| chr4_+_56556507 | 12.58 |
ENSRNOT00000060353
|
Fam71f2
|
family with sequence similarity 71, member F2 |
| chr4_-_169093135 | 12.49 |
ENSRNOT00000011461
|
Pbp2
|
phosphatidylethanolamine binding protein 2 |
| chr19_+_57614628 | 12.49 |
ENSRNOT00000026617
|
Gnpat
|
glyceronephosphate O-acyltransferase |
| chr4_+_172709724 | 12.45 |
ENSRNOT00000010707
|
Igbp1b
|
immunoglobulin (CD79A) binding protein 1b |
| chr1_+_162890475 | 12.42 |
ENSRNOT00000034886
|
Gdpd4
|
glycerophosphodiester phosphodiesterase domain containing 4 |
| chr2_+_34312766 | 12.42 |
ENSRNOT00000060962
|
Cenpk
|
centromere protein K |
| chr7_+_38945836 | 12.35 |
ENSRNOT00000006455
|
Ccer1
|
coiled-coil glutamate-rich protein 1 |
| chr8_+_110982777 | 12.32 |
ENSRNOT00000010992
|
Ky
|
kyphoscoliosis peptidase |
| chr2_+_216863428 | 12.30 |
ENSRNOT00000068413
|
Col11a1
|
collagen type XI alpha 1 chain |
| chr1_-_197858016 | 12.22 |
ENSRNOT00000074778
|
Atp2a1
|
ATPase sarcoplasmic/endoplasmic reticulum Ca2+ transporting 1 |
| chr4_-_157331905 | 12.18 |
ENSRNOT00000020647
|
Tpi1
|
triosephosphate isomerase 1 |
| chr1_+_140477868 | 12.14 |
ENSRNOT00000025008
|
Mrps11
|
mitochondrial ribosomal protein S11 |
| chr9_+_19917603 | 12.11 |
ENSRNOT00000038239
|
Tdrd6
|
tudor domain containing 6 |
| chr7_+_140032132 | 12.11 |
ENSRNOT00000014316
|
Olr1107
|
olfactory receptor 1107 |
| chrX_+_43745604 | 12.11 |
ENSRNOT00000040825
|
LOC100362173
|
rCG36365-like |
| chr20_-_8183552 | 12.07 |
ENSRNOT00000074908
|
AABR07044495.1
|
|
| chr17_+_78822313 | 12.07 |
ENSRNOT00000090779
|
Meig1
|
meiosis/spermiogenesis associated 1 |
| chr4_-_170740274 | 11.93 |
ENSRNOT00000012212
|
Gucy2c
|
guanylate cyclase 2C |
| chr18_-_6587080 | 11.84 |
ENSRNOT00000040815
|
LOC103694404
|
60S ribosomal protein L39 |
| chr10_-_87898252 | 11.76 |
ENSRNOT00000071345
|
Krtap16-1
|
keratin associated protein 16-1 |
| chr7_-_49741540 | 11.67 |
ENSRNOT00000006523
|
Myf6
|
myogenic factor 6 |
| chr1_+_199360645 | 11.65 |
ENSRNOT00000026527
|
Kat8
|
lysine acetyltransferase 8 |
| chr1_+_272799784 | 11.58 |
ENSRNOT00000016052
|
Ins1
|
insulin 1 |
| chr10_+_59173268 | 11.58 |
ENSRNOT00000013486
|
Ube2g1
|
ubiquitin-conjugating enzyme E2G 1 |
| chr1_-_1767618 | 11.48 |
ENSRNOT00000019623
|
Pcmt1
|
protein-L-isoaspartate (D-aspartate) O-methyltransferase 1 |
| chr3_+_3834268 | 11.41 |
ENSRNOT00000031622
|
Pmpca
|
peptidase, mitochondrial processing alpha subunit |
| chr9_+_20213776 | 11.40 |
ENSRNOT00000071439
|
LOC100911515
|
triosephosphate isomerase-like |
| chr7_-_12326392 | 11.37 |
ENSRNOT00000039728
|
Ndufs7
|
NADH dehydrogenase (ubiquinone) Fe-S protein 7 |
| chrX_+_78769419 | 11.35 |
ENSRNOT00000003190
|
Tbx22
|
T-box 22 |
| chrX_+_159505344 | 11.34 |
ENSRNOT00000001164
|
Brs3
|
bombesin receptor subtype 3 |
| chr10_+_65780494 | 11.33 |
ENSRNOT00000013100
|
Poldip2
|
DNA polymerase delta interacting protein 2 |
| chr14_+_39368530 | 11.31 |
ENSRNOT00000084367
|
Cox7b2
|
cytochrome c oxidase subunit 7B2 |
| chr14_+_34389991 | 11.30 |
ENSRNOT00000002953
|
Pdcl2
|
phosducin-like 2 |
| chrX_-_72515057 | 11.22 |
ENSRNOT00000076850
ENSRNOT00000041138 |
Phka1
|
phosphorylase kinase, alpha 1 |
| chr13_+_83681322 | 11.22 |
ENSRNOT00000004206
|
Mpc2
|
mitochondrial pyruvate carrier 2 |
| chr10_-_95934345 | 11.19 |
ENSRNOT00000004349
|
Cacng1
|
calcium voltage-gated channel auxiliary subunit gamma 1 |
| chr10_-_89338739 | 11.13 |
ENSRNOT00000073923
|
Ptges3l
|
prostaglandin E synthase 3 like |
| chr3_-_72219246 | 11.06 |
ENSRNOT00000009903
|
Smtnl1
|
smoothelin-like 1 |
| chr2_-_139528162 | 11.04 |
ENSRNOT00000014317
|
Slc7a11
|
solute carrier family 7 member 11 |
| chr16_+_71889235 | 11.03 |
ENSRNOT00000038266
|
Adam32
|
ADAM metallopeptidase domain 32 |
| chr7_-_11878237 | 11.03 |
ENSRNOT00000049766
|
Izumo4
|
IZUMO family member 4 |
| chr16_-_81309954 | 11.00 |
ENSRNOT00000092361
|
LOC290876
|
similar to RIKEN cDNA 1700029H14 |
| chr6_+_76349362 | 10.98 |
ENSRNOT00000043224
|
Aldoart2
|
aldolase 1 A retrogene 2 |
| chr3_+_112531703 | 10.97 |
ENSRNOT00000041727
|
LOC100911204
|
protein CASC5-like |
| chr19_+_26184545 | 10.82 |
ENSRNOT00000005656
|
Dhps
|
deoxyhypusine synthase |
| chr15_-_24056073 | 10.82 |
ENSRNOT00000015100
|
Wdhd1
|
WD repeat and HMG-box DNA binding protein 1 |
| chr20_+_17750744 | 10.82 |
ENSRNOT00000000745
|
RGD1559903
|
similar to RIKEN cDNA 1700049L16 |
| chr20_-_45259928 | 10.81 |
ENSRNOT00000087226
|
Slc16a10
|
solute carrier family 16 member 10 |
| chr19_+_880024 | 10.80 |
ENSRNOT00000061648
|
Cmtm2a
|
CKLF-like MARVEL transmembrane domain containing 2A |
| chr16_-_82288022 | 10.74 |
ENSRNOT00000078609
|
Spaca7
|
sperm acrosome associated 7 |
| chr10_-_103972668 | 10.72 |
ENSRNOT00000004836
|
Atp5h
|
ATP synthase, H+ transporting, mitochondrial Fo complex, subunit d |
| chr15_-_27815261 | 10.69 |
ENSRNOT00000032992
|
Klhl33
|
kelch-like family member 33 |
| chr7_+_13013541 | 10.67 |
ENSRNOT00000042792
ENSRNOT00000010549 |
Theg
|
theg spermatid protein |
| chr1_-_143647124 | 10.67 |
ENSRNOT00000026595
|
Btbd1
|
BTB domain containing 1 |
| chr10_+_82775691 | 10.65 |
ENSRNOT00000030737
|
Hils1
|
histone linker H1 domain, spermatid-specific 1 |
| chr4_+_70977556 | 10.63 |
ENSRNOT00000031984
|
LOC680112
|
hypothetical protein LOC680112 |
| chr10_+_53922198 | 10.60 |
ENSRNOT00000079764
|
AABR07029836.1
|
|
| chr5_-_146069670 | 10.54 |
ENSRNOT00000072793
|
LOC682102
|
hypothetical protein LOC682102 |
| chr1_-_143398093 | 10.53 |
ENSRNOT00000078916
|
Fsd2
|
fibronectin type III and SPRY domain containing 2 |
| chr3_+_8450612 | 10.52 |
ENSRNOT00000040457
|
Odf2
|
outer dense fiber of sperm tails 2 |
| chrY_+_914045 | 10.51 |
ENSRNOT00000088593
|
Eif2s3y
|
eukaryotic translation initiation factor 2, subunit 3, structural gene Y-linked |
| chr7_+_66595742 | 10.49 |
ENSRNOT00000031191
|
Usp15
|
ubiquitin specific peptidase 15 |
| chr10_-_58834538 | 10.46 |
ENSRNOT00000020043
|
Slc13a5
|
solute carrier family 13 member 5 |
| chr4_-_71713063 | 10.44 |
ENSRNOT00000059447
|
Fam131b
|
family with sequence similarity 131, member B |
| chr1_-_189238776 | 10.43 |
ENSRNOT00000020817
|
Pdilt
|
protein disulfide isomerase-like, testis expressed |
| chr20_-_10844178 | 10.40 |
ENSRNOT00000079207
|
Hsf2bp
|
heat shock transcription factor 2 binding protein |
| chr10_+_103703404 | 10.39 |
ENSRNOT00000086469
|
Rab37
|
RAB37, member RAS oncogene family |
| chr11_-_24294179 | 10.37 |
ENSRNOT00000002116
|
Atp5j
|
ATP synthase, H+ transporting, mitochondrial Fo complex, subunit F6 |
| chr10_-_55560422 | 10.33 |
ENSRNOT00000006883
|
Rangrf
|
RAN guanine nucleotide release factor |
| chr6_-_41842817 | 10.32 |
ENSRNOT00000084155
|
Lpin1
|
lipin 1 |
| chr11_+_88131960 | 10.29 |
ENSRNOT00000046664
|
RGD1308065
|
hypothetical LOC287935 |
| chr3_+_65672058 | 10.27 |
ENSRNOT00000057901
|
RGD1564319
|
similar to TF-1 apoptosis related protein 19 |
| chr1_-_88734223 | 10.25 |
ENSRNOT00000065011
|
NEWGENE_1306714
|
WD repeat domain 62-like 1 |
| chr5_-_73494030 | 10.25 |
ENSRNOT00000022291
|
Actl7b
|
actin-like 7b |
| chr1_+_80195532 | 10.25 |
ENSRNOT00000022528
|
Rtn2
|
reticulon 2 |
| chr4_-_159399634 | 10.23 |
ENSRNOT00000089193
|
Ndufa9
|
NADH:ubiquinone oxidoreductase subunit A9 |
| chr7_+_77066955 | 10.19 |
ENSRNOT00000008700
|
Odf1
|
outer dense fiber of sperm tails 1 |
| chrX_-_49530166 | 10.18 |
ENSRNOT00000072026
|
Srsf8
|
serine and arginine rich splicing factor 8 |
| chr1_-_22570303 | 10.17 |
ENSRNOT00000035539
|
Taar3
|
trace amine-associated receptor 3 |
| chr12_-_31323810 | 10.16 |
ENSRNOT00000001247
|
Ran
|
RAN, member RAS oncogene family |
| chr3_+_3272193 | 10.15 |
ENSRNOT00000044284
|
Lcn9
|
lipocalin 9 |
| chr17_-_43815183 | 10.15 |
ENSRNOT00000073188
|
Hist1h2ail1
|
histone cluster 1, H2ai-like1 |
| chr20_-_11721838 | 10.12 |
ENSRNOT00000001636
|
Ube2g2
|
ubiquitin-conjugating enzyme E2G 2 |
| chr12_-_18303041 | 10.11 |
ENSRNOT00000032844
|
LOC288521
|
similar to Leukosialin precursor (Leucocyte sialoglycoprotein) (Sialophorin) (CD43) (W3/13 antigen) |
| chr3_+_3834078 | 10.11 |
ENSRNOT00000031607
|
Pmpca
|
peptidase, mitochondrial processing alpha subunit |
| chr9_+_16529579 | 10.10 |
ENSRNOT00000067894
|
Ptcra
|
pre T-cell antigen receptor alpha |
| chr2_-_127778202 | 10.08 |
ENSRNOT00000092191
ENSRNOT00000093683 |
LOC365778
|
similar to RIKEN cDNA 1700034I23 |
| chr16_-_21274688 | 10.07 |
ENSRNOT00000027953
|
Tssk6
|
testis-specific serine kinase 6 |
| chr3_+_22640545 | 10.07 |
ENSRNOT00000064507
ENSRNOT00000014452 |
Lhx2
|
LIM homeobox 2 |
| chr1_-_169214634 | 10.05 |
ENSRNOT00000022733
|
Olr141
|
olfactory receptor 141 |
| chrX_+_43293551 | 10.05 |
ENSRNOT00000084562
|
LOC680190
|
hypothetical protein LOC680190 |
| chr10_-_87920581 | 10.03 |
ENSRNOT00000071896
|
Krtap16-1
|
keratin associated protein 16-1 |
| chr4_-_6046477 | 10.01 |
ENSRNOT00000073925
|
Cct8l1
|
chaperonin containing TCP1, subunit 8 (theta)-like 1 |
| chr3_+_57770948 | 9.97 |
ENSRNOT00000038429
|
AC107446.2
|
|
| chr1_-_81534140 | 9.97 |
ENSRNOT00000027202
|
Tex101
|
testis expressed 101 |
| chr14_+_17615968 | 9.97 |
ENSRNOT00000003470
|
Rchy1
|
ring finger and CHY zinc finger domain containing 1 |
| chr4_-_169036950 | 9.96 |
ENSRNOT00000011295
|
Gsg1
|
germ cell associated 1 |
| chr5_-_155772040 | 9.92 |
ENSRNOT00000036788
|
Cela3b
|
chymotrypsin-like elastase family, member 3B |
| chr1_+_100939740 | 9.90 |
ENSRNOT00000049584
|
Tsks
|
testis-specific serine kinase substrate |
| chr1_-_261051498 | 9.89 |
ENSRNOT00000071417
|
Arhgap19
|
Rho GTPase activating protein 19 |
| chr16_+_74752655 | 9.85 |
ENSRNOT00000029266
|
Ckap2
|
cytoskeleton associated protein 2 |
| chr6_-_86822094 | 9.80 |
ENSRNOT00000006531
|
Fkbp3
|
FK506 binding protein 3 |
| chr10_-_103848035 | 9.79 |
ENSRNOT00000029001
|
Fads6
|
fatty acid desaturase 6 |
| chr9_+_14529218 | 9.76 |
ENSRNOT00000016893
|
Apobec2
|
apolipoprotein B mRNA editing enzyme catalytic subunit 2 |
| chr7_-_122963299 | 9.68 |
ENSRNOT00000090208
|
Rangap1
|
RAN GTPase activating protein 1 |
| chr5_-_136053210 | 9.68 |
ENSRNOT00000025903
|
Kif2c
|
kinesin family member 2C |
| chr8_+_28454962 | 9.66 |
ENSRNOT00000051573
|
Spata19
|
spermatogenesis associated 19 |
| chr10_+_14094754 | 9.66 |
ENSRNOT00000019660
|
Rpl3l
|
ribosomal protein L3-like |
| chr8_-_63150753 | 9.58 |
ENSRNOT00000078666
|
Tbc1d21
|
TBC1 domain family, member 21 |
| chrX_+_70256737 | 9.55 |
ENSRNOT00000029298
|
Otud6a
|
OTU deubiquitinase 6A |
| chr7_-_119896925 | 9.53 |
ENSRNOT00000010609
|
Elfn2
|
extracellular leucine-rich repeat and fibronectin type III domain containing 2 |
| chr3_-_111422203 | 9.51 |
ENSRNOT00000084290
|
Oip5
|
Opa interacting protein 5 |
| chr1_+_82452469 | 9.50 |
ENSRNOT00000028026
|
Exosc5
|
exosome component 5 |
| chr11_-_1437732 | 9.48 |
ENSRNOT00000037345
|
Csnka2ip
|
casein kinase 2, alpha prime interacting protein |
| chr1_+_215610368 | 9.47 |
ENSRNOT00000078903
ENSRNOT00000087781 |
Tnni2
|
troponin I2, fast skeletal type |
| chr2_-_246737997 | 9.46 |
ENSRNOT00000021719
|
Pdha2
|
pyruvate dehydrogenase (lipoamide) alpha 2 |
| chr1_+_100501676 | 9.46 |
ENSRNOT00000043724
|
Fam71e1
|
family with sequence similarity 71, member E1 |
| chr19_+_37330930 | 9.43 |
ENSRNOT00000022439
|
Plekhg4
|
pleckstrin homology and RhoGEF domain containing G4 |
| chr12_-_47095438 | 9.42 |
ENSRNOT00000001546
|
Coq5
|
coenzyme Q5, methyltransferase |
| chrX_+_78769810 | 9.39 |
ENSRNOT00000083907
|
Tbx22
|
T-box 22 |
| chr7_-_11406771 | 9.38 |
ENSRNOT00000047450
|
Eef2
|
eukaryotic translation elongation factor 2 |
| chr9_+_81821346 | 9.36 |
ENSRNOT00000022234
|
Plcd4
|
phospholipase C, delta 4 |
| chr3_-_15278645 | 9.34 |
ENSRNOT00000032204
|
Ttll11
|
tubulin tyrosine ligase like11 |
| chr13_-_82006005 | 9.33 |
ENSRNOT00000039581
|
Mettl11b
|
methyltransferase like 11B |
| chr14_+_108826831 | 9.33 |
ENSRNOT00000083146
ENSRNOT00000009421 |
Bcl11a
|
B-cell CLL/lymphoma 11A |
| chr14_-_86560694 | 9.30 |
ENSRNOT00000075827
|
Npc1l1
|
NPC1 like intracellular cholesterol transporter 1 |
| chr10_-_45480999 | 9.30 |
ENSRNOT00000078353
ENSRNOT00000084697 ENSRNOT00000087926 |
Obscn
|
obscurin, cytoskeletal calmodulin and titin-interacting RhoGEF |
| chr10_+_43601689 | 9.26 |
ENSRNOT00000029238
|
Mrpl22
|
mitochondrial ribosomal protein L22 |
| chr2_-_112831476 | 9.22 |
ENSRNOT00000018055
|
Ect2
|
epithelial cell transforming 2 |
| chr1_-_104202591 | 9.20 |
ENSRNOT00000035512
|
E2f8
|
E2F transcription factor 8 |
| chr4_-_120157477 | 9.15 |
ENSRNOT00000046568
|
AABR07061382.1
|
|
| chr3_+_143151739 | 9.15 |
ENSRNOT00000006850
|
Cst13
|
cystatin 13 |
| chr1_+_182842583 | 9.15 |
ENSRNOT00000072650
|
Ssty1
|
spermiogenesis specific transcript on the Y 1 |
| chr10_-_15960673 | 9.14 |
ENSRNOT00000036447
|
RGD1311343
|
similar to RIKEN cDNA 4930524B15 |
| chr1_+_101474334 | 9.14 |
ENSRNOT00000064245
|
Tulp2
|
tubby-like protein 2 |
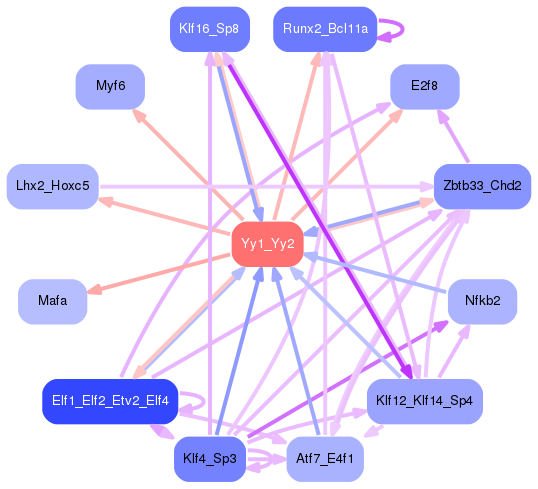
Network of associatons between targets according to the STRING database.

First level regulatory network of Yy1_Yy2
Gene Ontology Analysis
Gene overrepresentation in biological process category:
| Log-likelihood per target | Total log-likelihood | Term | Description |
|---|---|---|---|
| 9.8 | 29.5 | GO:1990091 | sodium-dependent self proteolysis(GO:1990091) |
| 7.7 | 30.6 | GO:0006114 | glycerol biosynthetic process(GO:0006114) |
| 6.9 | 20.6 | GO:0031446 | regulation of fast-twitch skeletal muscle fiber contraction(GO:0031446) positive regulation of fast-twitch skeletal muscle fiber contraction(GO:0031448) |
| 6.1 | 18.3 | GO:0006480 | N-terminal protein amino acid methylation(GO:0006480) |
| 5.3 | 5.3 | GO:0014724 | regulation of twitch skeletal muscle contraction(GO:0014724) |
| 5.2 | 15.7 | GO:0044208 | 'de novo' AMP biosynthetic process(GO:0044208) |
| 5.1 | 15.3 | GO:0090172 | microtubule cytoskeleton organization involved in homologous chromosome segregation(GO:0090172) |
| 4.6 | 13.8 | GO:0003065 | positive regulation of heart rate by epinephrine(GO:0003065) |
| 4.5 | 22.6 | GO:0051365 | cellular response to potassium ion starvation(GO:0051365) |
| 4.4 | 13.2 | GO:0043605 | cellular amide catabolic process(GO:0043605) |
| 4.1 | 12.4 | GO:1990167 | protein K27-linked deubiquitination(GO:1990167) |
| 4.0 | 12.0 | GO:0035606 | peptidyl-cysteine S-trans-nitrosylation(GO:0035606) |
| 4.0 | 15.9 | GO:0046351 | disaccharide biosynthetic process(GO:0046351) |
| 4.0 | 8.0 | GO:0006532 | aspartate biosynthetic process(GO:0006532) |
| 4.0 | 15.9 | GO:1904009 | cellular response to monosodium glutamate(GO:1904009) |
| 3.9 | 3.9 | GO:0070368 | positive regulation of hepatocyte differentiation(GO:0070368) |
| 3.9 | 62.3 | GO:0031034 | myosin filament assembly(GO:0031034) |
| 3.7 | 3.7 | GO:1902162 | regulation of DNA damage response, signal transduction by p53 class mediator resulting in transcription of p21 class mediator(GO:1902162) |
| 3.7 | 11.0 | GO:0061732 | mitochondrial acetyl-CoA biosynthetic process from pyruvate(GO:0061732) |
| 3.6 | 32.3 | GO:0035092 | sperm chromatin condensation(GO:0035092) |
| 3.6 | 3.6 | GO:2001055 | positive regulation of mesenchymal cell apoptotic process(GO:2001055) |
| 3.5 | 35.5 | GO:0086028 | bundle of His cell to Purkinje myocyte signaling(GO:0086028) bundle of His cell action potential(GO:0086043) |
| 3.5 | 10.6 | GO:0031989 | bombesin receptor signaling pathway(GO:0031989) |
| 3.3 | 16.7 | GO:0009972 | cytidine catabolic process(GO:0006216) cytidine deamination(GO:0009972) cytidine metabolic process(GO:0046087) |
| 3.3 | 9.9 | GO:0007079 | mitotic chromosome movement towards spindle pole(GO:0007079) |
| 3.2 | 22.7 | GO:0071763 | nuclear membrane organization(GO:0071763) |
| 3.2 | 12.9 | GO:0035616 | histone H2B conserved C-terminal lysine deubiquitination(GO:0035616) |
| 3.1 | 9.3 | GO:1903860 | negative regulation of dendrite extension(GO:1903860) |
| 3.1 | 12.4 | GO:0042776 | mitochondrial ATP synthesis coupled proton transport(GO:0042776) |
| 3.1 | 21.6 | GO:0006627 | protein processing involved in protein targeting to mitochondrion(GO:0006627) |
| 3.1 | 24.6 | GO:0034551 | respiratory chain complex III assembly(GO:0017062) mitochondrial respiratory chain complex III assembly(GO:0034551) |
| 3.0 | 21.2 | GO:0000056 | ribosomal small subunit export from nucleus(GO:0000056) |
| 3.0 | 8.9 | GO:1905077 | regulation of interleukin-17 secretion(GO:1905076) negative regulation of interleukin-17 secretion(GO:1905077) |
| 3.0 | 8.9 | GO:0006433 | prolyl-tRNA aminoacylation(GO:0006433) |
| 2.9 | 17.6 | GO:1904117 | cellular response to vasopressin(GO:1904117) |
| 2.8 | 11.2 | GO:0030576 | Cajal body organization(GO:0030576) |
| 2.8 | 13.9 | GO:0036515 | serotonergic neuron axon guidance(GO:0036515) |
| 2.8 | 2.8 | GO:0042414 | epinephrine metabolic process(GO:0042414) |
| 2.7 | 11.0 | GO:0097681 | double-strand break repair via alternative nonhomologous end joining(GO:0097681) |
| 2.7 | 19.2 | GO:0048743 | positive regulation of skeletal muscle fiber development(GO:0048743) |
| 2.7 | 27.4 | GO:0051315 | attachment of mitotic spindle microtubules to kinetochore(GO:0051315) |
| 2.7 | 10.9 | GO:0071283 | cellular response to iron(III) ion(GO:0071283) |
| 2.7 | 10.9 | GO:1990523 | bone regeneration(GO:1990523) |
| 2.7 | 16.3 | GO:0021759 | globus pallidus development(GO:0021759) |
| 2.7 | 2.7 | GO:0000965 | mitochondrial RNA 3'-end processing(GO:0000965) |
| 2.7 | 42.7 | GO:1901663 | ubiquinone biosynthetic process(GO:0006744) quinone biosynthetic process(GO:1901663) |
| 2.7 | 8.0 | GO:0071469 | cellular response to alkaline pH(GO:0071469) |
| 2.6 | 7.9 | GO:0060821 | inactivation of X chromosome by DNA methylation(GO:0060821) |
| 2.6 | 10.6 | GO:2000224 | regulation of testosterone biosynthetic process(GO:2000224) |
| 2.6 | 7.9 | GO:0007308 | oocyte construction(GO:0007308) oocyte axis specification(GO:0007309) oocyte anterior/posterior axis specification(GO:0007314) pole plasm assembly(GO:0007315) maternal determination of anterior/posterior axis, embryo(GO:0008358) P granule organization(GO:0030719) |
| 2.6 | 5.2 | GO:0050968 | detection of chemical stimulus involved in sensory perception of pain(GO:0050968) |
| 2.6 | 10.4 | GO:0070827 | chromatin maintenance(GO:0070827) |
| 2.6 | 7.8 | GO:0033861 | negative regulation of NAD(P)H oxidase activity(GO:0033861) |
| 2.6 | 7.8 | GO:0018343 | protein farnesylation(GO:0018343) |
| 2.5 | 35.6 | GO:0045836 | positive regulation of meiotic nuclear division(GO:0045836) |
| 2.5 | 7.6 | GO:0009106 | lipoate metabolic process(GO:0009106) |
| 2.5 | 5.0 | GO:0061184 | positive regulation of dermatome development(GO:0061184) |
| 2.5 | 7.5 | GO:0045041 | protein import into mitochondrial intermembrane space(GO:0045041) |
| 2.5 | 10.0 | GO:0044211 | CTP salvage(GO:0044211) |
| 2.4 | 7.3 | GO:2001034 | positive regulation of double-strand break repair via nonhomologous end joining(GO:2001034) |
| 2.4 | 12.2 | GO:0019563 | glycerol catabolic process(GO:0019563) |
| 2.4 | 12.1 | GO:0032100 | positive regulation of response to food(GO:0032097) positive regulation of appetite(GO:0032100) |
| 2.4 | 7.1 | GO:0032916 | positive regulation of transforming growth factor beta3 production(GO:0032916) |
| 2.4 | 4.7 | GO:0046167 | glycerol-3-phosphate biosynthetic process(GO:0046167) |
| 2.4 | 63.9 | GO:0006335 | DNA replication-dependent nucleosome assembly(GO:0006335) DNA replication-dependent nucleosome organization(GO:0034723) |
| 2.4 | 4.7 | GO:0000448 | cleavage in ITS2 between 5.8S rRNA and LSU-rRNA of tricistronic rRNA transcript (SSU-rRNA, 5.8S rRNA, LSU-rRNA)(GO:0000448) |
| 2.3 | 7.0 | GO:0051037 | regulation of transcription involved in meiotic cell cycle(GO:0051037) |
| 2.3 | 7.0 | GO:0015966 | diadenosine polyphosphate biosynthetic process(GO:0015960) diadenosine tetraphosphate metabolic process(GO:0015965) diadenosine tetraphosphate biosynthetic process(GO:0015966) |
| 2.3 | 2.3 | GO:0097033 | mitochondrial respiratory chain complex III biogenesis(GO:0097033) |
| 2.3 | 11.5 | GO:0031536 | positive regulation of exit from mitosis(GO:0031536) |
| 2.3 | 22.9 | GO:0006086 | acetyl-CoA biosynthetic process from pyruvate(GO:0006086) |
| 2.3 | 11.5 | GO:0000960 | mitochondrial RNA catabolic process(GO:0000957) regulation of mitochondrial RNA catabolic process(GO:0000960) |
| 2.3 | 4.6 | GO:0007290 | spermatid nucleus elongation(GO:0007290) |
| 2.2 | 15.7 | GO:0097428 | protein maturation by iron-sulfur cluster transfer(GO:0097428) |
| 2.2 | 17.9 | GO:0070934 | CRD-mediated mRNA stabilization(GO:0070934) |
| 2.2 | 6.7 | GO:1904569 | regulation of selenocysteine incorporation(GO:1904569) |
| 2.2 | 6.6 | GO:0002465 | peripheral T cell tolerance induction(GO:0002458) peripheral tolerance induction(GO:0002465) |
| 2.2 | 13.1 | GO:0006287 | base-excision repair, gap-filling(GO:0006287) |
| 2.2 | 4.3 | GO:1904057 | negative regulation of sensory perception of pain(GO:1904057) |
| 2.1 | 8.6 | GO:2000195 | negative regulation of female gonad development(GO:2000195) |
| 2.1 | 10.7 | GO:0045039 | protein import into mitochondrial inner membrane(GO:0045039) |
| 2.1 | 21.3 | GO:0000338 | protein deneddylation(GO:0000338) |
| 2.1 | 6.4 | GO:0009397 | folic acid-containing compound catabolic process(GO:0009397) pteridine-containing compound catabolic process(GO:0042560) |
| 2.1 | 6.4 | GO:0048880 | sensory system development(GO:0048880) |
| 2.1 | 8.5 | GO:0006104 | succinyl-CoA metabolic process(GO:0006104) |
| 2.1 | 40.3 | GO:0035404 | histone-serine phosphorylation(GO:0035404) |
| 2.1 | 8.5 | GO:0046544 | development of secondary male sexual characteristics(GO:0046544) |
| 2.1 | 6.3 | GO:0060082 | eye blink reflex(GO:0060082) |
| 2.1 | 2.1 | GO:1901837 | negative regulation of transcription of nuclear large rRNA transcript from RNA polymerase I promoter(GO:1901837) |
| 2.1 | 8.2 | GO:0034421 | post-translational protein acetylation(GO:0034421) |
| 2.1 | 4.1 | GO:0031444 | slow-twitch skeletal muscle fiber contraction(GO:0031444) |
| 2.1 | 2.1 | GO:1903094 | regulation of protein K48-linked deubiquitination(GO:1903093) negative regulation of protein K48-linked deubiquitination(GO:1903094) negative regulation of ubiquitin-specific protease activity(GO:2000157) |
| 2.0 | 6.1 | GO:0098971 | anterograde dendritic transport of neurotransmitter receptor complex(GO:0098971) |
| 2.0 | 10.2 | GO:1903333 | negative regulation of protein folding(GO:1903333) |
| 2.0 | 6.1 | GO:0006788 | heme oxidation(GO:0006788) |
| 2.0 | 6.0 | GO:0043179 | rhythmic excitation(GO:0043179) |
| 2.0 | 13.9 | GO:0051694 | pointed-end actin filament capping(GO:0051694) |
| 2.0 | 49.3 | GO:0015986 | energy coupled proton transport, down electrochemical gradient(GO:0015985) ATP synthesis coupled proton transport(GO:0015986) |
| 2.0 | 13.7 | GO:0071313 | cellular response to caffeine(GO:0071313) |
| 1.9 | 1.9 | GO:0040023 | establishment of nucleus localization(GO:0040023) |
| 1.9 | 5.8 | GO:0010034 | response to acetate(GO:0010034) |
| 1.9 | 11.5 | GO:0097500 | receptor localization to nonmotile primary cilium(GO:0097500) |
| 1.9 | 5.7 | GO:0090381 | regulation of heart induction by regulation of canonical Wnt signaling pathway(GO:0090081) regulation of heart induction(GO:0090381) regulation of heart induction by canonical Wnt signaling pathway(GO:0100012) |
| 1.9 | 7.6 | GO:0015746 | citrate transport(GO:0015746) |
| 1.9 | 34.3 | GO:0001731 | formation of translation preinitiation complex(GO:0001731) |
| 1.9 | 17.1 | GO:2000344 | positive regulation of acrosome reaction(GO:2000344) |
| 1.9 | 5.7 | GO:1900740 | regulation of protein insertion into mitochondrial membrane involved in apoptotic signaling pathway(GO:1900739) positive regulation of protein insertion into mitochondrial membrane involved in apoptotic signaling pathway(GO:1900740) protein localization to vacuolar membrane(GO:1903778) |
| 1.9 | 15.0 | GO:0044828 | negative regulation by host of viral genome replication(GO:0044828) |
| 1.9 | 5.6 | GO:0019918 | peptidyl-arginine methylation, to symmetrical-dimethyl arginine(GO:0019918) |
| 1.9 | 7.5 | GO:0034080 | CENP-A containing nucleosome assembly(GO:0034080) CENP-A containing chromatin organization(GO:0061641) |
| 1.9 | 35.3 | GO:0010257 | NADH dehydrogenase complex assembly(GO:0010257) mitochondrial respiratory chain complex I assembly(GO:0032981) mitochondrial respiratory chain complex I biogenesis(GO:0097031) |
| 1.8 | 7.4 | GO:0071879 | positive regulation of adrenergic receptor signaling pathway(GO:0071879) |
| 1.8 | 5.5 | GO:0071169 | establishment of protein localization to chromatin(GO:0071169) |
| 1.8 | 20.0 | GO:0051988 | regulation of attachment of spindle microtubules to kinetochore(GO:0051988) |
| 1.8 | 9.0 | GO:0044314 | protein K27-linked ubiquitination(GO:0044314) |
| 1.8 | 7.2 | GO:0002930 | trabecular meshwork development(GO:0002930) |
| 1.8 | 9.0 | GO:0071692 | protein localization to extracellular region(GO:0071692) maintenance of protein location in extracellular region(GO:0071694) |
| 1.8 | 19.7 | GO:0007195 | adenylate cyclase-inhibiting dopamine receptor signaling pathway(GO:0007195) |
| 1.8 | 7.1 | GO:0090666 | scaRNA localization to Cajal body(GO:0090666) |
| 1.8 | 8.9 | GO:0045006 | DNA deamination(GO:0045006) |
| 1.8 | 16.0 | GO:0061621 | NADH regeneration(GO:0006735) canonical glycolysis(GO:0061621) glucose catabolic process to pyruvate(GO:0061718) |
| 1.8 | 5.3 | GO:1903070 | negative regulation of ER-associated ubiquitin-dependent protein catabolic process(GO:1903070) |
| 1.7 | 8.7 | GO:0075525 | viral translational termination-reinitiation(GO:0075525) |
| 1.7 | 15.5 | GO:0035989 | tendon development(GO:0035989) |
| 1.7 | 10.3 | GO:0060023 | soft palate development(GO:0060023) |
| 1.7 | 5.1 | GO:0006121 | mitochondrial electron transport, succinate to ubiquinone(GO:0006121) |
| 1.7 | 6.8 | GO:0061743 | motor learning(GO:0061743) |
| 1.7 | 13.7 | GO:0006122 | mitochondrial electron transport, ubiquinol to cytochrome c(GO:0006122) |
| 1.7 | 10.2 | GO:0032466 | negative regulation of cytokinesis(GO:0032466) |
| 1.7 | 13.6 | GO:0007343 | egg activation(GO:0007343) |
| 1.7 | 6.8 | GO:2000836 | positive regulation of androgen secretion(GO:2000836) |
| 1.7 | 11.9 | GO:0035610 | protein side chain deglutamylation(GO:0035610) |
| 1.7 | 6.8 | GO:0001992 | regulation of systemic arterial blood pressure by vasopressin(GO:0001992) |
| 1.7 | 5.1 | GO:0034982 | mitochondrial protein processing(GO:0034982) |
| 1.7 | 5.1 | GO:0010529 | regulation of transposition(GO:0010528) negative regulation of transposition(GO:0010529) |
| 1.7 | 5.1 | GO:0070084 | protein initiator methionine removal(GO:0070084) |
| 1.7 | 5.0 | GO:0007210 | serotonin receptor signaling pathway(GO:0007210) |
| 1.7 | 6.7 | GO:0042376 | phylloquinone metabolic process(GO:0042374) phylloquinone catabolic process(GO:0042376) quinone catabolic process(GO:1901662) |
| 1.7 | 5.0 | GO:0070681 | glutaminyl-tRNAGln biosynthesis via transamidation(GO:0070681) |
| 1.7 | 11.7 | GO:0051661 | maintenance of centrosome location(GO:0051661) |
| 1.7 | 6.7 | GO:1902031 | regulation of NADP metabolic process(GO:1902031) |
| 1.7 | 16.7 | GO:0033753 | ribosomal subunit export from nucleus(GO:0000054) ribosome localization(GO:0033750) establishment of ribosome localization(GO:0033753) |
| 1.7 | 6.6 | GO:0019661 | fermentation(GO:0006113) glucose catabolic process to lactate(GO:0019659) glycolytic fermentation(GO:0019660) glucose catabolic process to lactate via pyruvate(GO:0019661) |
| 1.6 | 8.2 | GO:0051970 | negative regulation of transmission of nerve impulse(GO:0051970) |
| 1.6 | 13.2 | GO:0007021 | tubulin complex assembly(GO:0007021) |
| 1.6 | 8.2 | GO:0010032 | meiotic chromosome condensation(GO:0010032) |
| 1.6 | 11.4 | GO:0038028 | insulin receptor signaling pathway via phosphatidylinositol 3-kinase(GO:0038028) |
| 1.6 | 34.0 | GO:0006098 | pentose-phosphate shunt(GO:0006098) glyceraldehyde-3-phosphate metabolic process(GO:0019682) |
| 1.6 | 16.2 | GO:0051156 | glucose 6-phosphate metabolic process(GO:0051156) |
| 1.6 | 1.6 | GO:1900127 | positive regulation of hyaluronan biosynthetic process(GO:1900127) |
| 1.6 | 12.6 | GO:0090286 | cytoskeletal anchoring at nuclear membrane(GO:0090286) |
| 1.6 | 2013.2 | GO:0050911 | detection of chemical stimulus involved in sensory perception of smell(GO:0050911) |
| 1.6 | 3.1 | GO:0001915 | negative regulation of T cell mediated cytotoxicity(GO:0001915) |
| 1.6 | 3.1 | GO:0070858 | negative regulation of bile acid biosynthetic process(GO:0070858) negative regulation of bile acid metabolic process(GO:1904252) |
| 1.6 | 3.1 | GO:1901143 | insulin catabolic process(GO:1901143) |
| 1.6 | 3.1 | GO:1902626 | assembly of large subunit precursor of preribosome(GO:1902626) |
| 1.5 | 6.2 | GO:1904616 | regulation of actin filament binding(GO:1904529) regulation of actin binding(GO:1904616) |
| 1.5 | 6.1 | GO:0002669 | positive regulation of T cell anergy(GO:0002669) positive regulation of lymphocyte anergy(GO:0002913) |
| 1.5 | 3.1 | GO:1900453 | negative regulation of long term synaptic depression(GO:1900453) |
| 1.5 | 4.6 | GO:1902309 | negative regulation of peptidyl-serine dephosphorylation(GO:1902309) |
| 1.5 | 7.6 | GO:2000767 | positive regulation of cytoplasmic translation(GO:2000767) |
| 1.5 | 10.7 | GO:0043951 | negative regulation of cAMP-mediated signaling(GO:0043951) |
| 1.5 | 4.5 | GO:1990108 | protein linear deubiquitination(GO:1990108) |
| 1.5 | 15.1 | GO:0060297 | regulation of sarcomere organization(GO:0060297) |
| 1.5 | 6.0 | GO:0002023 | reduction of food intake in response to dietary excess(GO:0002023) |
| 1.5 | 4.5 | GO:0002148 | hypochlorous acid metabolic process(GO:0002148) hypochlorous acid biosynthetic process(GO:0002149) |
| 1.5 | 3.0 | GO:2000143 | negative regulation of transcription initiation from RNA polymerase II promoter(GO:0060633) negative regulation of DNA-templated transcription, initiation(GO:2000143) |
| 1.5 | 1.5 | GO:0051133 | regulation of NK T cell activation(GO:0051133) positive regulation of NK T cell activation(GO:0051135) |
| 1.5 | 4.5 | GO:0035986 | senescence-associated heterochromatin focus assembly(GO:0035986) |
| 1.5 | 3.0 | GO:0071459 | protein localization to chromosome, centromeric region(GO:0071459) |
| 1.5 | 4.4 | GO:1900042 | positive regulation of interleukin-2 secretion(GO:1900042) |
| 1.5 | 16.2 | GO:0051013 | microtubule severing(GO:0051013) |
| 1.5 | 5.9 | GO:0006616 | SRP-dependent cotranslational protein targeting to membrane, translocation(GO:0006616) |
| 1.5 | 3.0 | GO:0002876 | regulation of chronic inflammatory response to antigenic stimulus(GO:0002874) positive regulation of chronic inflammatory response to antigenic stimulus(GO:0002876) |
| 1.5 | 7.4 | GO:0036233 | glycine import(GO:0036233) |
| 1.5 | 5.9 | GO:0033685 | negative regulation of luteinizing hormone secretion(GO:0033685) |
| 1.5 | 4.4 | GO:0015942 | formate metabolic process(GO:0015942) |
| 1.5 | 11.6 | GO:0044154 | histone H3-K14 acetylation(GO:0044154) |
| 1.4 | 5.8 | GO:0018211 | protein C-linked glycosylation(GO:0018103) peptidyl-tryptophan modification(GO:0018211) protein C-linked glycosylation via tryptophan(GO:0018317) protein C-linked glycosylation via 2'-alpha-mannosyl-L-tryptophan(GO:0018406) |
| 1.4 | 5.8 | GO:0070537 | histone H2A K63-linked deubiquitination(GO:0070537) |
| 1.4 | 2.8 | GO:0045959 | negative regulation of complement activation, classical pathway(GO:0045959) |
| 1.4 | 7.1 | GO:0015855 | pyrimidine nucleobase transport(GO:0015855) |
| 1.4 | 11.3 | GO:0036123 | histone H3-K9 dimethylation(GO:0036123) |
| 1.4 | 2.8 | GO:0014908 | myotube differentiation involved in skeletal muscle regeneration(GO:0014908) |
| 1.4 | 4.2 | GO:0021797 | forebrain anterior/posterior pattern specification(GO:0021797) |
| 1.4 | 5.6 | GO:0006741 | NADP biosynthetic process(GO:0006741) |
| 1.4 | 2.8 | GO:0019230 | proprioception(GO:0019230) |
| 1.4 | 8.3 | GO:0032049 | cardiolipin biosynthetic process(GO:0032049) |
| 1.4 | 4.2 | GO:0072717 | cellular response to actinomycin D(GO:0072717) |
| 1.4 | 4.1 | GO:0061428 | negative regulation of transcription from RNA polymerase II promoter in response to hypoxia(GO:0061428) |
| 1.4 | 4.1 | GO:0051867 | general adaptation syndrome, behavioral process(GO:0051867) |
| 1.4 | 5.5 | GO:1903207 | neuron death in response to hydrogen peroxide(GO:0036476) regulation of hydrogen peroxide-induced neuron death(GO:1903207) negative regulation of hydrogen peroxide-induced neuron death(GO:1903208) |
| 1.4 | 4.1 | GO:0006222 | UMP biosynthetic process(GO:0006222) pyrimidine ribonucleoside monophosphate metabolic process(GO:0009173) pyrimidine ribonucleoside monophosphate biosynthetic process(GO:0009174) UMP metabolic process(GO:0046049) |
| 1.4 | 20.6 | GO:0034587 | piRNA metabolic process(GO:0034587) |
| 1.4 | 5.4 | GO:0051140 | regulation of NK T cell proliferation(GO:0051140) positive regulation of NK T cell proliferation(GO:0051142) |
| 1.4 | 5.4 | GO:1904975 | response to bleomycin(GO:1904975) |
| 1.4 | 4.1 | GO:0000963 | mitochondrial RNA processing(GO:0000963) mitochondrial tRNA modification(GO:0070900) mitochondrial RNA modification(GO:1900864) |
| 1.4 | 13.5 | GO:0042866 | pyruvate biosynthetic process(GO:0042866) |
| 1.3 | 9.4 | GO:0098535 | de novo centriole assembly(GO:0098535) |
| 1.3 | 8.1 | GO:0046005 | positive regulation of circadian sleep/wake cycle, REM sleep(GO:0046005) |
| 1.3 | 4.0 | GO:0019244 | lactate biosynthetic process from pyruvate(GO:0019244) |
| 1.3 | 4.0 | GO:0060988 | lipid tube assembly(GO:0060988) |
| 1.3 | 2.7 | GO:0035722 | interleukin-12-mediated signaling pathway(GO:0035722) cellular response to interleukin-12(GO:0071349) |
| 1.3 | 8.0 | GO:2000741 | positive regulation of mesenchymal stem cell differentiation(GO:2000741) |
| 1.3 | 2.7 | GO:0018171 | peptidyl-cysteine oxidation(GO:0018171) |
| 1.3 | 4.0 | GO:0034418 | urate biosynthetic process(GO:0034418) |
| 1.3 | 3.9 | GO:0031055 | chromatin remodeling at centromere(GO:0031055) pericentric heterochromatin assembly(GO:0031508) |
| 1.3 | 3.9 | GO:0010725 | regulation of primitive erythrocyte differentiation(GO:0010725) transcriptional activation by promoter-enhancer looping(GO:0071733) gene looping(GO:0090202) dsDNA loop formation(GO:0090579) |
| 1.3 | 3.9 | GO:0007468 | regulation of rhodopsin gene expression(GO:0007468) |
| 1.3 | 1.3 | GO:0014904 | myotube cell development(GO:0014904) |
| 1.3 | 2.6 | GO:1904207 | regulation of chemokine (C-C motif) ligand 2 secretion(GO:1904207) positive regulation of chemokine (C-C motif) ligand 2 secretion(GO:1904209) |
| 1.3 | 59.6 | GO:0032543 | mitochondrial translation(GO:0032543) |
| 1.3 | 9.0 | GO:0006642 | triglyceride mobilization(GO:0006642) |
| 1.3 | 5.1 | GO:0007008 | outer mitochondrial membrane organization(GO:0007008) protein import into mitochondrial outer membrane(GO:0045040) |
| 1.3 | 2.6 | GO:0035928 | rRNA import into mitochondrion(GO:0035928) |
| 1.3 | 5.1 | GO:0090116 | C-5 methylation of cytosine(GO:0090116) |
| 1.3 | 7.7 | GO:0033387 | putrescine biosynthetic process from ornithine(GO:0033387) |
| 1.3 | 2.5 | GO:0035523 | protein K29-linked deubiquitination(GO:0035523) |
| 1.3 | 7.6 | GO:0035247 | peptidyl-arginine omega-N-methylation(GO:0035247) |
| 1.3 | 16.5 | GO:2000291 | regulation of myoblast proliferation(GO:2000291) |
| 1.3 | 7.6 | GO:0050917 | sensory perception of umami taste(GO:0050917) |
| 1.3 | 13.9 | GO:0090084 | negative regulation of inclusion body assembly(GO:0090084) |
| 1.3 | 12.6 | GO:0006657 | CDP-choline pathway(GO:0006657) |
| 1.3 | 37.6 | GO:0035036 | sperm-egg recognition(GO:0035036) |
| 1.3 | 3.8 | GO:0086024 | adrenergic receptor signaling pathway involved in positive regulation of heart rate(GO:0086024) |
| 1.2 | 5.0 | GO:1901079 | positive regulation of relaxation of muscle(GO:1901079) |
| 1.2 | 4.9 | GO:0009441 | glycolate metabolic process(GO:0009441) |
| 1.2 | 4.9 | GO:0050975 | sensory perception of touch(GO:0050975) |
| 1.2 | 7.4 | GO:0070535 | histone H2A K63-linked ubiquitination(GO:0070535) |
| 1.2 | 1.2 | GO:0035927 | RNA import into mitochondrion(GO:0035927) |
| 1.2 | 2.5 | GO:0098902 | regulation of membrane depolarization during action potential(GO:0098902) |
| 1.2 | 6.1 | GO:0061086 | negative regulation of histone H3-K27 methylation(GO:0061086) |
| 1.2 | 3.7 | GO:0098972 | dendritic transport of mitochondrion(GO:0098939) anterograde dendritic transport of mitochondrion(GO:0098972) |
| 1.2 | 6.1 | GO:0010694 | positive regulation of alkaline phosphatase activity(GO:0010694) |
| 1.2 | 4.9 | GO:0032485 | regulation of Ral protein signal transduction(GO:0032485) |
| 1.2 | 15.8 | GO:0031167 | rRNA methylation(GO:0031167) |
| 1.2 | 20.6 | GO:0045116 | protein neddylation(GO:0045116) |
| 1.2 | 3.6 | GO:1903576 | response to L-arginine(GO:1903576) |
| 1.2 | 8.5 | GO:0008616 | queuosine biosynthetic process(GO:0008616) queuosine metabolic process(GO:0046116) |
| 1.2 | 6.0 | GO:0071314 | cellular response to cocaine(GO:0071314) |
| 1.2 | 2.4 | GO:0033123 | positive regulation of purine nucleotide catabolic process(GO:0033123) |
| 1.2 | 4.8 | GO:0044339 | canonical Wnt signaling pathway involved in osteoblast differentiation(GO:0044339) |
| 1.2 | 3.6 | GO:2000620 | positive regulation of histone H4-K16 acetylation(GO:2000620) |
| 1.2 | 1.2 | GO:0033590 | response to cobalamin(GO:0033590) |
| 1.2 | 5.9 | GO:0008635 | activation of cysteine-type endopeptidase activity involved in apoptotic process by cytochrome c(GO:0008635) |
| 1.2 | 11.9 | GO:0007342 | fusion of sperm to egg plasma membrane(GO:0007342) |
| 1.2 | 2.4 | GO:0046133 | pyrimidine ribonucleoside catabolic process(GO:0046133) |
| 1.2 | 3.5 | GO:0006651 | diacylglycerol biosynthetic process(GO:0006651) |
| 1.2 | 3.5 | GO:0031632 | positive regulation of synaptic vesicle fusion to presynaptic membrane(GO:0031632) |
| 1.2 | 4.7 | GO:1903608 | protein localization to cytoplasmic stress granule(GO:1903608) |
| 1.2 | 2.3 | GO:0000715 | nucleotide-excision repair, DNA damage recognition(GO:0000715) |
| 1.2 | 31.3 | GO:0030261 | chromosome condensation(GO:0030261) |
| 1.2 | 3.5 | GO:2000211 | regulation of glutamate metabolic process(GO:2000211) |
| 1.2 | 3.5 | GO:0071630 | nucleus-associated proteasomal ubiquitin-dependent protein catabolic process(GO:0071630) |
| 1.2 | 2.3 | GO:0070671 | response to interleukin-12(GO:0070671) |
| 1.2 | 44.9 | GO:0003009 | skeletal muscle contraction(GO:0003009) |
| 1.1 | 6.9 | GO:1902237 | positive regulation of endoplasmic reticulum stress-induced intrinsic apoptotic signaling pathway(GO:1902237) |
| 1.1 | 4.6 | GO:0019477 | lysine catabolic process(GO:0006554) L-lysine catabolic process to acetyl-CoA(GO:0019474) L-lysine catabolic process(GO:0019477) L-lysine metabolic process(GO:0046440) |
| 1.1 | 6.8 | GO:0097211 | response to gonadotropin-releasing hormone(GO:0097210) cellular response to gonadotropin-releasing hormone(GO:0097211) |
| 1.1 | 6.8 | GO:0006501 | C-terminal protein lipidation(GO:0006501) |
| 1.1 | 4.5 | GO:0010825 | positive regulation of centrosome duplication(GO:0010825) |
| 1.1 | 9.1 | GO:0014063 | negative regulation of serotonin secretion(GO:0014063) |
| 1.1 | 5.7 | GO:0009137 | purine nucleoside diphosphate catabolic process(GO:0009137) purine ribonucleoside diphosphate catabolic process(GO:0009181) |
| 1.1 | 28.3 | GO:0070584 | mitochondrion morphogenesis(GO:0070584) |
| 1.1 | 14.7 | GO:1904667 | negative regulation of ubiquitin protein ligase activity(GO:1904667) |
| 1.1 | 9.0 | GO:0055059 | asymmetric neuroblast division(GO:0055059) |
| 1.1 | 3.3 | GO:1902962 | regulation of aspartic-type endopeptidase activity involved in amyloid precursor protein catabolic process(GO:1902959) positive regulation of aspartic-type endopeptidase activity involved in amyloid precursor protein catabolic process(GO:1902961) regulation of metalloendopeptidase activity involved in amyloid precursor protein catabolic process(GO:1902962) negative regulation of metalloendopeptidase activity involved in amyloid precursor protein catabolic process(GO:1902963) regulation of aspartic-type peptidase activity(GO:1905245) positive regulation of aspartic-type peptidase activity(GO:1905247) |
| 1.1 | 10.0 | GO:2000042 | negative regulation of double-strand break repair via homologous recombination(GO:2000042) |
| 1.1 | 3.3 | GO:0048749 | compound eye development(GO:0048749) |
| 1.1 | 1.1 | GO:0097694 | establishment of RNA localization to telomere(GO:0097694) telomerase catalytic core complex assembly(GO:1904868) regulation of telomerase catalytic core complex assembly(GO:1904882) positive regulation of telomerase catalytic core complex assembly(GO:1904884) |
| 1.1 | 7.8 | GO:0060662 | tube lumen cavitation(GO:0060605) salivary gland cavitation(GO:0060662) |
| 1.1 | 2.2 | GO:0051204 | protein insertion into mitochondrial membrane(GO:0051204) |
| 1.1 | 4.4 | GO:0021571 | rhombomere 5 development(GO:0021571) |
| 1.1 | 3.3 | GO:1902037 | negative regulation of hematopoietic stem cell differentiation(GO:1902037) |
| 1.1 | 2.2 | GO:0034969 | histone arginine methylation(GO:0034969) |
| 1.1 | 3.3 | GO:0043504 | mitochondrial DNA repair(GO:0043504) |
| 1.1 | 8.7 | GO:0035520 | monoubiquitinated protein deubiquitination(GO:0035520) |
| 1.1 | 5.4 | GO:0072513 | positive regulation of secondary heart field cardioblast proliferation(GO:0072513) |
| 1.1 | 4.3 | GO:1903862 | positive regulation of oxidative phosphorylation(GO:1903862) |
| 1.1 | 3.2 | GO:1901367 | response to L-cysteine(GO:1901367) |
| 1.1 | 1.1 | GO:0090063 | positive regulation of microtubule nucleation(GO:0090063) |
| 1.1 | 2.2 | GO:0002143 | tRNA wobble position uridine thiolation(GO:0002143) |
| 1.1 | 5.4 | GO:0008582 | regulation of synaptic growth at neuromuscular junction(GO:0008582) |
| 1.1 | 9.7 | GO:0034501 | protein localization to kinetochore(GO:0034501) |
| 1.1 | 3.2 | GO:0002314 | germinal center B cell differentiation(GO:0002314) |
| 1.1 | 11.8 | GO:0070327 | thyroid hormone transport(GO:0070327) |
| 1.1 | 1.1 | GO:0060399 | positive regulation of growth hormone receptor signaling pathway(GO:0060399) |
| 1.1 | 4.3 | GO:0070966 | nuclear-transcribed mRNA catabolic process, no-go decay(GO:0070966) |
| 1.1 | 5.3 | GO:0070094 | positive regulation of glucagon secretion(GO:0070094) |
| 1.1 | 12.7 | GO:0030150 | protein import into mitochondrial matrix(GO:0030150) |
| 1.1 | 6.4 | GO:1990785 | response to water-immersion restraint stress(GO:1990785) |
| 1.1 | 7.4 | GO:0006598 | polyamine catabolic process(GO:0006598) |
| 1.1 | 7.4 | GO:0040031 | snRNA modification(GO:0040031) |
| 1.1 | 13.7 | GO:0045948 | positive regulation of translational initiation(GO:0045948) |
| 1.1 | 29.4 | GO:0000028 | ribosomal small subunit assembly(GO:0000028) |
| 1.0 | 5.2 | GO:0000711 | meiotic DNA repair synthesis(GO:0000711) |
| 1.0 | 21.8 | GO:0007130 | synaptonemal complex assembly(GO:0007130) |
| 1.0 | 10.4 | GO:1904293 | negative regulation of ERAD pathway(GO:1904293) |
| 1.0 | 7.3 | GO:0045048 | protein insertion into ER membrane(GO:0045048) |
| 1.0 | 2.1 | GO:2001268 | negative regulation of cysteine-type endopeptidase activity involved in apoptotic signaling pathway(GO:2001268) |
| 1.0 | 10.3 | GO:0035095 | behavioral response to nicotine(GO:0035095) |
| 1.0 | 10.3 | GO:0018298 | protein-chromophore linkage(GO:0018298) |
| 1.0 | 3.1 | GO:0051012 | microtubule sliding(GO:0051012) |
| 1.0 | 4.1 | GO:0071930 | negative regulation of transcription involved in G1/S transition of mitotic cell cycle(GO:0071930) |
| 1.0 | 7.2 | GO:0051026 | chiasma assembly(GO:0051026) |
| 1.0 | 3.1 | GO:1904219 | regulation of CDP-diacylglycerol-serine O-phosphatidyltransferase activity(GO:1904217) positive regulation of CDP-diacylglycerol-serine O-phosphatidyltransferase activity(GO:1904219) positive regulation of serine C-palmitoyltransferase activity(GO:1904222) |
| 1.0 | 6.1 | GO:0042427 | serotonin biosynthetic process(GO:0042427) primary amino compound biosynthetic process(GO:1901162) |
| 1.0 | 1.0 | GO:0044333 | Wnt signaling pathway involved in digestive tract morphogenesis(GO:0044333) |
| 1.0 | 5.1 | GO:0021855 | hypothalamus cell migration(GO:0021855) |
| 1.0 | 6.1 | GO:0060528 | secretory columnal luminar epithelial cell differentiation involved in prostate glandular acinus development(GO:0060528) |
| 1.0 | 2.0 | GO:2000630 | regulation of miRNA metabolic process(GO:2000628) positive regulation of miRNA metabolic process(GO:2000630) |
| 1.0 | 3.0 | GO:0015755 | fructose transport(GO:0015755) |
| 1.0 | 3.0 | GO:0042531 | regulation of tyrosine phosphorylation of STAT protein(GO:0042509) positive regulation of tyrosine phosphorylation of STAT protein(GO:0042531) |
| 1.0 | 2.0 | GO:0010749 | regulation of nitric oxide mediated signal transduction(GO:0010749) |
| 1.0 | 2.0 | GO:2000182 | regulation of progesterone biosynthetic process(GO:2000182) |
| 1.0 | 2.9 | GO:0090625 | mRNA cleavage involved in gene silencing by siRNA(GO:0090625) |
| 1.0 | 2.9 | GO:0035701 | hematopoietic stem cell migration(GO:0035701) |
| 1.0 | 1.0 | GO:0070370 | cellular heat acclimation(GO:0070370) |
| 1.0 | 3.9 | GO:0070318 | positive regulation of G0 to G1 transition(GO:0070318) |
| 1.0 | 4.9 | GO:0071554 | cell wall macromolecule metabolic process(GO:0044036) cell wall organization or biogenesis(GO:0071554) |
| 1.0 | 2.9 | GO:0002541 | activation of plasma proteins involved in acute inflammatory response(GO:0002541) |
| 1.0 | 3.9 | GO:0045578 | negative regulation of B cell differentiation(GO:0045578) |
| 1.0 | 1.9 | GO:1900244 | positive regulation of synaptic vesicle endocytosis(GO:1900244) |
| 1.0 | 3.9 | GO:0061107 | seminal vesicle development(GO:0061107) |
| 1.0 | 2.9 | GO:0007181 | transforming growth factor beta receptor complex assembly(GO:0007181) |
| 1.0 | 12.5 | GO:0008535 | respiratory chain complex IV assembly(GO:0008535) |
| 1.0 | 3.8 | GO:0006297 | nucleotide-excision repair, DNA gap filling(GO:0006297) |
| 0.9 | 4.7 | GO:0098953 | receptor diffusion trapping(GO:0098953) postsynaptic neurotransmitter receptor diffusion trapping(GO:0098970) neurotransmitter receptor diffusion trapping(GO:0099628) |
| 0.9 | 5.7 | GO:0006398 | mRNA 3'-end processing by stem-loop binding and cleavage(GO:0006398) |
| 0.9 | 3.8 | GO:0043144 | snoRNA processing(GO:0043144) |
| 0.9 | 8.4 | GO:0038171 | cannabinoid signaling pathway(GO:0038171) |
| 0.9 | 5.6 | GO:0010625 | positive regulation of Schwann cell proliferation(GO:0010625) |
| 0.9 | 4.6 | GO:1904401 | cellular response to Thyroid stimulating hormone(GO:1904401) |
| 0.9 | 2.8 | GO:0072361 | regulation of glycolytic process by regulation of transcription from RNA polymerase II promoter(GO:0072361) |
| 0.9 | 1.8 | GO:0046136 | positive regulation of vitamin metabolic process(GO:0046136) positive regulation of vitamin D biosynthetic process(GO:0060557) positive regulation of calcidiol 1-monooxygenase activity(GO:0060559) |
| 0.9 | 9.2 | GO:0070837 | dehydroascorbic acid transport(GO:0070837) |
| 0.9 | 9.2 | GO:0031293 | membrane protein intracellular domain proteolysis(GO:0031293) |
| 0.9 | 3.7 | GO:1903659 | regulation of complement-dependent cytotoxicity(GO:1903659) |
| 0.9 | 0.9 | GO:1904586 | response to putrescine(GO:1904585) cellular response to putrescine(GO:1904586) |
| 0.9 | 7.3 | GO:0050957 | equilibrioception(GO:0050957) |
| 0.9 | 2.7 | GO:0010265 | SCF complex assembly(GO:0010265) |
| 0.9 | 2.7 | GO:0007198 | adenylate cyclase-inhibiting serotonin receptor signaling pathway(GO:0007198) |
| 0.9 | 3.6 | GO:0002317 | plasma cell differentiation(GO:0002317) |
| 0.9 | 4.5 | GO:0006102 | isocitrate metabolic process(GO:0006102) |
| 0.9 | 1.8 | GO:0071947 | protein deubiquitination involved in ubiquitin-dependent protein catabolic process(GO:0071947) |
| 0.9 | 7.2 | GO:0034755 | iron ion transmembrane transport(GO:0034755) |
| 0.9 | 2.7 | GO:0072429 | response to intra-S DNA damage checkpoint signaling(GO:0072429) |
| 0.9 | 1.8 | GO:2001032 | regulation of double-strand break repair via nonhomologous end joining(GO:2001032) |
| 0.9 | 2.7 | GO:0033088 | negative regulation of immature T cell proliferation in thymus(GO:0033088) |
| 0.9 | 2.6 | GO:0042726 | flavin-containing compound metabolic process(GO:0042726) |
| 0.9 | 7.9 | GO:0015840 | urea transport(GO:0015840) |
| 0.9 | 3.5 | GO:1902410 | mitotic cytokinetic process(GO:1902410) |
| 0.9 | 2.6 | GO:0060816 | random inactivation of X chromosome(GO:0060816) regulation of dosage compensation by inactivation of X chromosome(GO:1900095) |
| 0.9 | 4.3 | GO:0006362 | transcription elongation from RNA polymerase I promoter(GO:0006362) |
| 0.9 | 4.3 | GO:0015722 | canalicular bile acid transport(GO:0015722) |
| 0.9 | 5.2 | GO:1900619 | acetylcholine metabolic process(GO:0008291) acetate ester metabolic process(GO:1900619) |
| 0.9 | 0.9 | GO:0036466 | synaptic vesicle recycling via endosome(GO:0036466) |
| 0.9 | 5.1 | GO:2000382 | positive regulation of mesoderm development(GO:2000382) |
| 0.9 | 12.0 | GO:0046498 | S-adenosylhomocysteine metabolic process(GO:0046498) |
| 0.9 | 6.0 | GO:0072553 | terminal button organization(GO:0072553) |
| 0.9 | 3.4 | GO:0046725 | negative regulation of macrophage fusion(GO:0034240) negative regulation by virus of viral protein levels in host cell(GO:0046725) |
| 0.8 | 1.7 | GO:1902303 | negative regulation of potassium ion export(GO:1902303) |
| 0.8 | 3.4 | GO:0060331 | negative regulation of response to interferon-gamma(GO:0060331) negative regulation of interferon-gamma-mediated signaling pathway(GO:0060336) |
| 0.8 | 2.5 | GO:0045950 | negative regulation of mitotic recombination(GO:0045950) |
| 0.8 | 3.4 | GO:0048687 | positive regulation of sprouting of injured axon(GO:0048687) positive regulation of axon extension involved in regeneration(GO:0048691) |
| 0.8 | 0.8 | GO:0006549 | isoleucine metabolic process(GO:0006549) |
| 0.8 | 4.2 | GO:0048298 | positive regulation of isotype switching to IgA isotypes(GO:0048298) |
| 0.8 | 15.1 | GO:0006999 | nuclear pore organization(GO:0006999) |
| 0.8 | 2.5 | GO:0060689 | cell differentiation involved in salivary gland development(GO:0060689) |
| 0.8 | 3.4 | GO:0034653 | diterpenoid catabolic process(GO:0016103) retinoic acid catabolic process(GO:0034653) |
| 0.8 | 5.9 | GO:0051151 | negative regulation of smooth muscle cell differentiation(GO:0051151) |
| 0.8 | 5.0 | GO:0017196 | N-terminal peptidyl-methionine acetylation(GO:0017196) |
| 0.8 | 19.2 | GO:0045214 | sarcomere organization(GO:0045214) |
| 0.8 | 0.8 | GO:0021698 | cerebellar cortex structural organization(GO:0021698) |
| 0.8 | 22.5 | GO:0006779 | porphyrin-containing compound biosynthetic process(GO:0006779) |
| 0.8 | 1.7 | GO:0009946 | proximal/distal axis specification(GO:0009946) |
| 0.8 | 5.8 | GO:0046600 | negative regulation of centriole replication(GO:0046600) |
| 0.8 | 2.5 | GO:1900108 | negative regulation of nodal signaling pathway(GO:1900108) |
| 0.8 | 6.6 | GO:0021942 | radial glia guided migration of Purkinje cell(GO:0021942) |
| 0.8 | 3.3 | GO:0021526 | medial motor column neuron differentiation(GO:0021526) |
| 0.8 | 4.9 | GO:0009438 | methylglyoxal metabolic process(GO:0009438) |
| 0.8 | 4.1 | GO:0016259 | selenocysteine metabolic process(GO:0016259) |
| 0.8 | 5.7 | GO:0002118 | aggressive behavior(GO:0002118) |
| 0.8 | 12.3 | GO:0045899 | positive regulation of RNA polymerase II transcriptional preinitiation complex assembly(GO:0045899) |
| 0.8 | 4.1 | GO:0010936 | negative regulation of macrophage cytokine production(GO:0010936) |
| 0.8 | 0.8 | GO:0031630 | regulation of synaptic vesicle fusion to presynaptic membrane(GO:0031630) |
| 0.8 | 2.4 | GO:0070092 | regulation of glucagon secretion(GO:0070092) |
| 0.8 | 10.5 | GO:0045199 | maintenance of epithelial cell apical/basal polarity(GO:0045199) |
| 0.8 | 1.6 | GO:0006478 | peptidyl-tyrosine sulfation(GO:0006478) |
| 0.8 | 4.0 | GO:2000327 | positive regulation of ligand-dependent nuclear receptor transcription coactivator activity(GO:2000327) |
| 0.8 | 3.2 | GO:1901907 | diadenosine polyphosphate catabolic process(GO:0015961) diphosphoinositol polyphosphate metabolic process(GO:0071543) diadenosine pentaphosphate metabolic process(GO:1901906) diadenosine pentaphosphate catabolic process(GO:1901907) diadenosine hexaphosphate metabolic process(GO:1901908) diadenosine hexaphosphate catabolic process(GO:1901909) adenosine 5'-(hexahydrogen pentaphosphate) metabolic process(GO:1901910) adenosine 5'-(hexahydrogen pentaphosphate) catabolic process(GO:1901911) |
| 0.8 | 6.4 | GO:0061082 | myeloid leukocyte cytokine production(GO:0061082) |
| 0.8 | 4.8 | GO:0031584 | activation of phospholipase D activity(GO:0031584) |
| 0.8 | 7.2 | GO:1901387 | positive regulation of voltage-gated calcium channel activity(GO:1901387) |
| 0.8 | 2.4 | GO:0080154 | regulation of fertilization(GO:0080154) |
| 0.8 | 4.0 | GO:0060527 | prostate glandular acinus morphogenesis(GO:0060526) prostate epithelial cord arborization involved in prostate glandular acinus morphogenesis(GO:0060527) |
| 0.8 | 1.6 | GO:0071336 | regulation of hair follicle cell proliferation(GO:0071336) |
| 0.8 | 2.4 | GO:0040020 | regulation of meiotic nuclear division(GO:0040020) |
| 0.8 | 3.2 | GO:1902775 | mitochondrial ribosome assembly(GO:0061668) mitochondrial large ribosomal subunit assembly(GO:1902775) |
| 0.8 | 3.2 | GO:1904749 | regulation of protein localization to nucleolus(GO:1904749) |
| 0.8 | 2.4 | GO:1901726 | negative regulation of histone deacetylase activity(GO:1901726) |
| 0.8 | 11.0 | GO:0010804 | negative regulation of tumor necrosis factor-mediated signaling pathway(GO:0010804) |
| 0.8 | 2.4 | GO:0097198 | histone H3-K36 trimethylation(GO:0097198) |
| 0.8 | 6.3 | GO:0051967 | negative regulation of synaptic transmission, glutamatergic(GO:0051967) |
| 0.8 | 1.6 | GO:1902299 | pre-replicative complex assembly involved in nuclear cell cycle DNA replication(GO:0006267) pre-replicative complex assembly(GO:0036388) pre-replicative complex assembly involved in cell cycle DNA replication(GO:1902299) |
| 0.8 | 13.2 | GO:0043248 | proteasome assembly(GO:0043248) |
| 0.8 | 0.8 | GO:0070541 | response to platinum ion(GO:0070541) |
| 0.8 | 5.4 | GO:0006268 | DNA unwinding involved in DNA replication(GO:0006268) |
| 0.8 | 2.3 | GO:1903348 | positive regulation of bicellular tight junction assembly(GO:1903348) |
| 0.8 | 12.4 | GO:0009263 | deoxyribonucleotide biosynthetic process(GO:0009263) |
| 0.8 | 5.4 | GO:0034393 | positive regulation of smooth muscle cell apoptotic process(GO:0034393) |
| 0.8 | 1.5 | GO:1902071 | regulation of hypoxia-inducible factor-1alpha signaling pathway(GO:1902071) |
| 0.8 | 1.5 | GO:0043046 | DNA methylation involved in gamete generation(GO:0043046) |
| 0.8 | 15.3 | GO:0006298 | mismatch repair(GO:0006298) |
| 0.8 | 11.4 | GO:0006120 | mitochondrial electron transport, NADH to ubiquinone(GO:0006120) |
| 0.8 | 1.5 | GO:0045759 | negative regulation of action potential(GO:0045759) |
| 0.8 | 0.8 | GO:0060315 | negative regulation of ryanodine-sensitive calcium-release channel activity(GO:0060315) |
| 0.8 | 4.5 | GO:0070562 | regulation of vitamin D receptor signaling pathway(GO:0070562) |
| 0.8 | 25.6 | GO:0070534 | protein K63-linked ubiquitination(GO:0070534) |
| 0.8 | 0.8 | GO:0032741 | positive regulation of interleukin-18 production(GO:0032741) |
| 0.8 | 7.5 | GO:0000290 | deadenylation-dependent decapping of nuclear-transcribed mRNA(GO:0000290) |
| 0.8 | 11.3 | GO:0000027 | ribosomal large subunit assembly(GO:0000027) |
| 0.8 | 9.8 | GO:0007288 | sperm axoneme assembly(GO:0007288) |
| 0.7 | 21.7 | GO:0009649 | entrainment of circadian clock(GO:0009649) |
| 0.7 | 6.0 | GO:0001920 | negative regulation of receptor recycling(GO:0001920) |
| 0.7 | 3.7 | GO:0070417 | cellular response to cold(GO:0070417) |
| 0.7 | 4.4 | GO:0051152 | positive regulation of smooth muscle cell differentiation(GO:0051152) |
| 0.7 | 3.7 | GO:0018095 | protein polyglutamylation(GO:0018095) |
| 0.7 | 8.9 | GO:0030238 | male sex determination(GO:0030238) |
| 0.7 | 2.2 | GO:0051198 | negative regulation of nucleotide catabolic process(GO:0030812) negative regulation of glycolytic process(GO:0045820) negative regulation of cofactor metabolic process(GO:0051195) negative regulation of coenzyme metabolic process(GO:0051198) |
| 0.7 | 1.5 | GO:0016115 | terpenoid catabolic process(GO:0016115) |
| 0.7 | 1.5 | GO:0051103 | DNA ligation involved in DNA repair(GO:0051103) |
| 0.7 | 8.1 | GO:0061179 | negative regulation of insulin secretion involved in cellular response to glucose stimulus(GO:0061179) |
| 0.7 | 19.1 | GO:0007340 | acrosome reaction(GO:0007340) |
| 0.7 | 2.9 | GO:0090598 | male genitalia morphogenesis(GO:0048808) male anatomical structure morphogenesis(GO:0090598) |
| 0.7 | 6.6 | GO:0031936 | negative regulation of chromatin silencing(GO:0031936) |
| 0.7 | 12.4 | GO:0015937 | coenzyme A biosynthetic process(GO:0015937) |
| 0.7 | 2.9 | GO:0070828 | heterochromatin organization(GO:0070828) |
| 0.7 | 2.2 | GO:0048630 | skeletal muscle tissue growth(GO:0048630) |
| 0.7 | 5.8 | GO:0032986 | nucleosome disassembly(GO:0006337) protein-DNA complex disassembly(GO:0032986) |
| 0.7 | 1.4 | GO:1905225 | response to thyrotropin-releasing hormone(GO:1905225) |
| 0.7 | 5.1 | GO:0015760 | hexose phosphate transport(GO:0015712) glucose-6-phosphate transport(GO:0015760) |
| 0.7 | 46.6 | GO:0006342 | chromatin silencing(GO:0006342) |
| 0.7 | 5.7 | GO:0051310 | metaphase plate congression(GO:0051310) |
| 0.7 | 3.6 | GO:0033108 | mitochondrial respiratory chain complex assembly(GO:0033108) |
| 0.7 | 1.4 | GO:0051464 | positive regulation of cortisol secretion(GO:0051464) |
| 0.7 | 2.8 | GO:0019072 | viral genome packaging(GO:0019072) viral RNA genome packaging(GO:0019074) |
| 0.7 | 2.8 | GO:0090187 | positive regulation of pancreatic juice secretion(GO:0090187) |
| 0.7 | 0.7 | GO:0034140 | negative regulation of toll-like receptor 3 signaling pathway(GO:0034140) |
| 0.7 | 5.6 | GO:0030575 | nuclear body organization(GO:0030575) |
| 0.7 | 2.1 | GO:0070634 | transepithelial ammonium transport(GO:0070634) |
| 0.7 | 7.7 | GO:0033139 | regulation of peptidyl-serine phosphorylation of STAT protein(GO:0033139) positive regulation of peptidyl-serine phosphorylation of STAT protein(GO:0033141) serine phosphorylation of STAT protein(GO:0042501) |
| 0.7 | 2.1 | GO:0006083 | acetate metabolic process(GO:0006083) |
| 0.7 | 3.5 | GO:2000270 | negative regulation of fibroblast apoptotic process(GO:2000270) |
| 0.7 | 9.0 | GO:0016226 | iron-sulfur cluster assembly(GO:0016226) metallo-sulfur cluster assembly(GO:0031163) |
| 0.7 | 3.5 | GO:0006610 | ribosomal protein import into nucleus(GO:0006610) |
| 0.7 | 10.4 | GO:0015721 | bile acid and bile salt transport(GO:0015721) |
| 0.7 | 4.8 | GO:0033211 | adiponectin-activated signaling pathway(GO:0033211) |
| 0.7 | 4.1 | GO:0019374 | galactolipid metabolic process(GO:0019374) |
| 0.7 | 3.4 | GO:0060334 | regulation of interferon-gamma-mediated signaling pathway(GO:0060334) |
| 0.7 | 11.6 | GO:0006662 | glycerol ether metabolic process(GO:0006662) |
| 0.7 | 11.6 | GO:0089711 | L-glutamate transmembrane transport(GO:0089711) |
| 0.7 | 2.0 | GO:0090521 | glomerular visceral epithelial cell migration(GO:0090521) |
| 0.7 | 0.7 | GO:1902953 | positive regulation of ER to Golgi vesicle-mediated transport(GO:1902953) |
| 0.7 | 4.1 | GO:0035735 | intraciliary transport involved in cilium morphogenesis(GO:0035735) |
| 0.7 | 2.0 | GO:0010603 | regulation of cytoplasmic mRNA processing body assembly(GO:0010603) |
| 0.7 | 6.1 | GO:0051534 | negative regulation of NFAT protein import into nucleus(GO:0051534) |
| 0.7 | 2.0 | GO:0071934 | thiamine transmembrane transport(GO:0071934) |
| 0.7 | 1.3 | GO:0046628 | positive regulation of insulin receptor signaling pathway(GO:0046628) |
| 0.7 | 1.3 | GO:0046501 | protoporphyrinogen IX metabolic process(GO:0046501) |
| 0.7 | 4.0 | GO:2000653 | regulation of genetic imprinting(GO:2000653) |
| 0.7 | 5.3 | GO:0042026 | protein refolding(GO:0042026) |
| 0.7 | 4.0 | GO:0006499 | N-terminal protein myristoylation(GO:0006499) |
| 0.7 | 2.6 | GO:0010992 | ubiquitin homeostasis(GO:0010992) |
| 0.7 | 0.7 | GO:0006408 | snRNA export from nucleus(GO:0006408) |
| 0.7 | 4.0 | GO:0072711 | cellular response to hydroxyurea(GO:0072711) |
| 0.7 | 4.6 | GO:1900262 | regulation of DNA-directed DNA polymerase activity(GO:1900262) positive regulation of DNA-directed DNA polymerase activity(GO:1900264) |
| 0.7 | 0.7 | GO:0030237 | female sex determination(GO:0030237) |
| 0.7 | 0.7 | GO:2001274 | negative regulation of glucose import in response to insulin stimulus(GO:2001274) |
| 0.7 | 0.7 | GO:0010899 | regulation of phosphatidylcholine catabolic process(GO:0010899) phosphatidylcholine catabolic process(GO:0034638) |
| 0.7 | 11.1 | GO:0050910 | detection of mechanical stimulus involved in sensory perception of sound(GO:0050910) |
| 0.7 | 3.9 | GO:0043249 | erythrocyte maturation(GO:0043249) |
| 0.6 | 2.6 | GO:2000317 | negative regulation of T-helper 17 type immune response(GO:2000317) negative regulation of T-helper 17 cell differentiation(GO:2000320) |
| 0.6 | 0.6 | GO:2000538 | regulation of B cell chemotaxis(GO:2000537) positive regulation of B cell chemotaxis(GO:2000538) |
| 0.6 | 3.2 | GO:0031339 | negative regulation of vesicle fusion(GO:0031339) |
| 0.6 | 11.6 | GO:0007080 | mitotic metaphase plate congression(GO:0007080) |
| 0.6 | 1.9 | GO:2000780 | negative regulation of double-strand break repair(GO:2000780) |
| 0.6 | 2.6 | GO:0000707 | meiotic DNA recombinase assembly(GO:0000707) |
| 0.6 | 1.9 | GO:0034427 | nuclear-transcribed mRNA catabolic process, exonucleolytic, 3'-5'(GO:0034427) |
| 0.6 | 7.6 | GO:0034508 | centromere complex assembly(GO:0034508) |
| 0.6 | 1.9 | GO:0006543 | glutamine catabolic process(GO:0006543) |
| 0.6 | 9.5 | GO:0048172 | regulation of short-term neuronal synaptic plasticity(GO:0048172) |
| 0.6 | 0.6 | GO:0019856 | 'de novo' pyrimidine nucleobase biosynthetic process(GO:0006207) pyrimidine nucleobase biosynthetic process(GO:0019856) |
| 0.6 | 3.8 | GO:0036017 | response to erythropoietin(GO:0036017) |
| 0.6 | 3.1 | GO:0045835 | negative regulation of meiotic nuclear division(GO:0045835) |
| 0.6 | 8.7 | GO:0036065 | fucosylation(GO:0036065) |
| 0.6 | 3.1 | GO:0030011 | maintenance of cell polarity(GO:0030011) |
| 0.6 | 7.4 | GO:0006271 | DNA strand elongation involved in DNA replication(GO:0006271) |
| 0.6 | 1.2 | GO:0043152 | induction of bacterial agglutination(GO:0043152) |
| 0.6 | 3.7 | GO:0044860 | protein localization to plasma membrane raft(GO:0044860) |
| 0.6 | 6.0 | GO:0043374 | CD8-positive, alpha-beta T cell differentiation(GO:0043374) |
| 0.6 | 7.8 | GO:0060218 | hematopoietic stem cell differentiation(GO:0060218) |
| 0.6 | 9.6 | GO:0051290 | protein heterotetramerization(GO:0051290) |
| 0.6 | 4.2 | GO:0042448 | progesterone metabolic process(GO:0042448) |
| 0.6 | 5.4 | GO:0006474 | N-terminal protein amino acid acetylation(GO:0006474) |
| 0.6 | 2.4 | GO:0002752 | cell surface pattern recognition receptor signaling pathway(GO:0002752) |
| 0.6 | 3.6 | GO:0097201 | negative regulation of transcription from RNA polymerase II promoter in response to stress(GO:0097201) |
| 0.6 | 2.4 | GO:1901978 | positive regulation of cell cycle checkpoint(GO:1901978) |
| 0.6 | 5.9 | GO:0043569 | negative regulation of insulin-like growth factor receptor signaling pathway(GO:0043569) |
| 0.6 | 5.3 | GO:0070244 | negative regulation of thymocyte apoptotic process(GO:0070244) |
| 0.6 | 6.5 | GO:0086012 | membrane depolarization during cardiac muscle cell action potential(GO:0086012) |
| 0.6 | 4.7 | GO:0035898 | parathyroid hormone secretion(GO:0035898) |
| 0.6 | 4.1 | GO:1990416 | cellular response to brain-derived neurotrophic factor stimulus(GO:1990416) |
| 0.6 | 4.7 | GO:0090224 | regulation of mitotic spindle organization(GO:0060236) regulation of spindle organization(GO:0090224) |
| 0.6 | 2.9 | GO:2000018 | regulation of male gonad development(GO:2000018) |
| 0.6 | 2.3 | GO:0042985 | negative regulation of amyloid precursor protein biosynthetic process(GO:0042985) |
| 0.6 | 4.7 | GO:0000491 | small nucleolar ribonucleoprotein complex assembly(GO:0000491) |
| 0.6 | 1.2 | GO:0090435 | protein localization to nuclear envelope(GO:0090435) |
| 0.6 | 28.9 | GO:0006334 | nucleosome assembly(GO:0006334) |
| 0.6 | 4.6 | GO:0002759 | regulation of antimicrobial humoral response(GO:0002759) |
| 0.6 | 18.2 | GO:0000387 | spliceosomal snRNP assembly(GO:0000387) |
| 0.6 | 2.3 | GO:0090073 | positive regulation of protein homodimerization activity(GO:0090073) |
| 0.6 | 1.1 | GO:1902595 | regulation of DNA replication origin binding(GO:1902595) |
| 0.6 | 2.3 | GO:0006428 | isoleucyl-tRNA aminoacylation(GO:0006428) |
| 0.6 | 2.8 | GO:0031145 | anaphase-promoting complex-dependent catabolic process(GO:0031145) |
| 0.6 | 4.5 | GO:0007007 | inner mitochondrial membrane organization(GO:0007007) |
| 0.6 | 2.3 | GO:0030222 | eosinophil differentiation(GO:0030222) |
| 0.6 | 2.8 | GO:0031119 | tRNA pseudouridine synthesis(GO:0031119) |
| 0.6 | 3.4 | GO:0009162 | deoxyribonucleoside monophosphate metabolic process(GO:0009162) |
| 0.6 | 6.1 | GO:0033594 | response to hydroxyisoflavone(GO:0033594) |
| 0.6 | 11.6 | GO:0046457 | prostaglandin biosynthetic process(GO:0001516) prostanoid biosynthetic process(GO:0046457) |
| 0.5 | 1.6 | GO:0097089 | methyl-branched fatty acid metabolic process(GO:0097089) |
| 0.5 | 2.2 | GO:0006384 | transcription initiation from RNA polymerase III promoter(GO:0006384) |
| 0.5 | 5.9 | GO:0043968 | histone H2A acetylation(GO:0043968) |
| 0.5 | 2.2 | GO:0048341 | paraxial mesoderm formation(GO:0048341) |
| 0.5 | 2.7 | GO:0010045 | response to nickel cation(GO:0010045) |
| 0.5 | 2.1 | GO:0052422 | modulation of catalytic activity in other organism involved in symbiotic interaction(GO:0052203) modulation by host of symbiont catalytic activity(GO:0052422) |
| 0.5 | 4.3 | GO:0072578 | neurotransmitter-gated ion channel clustering(GO:0072578) |
| 0.5 | 1.1 | GO:0009644 | response to high light intensity(GO:0009644) |
| 0.5 | 2.1 | GO:1990253 | cellular response to leucine starvation(GO:1990253) |
| 0.5 | 2.1 | GO:0019853 | L-ascorbic acid biosynthetic process(GO:0019853) |
| 0.5 | 4.2 | GO:0045059 | positive thymic T cell selection(GO:0045059) |
| 0.5 | 3.1 | GO:0045329 | carnitine biosynthetic process(GO:0045329) |
| 0.5 | 7.3 | GO:0044126 | regulation of growth of symbiont in host(GO:0044126) modulation of growth of symbiont involved in interaction with host(GO:0044144) |
| 0.5 | 1.0 | GO:1990164 | histone H2A phosphorylation(GO:1990164) |
| 0.5 | 1.0 | GO:1904636 | response to ionomycin(GO:1904636) cellular response to ionomycin(GO:1904637) |
| 0.5 | 2.6 | GO:0000160 | phosphorelay signal transduction system(GO:0000160) |
| 0.5 | 1.5 | GO:0044376 | RNA polymerase II complex import to nucleus(GO:0044376) RNA polymerase III complex localization to nucleus(GO:1990022) |
| 0.5 | 2.6 | GO:0099639 | neurotransmitter receptor transport, endosome to postsynaptic membrane(GO:0098887) neurotransmitter receptor transport, endosome to plasma membrane(GO:0099639) |
| 0.5 | 3.1 | GO:0042255 | ribosome assembly(GO:0042255) |
| 0.5 | 2.0 | GO:0048478 | replication fork protection(GO:0048478) |
| 0.5 | 1.0 | GO:2000255 | negative regulation of male germ cell proliferation(GO:2000255) |
| 0.5 | 10.6 | GO:0009303 | rRNA transcription(GO:0009303) |
| 0.5 | 4.6 | GO:0000076 | DNA replication checkpoint(GO:0000076) |
| 0.5 | 1.5 | GO:0098909 | regulation of cardiac muscle cell action potential involved in regulation of contraction(GO:0098909) |
| 0.5 | 7.0 | GO:0030299 | intestinal cholesterol absorption(GO:0030299) |
| 0.5 | 2.5 | GO:0034316 | negative regulation of Arp2/3 complex-mediated actin nucleation(GO:0034316) |
| 0.5 | 1.0 | GO:1903463 | regulation of mitotic cell cycle DNA replication(GO:1903463) |
| 0.5 | 4.9 | GO:0033151 | V(D)J recombination(GO:0033151) |
| 0.5 | 3.9 | GO:0051205 | protein insertion into membrane(GO:0051205) |
| 0.5 | 5.9 | GO:0046337 | phosphatidylethanolamine metabolic process(GO:0046337) |
| 0.5 | 3.9 | GO:0060573 | ventral spinal cord interneuron specification(GO:0021521) cell fate specification involved in pattern specification(GO:0060573) |
| 0.5 | 4.9 | GO:0006265 | DNA topological change(GO:0006265) |
| 0.5 | 2.4 | GO:0034983 | peptidyl-lysine deacetylation(GO:0034983) |
| 0.5 | 0.5 | GO:0032056 | positive regulation of translation in response to stress(GO:0032056) |
| 0.5 | 4.4 | GO:0070544 | histone H3-K36 demethylation(GO:0070544) |
| 0.5 | 1.9 | GO:0001661 | conditioned taste aversion(GO:0001661) |
| 0.5 | 1.9 | GO:0015879 | carnitine transport(GO:0015879) |
| 0.5 | 2.9 | GO:0071872 | cellular response to epinephrine stimulus(GO:0071872) |
| 0.5 | 1.0 | GO:1902774 | late endosome to lysosome transport(GO:1902774) |
| 0.5 | 3.9 | GO:0033523 | histone H2B ubiquitination(GO:0033523) |
| 0.5 | 3.4 | GO:0010727 | negative regulation of hydrogen peroxide metabolic process(GO:0010727) |
| 0.5 | 1.9 | GO:0098501 | polynucleotide dephosphorylation(GO:0098501) |
| 0.5 | 1.4 | GO:0002949 | tRNA threonylcarbamoyladenosine modification(GO:0002949) |
| 0.5 | 2.4 | GO:0030070 | insulin processing(GO:0030070) |
| 0.5 | 3.3 | GO:0016578 | histone deubiquitination(GO:0016578) |
| 0.5 | 2.8 | GO:0072718 | response to cisplatin(GO:0072718) |
| 0.5 | 1.4 | GO:0042357 | thiamine diphosphate metabolic process(GO:0042357) |
| 0.5 | 26.3 | GO:0030317 | sperm motility(GO:0030317) |
| 0.5 | 0.5 | GO:0071454 | cellular response to anoxia(GO:0071454) |
| 0.5 | 2.8 | GO:0021684 | cerebellar granular layer morphogenesis(GO:0021683) cerebellar granular layer formation(GO:0021684) cerebellar granule cell differentiation(GO:0021707) |
| 0.5 | 1.4 | GO:1902570 | protein localization to nucleolus(GO:1902570) |
| 0.5 | 1.9 | GO:2000825 | positive regulation of androgen receptor activity(GO:2000825) |
| 0.5 | 1.4 | GO:0006419 | alanyl-tRNA aminoacylation(GO:0006419) |
| 0.5 | 1.4 | GO:0052047 | interaction with other organism via secreted substance involved in symbiotic interaction(GO:0052047) |
| 0.5 | 0.9 | GO:1903774 | positive regulation of viral budding via host ESCRT complex(GO:1903774) |
| 0.5 | 5.1 | GO:0045141 | meiotic telomere clustering(GO:0045141) |
| 0.5 | 2.3 | GO:0016557 | peroxisome membrane biogenesis(GO:0016557) |
| 0.5 | 1.8 | GO:2000676 | positive regulation of type B pancreatic cell apoptotic process(GO:2000676) |
| 0.5 | 8.2 | GO:0036158 | outer dynein arm assembly(GO:0036158) |
| 0.5 | 0.5 | GO:1901093 | regulation of protein tetramerization(GO:1901090) negative regulation of protein tetramerization(GO:1901091) regulation of protein homotetramerization(GO:1901093) negative regulation of protein homotetramerization(GO:1901094) |
| 0.4 | 0.9 | GO:0072716 | response to actinomycin D(GO:0072716) |
| 0.4 | 4.0 | GO:0006703 | estrogen biosynthetic process(GO:0006703) |
| 0.4 | 13.8 | GO:0032094 | response to food(GO:0032094) |
| 0.4 | 1.8 | GO:0070839 | divalent metal ion export(GO:0070839) |
| 0.4 | 1.8 | GO:0008295 | spermidine biosynthetic process(GO:0008295) |
| 0.4 | 3.6 | GO:2000773 | negative regulation of cellular senescence(GO:2000773) |
| 0.4 | 4.9 | GO:0006613 | cotranslational protein targeting to membrane(GO:0006613) |
| 0.4 | 7.9 | GO:0007099 | centriole replication(GO:0007099) |
| 0.4 | 1.3 | GO:0090204 | protein localization to nuclear pore(GO:0090204) |
| 0.4 | 12.2 | GO:0070936 | protein K48-linked ubiquitination(GO:0070936) |
| 0.4 | 1.3 | GO:0070384 | Harderian gland development(GO:0070384) |
| 0.4 | 1.3 | GO:1901977 | negative regulation of cell cycle checkpoint(GO:1901977) |
| 0.4 | 3.0 | GO:0048387 | negative regulation of retinoic acid receptor signaling pathway(GO:0048387) |
| 0.4 | 1.7 | GO:0021586 | pons maturation(GO:0021586) |
| 0.4 | 2.1 | GO:0038161 | prolactin signaling pathway(GO:0038161) |
| 0.4 | 204.0 | GO:0006412 | translation(GO:0006412) |
| 0.4 | 1.2 | GO:0002074 | extraocular skeletal muscle development(GO:0002074) |
| 0.4 | 1.2 | GO:0002644 | negative regulation of tolerance induction(GO:0002644) |
| 0.4 | 2.5 | GO:0051599 | response to hydrostatic pressure(GO:0051599) |
| 0.4 | 5.4 | GO:0032515 | negative regulation of phosphoprotein phosphatase activity(GO:0032515) |
| 0.4 | 4.1 | GO:0090141 | positive regulation of mitochondrial fission(GO:0090141) |
| 0.4 | 2.0 | GO:0061709 | reticulophagy(GO:0061709) |
| 0.4 | 3.3 | GO:0007016 | cytoskeletal anchoring at plasma membrane(GO:0007016) |
| 0.4 | 12.6 | GO:0007029 | endoplasmic reticulum organization(GO:0007029) |
| 0.4 | 1.6 | GO:0006089 | lactate metabolic process(GO:0006089) |
| 0.4 | 4.8 | GO:0050434 | positive regulation of viral transcription(GO:0050434) |
| 0.4 | 1.6 | GO:1904058 | positive regulation of sensory perception of pain(GO:1904058) |
| 0.4 | 0.8 | GO:0055095 | lipoprotein particle mediated signaling(GO:0055095) low-density lipoprotein particle mediated signaling(GO:0055096) |
| 0.4 | 3.6 | GO:1904292 | regulation of ERAD pathway(GO:1904292) |
| 0.4 | 2.8 | GO:2000394 | positive regulation of lamellipodium morphogenesis(GO:2000394) |
| 0.4 | 1.2 | GO:0019254 | carnitine metabolic process, CoA-linked(GO:0019254) |
| 0.4 | 5.5 | GO:0006000 | fructose metabolic process(GO:0006000) |
| 0.4 | 0.8 | GO:1904526 | regulation of microtubule binding(GO:1904526) positive regulation of microtubule binding(GO:1904528) |
| 0.4 | 2.7 | GO:1903826 | arginine transmembrane transport(GO:1903826) |
| 0.4 | 2.3 | GO:0000012 | single strand break repair(GO:0000012) |
| 0.4 | 0.4 | GO:0090209 | negative regulation of triglyceride metabolic process(GO:0090209) |
| 0.4 | 3.4 | GO:0048934 | peripheral nervous system neuron differentiation(GO:0048934) peripheral nervous system neuron development(GO:0048935) |
| 0.4 | 1.1 | GO:1903352 | L-ornithine transmembrane transport(GO:1903352) |
| 0.4 | 6.0 | GO:0007528 | neuromuscular junction development(GO:0007528) |
| 0.4 | 3.4 | GO:0001967 | suckling behavior(GO:0001967) |
| 0.4 | 1.1 | GO:0042138 | meiotic DNA double-strand break formation(GO:0042138) |
| 0.4 | 1.9 | GO:0048386 | positive regulation of retinoic acid receptor signaling pathway(GO:0048386) |
| 0.4 | 15.2 | GO:0048747 | muscle fiber development(GO:0048747) |
| 0.4 | 4.8 | GO:0060576 | intestinal epithelial cell development(GO:0060576) |
| 0.4 | 2.9 | GO:0046784 | viral mRNA export from host cell nucleus(GO:0046784) |
| 0.4 | 1.8 | GO:0009448 | gamma-aminobutyric acid metabolic process(GO:0009448) |
| 0.4 | 1.8 | GO:2000623 | regulation of nuclear-transcribed mRNA catabolic process, nonsense-mediated decay(GO:2000622) negative regulation of nuclear-transcribed mRNA catabolic process, nonsense-mediated decay(GO:2000623) |
| 0.4 | 1.4 | GO:1902525 | regulation of protein monoubiquitination(GO:1902525) |
| 0.4 | 3.2 | GO:0042095 | interferon-gamma biosynthetic process(GO:0042095) regulation of interferon-gamma biosynthetic process(GO:0045072) positive regulation of interferon-gamma biosynthetic process(GO:0045078) |
| 0.4 | 2.5 | GO:0010452 | histone H3-K36 methylation(GO:0010452) |
| 0.4 | 0.7 | GO:0003100 | regulation of systemic arterial blood pressure by endothelin(GO:0003100) |
| 0.4 | 2.5 | GO:0006702 | androgen biosynthetic process(GO:0006702) |
| 0.4 | 1.1 | GO:0036265 | RNA (guanine-N7)-methylation(GO:0036265) |
| 0.3 | 1.7 | GO:0048304 | positive regulation of isotype switching to IgG isotypes(GO:0048304) |
| 0.3 | 1.0 | GO:0070272 | proton-transporting ATP synthase complex assembly(GO:0043461) proton-transporting ATP synthase complex biogenesis(GO:0070272) |
| 0.3 | 5.1 | GO:0000184 | nuclear-transcribed mRNA catabolic process, nonsense-mediated decay(GO:0000184) |
| 0.3 | 2.0 | GO:0098928 | presynaptic signal transduction(GO:0098928) presynapse to nucleus signaling pathway(GO:0099526) |
| 0.3 | 1.0 | GO:0018916 | nitrobenzene metabolic process(GO:0018916) |
| 0.3 | 5.8 | GO:0045070 | positive regulation of viral genome replication(GO:0045070) |
| 0.3 | 2.0 | GO:0001672 | regulation of chromatin assembly or disassembly(GO:0001672) |
| 0.3 | 0.7 | GO:0046102 | inosine metabolic process(GO:0046102) inosine biosynthetic process(GO:0046103) |
| 0.3 | 1.7 | GO:0017183 | peptidyl-diphthamide metabolic process(GO:0017182) peptidyl-diphthamide biosynthetic process from peptidyl-histidine(GO:0017183) |
| 0.3 | 1.7 | GO:0061014 | positive regulation of mRNA catabolic process(GO:0061014) |
| 0.3 | 1.7 | GO:0045086 | positive regulation of interleukin-2 biosynthetic process(GO:0045086) |
| 0.3 | 1.0 | GO:0090360 | platelet-derived growth factor production(GO:0090360) regulation of platelet-derived growth factor production(GO:0090361) |
| 0.3 | 0.7 | GO:1903416 | response to glycoside(GO:1903416) |
| 0.3 | 2.3 | GO:0010890 | positive regulation of sequestering of triglyceride(GO:0010890) |
| 0.3 | 2.3 | GO:1902083 | negative regulation of peptidyl-cysteine S-nitrosylation(GO:1902083) |
| 0.3 | 3.6 | GO:0055012 | ventricular cardiac muscle cell differentiation(GO:0055012) |
| 0.3 | 0.6 | GO:0034635 | glutathione transport(GO:0034635) tripeptide transport(GO:0042939) |
| 0.3 | 0.6 | GO:0051562 | negative regulation of mitochondrial calcium ion concentration(GO:0051562) |
| 0.3 | 2.9 | GO:0009235 | cobalamin metabolic process(GO:0009235) |
| 0.3 | 0.6 | GO:0010649 | regulation of cell communication by electrical coupling(GO:0010649) |
| 0.3 | 1.6 | GO:0035562 | negative regulation of chromatin binding(GO:0035562) |
| 0.3 | 4.4 | GO:0065002 | intracellular protein transmembrane transport(GO:0065002) |
| 0.3 | 0.9 | GO:0000920 | cell separation after cytokinesis(GO:0000920) |
| 0.3 | 0.9 | GO:0071348 | cellular response to interleukin-11(GO:0071348) |
| 0.3 | 6.3 | GO:0032728 | positive regulation of interferon-beta production(GO:0032728) |
| 0.3 | 3.4 | GO:0019227 | neuronal action potential propagation(GO:0019227) action potential propagation(GO:0098870) |
| 0.3 | 6.8 | GO:0042273 | ribosomal large subunit biogenesis(GO:0042273) |
| 0.3 | 0.9 | GO:0002380 | immunoglobulin secretion involved in immune response(GO:0002380) |
| 0.3 | 3.4 | GO:0051438 | regulation of ubiquitin-protein transferase activity(GO:0051438) |
| 0.3 | 0.9 | GO:0043474 | eye pigment metabolic process(GO:0042441) pigment metabolic process involved in developmental pigmentation(GO:0043324) pigment metabolic process involved in pigmentation(GO:0043474) rhodopsin metabolic process(GO:0046154) |
| 0.3 | 2.4 | GO:0060056 | mammary gland involution(GO:0060056) |
| 0.3 | 8.8 | GO:0042462 | eye photoreceptor cell development(GO:0042462) |
| 0.3 | 20.2 | GO:1902017 | regulation of cilium assembly(GO:1902017) |
| 0.3 | 3.6 | GO:0019985 | translesion synthesis(GO:0019985) |
| 0.3 | 3.3 | GO:0006607 | NLS-bearing protein import into nucleus(GO:0006607) |
| 0.3 | 1.8 | GO:1902065 | response to L-glutamate(GO:1902065) |
| 0.3 | 0.9 | GO:0019389 | glucuronoside metabolic process(GO:0019389) |
| 0.3 | 1.5 | GO:0098914 | membrane repolarization during atrial cardiac muscle cell action potential(GO:0098914) |
| 0.3 | 1.2 | GO:0000154 | rRNA modification(GO:0000154) |
| 0.3 | 2.1 | GO:0070236 | negative regulation of activation-induced cell death of T cells(GO:0070236) |
| 0.3 | 2.3 | GO:0042989 | sequestering of actin monomers(GO:0042989) |
| 0.3 | 1.7 | GO:0061074 | regulation of neural retina development(GO:0061074) |
| 0.3 | 0.9 | GO:0032474 | otolith morphogenesis(GO:0032474) |
| 0.3 | 0.3 | GO:0099542 | trans-synaptic signaling by lipid(GO:0099541) trans-synaptic signaling by endocannabinoid(GO:0099542) |
| 0.3 | 3.4 | GO:0016048 | detection of temperature stimulus(GO:0016048) |
| 0.3 | 0.8 | GO:0043418 | homocysteine catabolic process(GO:0043418) |
| 0.3 | 0.6 | GO:0032464 | positive regulation of protein homooligomerization(GO:0032464) |
| 0.3 | 6.7 | GO:0006378 | mRNA polyadenylation(GO:0006378) |
| 0.3 | 0.8 | GO:0051574 | positive regulation of histone H3-K9 methylation(GO:0051574) |
| 0.3 | 0.8 | GO:2001013 | epithelial cell proliferation involved in renal tubule morphogenesis(GO:2001013) |
| 0.3 | 2.7 | GO:0090201 | negative regulation of release of cytochrome c from mitochondria(GO:0090201) |
| 0.3 | 1.9 | GO:0060159 | regulation of dopamine receptor signaling pathway(GO:0060159) |
| 0.3 | 3.7 | GO:0060065 | uterus development(GO:0060065) |
| 0.3 | 1.9 | GO:0071340 | skeletal muscle acetylcholine-gated channel clustering(GO:0071340) |
| 0.3 | 2.4 | GO:0001675 | acrosome assembly(GO:0001675) |
| 0.3 | 0.5 | GO:0090669 | telomerase RNA stabilization(GO:0090669) |
| 0.3 | 1.0 | GO:0000389 | mRNA 3'-splice site recognition(GO:0000389) |
| 0.3 | 2.1 | GO:0097461 | ferric iron import(GO:0033216) ferric iron import into cell(GO:0097461) ferric iron import across plasma membrane(GO:0098706) |
| 0.3 | 0.8 | GO:0090481 | pyrimidine nucleotide-sugar transmembrane transport(GO:0090481) |
| 0.3 | 6.9 | GO:0030514 | negative regulation of BMP signaling pathway(GO:0030514) |
| 0.3 | 1.5 | GO:0019800 | peptide cross-linking via chondroitin 4-sulfate glycosaminoglycan(GO:0019800) |
| 0.3 | 0.8 | GO:0034382 | chylomicron remnant clearance(GO:0034382) triglyceride-rich lipoprotein particle clearance(GO:0071830) |
| 0.3 | 0.5 | GO:0048690 | regulation of sprouting of injured axon(GO:0048686) regulation of axon extension involved in regeneration(GO:0048690) |
| 0.3 | 0.8 | GO:0061525 | hindgut development(GO:0061525) |
| 0.3 | 1.0 | GO:0071806 | protein transmembrane transport(GO:0071806) |
| 0.3 | 1.5 | GO:0038169 | somatostatin receptor signaling pathway(GO:0038169) somatostatin signaling pathway(GO:0038170) |
| 0.3 | 0.5 | GO:0099545 | trans-synaptic signaling by trans-synaptic complex(GO:0099545) |
| 0.2 | 3.0 | GO:0070979 | protein K11-linked ubiquitination(GO:0070979) |
| 0.2 | 0.5 | GO:0060620 | regulation of cholesterol import(GO:0060620) regulation of sterol import(GO:2000909) |
| 0.2 | 2.0 | GO:0007263 | nitric oxide mediated signal transduction(GO:0007263) |
| 0.2 | 0.7 | GO:1900246 | positive regulation of RIG-I signaling pathway(GO:1900246) |
| 0.2 | 0.7 | GO:0055129 | L-proline biosynthetic process(GO:0055129) |
| 0.2 | 1.0 | GO:0097401 | synaptic vesicle lumen acidification(GO:0097401) |
| 0.2 | 2.4 | GO:0045002 | DNA double-strand break processing involved in repair via single-strand annealing(GO:0010792) double-strand break repair via single-strand annealing(GO:0045002) |
| 0.2 | 3.1 | GO:0030502 | negative regulation of bone mineralization(GO:0030502) |
| 0.2 | 1.6 | GO:0000083 | regulation of transcription involved in G1/S transition of mitotic cell cycle(GO:0000083) |
| 0.2 | 1.2 | GO:0043486 | histone exchange(GO:0043486) |
| 0.2 | 6.6 | GO:0099601 | regulation of neurotransmitter receptor activity(GO:0099601) |
| 0.2 | 1.6 | GO:0042976 | activation of Janus kinase activity(GO:0042976) |
| 0.2 | 4.0 | GO:0006198 | cAMP catabolic process(GO:0006198) |
| 0.2 | 1.4 | GO:0014877 | response to muscle inactivity involved in regulation of muscle adaptation(GO:0014877) response to denervation involved in regulation of muscle adaptation(GO:0014894) |
| 0.2 | 0.7 | GO:0045076 | regulation of interleukin-2 biosynthetic process(GO:0045076) |
| 0.2 | 10.8 | GO:0045454 | cell redox homeostasis(GO:0045454) |
| 0.2 | 1.4 | GO:2000210 | positive regulation of anoikis(GO:2000210) |
| 0.2 | 1.1 | GO:0031665 | negative regulation of lipopolysaccharide-mediated signaling pathway(GO:0031665) |
| 0.2 | 2.9 | GO:0045736 | negative regulation of cyclin-dependent protein serine/threonine kinase activity(GO:0045736) |
| 0.2 | 1.3 | GO:0060721 | regulation of spongiotrophoblast cell proliferation(GO:0060721) regulation of cell proliferation involved in embryonic placenta development(GO:0060723) |
| 0.2 | 3.9 | GO:0098743 | cell aggregation(GO:0098743) |
| 0.2 | 3.0 | GO:0051123 | RNA polymerase II transcriptional preinitiation complex assembly(GO:0051123) |
| 0.2 | 2.4 | GO:0001522 | pseudouridine synthesis(GO:0001522) |
| 0.2 | 2.4 | GO:0035970 | peptidyl-threonine dephosphorylation(GO:0035970) |
| 0.2 | 1.7 | GO:2000400 | positive regulation of T cell differentiation in thymus(GO:0033089) positive regulation of thymocyte aggregation(GO:2000400) |
| 0.2 | 4.8 | GO:0000281 | mitotic cytokinesis(GO:0000281) |
| 0.2 | 0.8 | GO:0023016 | signal transduction by trans-phosphorylation(GO:0023016) |
| 0.2 | 0.6 | GO:1901491 | negative regulation of lymphangiogenesis(GO:1901491) |
| 0.2 | 2.7 | GO:0048665 | neuron fate specification(GO:0048665) |
| 0.2 | 0.8 | GO:0033603 | positive regulation of dopamine secretion(GO:0033603) |
| 0.2 | 3.7 | GO:0006020 | inositol metabolic process(GO:0006020) |
| 0.2 | 2.0 | GO:0009750 | response to fructose(GO:0009750) |
| 0.2 | 0.8 | GO:1901160 | serotonin metabolic process(GO:0042428) primary amino compound metabolic process(GO:1901160) |
| 0.2 | 1.8 | GO:0006878 | cellular copper ion homeostasis(GO:0006878) |
| 0.2 | 1.0 | GO:0038092 | nodal signaling pathway(GO:0038092) |
| 0.2 | 0.4 | GO:0051256 | mitotic spindle elongation(GO:0000022) mitotic spindle midzone assembly(GO:0051256) |
| 0.2 | 0.4 | GO:0034196 | acylglycerol transport(GO:0034196) triglyceride transport(GO:0034197) |
| 0.2 | 0.6 | GO:1903445 | protein transport from ciliary membrane to plasma membrane(GO:1903445) |
| 0.2 | 0.7 | GO:0006388 | tRNA splicing, via endonucleolytic cleavage and ligation(GO:0006388) |
| 0.2 | 0.9 | GO:0038007 | netrin-activated signaling pathway(GO:0038007) |
| 0.2 | 0.9 | GO:0032469 | endoplasmic reticulum calcium ion homeostasis(GO:0032469) |
| 0.2 | 0.4 | GO:1902568 | regulation of eosinophil degranulation(GO:0043309) positive regulation of eosinophil degranulation(GO:0043311) regulation of eosinophil activation(GO:1902566) positive regulation of eosinophil activation(GO:1902568) |
| 0.2 | 2.4 | GO:0009415 | response to water(GO:0009415) |
| 0.2 | 0.5 | GO:0097037 | heme export(GO:0097037) |
| 0.2 | 0.5 | GO:0072708 | response to sorbitol(GO:0072708) |
| 0.2 | 0.2 | GO:0043928 | exonucleolytic nuclear-transcribed mRNA catabolic process involved in deadenylation-dependent decay(GO:0043928) |
| 0.2 | 1.1 | GO:0042135 | neurotransmitter catabolic process(GO:0042135) |
| 0.2 | 0.7 | GO:0032488 | Cdc42 protein signal transduction(GO:0032488) |
| 0.2 | 0.5 | GO:0006574 | valine catabolic process(GO:0006574) |
| 0.2 | 1.6 | GO:1901642 | nucleoside transmembrane transport(GO:1901642) |
| 0.2 | 0.3 | GO:0006177 | GMP biosynthetic process(GO:0006177) |
| 0.2 | 2.4 | GO:0010818 | T cell chemotaxis(GO:0010818) |
| 0.2 | 0.6 | GO:0051799 | negative regulation of hair follicle development(GO:0051799) |
| 0.2 | 2.2 | GO:0048490 | anterograde synaptic vesicle transport(GO:0048490) synaptic vesicle cytoskeletal transport(GO:0099514) synaptic vesicle transport along microtubule(GO:0099517) |
| 0.2 | 1.4 | GO:0015858 | nucleoside transport(GO:0015858) |
| 0.2 | 0.2 | GO:0006933 | negative regulation of cell adhesion involved in substrate-bound cell migration(GO:0006933) |
| 0.1 | 2.5 | GO:0010501 | RNA secondary structure unwinding(GO:0010501) |
| 0.1 | 11.3 | GO:0042254 | ribosome biogenesis(GO:0042254) |
| 0.1 | 0.4 | GO:0038003 | opioid receptor signaling pathway(GO:0038003) |
| 0.1 | 0.7 | GO:0001923 | B-1 B cell differentiation(GO:0001923) |
| 0.1 | 0.7 | GO:0033504 | floor plate development(GO:0033504) |
| 0.1 | 0.4 | GO:0030327 | prenylated protein catabolic process(GO:0030327) |
| 0.1 | 0.4 | GO:0031296 | B cell costimulation(GO:0031296) |
| 0.1 | 0.7 | GO:0071481 | cellular response to X-ray(GO:0071481) |
| 0.1 | 0.6 | GO:0045162 | clustering of voltage-gated sodium channels(GO:0045162) |
| 0.1 | 0.3 | GO:2000821 | regulation of grooming behavior(GO:2000821) |
| 0.1 | 0.4 | GO:1903251 | multi-ciliated epithelial cell differentiation(GO:1903251) |
| 0.1 | 1.4 | GO:0034310 | primary alcohol catabolic process(GO:0034310) |
| 0.1 | 0.5 | GO:0038031 | non-canonical Wnt signaling pathway via MAPK cascade(GO:0038030) non-canonical Wnt signaling pathway via JNK cascade(GO:0038031) |
| 0.1 | 1.0 | GO:0002922 | positive regulation of humoral immune response(GO:0002922) |
| 0.1 | 0.2 | GO:0072369 | regulation of lipid transport by positive regulation of transcription from RNA polymerase II promoter(GO:0072369) |
| 0.1 | 0.3 | GO:0009256 | 10-formyltetrahydrofolate metabolic process(GO:0009256) |
| 0.1 | 0.6 | GO:0002467 | germinal center formation(GO:0002467) |
| 0.1 | 1.4 | GO:0006515 | misfolded or incompletely synthesized protein catabolic process(GO:0006515) |
| 0.1 | 1.0 | GO:0032793 | positive regulation of CREB transcription factor activity(GO:0032793) |
| 0.1 | 1.0 | GO:1900017 | positive regulation of cytokine production involved in inflammatory response(GO:1900017) |
| 0.1 | 0.7 | GO:0050995 | negative regulation of lipid catabolic process(GO:0050995) |
| 0.1 | 0.3 | GO:0034499 | late endosome to Golgi transport(GO:0034499) |
| 0.1 | 1.0 | GO:1904355 | positive regulation of telomere capping(GO:1904355) |
| 0.1 | 0.6 | GO:0032275 | luteinizing hormone secretion(GO:0032275) |
| 0.1 | 0.2 | GO:0034729 | histone H3-K79 methylation(GO:0034729) |
| 0.1 | 0.6 | GO:0007097 | nuclear migration(GO:0007097) |
| 0.1 | 0.4 | GO:0072512 | ferric iron transport(GO:0015682) trivalent inorganic cation transport(GO:0072512) |
| 0.1 | 0.3 | GO:0045653 | negative regulation of megakaryocyte differentiation(GO:0045653) |
| 0.1 | 1.7 | GO:0016180 | snRNA processing(GO:0016180) |
| 0.1 | 2.7 | GO:0022904 | respiratory electron transport chain(GO:0022904) |
| 0.1 | 0.4 | GO:0019464 | glycine catabolic process(GO:0006546) glycine decarboxylation via glycine cleavage system(GO:0019464) |
| 0.1 | 1.7 | GO:2000300 | regulation of synaptic vesicle exocytosis(GO:2000300) |
| 0.1 | 0.2 | GO:0019676 | ammonia assimilation cycle(GO:0019676) |
| 0.1 | 0.8 | GO:2000269 | regulation of fibroblast apoptotic process(GO:2000269) |
| 0.1 | 0.6 | GO:0036444 | calcium ion transmembrane import into mitochondrion(GO:0036444) |
| 0.1 | 0.2 | GO:0048208 | vesicle targeting, rough ER to cis-Golgi(GO:0048207) COPII vesicle coating(GO:0048208) |
| 0.1 | 0.6 | GO:0090503 | RNA phosphodiester bond hydrolysis, exonucleolytic(GO:0090503) |
| 0.1 | 0.2 | GO:0032074 | negative regulation of nuclease activity(GO:0032074) |
| 0.1 | 0.4 | GO:0015074 | DNA integration(GO:0015074) |
| 0.1 | 2.1 | GO:0006367 | transcription initiation from RNA polymerase II promoter(GO:0006367) |
| 0.1 | 0.4 | GO:0030311 | poly-N-acetyllactosamine metabolic process(GO:0030309) poly-N-acetyllactosamine biosynthetic process(GO:0030311) |
| 0.1 | 2.5 | GO:0030433 | ER-associated ubiquitin-dependent protein catabolic process(GO:0030433) |
| 0.1 | 2.2 | GO:0090502 | RNA phosphodiester bond hydrolysis, endonucleolytic(GO:0090502) |
| 0.1 | 6.9 | GO:0042787 | protein ubiquitination involved in ubiquitin-dependent protein catabolic process(GO:0042787) |
| 0.1 | 0.4 | GO:0035900 | response to isolation stress(GO:0035900) |
| 0.1 | 0.1 | GO:0070946 | neutrophil mediated killing of gram-positive bacterium(GO:0070946) |
| 0.1 | 0.1 | GO:1990009 | retinal cell apoptotic process(GO:1990009) |
| 0.1 | 0.3 | GO:0051958 | methotrexate transport(GO:0051958) |
| 0.1 | 0.7 | GO:0032648 | regulation of interferon-beta production(GO:0032648) |
| 0.1 | 0.6 | GO:0070257 | positive regulation of mucus secretion(GO:0070257) |
| 0.1 | 0.7 | GO:0050962 | detection of light stimulus involved in visual perception(GO:0050908) detection of light stimulus involved in sensory perception(GO:0050962) |
| 0.1 | 0.1 | GO:1902952 | positive regulation of dendritic spine maintenance(GO:1902952) |
| 0.1 | 0.4 | GO:0035635 | entry of bacterium into host cell(GO:0035635) regulation of entry of bacterium into host cell(GO:2000535) |
| 0.1 | 0.1 | GO:0006059 | hexitol metabolic process(GO:0006059) |
| 0.1 | 0.9 | GO:0044818 | mitotic G2/M transition checkpoint(GO:0044818) |
| 0.1 | 0.6 | GO:0051028 | mRNA transport(GO:0051028) |
| 0.1 | 0.8 | GO:0006458 | 'de novo' protein folding(GO:0006458) |
| 0.1 | 0.7 | GO:0051281 | positive regulation of release of sequestered calcium ion into cytosol(GO:0051281) |
| 0.1 | 0.4 | GO:0000722 | telomere maintenance via recombination(GO:0000722) |
| 0.1 | 3.9 | GO:0007218 | neuropeptide signaling pathway(GO:0007218) |
| 0.1 | 0.4 | GO:0006977 | DNA damage response, signal transduction by p53 class mediator resulting in cell cycle arrest(GO:0006977) |
| 0.1 | 0.8 | GO:0016574 | histone ubiquitination(GO:0016574) |
| 0.1 | 0.2 | GO:0002727 | natural killer cell cytokine production(GO:0002370) regulation of natural killer cell cytokine production(GO:0002727) |
| 0.1 | 0.1 | GO:0048385 | regulation of retinoic acid receptor signaling pathway(GO:0048385) |
| 0.1 | 0.3 | GO:0021631 | optic nerve morphogenesis(GO:0021631) |
| 0.1 | 0.3 | GO:0034975 | protein folding in endoplasmic reticulum(GO:0034975) |
| 0.1 | 0.3 | GO:0032202 | telomere assembly(GO:0032202) |
| 0.0 | 0.3 | GO:0019441 | tryptophan catabolic process to kynurenine(GO:0019441) |
| 0.0 | 0.7 | GO:0006270 | DNA replication initiation(GO:0006270) |
| 0.0 | 0.5 | GO:0001833 | inner cell mass cell proliferation(GO:0001833) |
| 0.0 | 0.5 | GO:0006084 | acetyl-CoA metabolic process(GO:0006084) |
| 0.0 | 0.8 | GO:0061077 | chaperone-mediated protein folding(GO:0061077) |
| 0.0 | 1.1 | GO:0006405 | RNA export from nucleus(GO:0006405) |
| 0.0 | 0.1 | GO:0030505 | inorganic diphosphate transport(GO:0030505) |
| 0.0 | 0.4 | GO:0072528 | pyrimidine-containing compound biosynthetic process(GO:0072528) |
| 0.0 | 0.0 | GO:1902308 | regulation of peptidyl-serine dephosphorylation(GO:1902308) |
| 0.0 | 0.3 | GO:0009083 | branched-chain amino acid catabolic process(GO:0009083) |
| 0.0 | 0.1 | GO:0014042 | positive regulation of neuron maturation(GO:0014042) |
| 0.0 | 0.0 | GO:0010037 | response to carbon dioxide(GO:0010037) |
| 0.0 | 0.2 | GO:0010972 | negative regulation of G2/M transition of mitotic cell cycle(GO:0010972) |
| 0.0 | 0.4 | GO:0071625 | vocalization behavior(GO:0071625) |
| 0.0 | 0.2 | GO:2000772 | regulation of cellular senescence(GO:2000772) |
| 0.0 | 0.1 | GO:0034773 | histone H4-K20 trimethylation(GO:0034773) |
| 0.0 | 0.1 | GO:0035878 | nail development(GO:0035878) |
Gene overrepresentation in cellular component category:
| Log-likelihood per target | Total log-likelihood | Term | Description |
|---|---|---|---|
| 7.5 | 22.6 | GO:0005592 | collagen type XI trimer(GO:0005592) |
| 5.3 | 16.0 | GO:1990723 | cytoplasmic periphery of the nuclear pore complex(GO:1990723) |
| 5.2 | 20.8 | GO:0072487 | MSL complex(GO:0072487) |
| 4.3 | 34.0 | GO:0005638 | lamin filament(GO:0005638) |
| 4.1 | 16.5 | GO:0097149 | centralspindlin complex(GO:0097149) |
| 4.1 | 28.4 | GO:0005862 | muscle thin filament tropomyosin(GO:0005862) |
| 4.0 | 40.2 | GO:0030891 | VCB complex(GO:0030891) |
| 3.8 | 64.5 | GO:0035686 | sperm fibrous sheath(GO:0035686) |
| 3.7 | 3.7 | GO:0031262 | Ndc80 complex(GO:0031262) |
| 3.2 | 29.1 | GO:0005826 | actomyosin contractile ring(GO:0005826) |
| 3.2 | 93.5 | GO:0005763 | organellar small ribosomal subunit(GO:0000314) mitochondrial small ribosomal subunit(GO:0005763) |
| 3.2 | 76.6 | GO:0001673 | male germ cell nucleus(GO:0001673) |
| 3.2 | 57.0 | GO:0031588 | nucleotide-activated protein kinase complex(GO:0031588) |
| 3.0 | 24.2 | GO:0045261 | mitochondrial proton-transporting ATP synthase complex, catalytic core F(1)(GO:0000275) proton-transporting ATP synthase complex, catalytic core F(1)(GO:0045261) |
| 3.0 | 23.9 | GO:0097452 | GAIT complex(GO:0097452) |
| 2.9 | 11.7 | GO:0000444 | MIS12/MIND type complex(GO:0000444) |
| 2.9 | 8.6 | GO:0002945 | cyclin K-CDK13 complex(GO:0002945) |
| 2.8 | 31.3 | GO:0005750 | mitochondrial respiratory chain complex III(GO:0005750) |
| 2.8 | 36.1 | GO:0000276 | mitochondrial proton-transporting ATP synthase complex, coupling factor F(o)(GO:0000276) |
| 2.8 | 8.3 | GO:0044611 | nuclear pore inner ring(GO:0044611) |
| 2.7 | 8.2 | GO:1990423 | RZZ complex(GO:1990423) |
| 2.7 | 19.1 | GO:0034992 | microtubule organizing center attachment site(GO:0034992) LINC complex(GO:0034993) |
| 2.7 | 13.3 | GO:0000942 | condensed nuclear chromosome outer kinetochore(GO:0000942) |
| 2.6 | 23.2 | GO:0030314 | junctional membrane complex(GO:0030314) |
| 2.5 | 12.7 | GO:0008622 | epsilon DNA polymerase complex(GO:0008622) |
| 2.5 | 19.9 | GO:0016282 | eukaryotic 43S preinitiation complex(GO:0016282) |
| 2.5 | 24.8 | GO:0045254 | pyruvate dehydrogenase complex(GO:0045254) |
| 2.5 | 29.6 | GO:0017101 | aminoacyl-tRNA synthetase multienzyme complex(GO:0017101) |
| 2.4 | 24.3 | GO:0042788 | polysomal ribosome(GO:0042788) |
| 2.4 | 9.7 | GO:0032777 | Piccolo NuA4 histone acetyltransferase complex(GO:0032777) |
| 2.4 | 9.6 | GO:0005971 | ribonucleoside-diphosphate reductase complex(GO:0005971) |
| 2.4 | 19.1 | GO:0005964 | phosphorylase kinase complex(GO:0005964) |
| 2.3 | 119.7 | GO:0005747 | mitochondrial respiratory chain complex I(GO:0005747) NADH dehydrogenase complex(GO:0030964) respiratory chain complex I(GO:0045271) |
| 2.3 | 11.6 | GO:0070937 | CRD-mediated mRNA stability complex(GO:0070937) |
| 2.3 | 6.8 | GO:0097453 | mesaxon(GO:0097453) ensheathing process(GO:1990015) |
| 2.2 | 52.9 | GO:0005839 | proteasome core complex(GO:0005839) |
| 2.2 | 6.5 | GO:0070421 | DNA ligase III-XRCC1 complex(GO:0070421) |
| 2.1 | 8.5 | GO:0005726 | perichromatin fibrils(GO:0005726) |
| 2.0 | 26.6 | GO:0097539 | ciliary transition fiber(GO:0097539) |
| 2.0 | 4.0 | GO:1990923 | PET complex(GO:1990923) |
| 2.0 | 187.1 | GO:0000786 | nucleosome(GO:0000786) |
| 1.9 | 15.4 | GO:0016272 | prefoldin complex(GO:0016272) |
| 1.9 | 110.8 | GO:0000315 | organellar large ribosomal subunit(GO:0000315) mitochondrial large ribosomal subunit(GO:0005762) |
| 1.9 | 14.9 | GO:0000313 | organellar ribosome(GO:0000313) mitochondrial ribosome(GO:0005761) |
| 1.9 | 7.4 | GO:0042585 | germinal vesicle(GO:0042585) |
| 1.8 | 5.4 | GO:0031680 | G-protein beta/gamma-subunit complex(GO:0031680) |
| 1.8 | 34.2 | GO:0033391 | chromatoid body(GO:0033391) |
| 1.8 | 5.3 | GO:0005745 | m-AAA complex(GO:0005745) |
| 1.8 | 10.5 | GO:0071541 | eukaryotic translation initiation factor 3 complex, eIF3m(GO:0071541) |
| 1.8 | 3.5 | GO:0070069 | cytochrome complex(GO:0070069) |
| 1.7 | 25.6 | GO:0034709 | methylosome(GO:0034709) |
| 1.7 | 5.0 | GO:0030956 | glutamyl-tRNA(Gln) amidotransferase complex(GO:0030956) |
| 1.7 | 6.6 | GO:0098574 | cytoplasmic side of lysosomal membrane(GO:0098574) |
| 1.6 | 9.8 | GO:0005672 | transcription factor TFIIA complex(GO:0005672) |
| 1.6 | 3.3 | GO:0043073 | female germ cell nucleus(GO:0001674) germ cell nucleus(GO:0043073) |
| 1.6 | 12.9 | GO:0005753 | mitochondrial proton-transporting ATP synthase complex(GO:0005753) |
| 1.6 | 4.8 | GO:0045257 | mitochondrial respiratory chain complex II, succinate dehydrogenase complex (ubiquinone)(GO:0005749) succinate dehydrogenase complex (ubiquinone)(GO:0045257) fumarate reductase complex(GO:0045283) |
| 1.6 | 4.8 | GO:0032173 | septin collar(GO:0032173) |
| 1.6 | 4.8 | GO:0046691 | intracellular canaliculus(GO:0046691) |
| 1.5 | 4.6 | GO:0097124 | cyclin A2-CDK2 complex(GO:0097124) |
| 1.5 | 18.5 | GO:0005861 | troponin complex(GO:0005861) |
| 1.5 | 12.2 | GO:0031595 | nuclear proteasome complex(GO:0031595) |
| 1.5 | 18.3 | GO:0000801 | central element(GO:0000801) |
| 1.5 | 10.6 | GO:0044815 | DNA packaging complex(GO:0044815) |
| 1.5 | 4.5 | GO:0045242 | mitochondrial isocitrate dehydrogenase complex (NAD+)(GO:0005962) isocitrate dehydrogenase complex (NAD+)(GO:0045242) |
| 1.5 | 9.0 | GO:0032983 | kainate selective glutamate receptor complex(GO:0032983) |
| 1.5 | 1.5 | GO:0005683 | U7 snRNP(GO:0005683) |
| 1.5 | 11.6 | GO:0008541 | proteasome regulatory particle, lid subcomplex(GO:0008541) |
| 1.4 | 10.1 | GO:0071458 | integral component of cytoplasmic side of endoplasmic reticulum membrane(GO:0071458) integral component of lumenal side of endoplasmic reticulum membrane(GO:0071556) lumenal side of endoplasmic reticulum membrane(GO:0098553) |
| 1.4 | 7.0 | GO:0097425 | smooth endoplasmic reticulum membrane(GO:0030868) smooth endoplasmic reticulum part(GO:0097425) |
| 1.4 | 10.9 | GO:0005869 | dynactin complex(GO:0005869) |
| 1.3 | 5.3 | GO:0071204 | histone pre-mRNA 3'end processing complex(GO:0071204) |
| 1.3 | 11.9 | GO:0000808 | origin recognition complex(GO:0000808) nuclear origin of replication recognition complex(GO:0005664) |
| 1.3 | 7.9 | GO:0005852 | eukaryotic translation initiation factor 3 complex(GO:0005852) |
| 1.3 | 67.9 | GO:0000777 | condensed chromosome kinetochore(GO:0000777) |
| 1.3 | 7.8 | GO:0016012 | sarcoglycan complex(GO:0016012) |
| 1.3 | 3.9 | GO:0044307 | dendritic branch(GO:0044307) |
| 1.3 | 3.9 | GO:0098982 | glycine-gated chloride channel complex(GO:0016935) GABA-ergic synapse(GO:0098982) |
| 1.3 | 3.9 | GO:0014801 | longitudinal sarcoplasmic reticulum(GO:0014801) |
| 1.3 | 6.4 | GO:0005652 | nuclear lamina(GO:0005652) |
| 1.3 | 12.7 | GO:0031464 | Cul4A-RING E3 ubiquitin ligase complex(GO:0031464) |
| 1.2 | 7.5 | GO:0005832 | chaperonin-containing T-complex(GO:0005832) |
| 1.2 | 4.9 | GO:0072379 | BAT3 complex(GO:0071818) ER membrane insertion complex(GO:0072379) |
| 1.2 | 4.8 | GO:0070545 | PeBoW complex(GO:0070545) |
| 1.2 | 8.3 | GO:0031415 | NatA complex(GO:0031415) |
| 1.2 | 10.7 | GO:0031390 | Ctf18 RFC-like complex(GO:0031390) |
| 1.2 | 7.1 | GO:1990712 | HFE-transferrin receptor complex(GO:1990712) |
| 1.2 | 4.7 | GO:0099524 | region of cytosol(GO:0099522) postsynaptic cytosol(GO:0099524) |
| 1.2 | 3.5 | GO:1990429 | Pex17p-Pex14p docking complex(GO:1990415) peroxisomal importomer complex(GO:1990429) |
| 1.2 | 5.9 | GO:0043625 | delta DNA polymerase complex(GO:0043625) |
| 1.2 | 13.9 | GO:0002199 | zona pellucida receptor complex(GO:0002199) |
| 1.2 | 12.7 | GO:0000177 | cytoplasmic exosome (RNase complex)(GO:0000177) |
| 1.1 | 6.8 | GO:0030896 | checkpoint clamp complex(GO:0030896) |
| 1.1 | 29.4 | GO:0002080 | acrosomal membrane(GO:0002080) |
| 1.1 | 11.3 | GO:0005916 | fascia adherens(GO:0005916) |
| 1.1 | 3.4 | GO:0097058 | CRLF-CLCF1 complex(GO:0097058) |
| 1.1 | 13.4 | GO:1990454 | L-type voltage-gated calcium channel complex(GO:1990454) |
| 1.1 | 4.5 | GO:0035985 | senescence-associated heterochromatin focus(GO:0035985) |
| 1.1 | 6.7 | GO:0070847 | core mediator complex(GO:0070847) |
| 1.1 | 2.2 | GO:1990730 | VCP-NSFL1C complex(GO:1990730) |
| 1.1 | 5.4 | GO:0033063 | Rad51B-Rad51C-Rad51D-XRCC2 complex(GO:0033063) |
| 1.1 | 9.7 | GO:0008024 | cyclin/CDK positive transcription elongation factor complex(GO:0008024) |
| 1.1 | 8.6 | GO:0072669 | tRNA-splicing ligase complex(GO:0072669) |
| 1.1 | 28.0 | GO:0005844 | polysome(GO:0005844) |
| 1.1 | 27.8 | GO:0033017 | sarcoplasmic reticulum membrane(GO:0033017) |
| 1.0 | 8.3 | GO:0005786 | signal recognition particle, endoplasmic reticulum targeting(GO:0005786) |
| 1.0 | 14.4 | GO:0032982 | myosin filament(GO:0032982) |
| 1.0 | 11.4 | GO:0034719 | SMN-Sm protein complex(GO:0034719) |
| 1.0 | 6.2 | GO:0005655 | nucleolar ribonuclease P complex(GO:0005655) ribonuclease P complex(GO:0030677) multimeric ribonuclease P complex(GO:0030681) |
| 1.0 | 2.0 | GO:1990257 | piccolo-bassoon transport vesicle(GO:1990257) |
| 1.0 | 1.0 | GO:0099569 | presynaptic cytoskeleton(GO:0099569) |
| 1.0 | 18.3 | GO:0016529 | sarcoplasmic reticulum(GO:0016529) |
| 1.0 | 8.1 | GO:0060293 | P granule(GO:0043186) pole plasm(GO:0045495) germ plasm(GO:0060293) |
| 1.0 | 4.0 | GO:0043564 | Ku70:Ku80 complex(GO:0043564) |
| 1.0 | 5.0 | GO:1903349 | omegasome membrane(GO:1903349) omegasome(GO:1990462) |
| 1.0 | 3.0 | GO:0000839 | Hrd1p ubiquitin ligase ERAD-L complex(GO:0000839) |
| 1.0 | 5.0 | GO:0098536 | deuterosome(GO:0098536) |
| 1.0 | 1.0 | GO:0030870 | Mre11 complex(GO:0030870) |
| 1.0 | 18.6 | GO:0010369 | chromocenter(GO:0010369) |
| 1.0 | 3.9 | GO:0044299 | C-fiber(GO:0044299) |
| 1.0 | 5.9 | GO:0005850 | eukaryotic translation initiation factor 2 complex(GO:0005850) |
| 1.0 | 5.8 | GO:0030877 | beta-catenin destruction complex(GO:0030877) |
| 1.0 | 89.0 | GO:0022625 | cytosolic large ribosomal subunit(GO:0022625) |
| 1.0 | 1.0 | GO:0071001 | U4/U6 snRNP(GO:0071001) |
| 1.0 | 15.5 | GO:0005666 | DNA-directed RNA polymerase III complex(GO:0005666) |
| 1.0 | 47.3 | GO:0042645 | nucleoid(GO:0009295) mitochondrial nucleoid(GO:0042645) |
| 1.0 | 3.8 | GO:0031417 | NatC complex(GO:0031417) |
| 0.9 | 3.8 | GO:0001940 | male pronucleus(GO:0001940) |
| 0.9 | 2.8 | GO:0034457 | Mpp10 complex(GO:0034457) |
| 0.9 | 3.8 | GO:0043541 | UDP-N-acetylglucosamine transferase complex(GO:0043541) |
| 0.9 | 100.7 | GO:0001669 | acrosomal vesicle(GO:0001669) |
| 0.9 | 5.6 | GO:0036128 | CatSper complex(GO:0036128) |
| 0.9 | 5.6 | GO:0036449 | microtubule minus-end(GO:0036449) |
| 0.9 | 18.6 | GO:0005892 | acetylcholine-gated channel complex(GO:0005892) |
| 0.9 | 5.6 | GO:0005851 | eukaryotic translation initiation factor 2B complex(GO:0005851) |
| 0.9 | 12.9 | GO:0032426 | stereocilium tip(GO:0032426) |
| 0.9 | 120.0 | GO:0005840 | ribosome(GO:0005840) |
| 0.9 | 2.7 | GO:0032301 | MutSalpha complex(GO:0032301) |
| 0.9 | 3.6 | GO:0031436 | BRCA1-BARD1 complex(GO:0031436) |
| 0.9 | 2.7 | GO:0031372 | UBC13-MMS2 complex(GO:0031372) |
| 0.9 | 9.7 | GO:0030688 | preribosome, small subunit precursor(GO:0030688) |
| 0.9 | 8.8 | GO:0005744 | mitochondrial inner membrane presequence translocase complex(GO:0005744) |
| 0.9 | 7.8 | GO:0036513 | Derlin-1 retrotranslocation complex(GO:0036513) |
| 0.9 | 2.6 | GO:0031510 | SUMO activating enzyme complex(GO:0031510) |
| 0.9 | 12.1 | GO:0005732 | small nucleolar ribonucleoprotein complex(GO:0005732) |
| 0.9 | 6.0 | GO:0002177 | manchette(GO:0002177) |
| 0.8 | 7.4 | GO:0000439 | core TFIIH complex(GO:0000439) |
| 0.8 | 2.5 | GO:0089717 | spanning component of plasma membrane(GO:0044214) spanning component of membrane(GO:0089717) |
| 0.8 | 9.0 | GO:0017071 | intracellular cyclic nucleotide activated cation channel complex(GO:0017071) |
| 0.8 | 3.2 | GO:0005859 | muscle myosin complex(GO:0005859) |
| 0.8 | 4.0 | GO:0097361 | CIA complex(GO:0097361) |
| 0.8 | 3.2 | GO:0032044 | DSIF complex(GO:0032044) |
| 0.8 | 3.1 | GO:0005956 | protein kinase CK2 complex(GO:0005956) |
| 0.8 | 5.5 | GO:0072687 | meiotic spindle(GO:0072687) |
| 0.8 | 6.2 | GO:0030915 | Smc5-Smc6 complex(GO:0030915) |
| 0.8 | 3.1 | GO:0031597 | cytosolic proteasome complex(GO:0031597) |
| 0.8 | 18.5 | GO:0031304 | intrinsic component of mitochondrial inner membrane(GO:0031304) integral component of mitochondrial inner membrane(GO:0031305) |
| 0.8 | 16.1 | GO:0000795 | synaptonemal complex(GO:0000795) |
| 0.8 | 3.1 | GO:1990075 | periciliary membrane compartment(GO:1990075) |
| 0.8 | 2.3 | GO:0031205 | endoplasmic reticulum Sec complex(GO:0031205) |
| 0.8 | 3.8 | GO:1990726 | Lsm1-7-Pat1 complex(GO:1990726) |
| 0.8 | 6.8 | GO:0044613 | nuclear pore central transport channel(GO:0044613) |
| 0.7 | 4.5 | GO:0005736 | DNA-directed RNA polymerase I complex(GO:0005736) |
| 0.7 | 35.0 | GO:0005637 | nuclear inner membrane(GO:0005637) |
| 0.7 | 3.0 | GO:0070436 | Grb2-EGFR complex(GO:0070436) |
| 0.7 | 10.2 | GO:0035253 | ciliary rootlet(GO:0035253) |
| 0.7 | 2.1 | GO:0044609 | DBIRD complex(GO:0044609) |
| 0.7 | 96.8 | GO:0031674 | I band(GO:0031674) |
| 0.7 | 17.9 | GO:0005891 | voltage-gated calcium channel complex(GO:0005891) |
| 0.7 | 4.1 | GO:0032280 | symmetric synapse(GO:0032280) |
| 0.7 | 2.7 | GO:0043203 | axon hillock(GO:0043203) |
| 0.7 | 6.0 | GO:0072357 | PTW/PP1 phosphatase complex(GO:0072357) |
| 0.7 | 34.0 | GO:0000776 | kinetochore(GO:0000776) |
| 0.6 | 3.9 | GO:0042567 | insulin-like growth factor ternary complex(GO:0042567) |
| 0.6 | 2.6 | GO:0032299 | ribonuclease H2 complex(GO:0032299) |
| 0.6 | 3.8 | GO:0002139 | stereocilia coupling link(GO:0002139) |
| 0.6 | 8.8 | GO:0035098 | ESC/E(Z) complex(GO:0035098) |
| 0.6 | 20.2 | GO:0000502 | proteasome complex(GO:0000502) |
| 0.6 | 3.1 | GO:0060205 | cytoplasmic membrane-bounded vesicle lumen(GO:0060205) |
| 0.6 | 4.3 | GO:0061700 | GATOR2 complex(GO:0061700) |
| 0.6 | 6.7 | GO:0046581 | intercellular canaliculus(GO:0046581) |
| 0.6 | 7.9 | GO:0098799 | outer mitochondrial membrane protein complex(GO:0098799) |
| 0.6 | 15.6 | GO:0035861 | site of double-strand break(GO:0035861) |
| 0.6 | 1.8 | GO:0005853 | eukaryotic translation elongation factor 1 complex(GO:0005853) |
| 0.6 | 19.8 | GO:0008180 | COP9 signalosome(GO:0008180) |
| 0.6 | 3.0 | GO:0031462 | Cul2-RING ubiquitin ligase complex(GO:0031462) |
| 0.6 | 1.8 | GO:0033165 | interphotoreceptor matrix(GO:0033165) |
| 0.6 | 2.4 | GO:0031466 | Cul5-RING ubiquitin ligase complex(GO:0031466) |
| 0.6 | 3.0 | GO:0042719 | mitochondrial intermembrane space protein transporter complex(GO:0042719) |
| 0.6 | 9.4 | GO:0080008 | Cul4-RING E3 ubiquitin ligase complex(GO:0080008) |
| 0.6 | 22.2 | GO:0005643 | nuclear pore(GO:0005643) |
| 0.6 | 3.5 | GO:0098831 | presynaptic active zone cytoplasmic component(GO:0098831) |
| 0.6 | 9.9 | GO:0097228 | sperm principal piece(GO:0097228) |
| 0.6 | 1.7 | GO:0005960 | glycine cleavage complex(GO:0005960) |
| 0.6 | 6.2 | GO:0001527 | microfibril(GO:0001527) fibril(GO:0043205) |
| 0.6 | 39.8 | GO:0045095 | keratin filament(GO:0045095) |
| 0.6 | 1.1 | GO:0070939 | Dsl1p complex(GO:0070939) |
| 0.6 | 1.7 | GO:0061574 | ASAP complex(GO:0061574) |
| 0.6 | 3.3 | GO:0070531 | BRCA1-A complex(GO:0070531) |
| 0.6 | 3.9 | GO:0005827 | polar microtubule(GO:0005827) |
| 0.5 | 6.6 | GO:0008385 | IkappaB kinase complex(GO:0008385) |
| 0.5 | 1.6 | GO:0031515 | tRNA (m1A) methyltransferase complex(GO:0031515) |
| 0.5 | 0.5 | GO:0070032 | synaptobrevin 2-SNAP-25-syntaxin-1a-complexin I complex(GO:0070032) |
| 0.5 | 2.2 | GO:0035748 | myelin sheath abaxonal region(GO:0035748) |
| 0.5 | 3.7 | GO:0016602 | CCAAT-binding factor complex(GO:0016602) |
| 0.5 | 7.4 | GO:0005665 | DNA-directed RNA polymerase II, core complex(GO:0005665) |
| 0.5 | 1.1 | GO:0043527 | tRNA methyltransferase complex(GO:0043527) |
| 0.5 | 3.1 | GO:0000322 | storage vacuole(GO:0000322) |
| 0.5 | 16.0 | GO:0014704 | intercalated disc(GO:0014704) |
| 0.5 | 1.5 | GO:0016533 | cyclin-dependent protein kinase 5 holoenzyme complex(GO:0016533) |
| 0.5 | 5.0 | GO:0031232 | extrinsic component of external side of plasma membrane(GO:0031232) |
| 0.5 | 1.0 | GO:0070449 | elongin complex(GO:0070449) |
| 0.5 | 7.6 | GO:0033270 | paranode region of axon(GO:0033270) |
| 0.5 | 3.7 | GO:0019908 | nuclear cyclin-dependent protein kinase holoenzyme complex(GO:0019908) |
| 0.5 | 2.8 | GO:0005865 | striated muscle thin filament(GO:0005865) |
| 0.5 | 2.7 | GO:0097422 | tubular endosome(GO:0097422) |
| 0.5 | 1.4 | GO:0042405 | nuclear inclusion body(GO:0042405) |
| 0.5 | 1.4 | GO:0031074 | nucleocytoplasmic shuttling complex(GO:0031074) |
| 0.4 | 4.9 | GO:0001520 | outer dense fiber(GO:0001520) |
| 0.4 | 4.0 | GO:0048787 | presynaptic active zone membrane(GO:0048787) |
| 0.4 | 4.9 | GO:0071564 | npBAF complex(GO:0071564) |
| 0.4 | 2.2 | GO:0070195 | growth hormone receptor complex(GO:0070195) |
| 0.4 | 3.4 | GO:0070938 | contractile ring(GO:0070938) |
| 0.4 | 3.8 | GO:0071821 | FANCM-MHF complex(GO:0071821) |
| 0.4 | 1.7 | GO:0002947 | tumor necrosis factor receptor superfamily complex(GO:0002947) |
| 0.4 | 3.8 | GO:0005697 | telomerase holoenzyme complex(GO:0005697) |
| 0.4 | 2.1 | GO:0090543 | Flemming body(GO:0090543) |
| 0.4 | 12.2 | GO:0070469 | respiratory chain(GO:0070469) |
| 0.4 | 7.1 | GO:0030061 | mitochondrial crista(GO:0030061) |
| 0.4 | 10.7 | GO:0000159 | protein phosphatase type 2A complex(GO:0000159) |
| 0.4 | 14.0 | GO:0000775 | chromosome, centromeric region(GO:0000775) |
| 0.4 | 2.0 | GO:0070695 | FHF complex(GO:0070695) |
| 0.4 | 7.8 | GO:0070971 | endoplasmic reticulum exit site(GO:0070971) |
| 0.4 | 4.2 | GO:0016580 | Sin3 complex(GO:0016580) |
| 0.4 | 1.9 | GO:0042575 | DNA polymerase complex(GO:0042575) |
| 0.4 | 3.1 | GO:0001741 | XY body(GO:0001741) |
| 0.4 | 19.7 | GO:0005758 | mitochondrial intermembrane space(GO:0005758) |
| 0.4 | 15.0 | GO:0015030 | Cajal body(GO:0015030) |
| 0.4 | 2.2 | GO:0030062 | mitochondrial tricarboxylic acid cycle enzyme complex(GO:0030062) |
| 0.4 | 1.8 | GO:1990452 | Parkin-FBXW7-Cul1 ubiquitin ligase complex(GO:1990452) |
| 0.4 | 4.8 | GO:0044666 | MLL3/4 complex(GO:0044666) |
| 0.4 | 32.6 | GO:0005814 | centriole(GO:0005814) |
| 0.4 | 12.2 | GO:0016235 | aggresome(GO:0016235) |
| 0.4 | 0.4 | GO:0000805 | X chromosome(GO:0000805) |
| 0.4 | 1.1 | GO:0098855 | HCN channel complex(GO:0098855) |
| 0.3 | 3.5 | GO:0097431 | mitotic spindle pole(GO:0097431) |
| 0.3 | 1.4 | GO:1990005 | granular vesicle(GO:1990005) |
| 0.3 | 3.5 | GO:0000445 | THO complex(GO:0000347) THO complex part of transcription export complex(GO:0000445) |
| 0.3 | 7.8 | GO:0034364 | high-density lipoprotein particle(GO:0034364) |
| 0.3 | 5.6 | GO:0031306 | intrinsic component of mitochondrial outer membrane(GO:0031306) |
| 0.3 | 4.3 | GO:0033276 | transcription factor TFTC complex(GO:0033276) |
| 0.3 | 2.3 | GO:0005890 | sodium:potassium-exchanging ATPase complex(GO:0005890) |
| 0.3 | 43.7 | GO:0005759 | mitochondrial matrix(GO:0005759) |
| 0.3 | 1.0 | GO:0046540 | U4/U6 x U5 tri-snRNP complex(GO:0046540) |
| 0.3 | 9.1 | GO:0005876 | spindle microtubule(GO:0005876) |
| 0.3 | 3.1 | GO:0070652 | HAUS complex(GO:0070652) |
| 0.3 | 7.6 | GO:0008074 | guanylate cyclase complex, soluble(GO:0008074) |
| 0.3 | 0.9 | GO:0055087 | Ski complex(GO:0055087) |
| 0.3 | 1.4 | GO:1903767 | sweet taste receptor complex(GO:1903767) taste receptor complex(GO:1903768) |
| 0.3 | 0.9 | GO:0098830 | presynaptic endosome(GO:0098830) |
| 0.3 | 0.3 | GO:0032797 | SMN complex(GO:0032797) |
| 0.3 | 4.5 | GO:0016528 | sarcoplasm(GO:0016528) |
| 0.3 | 1.1 | GO:0020018 | ciliary pocket(GO:0020016) ciliary pocket membrane(GO:0020018) |
| 0.3 | 1.3 | GO:0016593 | Cdc73/Paf1 complex(GO:0016593) |
| 0.3 | 1.3 | GO:0000015 | phosphopyruvate hydratase complex(GO:0000015) |
| 0.3 | 1.3 | GO:0034455 | t-UTP complex(GO:0034455) |
| 0.3 | 2.3 | GO:0032593 | insulin-responsive compartment(GO:0032593) |
| 0.3 | 1.0 | GO:0031616 | spindle pole centrosome(GO:0031616) |
| 0.3 | 1.3 | GO:0071203 | WASH complex(GO:0071203) |
| 0.2 | 3.0 | GO:0034518 | mRNA cap binding complex(GO:0005845) RNA cap binding complex(GO:0034518) |
| 0.2 | 9.8 | GO:0016592 | mediator complex(GO:0016592) |
| 0.2 | 1.2 | GO:0070419 | nonhomologous end joining complex(GO:0070419) |
| 0.2 | 3.1 | GO:0005682 | U5 snRNP(GO:0005682) |
| 0.2 | 5.3 | GO:0005720 | nuclear heterochromatin(GO:0005720) |
| 0.2 | 1.1 | GO:0043293 | apoptosome(GO:0043293) |
| 0.2 | 3.4 | GO:0035267 | NuA4 histone acetyltransferase complex(GO:0035267) H4/H2A histone acetyltransferase complex(GO:0043189) H4 histone acetyltransferase complex(GO:1902562) |
| 0.2 | 1.1 | GO:0072534 | perineuronal net(GO:0072534) |
| 0.2 | 4.4 | GO:0030687 | preribosome, large subunit precursor(GO:0030687) |
| 0.2 | 1.3 | GO:0034388 | Pwp2p-containing subcomplex of 90S preribosome(GO:0034388) |
| 0.2 | 46.2 | GO:0000151 | ubiquitin ligase complex(GO:0000151) |
| 0.2 | 1.5 | GO:0070775 | H3 histone acetyltransferase complex(GO:0070775) MOZ/MORF histone acetyltransferase complex(GO:0070776) |
| 0.2 | 1.0 | GO:0030015 | CCR4-NOT core complex(GO:0030015) |
| 0.2 | 1.6 | GO:0097550 | transcriptional preinitiation complex(GO:0097550) |
| 0.2 | 3.8 | GO:0005922 | connexon complex(GO:0005922) |
| 0.2 | 0.6 | GO:0043190 | ATP-binding cassette (ABC) transporter complex(GO:0043190) |
| 0.2 | 0.6 | GO:0098837 | postsynaptic recycling endosome(GO:0098837) |
| 0.2 | 1.5 | GO:0045179 | apical cortex(GO:0045179) |
| 0.2 | 5.5 | GO:0005871 | kinesin complex(GO:0005871) |
| 0.2 | 1.3 | GO:0005658 | alpha DNA polymerase:primase complex(GO:0005658) |
| 0.2 | 1.4 | GO:0042105 | alpha-beta T cell receptor complex(GO:0042105) |
| 0.2 | 9.5 | GO:0031903 | peroxisomal membrane(GO:0005778) microbody membrane(GO:0031903) |
| 0.2 | 32.4 | GO:0005743 | mitochondrial inner membrane(GO:0005743) |
| 0.2 | 2.8 | GO:0032839 | dendrite cytoplasm(GO:0032839) |
| 0.2 | 1.3 | GO:0008290 | F-actin capping protein complex(GO:0008290) |
| 0.2 | 0.3 | GO:0070557 | PCNA-p21 complex(GO:0070557) |
| 0.2 | 0.6 | GO:0000243 | commitment complex(GO:0000243) |
| 0.1 | 1.8 | GO:0030014 | CCR4-NOT complex(GO:0030014) |
| 0.1 | 3.4 | GO:0000793 | condensed chromosome(GO:0000793) |
| 0.1 | 0.6 | GO:0016514 | SWI/SNF complex(GO:0016514) |
| 0.1 | 1.4 | GO:0000930 | gamma-tubulin complex(GO:0000930) |
| 0.1 | 0.9 | GO:0031931 | TORC1 complex(GO:0031931) |
| 0.1 | 0.8 | GO:0090544 | BAF-type complex(GO:0090544) |
| 0.1 | 1.6 | GO:0031519 | PcG protein complex(GO:0031519) |
| 0.1 | 2.4 | GO:0048786 | presynaptic active zone(GO:0048786) |
| 0.1 | 1.0 | GO:0031083 | BLOC-1 complex(GO:0031083) |
| 0.1 | 0.4 | GO:0005927 | muscle tendon junction(GO:0005927) |
| 0.1 | 2.3 | GO:1903293 | protein serine/threonine phosphatase complex(GO:0008287) phosphatase complex(GO:1903293) |
| 0.1 | 2.6 | GO:0060077 | inhibitory synapse(GO:0060077) |
| 0.1 | 5.6 | GO:0005882 | intermediate filament(GO:0005882) |
| 0.1 | 1.5 | GO:0017146 | NMDA selective glutamate receptor complex(GO:0017146) |
| 0.1 | 1.7 | GO:0032039 | integrator complex(GO:0032039) |
| 0.1 | 0.2 | GO:0071006 | U2-type catalytic step 1 spliceosome(GO:0071006) |
| 0.1 | 0.6 | GO:1990635 | proximal dendrite(GO:1990635) |
| 0.1 | 5.5 | GO:0017053 | transcriptional repressor complex(GO:0017053) |
| 0.1 | 1.8 | GO:1902711 | GABA-A receptor complex(GO:1902711) |
| 0.1 | 5.7 | GO:0099501 | synaptic vesicle membrane(GO:0030672) exocytic vesicle membrane(GO:0099501) |
| 0.1 | 1.6 | GO:0030880 | DNA-directed RNA polymerase complex(GO:0000428) RNA polymerase complex(GO:0030880) nuclear DNA-directed RNA polymerase complex(GO:0055029) |
| 0.1 | 0.3 | GO:0046696 | lipopolysaccharide receptor complex(GO:0046696) |
| 0.1 | 2.9 | GO:0001917 | photoreceptor inner segment(GO:0001917) |
| 0.1 | 3.1 | GO:0030016 | myofibril(GO:0030016) |
| 0.1 | 0.6 | GO:0031011 | Ino80 complex(GO:0031011) DNA helicase complex(GO:0033202) |
| 0.1 | 0.5 | GO:0031970 | organelle envelope lumen(GO:0031970) |
| 0.1 | 3.3 | GO:0000781 | chromosome, telomeric region(GO:0000781) |
| 0.1 | 0.4 | GO:0071986 | Ragulator complex(GO:0071986) |
| 0.1 | 0.4 | GO:0016600 | flotillin complex(GO:0016600) |
| 0.1 | 0.3 | GO:0000120 | RNA polymerase I transcription factor complex(GO:0000120) |
| 0.1 | 0.2 | GO:0097524 | sperm plasma membrane(GO:0097524) |
| 0.0 | 0.5 | GO:0032040 | small-subunit processome(GO:0032040) |
| 0.0 | 0.4 | GO:0043292 | contractile fiber(GO:0043292) |
| 0.0 | 0.2 | GO:0089701 | U2AF(GO:0089701) |
| 0.0 | 1.0 | GO:0034707 | chloride channel complex(GO:0034707) |
| 0.0 | 0.2 | GO:0030914 | STAGA complex(GO:0030914) |
| 0.0 | 0.2 | GO:0033269 | internode region of axon(GO:0033269) |
| 0.0 | 0.2 | GO:0002189 | ribose phosphate diphosphokinase complex(GO:0002189) |
| 0.0 | 1.3 | GO:0045171 | intercellular bridge(GO:0045171) |
| 0.0 | 0.2 | GO:0030123 | AP-3 adaptor complex(GO:0030123) |
| 0.0 | 0.4 | GO:0010494 | cytoplasmic stress granule(GO:0010494) |
Gene overrepresentation in molecular function category:
| Log-likelihood per target | Total log-likelihood | Term | Description |
|---|---|---|---|
| 13.4 | 40.3 | GO:0004807 | triose-phosphate isomerase activity(GO:0004807) |
| 7.5 | 22.6 | GO:0047783 | steroid 11-beta-monooxygenase activity(GO:0004507) corticosterone 18-monooxygenase activity(GO:0047783) |
| 6.1 | 18.4 | GO:0005294 | neutral L-amino acid secondary active transmembrane transporter activity(GO:0005294) |
| 6.1 | 24.5 | GO:0046538 | bisphosphoglycerate mutase activity(GO:0004082) phosphoglycerate mutase activity(GO:0004619) 2,3-bisphosphoglycerate-dependent phosphoglycerate mutase activity(GO:0046538) |
| 6.1 | 18.3 | GO:0071885 | N-terminal protein N-methyltransferase activity(GO:0071885) |
| 5.8 | 17.5 | GO:0004618 | phosphoglycerate kinase activity(GO:0004618) |
| 5.2 | 15.6 | GO:0086057 | voltage-gated calcium channel activity involved in bundle of His cell action potential(GO:0086057) |
| 5.0 | 15.1 | GO:0031752 | D5 dopamine receptor binding(GO:0031752) |
| 4.9 | 19.4 | GO:0004365 | glyceraldehyde-3-phosphate dehydrogenase (NAD+) (phosphorylating) activity(GO:0004365) glyceraldehyde-3-phosphate dehydrogenase (NAD(P)+) (phosphorylating) activity(GO:0043891) |
| 4.6 | 18.4 | GO:0005219 | ryanodine-sensitive calcium-release channel activity(GO:0005219) |
| 4.5 | 27.2 | GO:0098519 | nucleotide phosphatase activity, acting on free nucleotides(GO:0098519) |
| 4.5 | 13.5 | GO:0016520 | growth hormone-releasing hormone receptor activity(GO:0016520) |
| 4.2 | 16.9 | GO:0004739 | pyruvate dehydrogenase (acetyl-transferring) activity(GO:0004739) |
| 4.0 | 11.9 | GO:0033222 | xylose binding(GO:0033222) |
| 3.8 | 11.3 | GO:0004069 | L-aspartate:2-oxoglutarate aminotransferase activity(GO:0004069) |
| 3.7 | 51.7 | GO:0031432 | titin binding(GO:0031432) |
| 3.7 | 18.4 | GO:0032795 | heterotrimeric G-protein binding(GO:0032795) |
| 3.7 | 54.9 | GO:0004679 | AMP-activated protein kinase activity(GO:0004679) |
| 3.6 | 14.2 | GO:0061665 | SUMO ligase activity(GO:0061665) |
| 3.5 | 10.6 | GO:0004946 | bombesin receptor activity(GO:0004946) |
| 3.3 | 13.3 | GO:0050682 | AF-2 domain binding(GO:0050682) |
| 3.3 | 13.3 | GO:0033149 | FFAT motif binding(GO:0033149) |
| 3.3 | 16.6 | GO:0004969 | histamine receptor activity(GO:0004969) |
| 3.3 | 23.1 | GO:0097322 | 7SK snRNA binding(GO:0097322) |
| 3.3 | 13.2 | GO:0004743 | pyruvate kinase activity(GO:0004743) |
| 3.2 | 9.7 | GO:0047025 | 3-oxoacyl-[acyl-carrier-protein] reductase (NADH) activity(GO:0047025) |
| 3.1 | 9.3 | GO:0034211 | GTP-dependent protein kinase activity(GO:0034211) |
| 3.0 | 11.9 | GO:0004459 | L-lactate dehydrogenase activity(GO:0004459) |
| 3.0 | 8.9 | GO:0004827 | proline-tRNA ligase activity(GO:0004827) |
| 2.8 | 14.2 | GO:0004105 | choline-phosphate cytidylyltransferase activity(GO:0004105) |
| 2.8 | 8.5 | GO:0004775 | succinate-CoA ligase activity(GO:0004774) succinate-CoA ligase (ADP-forming) activity(GO:0004775) |
| 2.8 | 25.3 | GO:0008494 | translation activator activity(GO:0008494) |
| 2.8 | 11.2 | GO:0004719 | protein-L-isoaspartate (D-aspartate) O-methyltransferase activity(GO:0004719) |
| 2.8 | 16.7 | GO:0004126 | cytidine deaminase activity(GO:0004126) |
| 2.7 | 8.1 | GO:0031531 | thyrotropin-releasing hormone receptor binding(GO:0031531) |
| 2.6 | 18.3 | GO:0004332 | fructose-bisphosphate aldolase activity(GO:0004332) |
| 2.6 | 10.3 | GO:0061575 | cyclin-dependent protein serine/threonine kinase activator activity(GO:0061575) |
| 2.6 | 10.3 | GO:0005087 | Ran guanyl-nucleotide exchange factor activity(GO:0005087) |
| 2.6 | 7.7 | GO:0001716 | L-amino-acid oxidase activity(GO:0001716) |
| 2.5 | 10.1 | GO:0070883 | pre-miRNA binding(GO:0070883) |
| 2.5 | 15.0 | GO:0061731 | ribonucleoside-diphosphate reductase activity, thioredoxin disulfide as acceptor(GO:0004748) oxidoreductase activity, acting on CH or CH2 groups, disulfide as acceptor(GO:0016728) ribonucleoside-diphosphate reductase activity(GO:0061731) |
| 2.5 | 70.1 | GO:0003954 | NADH dehydrogenase activity(GO:0003954) |
| 2.5 | 7.5 | GO:0032427 | GBD domain binding(GO:0032427) |
| 2.4 | 4.7 | GO:0015616 | DNA translocase activity(GO:0015616) |
| 2.3 | 62.1 | GO:0070003 | threonine-type endopeptidase activity(GO:0004298) threonine-type peptidase activity(GO:0070003) |
| 2.3 | 6.8 | GO:0031728 | CCR3 chemokine receptor binding(GO:0031728) |
| 2.2 | 13.5 | GO:0004340 | glucokinase activity(GO:0004340) hexokinase activity(GO:0004396) fructokinase activity(GO:0008865) mannokinase activity(GO:0019158) |
| 2.2 | 11.2 | GO:0043532 | angiostatin binding(GO:0043532) |
| 2.2 | 6.7 | GO:0008948 | oxaloacetate decarboxylase activity(GO:0008948) |
| 2.2 | 19.7 | GO:0001591 | dopamine neurotransmitter receptor activity, coupled via Gi/Go(GO:0001591) |
| 2.2 | 17.5 | GO:0016413 | O-acetyltransferase activity(GO:0016413) |
| 2.2 | 8.7 | GO:0004949 | cannabinoid receptor activity(GO:0004949) |
| 2.2 | 8.7 | GO:0016647 | oxidoreductase activity, acting on the CH-NH group of donors, oxygen as acceptor(GO:0016647) |
| 2.1 | 6.4 | GO:0000033 | alpha-1,3-mannosyltransferase activity(GO:0000033) |
| 2.1 | 8.5 | GO:0032190 | acrosin binding(GO:0032190) |
| 2.1 | 6.2 | GO:0031127 | galactoside 2-alpha-L-fucosyltransferase activity(GO:0008107) alpha-(1,2)-fucosyltransferase activity(GO:0031127) |
| 2.0 | 6.1 | GO:0004392 | heme oxygenase (decyclizing) activity(GO:0004392) |
| 2.0 | 10.1 | GO:0071987 | WD40-repeat domain binding(GO:0071987) |
| 2.0 | 10.0 | GO:0004849 | uridine kinase activity(GO:0004849) |
| 2.0 | 7.9 | GO:0004738 | pyruvate dehydrogenase activity(GO:0004738) pyruvate dehydrogenase [NAD(P)+] activity(GO:0034603) pyruvate dehydrogenase (NAD+) activity(GO:0034604) |
| 1.9 | 9.7 | GO:0005550 | pheromone binding(GO:0005550) |
| 1.9 | 7.6 | GO:0015137 | citrate transmembrane transporter activity(GO:0015137) |
| 1.9 | 5.6 | GO:0097677 | STAT family protein binding(GO:0097677) |
| 1.9 | 14.9 | GO:0016681 | ubiquinol-cytochrome-c reductase activity(GO:0008121) oxidoreductase activity, acting on diphenols and related substances as donors, cytochrome as acceptor(GO:0016681) |
| 1.9 | 5.6 | GO:0034057 | RNA strand-exchange activity(GO:0034057) |
| 1.8 | 60.5 | GO:0061631 | ubiquitin conjugating enzyme activity(GO:0061631) |
| 1.8 | 5.4 | GO:0004769 | steroid delta-isomerase activity(GO:0004769) |
| 1.8 | 10.8 | GO:0008508 | bile acid:sodium symporter activity(GO:0008508) |
| 1.8 | 5.3 | GO:0032296 | ribonuclease III activity(GO:0004525) double-stranded RNA-specific ribonuclease activity(GO:0032296) |
| 1.8 | 12.4 | GO:0051575 | 5'-deoxyribose-5-phosphate lyase activity(GO:0051575) |
| 1.8 | 10.6 | GO:0070181 | small ribosomal subunit rRNA binding(GO:0070181) |
| 1.7 | 8.7 | GO:0004558 | alpha-1,4-glucosidase activity(GO:0004558) |
| 1.7 | 6.8 | GO:0004723 | calcium-dependent protein serine/threonine phosphatase activity(GO:0004723) calmodulin-dependent protein phosphatase activity(GO:0033192) |
| 1.7 | 3.4 | GO:0005280 | hydrogen:amino acid symporter activity(GO:0005280) |
| 1.7 | 5.0 | GO:0050567 | glutaminyl-tRNA synthase (glutamine-hydrolyzing) activity(GO:0050567) |
| 1.7 | 8.4 | GO:0050833 | pyruvate transmembrane transporter activity(GO:0050833) |
| 1.6 | 9.8 | GO:0047134 | protein-disulfide reductase activity(GO:0047134) |
| 1.6 | 8.2 | GO:0004517 | nitric-oxide synthase activity(GO:0004517) |
| 1.6 | 29.3 | GO:0046933 | proton-transporting ATP synthase activity, rotational mechanism(GO:0046933) |
| 1.6 | 9.8 | GO:0009008 | DNA-methyltransferase activity(GO:0009008) |
| 1.6 | 26.0 | GO:0008143 | poly(A) binding(GO:0008143) |
| 1.6 | 21.1 | GO:0008649 | rRNA methyltransferase activity(GO:0008649) |
| 1.6 | 14.6 | GO:0043024 | ribosomal small subunit binding(GO:0043024) |
| 1.6 | 14.6 | GO:0003909 | DNA ligase activity(GO:0003909) DNA ligase (ATP) activity(GO:0003910) |
| 1.6 | 4.8 | GO:0008177 | succinate dehydrogenase (ubiquinone) activity(GO:0008177) |
| 1.6 | 9.6 | GO:0015173 | aromatic amino acid transmembrane transporter activity(GO:0015173) |
| 1.6 | 14.4 | GO:0008440 | inositol-1,4,5-trisphosphate 3-kinase activity(GO:0008440) |
| 1.6 | 4.7 | GO:0004370 | glycerol kinase activity(GO:0004370) |
| 1.6 | 7.9 | GO:0044020 | histone methyltransferase activity (H4-R3 specific)(GO:0044020) |
| 1.6 | 6.3 | GO:0060072 | large conductance calcium-activated potassium channel activity(GO:0060072) |
| 1.6 | 2013.2 | GO:0004984 | olfactory receptor activity(GO:0004984) |
| 1.6 | 6.2 | GO:0044378 | non-sequence-specific DNA binding, bending(GO:0044378) |
| 1.5 | 9.3 | GO:0008889 | glycerophosphodiester phosphodiesterase activity(GO:0008889) |
| 1.5 | 4.6 | GO:0032139 | dinucleotide insertion or deletion binding(GO:0032139) |
| 1.5 | 33.6 | GO:0005521 | lamin binding(GO:0005521) |
| 1.5 | 4.6 | GO:0016971 | flavin-linked sulfhydryl oxidase activity(GO:0016971) |
| 1.5 | 1.5 | GO:0071208 | histone pre-mRNA DCP binding(GO:0071208) |
| 1.5 | 32.7 | GO:0003746 | translation elongation factor activity(GO:0003746) |
| 1.5 | 11.8 | GO:0008297 | single-stranded DNA exodeoxyribonuclease activity(GO:0008297) |
| 1.5 | 23.4 | GO:0051371 | muscle alpha-actinin binding(GO:0051371) |
| 1.4 | 4.3 | GO:1990763 | arrestin family protein binding(GO:1990763) |
| 1.4 | 2.8 | GO:0044729 | hemi-methylated DNA-binding(GO:0044729) |
| 1.4 | 1.4 | GO:0042978 | ornithine decarboxylase activator activity(GO:0042978) |
| 1.4 | 29.4 | GO:0051537 | 2 iron, 2 sulfur cluster binding(GO:0051537) |
| 1.4 | 9.7 | GO:0008479 | queuine tRNA-ribosyltransferase activity(GO:0008479) |
| 1.4 | 5.5 | GO:0016149 | translation release factor activity, codon specific(GO:0016149) |
| 1.4 | 8.2 | GO:0005338 | nucleotide-sugar transmembrane transporter activity(GO:0005338) |
| 1.4 | 5.5 | GO:0001884 | pyrimidine nucleoside binding(GO:0001884) |
| 1.4 | 4.1 | GO:0072320 | volume-sensitive chloride channel activity(GO:0072320) |
| 1.4 | 31.2 | GO:0005251 | delayed rectifier potassium channel activity(GO:0005251) |
| 1.4 | 9.5 | GO:0031014 | troponin T binding(GO:0031014) |
| 1.3 | 21.4 | GO:0008568 | microtubule-severing ATPase activity(GO:0008568) |
| 1.3 | 5.3 | GO:0035242 | protein-arginine omega-N asymmetric methyltransferase activity(GO:0035242) |
| 1.3 | 5.2 | GO:0001222 | transcription corepressor binding(GO:0001222) |
| 1.3 | 5.2 | GO:0042134 | rRNA primary transcript binding(GO:0042134) |
| 1.3 | 3.9 | GO:0022852 | glycine-gated chloride ion channel activity(GO:0022852) |
| 1.3 | 347.8 | GO:0003735 | structural constituent of ribosome(GO:0003735) |
| 1.3 | 9.0 | GO:0015277 | kainate selective glutamate receptor activity(GO:0015277) |
| 1.3 | 3.9 | GO:1990829 | C-rich single-stranded DNA binding(GO:1990829) |
| 1.3 | 6.4 | GO:0048248 | CXCR3 chemokine receptor binding(GO:0048248) |
| 1.3 | 2.6 | GO:0070410 | co-SMAD binding(GO:0070410) |
| 1.3 | 8.9 | GO:0004118 | cGMP-stimulated cyclic-nucleotide phosphodiesterase activity(GO:0004118) |
| 1.3 | 3.8 | GO:0004925 | prolactin receptor activity(GO:0004925) |
| 1.3 | 2.5 | GO:0051880 | G-quadruplex DNA binding(GO:0051880) |
| 1.3 | 6.3 | GO:0004586 | ornithine decarboxylase activity(GO:0004586) |
| 1.2 | 7.5 | GO:0005148 | prolactin receptor binding(GO:0005148) |
| 1.2 | 8.6 | GO:0045340 | mercury ion binding(GO:0045340) |
| 1.2 | 3.7 | GO:0005135 | interleukin-3 receptor binding(GO:0005135) |
| 1.2 | 3.6 | GO:0051373 | FATZ binding(GO:0051373) |
| 1.2 | 3.6 | GO:0031893 | vasopressin receptor binding(GO:0031893) |
| 1.2 | 19.3 | GO:0005523 | tropomyosin binding(GO:0005523) |
| 1.2 | 7.2 | GO:0050815 | phosphoserine binding(GO:0050815) |
| 1.2 | 4.8 | GO:0004594 | pantothenate kinase activity(GO:0004594) |
| 1.2 | 6.0 | GO:0001155 | TFIIIA-class transcription factor binding(GO:0001155) |
| 1.2 | 7.1 | GO:0098821 | BMP receptor activity(GO:0098821) |
| 1.2 | 3.6 | GO:0005143 | interleukin-12 receptor binding(GO:0005143) |
| 1.2 | 9.4 | GO:0086006 | voltage-gated sodium channel activity involved in cardiac muscle cell action potential(GO:0086006) |
| 1.2 | 7.0 | GO:1990226 | histone methyltransferase binding(GO:1990226) |
| 1.2 | 10.5 | GO:0009881 | photoreceptor activity(GO:0009881) |
| 1.2 | 5.8 | GO:0015129 | lactate transmembrane transporter activity(GO:0015129) |
| 1.2 | 5.8 | GO:0030620 | U2 snRNA binding(GO:0030620) |
| 1.2 | 69.5 | GO:0003743 | translation initiation factor activity(GO:0003743) |
| 1.2 | 3.5 | GO:0036310 | annealing helicase activity(GO:0036310) |
| 1.1 | 5.7 | GO:0005134 | interleukin-2 receptor binding(GO:0005134) |
| 1.1 | 3.4 | GO:0008281 | sulfonylurea receptor activity(GO:0008281) |
| 1.1 | 2.3 | GO:0048408 | epidermal growth factor binding(GO:0048408) |
| 1.1 | 4.5 | GO:0016608 | growth hormone-releasing hormone activity(GO:0016608) |
| 1.1 | 19.1 | GO:0008195 | phosphatidate phosphatase activity(GO:0008195) |
| 1.1 | 3.4 | GO:0008401 | retinoic acid 4-hydroxylase activity(GO:0008401) |
| 1.1 | 4.5 | GO:0048039 | ubiquinone binding(GO:0048039) |
| 1.1 | 7.8 | GO:1990446 | U1 snRNP binding(GO:1990446) |
| 1.1 | 11.0 | GO:0015562 | efflux transmembrane transporter activity(GO:0015562) |
| 1.1 | 5.5 | GO:0036402 | proteasome-activating ATPase activity(GO:0036402) |
| 1.1 | 18.6 | GO:0022848 | acetylcholine-gated cation channel activity(GO:0022848) |
| 1.1 | 4.4 | GO:0008379 | thioredoxin peroxidase activity(GO:0008379) |
| 1.1 | 5.4 | GO:0031849 | olfactory receptor binding(GO:0031849) |
| 1.1 | 6.5 | GO:0004985 | opioid receptor activity(GO:0004985) |
| 1.1 | 3.2 | GO:0003922 | GMP synthase activity(GO:0003921) GMP synthase (glutamine-hydrolyzing) activity(GO:0003922) |
| 1.1 | 2.2 | GO:0047184 | 1-acylglycerophosphocholine O-acyltransferase activity(GO:0047184) |
| 1.1 | 3.2 | GO:0035673 | proton-dependent oligopeptide secondary active transmembrane transporter activity(GO:0005427) secondary active oligopeptide transmembrane transporter activity(GO:0015322) oligopeptide transmembrane transporter activity(GO:0035673) |
| 1.1 | 3.2 | GO:0050220 | prostaglandin-E synthase activity(GO:0050220) |
| 1.1 | 31.1 | GO:0044183 | protein binding involved in protein folding(GO:0044183) |
| 1.1 | 6.4 | GO:0019788 | NEDD8 transferase activity(GO:0019788) |
| 1.1 | 30.9 | GO:0008536 | Ran GTPase binding(GO:0008536) |
| 1.1 | 15.9 | GO:0001056 | RNA polymerase III activity(GO:0001056) |
| 1.1 | 4.2 | GO:0008900 | hydrogen:potassium-exchanging ATPase activity(GO:0008900) |
| 1.0 | 3.1 | GO:0031208 | POZ domain binding(GO:0031208) |
| 1.0 | 8.3 | GO:1901611 | phosphatidylglycerol binding(GO:1901611) |
| 1.0 | 9.3 | GO:0017056 | structural constituent of nuclear pore(GO:0017056) |
| 1.0 | 8.3 | GO:0008312 | 7S RNA binding(GO:0008312) |
| 1.0 | 10.2 | GO:0005000 | vasopressin receptor activity(GO:0005000) |
| 1.0 | 4.1 | GO:0008427 | calcium-dependent protein kinase inhibitor activity(GO:0008427) |
| 1.0 | 4.0 | GO:0019776 | Atg8 ligase activity(GO:0019776) |
| 1.0 | 10.0 | GO:0005222 | intracellular cAMP activated cation channel activity(GO:0005222) |
| 1.0 | 9.0 | GO:0015093 | ferrous iron transmembrane transporter activity(GO:0015093) |
| 1.0 | 4.0 | GO:0043262 | adenosine-diphosphatase activity(GO:0043262) |
| 1.0 | 1.0 | GO:0004651 | polynucleotide 5'-phosphatase activity(GO:0004651) |
| 1.0 | 6.8 | GO:1904047 | S-adenosyl-L-methionine binding(GO:1904047) |
| 1.0 | 4.9 | GO:0051864 | histone demethylase activity (H3-K36 specific)(GO:0051864) |
| 1.0 | 11.6 | GO:0009931 | calcium-dependent protein serine/threonine kinase activity(GO:0009931) |
| 1.0 | 21.2 | GO:0051010 | microtubule plus-end binding(GO:0051010) |
| 1.0 | 182.8 | GO:0042393 | histone binding(GO:0042393) |
| 1.0 | 1.9 | GO:0001102 | RNA polymerase II activating transcription factor binding(GO:0001102) |
| 1.0 | 3.8 | GO:0004176 | ATP-dependent peptidase activity(GO:0004176) |
| 1.0 | 9.5 | GO:0048027 | mRNA 5'-UTR binding(GO:0048027) |
| 0.9 | 0.9 | GO:0098518 | polynucleotide phosphatase activity(GO:0098518) |
| 0.9 | 9.4 | GO:0000774 | adenyl-nucleotide exchange factor activity(GO:0000774) |
| 0.9 | 3.8 | GO:0045134 | uridine-diphosphatase activity(GO:0045134) |
| 0.9 | 2.8 | GO:0001054 | RNA polymerase I activity(GO:0001054) |
| 0.9 | 28.7 | GO:0008307 | structural constituent of muscle(GO:0008307) |
| 0.9 | 1.8 | GO:0031735 | CCR10 chemokine receptor binding(GO:0031735) |
| 0.9 | 14.4 | GO:0008301 | DNA binding, bending(GO:0008301) |
| 0.9 | 6.3 | GO:0016861 | intramolecular oxidoreductase activity, interconverting aldoses and ketoses(GO:0016861) |
| 0.9 | 1.8 | GO:0042903 | tubulin deacetylase activity(GO:0042903) |
| 0.9 | 16.1 | GO:0005487 | nucleocytoplasmic transporter activity(GO:0005487) |
| 0.9 | 4.4 | GO:0043515 | kinetochore binding(GO:0043515) |
| 0.9 | 15.0 | GO:0001594 | trace-amine receptor activity(GO:0001594) |
| 0.9 | 6.1 | GO:0016714 | oxidoreductase activity, acting on paired donors, with incorporation or reduction of molecular oxygen, reduced pteridine as one donor, and incorporation of one atom of oxygen(GO:0016714) |
| 0.9 | 6.1 | GO:0016742 | hydroxymethyl-, formyl- and related transferase activity(GO:0016742) |
| 0.9 | 5.2 | GO:0016832 | aldehyde-lyase activity(GO:0016832) |
| 0.9 | 3.5 | GO:0005163 | nerve growth factor receptor binding(GO:0005163) |
| 0.9 | 2.6 | GO:0097603 | temperature-gated ion channel activity(GO:0097603) |
| 0.9 | 13.8 | GO:0008353 | RNA polymerase II carboxy-terminal domain kinase activity(GO:0008353) |
| 0.9 | 8.6 | GO:0033170 | DNA clamp loader activity(GO:0003689) protein-DNA loading ATPase activity(GO:0033170) |
| 0.8 | 14.4 | GO:0016864 | protein disulfide isomerase activity(GO:0003756) intramolecular oxidoreductase activity, transposing S-S bonds(GO:0016864) |
| 0.8 | 2.5 | GO:0004839 | ubiquitin activating enzyme activity(GO:0004839) |
| 0.8 | 17.4 | GO:0005159 | insulin-like growth factor receptor binding(GO:0005159) |
| 0.8 | 2.5 | GO:0038100 | nodal binding(GO:0038100) |
| 0.8 | 2.5 | GO:0004852 | uroporphyrinogen-III synthase activity(GO:0004852) |
| 0.8 | 4.9 | GO:0004144 | diacylglycerol O-acyltransferase activity(GO:0004144) |
| 0.8 | 1.6 | GO:0004040 | amidase activity(GO:0004040) |
| 0.8 | 4.8 | GO:0032051 | clathrin light chain binding(GO:0032051) |
| 0.8 | 3.2 | GO:0008486 | endopolyphosphatase activity(GO:0000298) diphosphoinositol-polyphosphate diphosphatase activity(GO:0008486) bis(5'-adenosyl)-hexaphosphatase activity(GO:0034431) bis(5'-adenosyl)-pentaphosphatase activity(GO:0034432) |
| 0.8 | 2.4 | GO:0003844 | 1,4-alpha-glucan branching enzyme activity(GO:0003844) |
| 0.8 | 2.4 | GO:0004809 | tRNA (guanine-N2-)-methyltransferase activity(GO:0004809) |
| 0.8 | 4.8 | GO:0044323 | retinoic acid-responsive element binding(GO:0044323) |
| 0.8 | 5.6 | GO:0004468 | lysine N-acetyltransferase activity, acting on acetyl phosphate as donor(GO:0004468) |
| 0.8 | 4.0 | GO:0004090 | carbonyl reductase (NADPH) activity(GO:0004090) |
| 0.8 | 10.9 | GO:0004596 | peptide alpha-N-acetyltransferase activity(GO:0004596) |
| 0.8 | 6.9 | GO:0031628 | opioid receptor binding(GO:0031628) |
| 0.8 | 8.4 | GO:0016783 | sulfurtransferase activity(GO:0016783) |
| 0.8 | 3.0 | GO:0016841 | ammonia-lyase activity(GO:0016841) |
| 0.8 | 2.3 | GO:0016316 | phosphatidylinositol-3,4-bisphosphate 4-phosphatase activity(GO:0016316) |
| 0.8 | 1.5 | GO:0032137 | guanine/thymine mispair binding(GO:0032137) |
| 0.7 | 2.2 | GO:0017168 | 5-oxoprolinase (ATP-hydrolyzing) activity(GO:0017168) |
| 0.7 | 2.2 | GO:0102390 | mycophenolic acid acyl-glucuronide esterase activity(GO:0102390) |
| 0.7 | 43.8 | GO:0003684 | damaged DNA binding(GO:0003684) |
| 0.7 | 2.9 | GO:0043426 | MRF binding(GO:0043426) |
| 0.7 | 2.2 | GO:0032405 | MutLalpha complex binding(GO:0032405) |
| 0.7 | 5.1 | GO:0061513 | hexose phosphate transmembrane transporter activity(GO:0015119) organophosphate:inorganic phosphate antiporter activity(GO:0015315) hexose-phosphate:inorganic phosphate antiporter activity(GO:0015526) glucose 6-phosphate:inorganic phosphate antiporter activity(GO:0061513) |
| 0.7 | 5.8 | GO:0004035 | alkaline phosphatase activity(GO:0004035) |
| 0.7 | 5.0 | GO:0004791 | thioredoxin-disulfide reductase activity(GO:0004791) |
| 0.7 | 15.1 | GO:0070840 | dynein complex binding(GO:0070840) |
| 0.7 | 3.6 | GO:0004886 | 9-cis retinoic acid receptor activity(GO:0004886) |
| 0.7 | 2.8 | GO:0004706 | JUN kinase kinase kinase activity(GO:0004706) |
| 0.7 | 2.1 | GO:0008048 | calcium sensitive guanylate cyclase activator activity(GO:0008048) |
| 0.7 | 3.5 | GO:0004488 | methenyltetrahydrofolate cyclohydrolase activity(GO:0004477) methylenetetrahydrofolate dehydrogenase (NADP+) activity(GO:0004488) |
| 0.7 | 5.6 | GO:0071253 | connexin binding(GO:0071253) |
| 0.7 | 9.7 | GO:0033038 | bitter taste receptor activity(GO:0033038) |
| 0.7 | 2.0 | GO:0015234 | thiamine transmembrane transporter activity(GO:0015234) |
| 0.7 | 0.7 | GO:0004813 | alanine-tRNA ligase activity(GO:0004813) |
| 0.7 | 6.7 | GO:0034450 | ubiquitin-ubiquitin ligase activity(GO:0034450) |
| 0.7 | 2.0 | GO:0051185 | coenzyme transporter activity(GO:0051185) |
| 0.7 | 2.0 | GO:0016230 | sphingomyelin phosphodiesterase activator activity(GO:0016230) |
| 0.7 | 2.6 | GO:0043404 | corticotrophin-releasing factor receptor activity(GO:0015056) corticotropin-releasing hormone receptor activity(GO:0043404) |
| 0.7 | 0.7 | GO:0030977 | taurine binding(GO:0030977) |
| 0.7 | 80.4 | GO:0004222 | metalloendopeptidase activity(GO:0004222) |
| 0.7 | 2.6 | GO:0044388 | small protein activating enzyme binding(GO:0044388) |
| 0.6 | 1.9 | GO:0015199 | amino-acid betaine transmembrane transporter activity(GO:0015199) carnitine transmembrane transporter activity(GO:0015226) |
| 0.6 | 2.6 | GO:0000155 | phosphorelay sensor kinase activity(GO:0000155) |
| 0.6 | 2.5 | GO:1904288 | BAT3 complex binding(GO:1904288) |
| 0.6 | 9.5 | GO:0017160 | Ral GTPase binding(GO:0017160) |
| 0.6 | 8.1 | GO:0005528 | macrolide binding(GO:0005527) FK506 binding(GO:0005528) |
| 0.6 | 2.5 | GO:0010465 | nerve growth factor receptor activity(GO:0010465) |
| 0.6 | 2.5 | GO:0055100 | adiponectin binding(GO:0055100) |
| 0.6 | 12.9 | GO:0015036 | disulfide oxidoreductase activity(GO:0015036) |
| 0.6 | 7.3 | GO:0042171 | lysophosphatidic acid acyltransferase activity(GO:0042171) |
| 0.6 | 6.7 | GO:0004708 | MAP kinase kinase activity(GO:0004708) |
| 0.6 | 6.6 | GO:0019843 | rRNA binding(GO:0019843) |
| 0.6 | 4.7 | GO:1990380 | Lys48-specific deubiquitinase activity(GO:1990380) |
| 0.6 | 3.5 | GO:0004448 | isocitrate dehydrogenase activity(GO:0004448) |
| 0.6 | 9.4 | GO:0008327 | methyl-CpG binding(GO:0008327) |
| 0.6 | 1.8 | GO:0001077 | transcriptional activator activity, RNA polymerase II core promoter proximal region sequence-specific binding(GO:0001077) |
| 0.6 | 2.3 | GO:0003854 | 3-beta-hydroxy-delta5-steroid dehydrogenase activity(GO:0003854) |
| 0.6 | 1.7 | GO:0004663 | Rab geranylgeranyltransferase activity(GO:0004663) |
| 0.6 | 2.9 | GO:0016936 | galactoside binding(GO:0016936) |
| 0.6 | 2.3 | GO:0004822 | isoleucine-tRNA ligase activity(GO:0004822) |
| 0.6 | 2.3 | GO:0034452 | dynactin binding(GO:0034452) |
| 0.6 | 3.4 | GO:0001135 | transcription factor activity, RNA polymerase II transcription factor recruiting(GO:0001135) |
| 0.6 | 1.7 | GO:0005146 | leukemia inhibitory factor receptor binding(GO:0005146) |
| 0.6 | 9.4 | GO:0015288 | porin activity(GO:0015288) |
| 0.5 | 1.6 | GO:0016429 | tRNA (adenine-N1-)-methyltransferase activity(GO:0016429) |
| 0.5 | 3.3 | GO:0004366 | glycerol-3-phosphate O-acyltransferase activity(GO:0004366) |
| 0.5 | 1.6 | GO:0009041 | uridylate kinase activity(GO:0009041) |
| 0.5 | 4.9 | GO:0005132 | type I interferon receptor binding(GO:0005132) |
| 0.5 | 5.4 | GO:0004000 | adenosine deaminase activity(GO:0004000) |
| 0.5 | 2.7 | GO:0030284 | estrogen receptor activity(GO:0030284) |
| 0.5 | 2.7 | GO:0005324 | long-chain fatty acid transporter activity(GO:0005324) |
| 0.5 | 1.6 | GO:0008476 | protein-tyrosine sulfotransferase activity(GO:0008476) |
| 0.5 | 2.1 | GO:0003973 | (S)-2-hydroxy-acid oxidase activity(GO:0003973) |
| 0.5 | 2.6 | GO:0004140 | dephospho-CoA kinase activity(GO:0004140) |
| 0.5 | 2.1 | GO:0000829 | inositol heptakisphosphate kinase activity(GO:0000829) |
| 0.5 | 3.6 | GO:0004767 | sphingomyelin phosphodiesterase activity(GO:0004767) |
| 0.5 | 7.2 | GO:0019531 | oxalate transmembrane transporter activity(GO:0019531) |
| 0.5 | 1.5 | GO:0004995 | tachykinin receptor activity(GO:0004995) |
| 0.5 | 6.7 | GO:0048156 | tau protein binding(GO:0048156) |
| 0.5 | 10.8 | GO:0003887 | DNA-directed DNA polymerase activity(GO:0003887) |
| 0.5 | 3.1 | GO:0004689 | phosphorylase kinase activity(GO:0004689) |
| 0.5 | 1.5 | GO:0000386 | second spliceosomal transesterification activity(GO:0000386) |
| 0.5 | 6.1 | GO:0005243 | gap junction channel activity(GO:0005243) |
| 0.5 | 1.0 | GO:0051920 | peroxiredoxin activity(GO:0051920) |
| 0.5 | 2.5 | GO:0005138 | interleukin-6 receptor binding(GO:0005138) |
| 0.5 | 1.0 | GO:0019166 | trans-2-enoyl-CoA reductase (NADPH) activity(GO:0019166) |
| 0.5 | 1.5 | GO:0045550 | geranylgeranyl reductase activity(GO:0045550) |
| 0.5 | 22.7 | GO:0005245 | voltage-gated calcium channel activity(GO:0005245) |
| 0.5 | 1.5 | GO:0042799 | histone methyltransferase activity (H4-K20 specific)(GO:0042799) |
| 0.5 | 1.9 | GO:0036042 | long-chain fatty acyl-CoA binding(GO:0036042) |
| 0.5 | 3.8 | GO:0015450 | P-P-bond-hydrolysis-driven protein transmembrane transporter activity(GO:0015450) |
| 0.5 | 1.4 | GO:0008142 | oxysterol binding(GO:0008142) |
| 0.5 | 11.9 | GO:0046966 | thyroid hormone receptor binding(GO:0046966) |
| 0.5 | 7.1 | GO:0016493 | C-C chemokine receptor activity(GO:0016493) |
| 0.5 | 2.4 | GO:0034647 | histone demethylase activity (H3-trimethyl-K4 specific)(GO:0034647) histone demethylase activity (H3-dimethyl-K4 specific)(GO:0034648) |
| 0.5 | 2.3 | GO:0004467 | long-chain fatty acid-CoA ligase activity(GO:0004467) decanoate--CoA ligase activity(GO:0102391) |
| 0.5 | 3.3 | GO:0016634 | oxidoreductase activity, acting on the CH-CH group of donors, oxygen as acceptor(GO:0016634) |
| 0.5 | 1.4 | GO:0004167 | dopachrome isomerase activity(GO:0004167) |
| 0.5 | 4.6 | GO:0031957 | very long-chain fatty acid-CoA ligase activity(GO:0031957) |
| 0.5 | 15.9 | GO:0031624 | ubiquitin conjugating enzyme binding(GO:0031624) |
| 0.5 | 7.3 | GO:0050811 | GABA receptor binding(GO:0050811) |
| 0.5 | 5.4 | GO:0035198 | miRNA binding(GO:0035198) |
| 0.5 | 2.3 | GO:0008641 | small protein activating enzyme activity(GO:0008641) |
| 0.4 | 2.7 | GO:0003680 | AT DNA binding(GO:0003680) |
| 0.4 | 1.8 | GO:0030618 | transforming growth factor beta receptor, pathway-specific cytoplasmic mediator activity(GO:0030618) |
| 0.4 | 3.6 | GO:0008079 | translation release factor activity(GO:0003747) translation termination factor activity(GO:0008079) |
| 0.4 | 1.8 | GO:0046975 | histone methyltransferase activity (H3-K36 specific)(GO:0046975) |
| 0.4 | 2.2 | GO:0050309 | glucose-6-phosphatase activity(GO:0004346) sugar-terminal-phosphatase activity(GO:0050309) |
| 0.4 | 1.8 | GO:0036132 | 13-prostaglandin reductase activity(GO:0036132) |
| 0.4 | 1.3 | GO:0045322 | unmethylated CpG binding(GO:0045322) |
| 0.4 | 3.0 | GO:0016308 | 1-phosphatidylinositol-4-phosphate 5-kinase activity(GO:0016308) |
| 0.4 | 1.3 | GO:0003708 | retinoic acid receptor activity(GO:0003708) |
| 0.4 | 3.0 | GO:0022851 | GABA-gated chloride ion channel activity(GO:0022851) |
| 0.4 | 0.9 | GO:0015292 | uniporter activity(GO:0015292) |
| 0.4 | 25.9 | GO:0004527 | exonuclease activity(GO:0004527) |
| 0.4 | 1.3 | GO:0030297 | transmembrane receptor protein tyrosine kinase activator activity(GO:0030297) |
| 0.4 | 2.5 | GO:1901677 | phosphate transmembrane transporter activity(GO:1901677) |
| 0.4 | 7.1 | GO:0032183 | SUMO binding(GO:0032183) |
| 0.4 | 5.4 | GO:0070403 | NAD+ binding(GO:0070403) |
| 0.4 | 2.9 | GO:0034511 | U3 snoRNA binding(GO:0034511) |
| 0.4 | 2.9 | GO:0015204 | urea transmembrane transporter activity(GO:0015204) |
| 0.4 | 2.0 | GO:0004103 | choline kinase activity(GO:0004103) |
| 0.4 | 2.8 | GO:0030983 | mismatched DNA binding(GO:0030983) |
| 0.4 | 10.7 | GO:0031492 | nucleosomal DNA binding(GO:0031492) |
| 0.4 | 2.0 | GO:0015467 | G-protein activated inward rectifier potassium channel activity(GO:0015467) |
| 0.4 | 1.6 | GO:0003987 | acetate-CoA ligase activity(GO:0003987) |
| 0.4 | 0.4 | GO:0061578 | Lys63-specific deubiquitinase activity(GO:0061578) |
| 0.4 | 2.3 | GO:0004128 | cytochrome-b5 reductase activity, acting on NAD(P)H(GO:0004128) |
| 0.4 | 1.1 | GO:0035033 | histone deacetylase regulator activity(GO:0035033) |
| 0.4 | 15.1 | GO:0000049 | tRNA binding(GO:0000049) |
| 0.4 | 3.0 | GO:0004439 | phosphatidylinositol-4,5-bisphosphate 5-phosphatase activity(GO:0004439) |
| 0.4 | 4.5 | GO:0070034 | telomerase RNA binding(GO:0070034) |
| 0.4 | 0.7 | GO:0016886 | ligase activity, forming phosphoric ester bonds(GO:0016886) |
| 0.4 | 2.5 | GO:0016286 | small conductance calcium-activated potassium channel activity(GO:0016286) |
| 0.4 | 2.8 | GO:0019855 | calcium channel inhibitor activity(GO:0019855) |
| 0.4 | 7.7 | GO:0017025 | TBP-class protein binding(GO:0017025) |
| 0.4 | 1.4 | GO:0004711 | ribosomal protein S6 kinase activity(GO:0004711) |
| 0.3 | 8.4 | GO:0070001 | aspartic-type endopeptidase activity(GO:0004190) aspartic-type peptidase activity(GO:0070001) |
| 0.3 | 1.7 | GO:0005315 | inorganic phosphate transmembrane transporter activity(GO:0005315) |
| 0.3 | 1.0 | GO:0035184 | histone threonine kinase activity(GO:0035184) |
| 0.3 | 2.1 | GO:0052851 | cupric reductase activity(GO:0008823) ferric-chelate reductase (NADPH) activity(GO:0052851) |
| 0.3 | 26.1 | GO:0051087 | chaperone binding(GO:0051087) |
| 0.3 | 2.4 | GO:0004966 | galanin receptor activity(GO:0004966) |
| 0.3 | 3.0 | GO:0005237 | inhibitory extracellular ligand-gated ion channel activity(GO:0005237) |
| 0.3 | 3.4 | GO:0070700 | BMP receptor binding(GO:0070700) |
| 0.3 | 3.3 | GO:0016805 | dipeptidase activity(GO:0016805) |
| 0.3 | 1.0 | GO:0031765 | galanin receptor binding(GO:0031763) type 2 galanin receptor binding(GO:0031765) type 3 galanin receptor binding(GO:0031766) |
| 0.3 | 7.3 | GO:0051059 | NF-kappaB binding(GO:0051059) |
| 0.3 | 1.3 | GO:0055105 | ubiquitin-protein transferase inhibitor activity(GO:0055105) |
| 0.3 | 2.0 | GO:0046920 | alpha-(1->3)-fucosyltransferase activity(GO:0046920) |
| 0.3 | 2.3 | GO:0000268 | peroxisome targeting sequence binding(GO:0000268) |
| 0.3 | 1.6 | GO:0050692 | DBD domain binding(GO:0050692) |
| 0.3 | 2.9 | GO:0035256 | G-protein coupled glutamate receptor binding(GO:0035256) |
| 0.3 | 6.8 | GO:0042800 | histone methyltransferase activity (H3-K4 specific)(GO:0042800) |
| 0.3 | 1.9 | GO:0055056 | D-glucose transmembrane transporter activity(GO:0055056) |
| 0.3 | 15.2 | GO:0002039 | p53 binding(GO:0002039) |
| 0.3 | 1.0 | GO:0008254 | 3'-nucleotidase activity(GO:0008254) |
| 0.3 | 1.0 | GO:0005330 | dopamine:sodium symporter activity(GO:0005330) |
| 0.3 | 2.8 | GO:0070513 | death domain binding(GO:0070513) |
| 0.3 | 5.3 | GO:0003950 | NAD+ ADP-ribosyltransferase activity(GO:0003950) |
| 0.3 | 1.9 | GO:0071532 | ankyrin repeat binding(GO:0071532) |
| 0.3 | 4.7 | GO:0009982 | pseudouridine synthase activity(GO:0009982) |
| 0.3 | 7.6 | GO:0004383 | guanylate cyclase activity(GO:0004383) |
| 0.3 | 3.0 | GO:0005412 | glucose:sodium symporter activity(GO:0005412) |
| 0.3 | 2.1 | GO:0047499 | calcium-independent phospholipase A2 activity(GO:0047499) |
| 0.3 | 3.0 | GO:0005225 | volume-sensitive anion channel activity(GO:0005225) |
| 0.3 | 2.4 | GO:0050321 | tau-protein kinase activity(GO:0050321) |
| 0.3 | 2.0 | GO:0045503 | dynein light chain binding(GO:0045503) |
| 0.3 | 2.0 | GO:0070182 | DNA polymerase binding(GO:0070182) |
| 0.3 | 2.6 | GO:0000182 | rDNA binding(GO:0000182) |
| 0.3 | 1.4 | GO:0033041 | sweet taste receptor activity(GO:0033041) |
| 0.3 | 7.2 | GO:0003785 | actin monomer binding(GO:0003785) |
| 0.3 | 4.0 | GO:0004003 | ATP-dependent DNA helicase activity(GO:0004003) |
| 0.3 | 15.2 | GO:0031072 | heat shock protein binding(GO:0031072) |
| 0.3 | 0.8 | GO:0052654 | branched-chain-amino-acid transaminase activity(GO:0004084) L-leucine transaminase activity(GO:0052654) L-valine transaminase activity(GO:0052655) L-isoleucine transaminase activity(GO:0052656) |
| 0.3 | 0.8 | GO:0050051 | leukotriene-B4 20-monooxygenase activity(GO:0050051) tocopherol omega-hydroxylase activity(GO:0052870) alpha-tocopherol omega-hydroxylase activity(GO:0052871) |
| 0.3 | 0.6 | GO:0050897 | cobalt ion binding(GO:0050897) |
| 0.3 | 4.2 | GO:0003993 | acid phosphatase activity(GO:0003993) |
| 0.3 | 0.8 | GO:0001164 | RNA polymerase I regulatory region sequence-specific DNA binding(GO:0001163) RNA polymerase I CORE element sequence-specific DNA binding(GO:0001164) |
| 0.3 | 1.4 | GO:0030229 | very-low-density lipoprotein particle receptor activity(GO:0030229) |
| 0.3 | 1.4 | GO:0070016 | armadillo repeat domain binding(GO:0070016) |
| 0.3 | 5.4 | GO:0005212 | structural constituent of eye lens(GO:0005212) |
| 0.3 | 5.0 | GO:0016891 | endoribonuclease activity, producing 5'-phosphomonoesters(GO:0016891) |
| 0.3 | 1.0 | GO:0003989 | acetyl-CoA carboxylase activity(GO:0003989) |
| 0.3 | 1.3 | GO:0004616 | phosphogluconate dehydrogenase (decarboxylating) activity(GO:0004616) |
| 0.3 | 1.5 | GO:0004994 | somatostatin receptor activity(GO:0004994) |
| 0.2 | 1.0 | GO:0019002 | GMP binding(GO:0019002) |
| 0.2 | 1.7 | GO:0008527 | taste receptor activity(GO:0008527) |
| 0.2 | 0.7 | GO:0004735 | pyrroline-5-carboxylate reductase activity(GO:0004735) |
| 0.2 | 14.0 | GO:0008186 | RNA-dependent ATPase activity(GO:0008186) |
| 0.2 | 4.3 | GO:0004712 | protein serine/threonine/tyrosine kinase activity(GO:0004712) |
| 0.2 | 1.4 | GO:0008266 | poly(U) RNA binding(GO:0008266) |
| 0.2 | 1.6 | GO:0031685 | adenosine receptor binding(GO:0031685) |
| 0.2 | 1.3 | GO:0003707 | steroid hormone receptor activity(GO:0003707) |
| 0.2 | 6.7 | GO:0015002 | cytochrome-c oxidase activity(GO:0004129) heme-copper terminal oxidase activity(GO:0015002) oxidoreductase activity, acting on a heme group of donors(GO:0016675) oxidoreductase activity, acting on a heme group of donors, oxygen as acceptor(GO:0016676) |
| 0.2 | 30.3 | GO:0003714 | transcription corepressor activity(GO:0003714) |
| 0.2 | 0.8 | GO:0001055 | RNA polymerase II activity(GO:0001055) |
| 0.2 | 1.0 | GO:0089720 | caspase binding(GO:0089720) |
| 0.2 | 1.6 | GO:0017169 | CDP-alcohol phosphatidyltransferase activity(GO:0017169) |
| 0.2 | 0.2 | GO:0035173 | histone kinase activity(GO:0035173) |
| 0.2 | 1.6 | GO:0008190 | eukaryotic initiation factor 4E binding(GO:0008190) |
| 0.2 | 1.4 | GO:0097001 | ceramide binding(GO:0097001) |
| 0.2 | 1.4 | GO:0030274 | LIM domain binding(GO:0030274) |
| 0.2 | 0.6 | GO:0044390 | ubiquitin-like protein conjugating enzyme binding(GO:0044390) |
| 0.2 | 19.4 | GO:0016503 | pheromone receptor activity(GO:0016503) |
| 0.2 | 0.6 | GO:0051731 | polynucleotide 5'-hydroxyl-kinase activity(GO:0051731) |
| 0.2 | 0.4 | GO:0060230 | lipoprotein lipase activator activity(GO:0060230) |
| 0.2 | 2.1 | GO:0042923 | neuropeptide binding(GO:0042923) |
| 0.2 | 2.8 | GO:0004993 | G-protein coupled serotonin receptor activity(GO:0004993) serotonin receptor activity(GO:0099589) |
| 0.2 | 5.8 | GO:0048487 | beta-tubulin binding(GO:0048487) |
| 0.2 | 0.7 | GO:0031705 | bombesin receptor binding(GO:0031705) |
| 0.2 | 1.7 | GO:0032454 | histone demethylase activity (H3-K9 specific)(GO:0032454) |
| 0.2 | 0.9 | GO:0005042 | netrin receptor activity(GO:0005042) |
| 0.2 | 1.4 | GO:0070053 | thrombospondin receptor activity(GO:0070053) |
| 0.2 | 2.3 | GO:0016813 | hydrolase activity, acting on carbon-nitrogen (but not peptide) bonds, in linear amidines(GO:0016813) |
| 0.2 | 2.5 | GO:0004745 | retinol dehydrogenase activity(GO:0004745) |
| 0.2 | 2.5 | GO:0008139 | nuclear localization sequence binding(GO:0008139) |
| 0.2 | 0.7 | GO:0019784 | NEDD8-specific protease activity(GO:0019784) |
| 0.2 | 2.9 | GO:0005337 | nucleoside transmembrane transporter activity(GO:0005337) |
| 0.2 | 5.4 | GO:0051287 | NAD binding(GO:0051287) |
| 0.2 | 0.5 | GO:0043522 | leucine zipper domain binding(GO:0043522) |
| 0.2 | 1.8 | GO:0034062 | DNA-directed RNA polymerase activity(GO:0003899) RNA polymerase activity(GO:0034062) |
| 0.2 | 0.5 | GO:0016427 | tRNA (cytosine) methyltransferase activity(GO:0016427) |
| 0.2 | 0.8 | GO:0004427 | inorganic diphosphatase activity(GO:0004427) |
| 0.2 | 0.5 | GO:0042806 | fucose binding(GO:0042806) |
| 0.2 | 1.1 | GO:0005549 | odorant binding(GO:0005549) |
| 0.2 | 0.5 | GO:0036468 | aromatic-L-amino-acid decarboxylase activity(GO:0004058) L-dopa decarboxylase activity(GO:0036468) |
| 0.2 | 0.6 | GO:0016812 | hydrolase activity, acting on carbon-nitrogen (but not peptide) bonds, in cyclic amides(GO:0016812) |
| 0.2 | 0.9 | GO:0047696 | beta-adrenergic receptor kinase activity(GO:0047696) |
| 0.1 | 1.9 | GO:0050681 | androgen receptor binding(GO:0050681) |
| 0.1 | 1.9 | GO:0023026 | MHC class II protein complex binding(GO:0023026) |
| 0.1 | 0.6 | GO:0004052 | arachidonate 12-lipoxygenase activity(GO:0004052) |
| 0.1 | 0.4 | GO:0004335 | galactokinase activity(GO:0004335) |
| 0.1 | 2.7 | GO:0030332 | cyclin binding(GO:0030332) |
| 0.1 | 1.1 | GO:0000064 | L-ornithine transmembrane transporter activity(GO:0000064) |
| 0.1 | 29.5 | GO:0004252 | serine-type endopeptidase activity(GO:0004252) |
| 0.1 | 0.7 | GO:0070728 | leucine binding(GO:0070728) |
| 0.1 | 4.7 | GO:0070063 | RNA polymerase binding(GO:0070063) |
| 0.1 | 1.7 | GO:0050308 | sugar-phosphatase activity(GO:0050308) |
| 0.1 | 0.4 | GO:1990247 | N6-methyladenosine-containing RNA binding(GO:1990247) |
| 0.1 | 3.1 | GO:0045182 | translation regulator activity(GO:0045182) |
| 0.1 | 1.1 | GO:0005536 | glucose binding(GO:0005536) |
| 0.1 | 0.6 | GO:0004416 | hydroxyacylglutathione hydrolase activity(GO:0004416) |
| 0.1 | 3.8 | GO:0000981 | RNA polymerase II transcription factor activity, sequence-specific DNA binding(GO:0000981) |
| 0.1 | 2.7 | GO:1990841 | promoter-specific chromatin binding(GO:1990841) |
| 0.1 | 0.5 | GO:0060228 | phosphatidylcholine-sterol O-acyltransferase activator activity(GO:0060228) |
| 0.1 | 0.1 | GO:0010861 | thyroid hormone receptor activator activity(GO:0010861) |
| 0.1 | 0.6 | GO:0034190 | apolipoprotein receptor binding(GO:0034190) |
| 0.1 | 1.6 | GO:0005248 | voltage-gated sodium channel activity(GO:0005248) voltage-gated ion channel activity involved in regulation of postsynaptic membrane potential(GO:1905030) |
| 0.1 | 2.5 | GO:0071855 | neuropeptide receptor binding(GO:0071855) |
| 0.1 | 0.6 | GO:0070139 | ubiquitin-like protein-specific endopeptidase activity(GO:0070137) SUMO-specific endopeptidase activity(GO:0070139) |
| 0.1 | 0.6 | GO:0052629 | phosphatidylinositol-3,5-bisphosphate 3-phosphatase activity(GO:0052629) |
| 0.1 | 0.5 | GO:0050694 | galactose 3-O-sulfotransferase activity(GO:0050694) |
| 0.1 | 4.4 | GO:0005164 | tumor necrosis factor receptor binding(GO:0005164) |
| 0.1 | 1.3 | GO:0033691 | sialic acid binding(GO:0033691) |
| 0.1 | 0.9 | GO:0000339 | RNA cap binding(GO:0000339) |
| 0.1 | 0.8 | GO:0002161 | aminoacyl-tRNA editing activity(GO:0002161) |
| 0.1 | 0.4 | GO:0008532 | N-acetyllactosaminide beta-1,3-N-acetylglucosaminyltransferase activity(GO:0008532) |
| 0.1 | 0.4 | GO:0033265 | choline binding(GO:0033265) |
| 0.1 | 0.5 | GO:0019104 | DNA N-glycosylase activity(GO:0019104) |
| 0.1 | 1.1 | GO:0004622 | lysophospholipase activity(GO:0004622) |
| 0.1 | 0.4 | GO:0032027 | myosin light chain binding(GO:0032027) |
| 0.1 | 1.3 | GO:0030374 | ligand-dependent nuclear receptor transcription coactivator activity(GO:0030374) |
| 0.1 | 1.8 | GO:0004812 | aminoacyl-tRNA ligase activity(GO:0004812) ligase activity, forming carbon-oxygen bonds(GO:0016875) ligase activity, forming aminoacyl-tRNA and related compounds(GO:0016876) |
| 0.1 | 0.4 | GO:0097027 | ubiquitin-protein transferase activator activity(GO:0097027) |
| 0.1 | 0.3 | GO:0015350 | methotrexate transporter activity(GO:0015350) |
| 0.1 | 1.0 | GO:0036002 | pre-mRNA binding(GO:0036002) |
| 0.1 | 0.4 | GO:0017176 | phosphatidylinositol N-acetylglucosaminyltransferase activity(GO:0017176) |
| 0.1 | 0.3 | GO:0015193 | L-proline transmembrane transporter activity(GO:0015193) |
| 0.1 | 0.7 | GO:0047372 | acylglycerol lipase activity(GO:0047372) |
| 0.1 | 0.4 | GO:0001972 | retinoic acid binding(GO:0001972) |
| 0.1 | 0.4 | GO:0097602 | cullin family protein binding(GO:0097602) |
| 0.1 | 0.5 | GO:0016922 | ligand-dependent nuclear receptor binding(GO:0016922) |
| 0.1 | 1.3 | GO:0043022 | ribosome binding(GO:0043022) |
| 0.1 | 0.3 | GO:0008603 | cAMP-dependent protein kinase regulator activity(GO:0008603) |
| 0.1 | 0.3 | GO:0008502 | melatonin receptor activity(GO:0008502) |
| 0.0 | 0.1 | GO:0070644 | vitamin D response element binding(GO:0070644) |
| 0.0 | 66.8 | GO:0003677 | DNA binding(GO:0003677) |
| 0.0 | 0.6 | GO:0001206 | transcriptional repressor activity, RNA polymerase II distal enhancer sequence-specific binding(GO:0001206) |
| 0.0 | 1.0 | GO:0008188 | neuropeptide receptor activity(GO:0008188) |
| 0.0 | 14.7 | GO:0004842 | ubiquitin-protein transferase activity(GO:0004842) |
| 0.0 | 0.4 | GO:0051959 | dynein light intermediate chain binding(GO:0051959) |
| 0.0 | 2.0 | GO:0004518 | nuclease activity(GO:0004518) |
| 0.0 | 0.5 | GO:0015172 | acidic amino acid transmembrane transporter activity(GO:0015172) |
| 0.0 | 0.1 | GO:0034597 | phosphatidylinositol-4,5-bisphosphate 4-phosphatase activity(GO:0034597) |
| 0.0 | 0.1 | GO:0038132 | neuregulin binding(GO:0038132) |
| 0.0 | 0.2 | GO:0008239 | dipeptidyl-peptidase activity(GO:0008239) |
| 0.0 | 0.6 | GO:0004181 | metallocarboxypeptidase activity(GO:0004181) |
| 0.0 | 0.1 | GO:0048101 | calcium- and calmodulin-regulated 3',5'-cyclic-GMP phosphodiesterase activity(GO:0048101) |
| 0.0 | 0.2 | GO:0015125 | bile acid transmembrane transporter activity(GO:0015125) |
| 0.0 | 0.2 | GO:0004749 | ribose phosphate diphosphokinase activity(GO:0004749) |
| 0.0 | 0.1 | GO:0031491 | nucleosome binding(GO:0031491) |
| 0.0 | 0.1 | GO:0016175 | superoxide-generating NADPH oxidase activity(GO:0016175) |
| 0.0 | 0.1 | GO:0017069 | snRNA binding(GO:0017069) |
| 0.0 | 0.1 | GO:0002046 | opsin binding(GO:0002046) |
Gene overrepresentation in curated gene sets: canonical pathways category:
| Log-likelihood per target | Total log-likelihood | Term | Description |
|---|---|---|---|
| 2.6 | 33.9 | PID RANBP2 PATHWAY | Sumoylation by RanBP2 regulates transcriptional repression |
| 1.0 | 48.9 | PID AURORA B PATHWAY | Aurora B signaling |
| 1.0 | 2.0 | SIG PIP3 SIGNALING IN B LYMPHOCYTES | Genes related to PIP3 signaling in B lymphocytes |
| 0.9 | 2.8 | PID P38 GAMMA DELTA PATHWAY | Signaling mediated by p38-gamma and p38-delta |
| 0.9 | 32.7 | PID ATR PATHWAY | ATR signaling pathway |
| 0.7 | 12.4 | PID ERB GENOMIC PATHWAY | Validated nuclear estrogen receptor beta network |
| 0.7 | 0.7 | PID IL5 PATHWAY | IL5-mediated signaling events |
| 0.7 | 32.0 | PID PLK1 PATHWAY | PLK1 signaling events |
| 0.7 | 20.6 | PID IL27 PATHWAY | IL27-mediated signaling events |
| 0.7 | 4.7 | PID PRL SIGNALING EVENTS PATHWAY | Signaling events mediated by PRL |
| 0.6 | 30.4 | SIG REGULATION OF THE ACTIN CYTOSKELETON BY RHO GTPASES | Genes related to regulation of the actin cytoskeleton |
| 0.6 | 7.1 | ST MYOCYTE AD PATHWAY | Myocyte Adrenergic Pathway is a specific case of the generalized Adrenergic Pathway. |
| 0.6 | 18.7 | PID HDAC CLASSIII PATHWAY | Signaling events mediated by HDAC Class III |
| 0.6 | 6.4 | PID ERBB2 ERBB3 PATHWAY | ErbB2/ErbB3 signaling events |
| 0.6 | 17.1 | PID HDAC CLASSII PATHWAY | Signaling events mediated by HDAC Class II |
| 0.6 | 4.5 | PID MYC PATHWAY | C-MYC pathway |
| 0.5 | 14.7 | PID IL12 STAT4 PATHWAY | IL12 signaling mediated by STAT4 |
| 0.5 | 24.0 | PID HDAC CLASSI PATHWAY | Signaling events mediated by HDAC Class I |
| 0.5 | 12.1 | PID ATM PATHWAY | ATM pathway |
| 0.5 | 10.4 | PID AURORA A PATHWAY | Aurora A signaling |
| 0.5 | 24.0 | PID NFAT TFPATHWAY | Calcineurin-regulated NFAT-dependent transcription in lymphocytes |
| 0.5 | 5.7 | PID S1P S1P4 PATHWAY | S1P4 pathway |
| 0.5 | 4.7 | ST FAS SIGNALING PATHWAY | Fas Signaling Pathway |
| 0.4 | 8.2 | PID NFKAPPAB CANONICAL PATHWAY | Canonical NF-kappaB pathway |
| 0.4 | 7.8 | PID SMAD2 3PATHWAY | Regulation of cytoplasmic and nuclear SMAD2/3 signaling |
| 0.4 | 23.2 | PID HIF1 TFPATHWAY | HIF-1-alpha transcription factor network |
| 0.4 | 6.2 | PID HIF1A PATHWAY | Hypoxic and oxygen homeostasis regulation of HIF-1-alpha |
| 0.3 | 17.8 | PID P53 REGULATION PATHWAY | p53 pathway |
| 0.3 | 6.6 | SA TRKA RECEPTOR | The TrkA receptor binds nerve growth factor to activate MAP kinase pathways and promote cell growth. |
| 0.3 | 0.3 | ST DIFFERENTIATION PATHWAY IN PC12 CELLS | Differentiation Pathway in PC12 Cells; this is a specific case of PAC1 Receptor Pathway. |
| 0.3 | 19.6 | PID MYC ACTIV PATHWAY | Validated targets of C-MYC transcriptional activation |
| 0.3 | 6.6 | PID RHODOPSIN PATHWAY | Visual signal transduction: Rods |
| 0.2 | 1.0 | PID EPO PATHWAY | EPO signaling pathway |
| 0.2 | 3.8 | PID BARD1 PATHWAY | BARD1 signaling events |
| 0.2 | 6.9 | PID AR TF PATHWAY | Regulation of Androgen receptor activity |
| 0.2 | 5.0 | ST GRANULE CELL SURVIVAL PATHWAY | Granule Cell Survival Pathway is a specific case of more general PAC1 Receptor Pathway. |
| 0.2 | 0.8 | PID IL2 1PATHWAY | IL2-mediated signaling events |
| 0.2 | 4.5 | PID PI3KCI AKT PATHWAY | Class I PI3K signaling events mediated by Akt |
| 0.2 | 3.0 | PID AP1 PATHWAY | AP-1 transcription factor network |
| 0.2 | 0.5 | ST PHOSPHOINOSITIDE 3 KINASE PATHWAY | PI3K Pathway |
| 0.2 | 2.9 | PID FANCONI PATHWAY | Fanconi anemia pathway |
| 0.2 | 5.8 | PID ERBB4 PATHWAY | ErbB4 signaling events |
| 0.1 | 1.0 | PID IL2 PI3K PATHWAY | IL2 signaling events mediated by PI3K |
| 0.1 | 0.1 | PID TCR RAS PATHWAY | Ras signaling in the CD4+ TCR pathway |
| 0.1 | 1.5 | PID CD8 TCR DOWNSTREAM PATHWAY | Downstream signaling in naïve CD8+ T cells |
| 0.1 | 0.9 | PID CONE PATHWAY | Visual signal transduction: Cones |
| 0.1 | 1.0 | PID IL23 PATHWAY | IL23-mediated signaling events |
| 0.1 | 2.2 | PID E2F PATHWAY | E2F transcription factor network |
| 0.0 | 0.6 | PID DNA PK PATHWAY | DNA-PK pathway in nonhomologous end joining |
| 0.0 | 0.2 | PID ALK2 PATHWAY | ALK2 signaling events |
| 0.0 | 0.0 | SA FAS SIGNALING | The TNF-type receptor Fas induces apoptosis on ligand binding. |
| 0.0 | 0.1 | PID TCPTP PATHWAY | Signaling events mediated by TCPTP |
| 0.0 | 0.2 | PID INSULIN GLUCOSE PATHWAY | Insulin-mediated glucose transport |
Gene overrepresentation in curated gene sets: REACTOME pathways category:
| Log-likelihood per target | Total log-likelihood | Term | Description |
|---|---|---|---|
| 3.8 | 60.6 | REACTOME FORMATION OF ATP BY CHEMIOSMOTIC COUPLING | Genes involved in Formation of ATP by chemiosmotic coupling |
| 2.7 | 8.0 | REACTOME REGULATION OF GLUCOKINASE BY GLUCOKINASE REGULATORY PROTEIN | Genes involved in Regulation of Glucokinase by Glucokinase Regulatory Protein |
| 2.4 | 2.4 | REACTOME NEF MEDIATED DOWNREGULATION OF MHC CLASS I COMPLEX CELL SURFACE EXPRESSION | Genes involved in Nef mediated downregulation of MHC class I complex cell surface expression |
| 2.2 | 24.6 | REACTOME REMOVAL OF THE FLAP INTERMEDIATE FROM THE C STRAND | Genes involved in Removal of the Flap Intermediate from the C-strand |
| 2.0 | 83.3 | REACTOME DEPOSITION OF NEW CENPA CONTAINING NUCLEOSOMES AT THE CENTROMERE | Genes involved in Deposition of New CENPA-containing Nucleosomes at the Centromere |
| 1.9 | 3.8 | REACTOME RAS ACTIVATION UOPN CA2 INFUX THROUGH NMDA RECEPTOR | Genes involved in Ras activation uopn Ca2+ infux through NMDA receptor |
| 1.9 | 74.0 | REACTOME STRIATED MUSCLE CONTRACTION | Genes involved in Striated Muscle Contraction |
| 1.8 | 27.6 | REACTOME CITRIC ACID CYCLE TCA CYCLE | Genes involved in Citric acid cycle (TCA cycle) |
| 1.8 | 83.4 | REACTOME MITOCHONDRIAL PROTEIN IMPORT | Genes involved in Mitochondrial Protein Import |
| 1.8 | 112.8 | REACTOME RESPIRATORY ELECTRON TRANSPORT ATP SYNTHESIS BY CHEMIOSMOTIC COUPLING AND HEAT PRODUCTION BY UNCOUPLING PROTEINS | Genes involved in Respiratory electron transport, ATP synthesis by chemiosmotic coupling, and heat production by uncoupling proteins. |
| 1.7 | 20.9 | REACTOME PURINE RIBONUCLEOSIDE MONOPHOSPHATE BIOSYNTHESIS | Genes involved in Purine ribonucleoside monophosphate biosynthesis |
| 1.7 | 61.7 | REACTOME GLUCONEOGENESIS | Genes involved in Gluconeogenesis |
| 1.7 | 5.1 | REACTOME SLBP DEPENDENT PROCESSING OF REPLICATION DEPENDENT HISTONE PRE MRNAS | Genes involved in SLBP Dependent Processing of Replication-Dependent Histone Pre-mRNAs |
| 1.6 | 18.6 | REACTOME PRESYNAPTIC NICOTINIC ACETYLCHOLINE RECEPTORS | Genes involved in Presynaptic nicotinic acetylcholine receptors |
| 1.5 | 78.3 | REACTOME VIF MEDIATED DEGRADATION OF APOBEC3G | Genes involved in Vif-mediated degradation of APOBEC3G |
| 1.4 | 9.9 | REACTOME REPAIR SYNTHESIS FOR GAP FILLING BY DNA POL IN TC NER | Genes involved in Repair synthesis for gap-filling by DNA polymerase in TC-NER |
| 1.3 | 28.3 | REACTOME MITOCHONDRIAL TRNA AMINOACYLATION | Genes involved in Mitochondrial tRNA aminoacylation |
| 1.3 | 10.6 | REACTOME TRANSLOCATION OF ZAP 70 TO IMMUNOLOGICAL SYNAPSE | Genes involved in Translocation of ZAP-70 to Immunological synapse |
| 1.3 | 37.0 | REACTOME NEP NS2 INTERACTS WITH THE CELLULAR EXPORT MACHINERY | Genes involved in NEP/NS2 Interacts with the Cellular Export Machinery |
| 1.2 | 9.9 | REACTOME OPSINS | Genes involved in Opsins |
| 1.2 | 37.6 | REACTOME MEIOTIC SYNAPSIS | Genes involved in Meiotic Synapsis |
| 1.2 | 2.4 | REACTOME TRANSPORT OF RIBONUCLEOPROTEINS INTO THE HOST NUCLEUS | Genes involved in Transport of Ribonucleoproteins into the Host Nucleus |
| 1.2 | 18.8 | REACTOME REGULATION OF AMPK ACTIVITY VIA LKB1 | Genes involved in Regulation of AMPK activity via LKB1 |
| 1.2 | 30.4 | REACTOME METABOLISM OF NON CODING RNA | Genes involved in Metabolism of non-coding RNA |
| 1.2 | 24.4 | REACTOME PYRUVATE METABOLISM | Genes involved in Pyruvate metabolism |
| 1.2 | 21.9 | REACTOME GLUCOSE TRANSPORT | Genes involved in Glucose transport |
| 1.1 | 1.1 | REACTOME CONVERSION FROM APC C CDC20 TO APC C CDH1 IN LATE ANAPHASE | Genes involved in Conversion from APC/C:Cdc20 to APC/C:Cdh1 in late anaphase |
| 1.1 | 18.8 | REACTOME ENDOGENOUS STEROLS | Genes involved in Endogenous sterols |
| 1.1 | 108.5 | REACTOME PEPTIDE CHAIN ELONGATION | Genes involved in Peptide chain elongation |
| 1.1 | 12.0 | REACTOME HORMONE LIGAND BINDING RECEPTORS | Genes involved in Hormone ligand-binding receptors |
| 1.1 | 13.0 | REACTOME E2F ENABLED INHIBITION OF PRE REPLICATION COMPLEX FORMATION | Genes involved in E2F-enabled inhibition of pre-replication complex formation |
| 1.1 | 33.5 | REACTOME KINESINS | Genes involved in Kinesins |
| 1.0 | 8.1 | REACTOME RNA POL I PROMOTER OPENING | Genes involved in RNA Polymerase I Promoter Opening |
| 1.0 | 9.1 | REACTOME RAF MAP KINASE CASCADE | Genes involved in RAF/MAP kinase cascade |
| 1.0 | 11.6 | REACTOME RECYCLING OF BILE ACIDS AND SALTS | Genes involved in Recycling of bile acids and salts |
| 1.0 | 26.0 | REACTOME PREFOLDIN MEDIATED TRANSFER OF SUBSTRATE TO CCT TRIC | Genes involved in Prefoldin mediated transfer of substrate to CCT/TriC |
| 1.0 | 7.6 | REACTOME POST CHAPERONIN TUBULIN FOLDING PATHWAY | Genes involved in Post-chaperonin tubulin folding pathway |
| 0.9 | 18.3 | REACTOME PROLACTIN RECEPTOR SIGNALING | Genes involved in Prolactin receptor signaling |
| 0.9 | 20.1 | REACTOME NONSENSE MEDIATED DECAY ENHANCED BY THE EXON JUNCTION COMPLEX | Genes involved in Nonsense Mediated Decay Enhanced by the Exon Junction Complex |
| 0.9 | 11.7 | REACTOME SIGNALING BY ACTIVATED POINT MUTANTS OF FGFR1 | Genes involved in Signaling by activated point mutants of FGFR1 |
| 0.9 | 13.5 | REACTOME MRNA DECAY BY 5 TO 3 EXORIBONUCLEASE | Genes involved in mRNA Decay by 5' to 3' Exoribonuclease |
| 0.9 | 17.6 | REACTOME RNA POL III CHAIN ELONGATION | Genes involved in RNA Polymerase III Chain Elongation |
| 0.9 | 12.3 | REACTOME SYNTHESIS OF PE | Genes involved in Synthesis of PE |
| 0.9 | 20.0 | REACTOME REGULATION OF GENE EXPRESSION IN BETA CELLS | Genes involved in Regulation of gene expression in beta cells |
| 0.8 | 42.8 | REACTOME LOSS OF NLP FROM MITOTIC CENTROSOMES | Genes involved in Loss of Nlp from mitotic centrosomes |
| 0.8 | 3.2 | REACTOME CDT1 ASSOCIATION WITH THE CDC6 ORC ORIGIN COMPLEX | Genes involved in CDT1 association with the CDC6:ORC:origin complex |
| 0.8 | 8.8 | REACTOME MTORC1 MEDIATED SIGNALLING | Genes involved in mTORC1-mediated signalling |
| 0.8 | 4.8 | REACTOME DIGESTION OF DIETARY CARBOHYDRATE | Genes involved in Digestion of dietary carbohydrate |
| 0.8 | 2.4 | REACTOME G ALPHA Z SIGNALLING EVENTS | Genes involved in G alpha (z) signalling events |
| 0.8 | 1.6 | REACTOME SCF BETA TRCP MEDIATED DEGRADATION OF EMI1 | Genes involved in SCF-beta-TrCP mediated degradation of Emi1 |
| 0.8 | 3.9 | REACTOME INTERACTIONS OF VPR WITH HOST CELLULAR PROTEINS | Genes involved in Interactions of Vpr with host cellular proteins |
| 0.8 | 9.8 | REACTOME MRNA DECAY BY 3 TO 5 EXORIBONUCLEASE | Genes involved in mRNA Decay by 3' to 5' Exoribonuclease |
| 0.7 | 10.4 | REACTOME ORC1 REMOVAL FROM CHROMATIN | Genes involved in Orc1 removal from chromatin |
| 0.7 | 8.7 | REACTOME INHIBITION OF REPLICATION INITIATION OF DAMAGED DNA BY RB1 E2F1 | Genes involved in Inhibition of replication initiation of damaged DNA by RB1/E2F1 |
| 0.7 | 12.3 | REACTOME FORMATION OF THE TERNARY COMPLEX AND SUBSEQUENTLY THE 43S COMPLEX | Genes involved in Formation of the ternary complex, and subsequently, the 43S complex |
| 0.7 | 12.1 | REACTOME METABOLISM OF PORPHYRINS | Genes involved in Metabolism of porphyrins |
| 0.7 | 1.4 | REACTOME SEMA3A PAK DEPENDENT AXON REPULSION | Genes involved in Sema3A PAK dependent Axon repulsion |
| 0.7 | 25.7 | REACTOME RNA POL II TRANSCRIPTION PRE INITIATION AND PROMOTER OPENING | Genes involved in RNA Polymerase II Transcription Pre-Initiation And Promoter Opening |
| 0.7 | 2.1 | REACTOME TRANSFERRIN ENDOCYTOSIS AND RECYCLING | Genes involved in Transferrin endocytosis and recycling |
| 0.7 | 49.8 | REACTOME MITOTIC PROMETAPHASE | Genes involved in Mitotic Prometaphase |
| 0.7 | 11.2 | REACTOME RESOLUTION OF AP SITES VIA THE SINGLE NUCLEOTIDE REPLACEMENT PATHWAY | Genes involved in Resolution of AP sites via the single-nucleotide replacement pathway |
| 0.7 | 8.5 | REACTOME TANDEM PORE DOMAIN POTASSIUM CHANNELS | Genes involved in Tandem pore domain potassium channels |
| 0.6 | 3.2 | REACTOME FORMATION OF THE HIV1 EARLY ELONGATION COMPLEX | Genes involved in Formation of the HIV-1 Early Elongation Complex |
| 0.6 | 114.1 | REACTOME ANTIGEN PROCESSING UBIQUITINATION PROTEASOME DEGRADATION | Genes involved in Antigen processing: Ubiquitination & Proteasome degradation |
| 0.6 | 17.4 | REACTOME LIGAND GATED ION CHANNEL TRANSPORT | Genes involved in Ligand-gated ion channel transport |
| 0.6 | 7.3 | REACTOME RNA POL I TRANSCRIPTION INITIATION | Genes involved in RNA Polymerase I Transcription Initiation |
| 0.6 | 3.5 | REACTOME OLFACTORY SIGNALING PATHWAY | Genes involved in Olfactory Signaling Pathway |
| 0.6 | 8.4 | REACTOME REGULATION OF INSULIN LIKE GROWTH FACTOR IGF ACTIVITY BY INSULIN LIKE GROWTH FACTOR BINDING PROTEINS IGFBPS | Genes involved in Regulation of Insulin-like Growth Factor (IGF) Activity by Insulin-like Growth Factor Binding Proteins (IGFBPs) |
| 0.5 | 8.5 | REACTOME DOWNREGULATION OF SMAD2 3 SMAD4 TRANSCRIPTIONAL ACTIVITY | Genes involved in Downregulation of SMAD2/3:SMAD4 transcriptional activity |
| 0.5 | 6.2 | REACTOME G0 AND EARLY G1 | Genes involved in G0 and Early G1 |
| 0.5 | 1.0 | REACTOME P53 INDEPENDENT G1 S DNA DAMAGE CHECKPOINT | Genes involved in p53-Independent G1/S DNA damage checkpoint |
| 0.5 | 20.2 | REACTOME TRANSLATION | Genes involved in Translation |
| 0.5 | 1.0 | REACTOME MRNA CAPPING | Genes involved in mRNA Capping |
| 0.5 | 25.2 | REACTOME VOLTAGE GATED POTASSIUM CHANNELS | Genes involved in Voltage gated Potassium channels |
| 0.5 | 10.4 | REACTOME PEROXISOMAL LIPID METABOLISM | Genes involved in Peroxisomal lipid metabolism |
| 0.5 | 2.3 | REACTOME TRANSPORT OF MATURE MRNA DERIVED FROM AN INTRONLESS TRANSCRIPT | Genes involved in Transport of Mature mRNA Derived from an Intronless Transcript |
| 0.4 | 5.7 | REACTOME AMINE DERIVED HORMONES | Genes involved in Amine-derived hormones |
| 0.4 | 6.5 | REACTOME CREB PHOSPHORYLATION THROUGH THE ACTIVATION OF CAMKII | Genes involved in CREB phosphorylation through the activation of CaMKII |
| 0.4 | 4.0 | REACTOME P75NTR RECRUITS SIGNALLING COMPLEXES | Genes involved in p75NTR recruits signalling complexes |
| 0.4 | 5.7 | REACTOME SYNTHESIS OF PC | Genes involved in Synthesis of PC |
| 0.4 | 1.5 | REACTOME INFLUENZA VIRAL RNA TRANSCRIPTION AND REPLICATION | Genes involved in Influenza Viral RNA Transcription and Replication |
| 0.4 | 6.0 | REACTOME ACYL CHAIN REMODELLING OF PI | Genes involved in Acyl chain remodelling of PI |
| 0.3 | 6.6 | REACTOME SYNTHESIS AND INTERCONVERSION OF NUCLEOTIDE DI AND TRIPHOSPHATES | Genes involved in Synthesis and interconversion of nucleotide di- and triphosphates |
| 0.3 | 6.9 | REACTOME SIGNALING BY FGFR1 FUSION MUTANTS | Genes involved in Signaling by FGFR1 fusion mutants |
| 0.3 | 7.4 | REACTOME PTM GAMMA CARBOXYLATION HYPUSINE FORMATION AND ARYLSULFATASE ACTIVATION | Genes involved in PTM: gamma carboxylation, hypusine formation and arylsulfatase activation |
| 0.3 | 4.3 | REACTOME ACTIVATION OF THE AP1 FAMILY OF TRANSCRIPTION FACTORS | Genes involved in Activation of the AP-1 family of transcription factors |
| 0.3 | 4.8 | REACTOME INTRINSIC PATHWAY | Genes involved in Intrinsic Pathway |
| 0.3 | 1.7 | REACTOME MEMBRANE BINDING AND TARGETTING OF GAG PROTEINS | Genes involved in Membrane binding and targetting of GAG proteins |
| 0.3 | 9.3 | REACTOME MYOGENESIS | Genes involved in Myogenesis |
| 0.3 | 2.2 | REACTOME ACTIVATED AMPK STIMULATES FATTY ACID OXIDATION IN MUSCLE | Genes involved in Activated AMPK stimulates fatty-acid oxidation in muscle |
| 0.3 | 7.4 | REACTOME DEGRADATION OF THE EXTRACELLULAR MATRIX | Genes involved in Degradation of the extracellular matrix |
| 0.3 | 3.9 | REACTOME SIGNALING BY NODAL | Genes involved in Signaling by NODAL |
| 0.3 | 5.5 | REACTOME FANCONI ANEMIA PATHWAY | Genes involved in Fanconi Anemia pathway |
| 0.2 | 4.3 | REACTOME DARPP 32 EVENTS | Genes involved in DARPP-32 events |
| 0.2 | 1.8 | REACTOME REGULATORY RNA PATHWAYS | Genes involved in Regulatory RNA pathways |
| 0.2 | 6.9 | REACTOME AMINE COMPOUND SLC TRANSPORTERS | Genes involved in Amine compound SLC transporters |
| 0.2 | 1.3 | REACTOME INTEGRATION OF PROVIRUS | Genes involved in Integration of provirus |
| 0.2 | 3.8 | REACTOME GAP JUNCTION ASSEMBLY | Genes involved in Gap junction assembly |
| 0.2 | 1.1 | REACTOME DESTABILIZATION OF MRNA BY AUF1 HNRNP D0 | Genes involved in Destabilization of mRNA by AUF1 (hnRNP D0) |
| 0.2 | 1.5 | REACTOME ANDROGEN BIOSYNTHESIS | Genes involved in Androgen biosynthesis |
| 0.2 | 1.4 | REACTOME REGULATION OF ORNITHINE DECARBOXYLASE ODC | Genes involved in Regulation of ornithine decarboxylase (ODC) |
| 0.2 | 3.2 | REACTOME NEGATIVE REGULATORS OF RIG I MDA5 SIGNALING | Genes involved in Negative regulators of RIG-I/MDA5 signaling |
| 0.2 | 2.6 | REACTOME HOMOLOGOUS RECOMBINATION REPAIR OF REPLICATION INDEPENDENT DOUBLE STRAND BREAKS | Genes involved in Homologous recombination repair of replication-independent double-strand breaks |
| 0.2 | 1.6 | REACTOME ETHANOL OXIDATION | Genes involved in Ethanol oxidation |
| 0.2 | 1.7 | REACTOME SIGNALING BY CONSTITUTIVELY ACTIVE EGFR | Genes involved in Signaling by constitutively active EGFR |
| 0.2 | 3.9 | REACTOME TRNA AMINOACYLATION | Genes involved in tRNA Aminoacylation |
| 0.2 | 4.2 | REACTOME ANTIVIRAL MECHANISM BY IFN STIMULATED GENES | Genes involved in Antiviral mechanism by IFN-stimulated genes |
| 0.2 | 2.5 | REACTOME GLUCAGON TYPE LIGAND RECEPTORS | Genes involved in Glucagon-type ligand receptors |
| 0.2 | 0.8 | REACTOME TRAF6 MEDIATED IRF7 ACTIVATION IN TLR7 8 OR 9 SIGNALING | Genes involved in TRAF6 mediated IRF7 activation in TLR7/8 or 9 signaling |
| 0.1 | 3.1 | REACTOME PIP3 ACTIVATES AKT SIGNALING | Genes involved in PIP3 activates AKT signaling |
| 0.1 | 0.6 | REACTOME FGFR4 LIGAND BINDING AND ACTIVATION | Genes involved in FGFR4 ligand binding and activation |
| 0.1 | 1.8 | REACTOME PROCESSING OF CAPPED INTRONLESS PRE MRNA | Genes involved in Processing of Capped Intronless Pre-mRNA |
| 0.1 | 2.0 | REACTOME PRE NOTCH PROCESSING IN GOLGI | Genes involved in Pre-NOTCH Processing in Golgi |
| 0.1 | 0.6 | REACTOME THROMBOXANE SIGNALLING THROUGH TP RECEPTOR | Genes involved in Thromboxane signalling through TP receptor |
| 0.1 | 1.2 | REACTOME ACYL CHAIN REMODELLING OF PC | Genes involved in Acyl chain remodelling of PC |
| 0.1 | 1.9 | REACTOME CLASS C 3 METABOTROPIC GLUTAMATE PHEROMONE RECEPTORS | Genes involved in Class C/3 (Metabotropic glutamate/pheromone receptors) |
| 0.1 | 1.1 | REACTOME TRAF3 DEPENDENT IRF ACTIVATION PATHWAY | Genes involved in TRAF3-dependent IRF activation pathway |
| 0.1 | 1.6 | REACTOME RNA POL I RNA POL III AND MITOCHONDRIAL TRANSCRIPTION | Genes involved in RNA Polymerase I, RNA Polymerase III, and Mitochondrial Transcription |
| 0.1 | 0.4 | REACTOME DSCAM INTERACTIONS | Genes involved in DSCAM interactions |
| 0.0 | 0.5 | REACTOME BILE SALT AND ORGANIC ANION SLC TRANSPORTERS | Genes involved in Bile salt and organic anion SLC transporters |
| 0.0 | 2.7 | REACTOME NUCLEAR RECEPTOR TRANSCRIPTION PATHWAY | Genes involved in Nuclear Receptor transcription pathway |
| 0.0 | 0.3 | REACTOME TRYPTOPHAN CATABOLISM | Genes involved in Tryptophan catabolism |
| 0.0 | 0.1 | REACTOME CREATION OF C4 AND C2 ACTIVATORS | Genes involved in Creation of C4 and C2 activators |