Project
GSE53960: rat RNA-Seq transcriptomic Bodymap
Navigation
Downloads
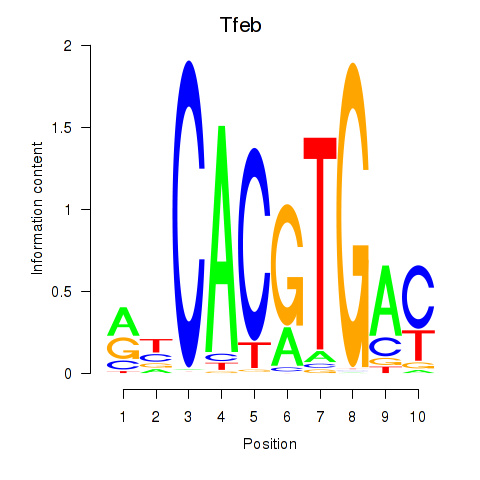
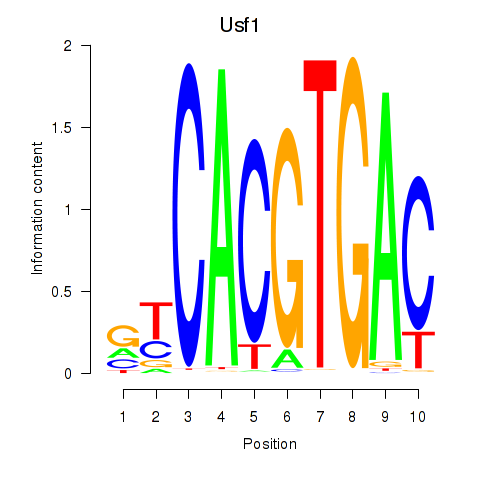
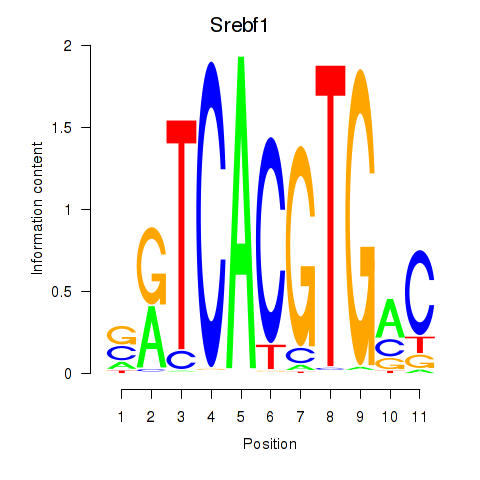
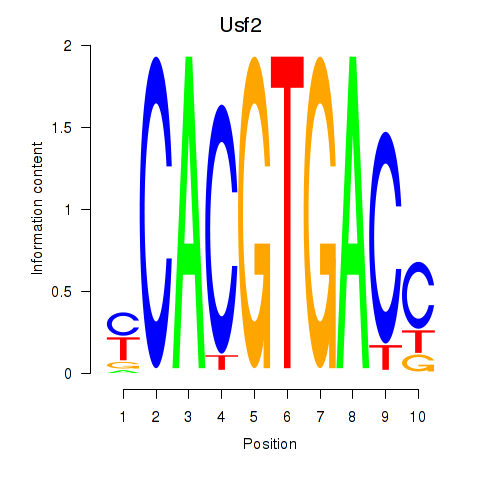
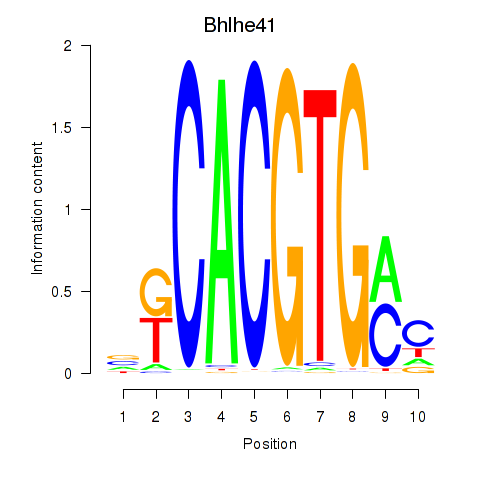
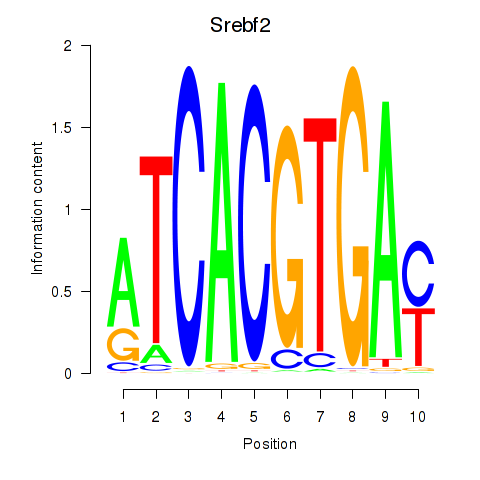
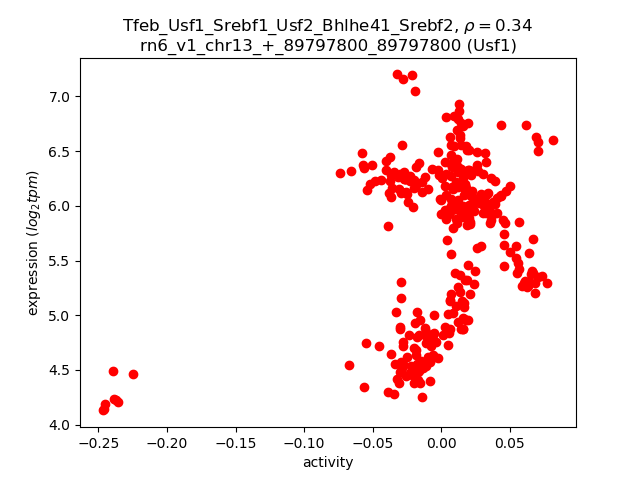
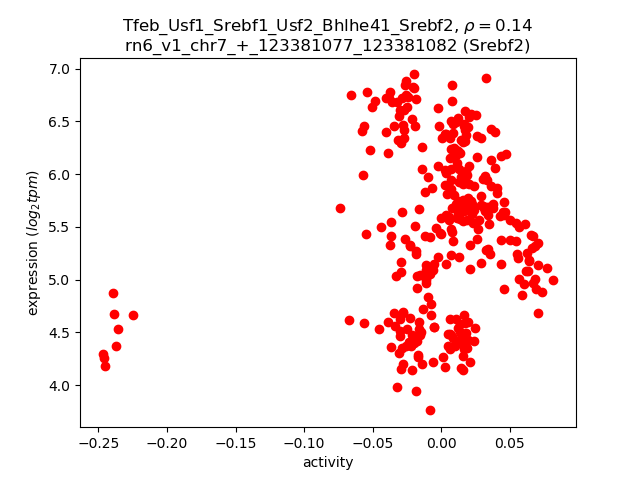
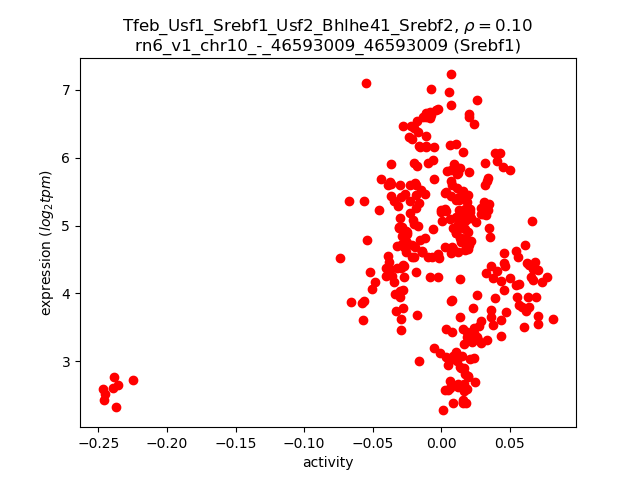
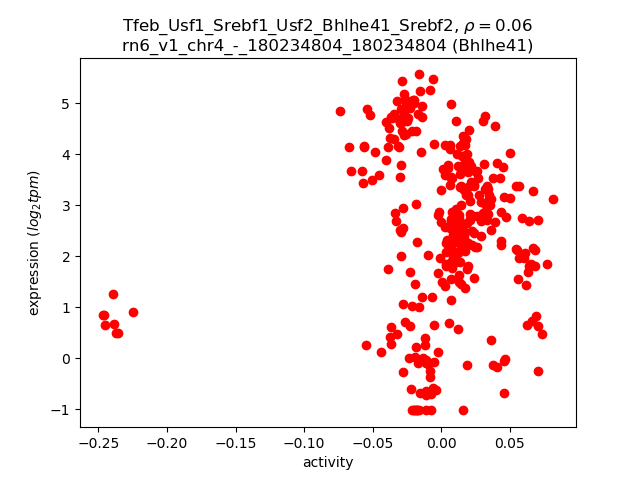
Results for Tfeb_Usf1_Srebf1_Usf2_Bhlhe41_Srebf2
Z-value: 1.15
Motif logo
Transcription factors associated with Tfeb_Usf1_Srebf1_Usf2_Bhlhe41_Srebf2
| Gene Symbol | Gene ID | Gene Info |
|---|---|---|
|
Tfeb
|
ENSRNOG00000014666 | transcription factor EB |
|
Usf1
|
ENSRNOG00000004255 | upstream transcription factor 1 |
|
Srebf1
|
ENSRNOG00000003463 | sterol regulatory element binding transcription factor 1 |
|
Usf2
|
ENSRNOG00000053725 | upstream transcription factor 2, c-fos interacting |
|
Bhlhe41
|
ENSRNOG00000048961 | basic helix-loop-helix family, member e41 |
|
Srebf2
|
ENSRNOG00000007400 | sterol regulatory element binding transcription factor 2 |
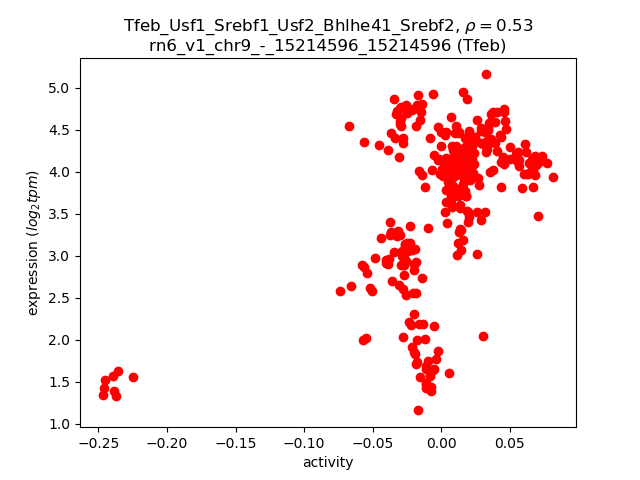
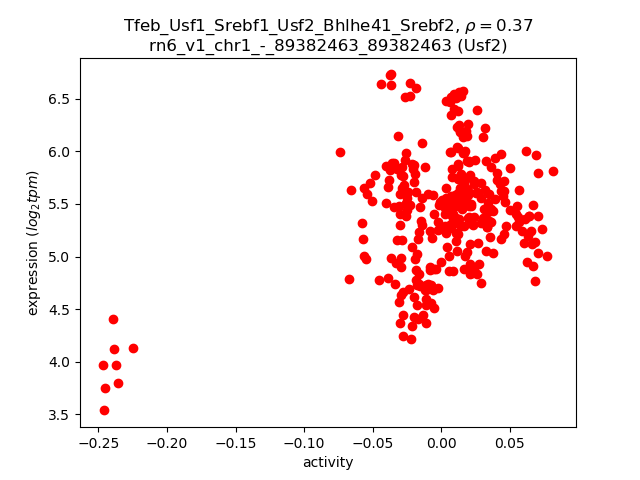
Activity-expression correlation:
| Gene | Promoter | Pearson corr. coef. | P-value | Plot |
|---|---|---|---|---|
| Tfeb | rn6_v1_chr9_-_15214596_15214596 | 0.53 | 3.0e-24 | Click! |
| Usf2 | rn6_v1_chr1_-_89382463_89382463 | 0.37 | 1.2e-11 | Click! |
| Usf1 | rn6_v1_chr13_+_89797800_89797800 | 0.34 | 2.5e-10 | Click! |
| Srebf2 | rn6_v1_chr7_+_123381077_123381082 | 0.14 | 1.5e-02 | Click! |
| Srebf1 | rn6_v1_chr10_-_46593009_46593009 | 0.10 | 7.3e-02 | Click! |
| Bhlhe41 | rn6_v1_chr4_-_180234804_180234804 | 0.06 | 3.1e-01 | Click! |
Activity profile of Tfeb_Usf1_Srebf1_Usf2_Bhlhe41_Srebf2 motif
Sorted Z-values of Tfeb_Usf1_Srebf1_Usf2_Bhlhe41_Srebf2 motif
| Promoter | Log-likelihood | Transcript | Gene | Gene Info |
|---|---|---|---|---|
| chr3_+_161298962 | 113.24 |
ENSRNOT00000066028
|
Ctsa
|
cathepsin A |
| chr10_+_84135116 | 81.58 |
ENSRNOT00000031035
|
Hoxb7
|
homeo box B7 |
| chr3_-_161299024 | 64.76 |
ENSRNOT00000021216
|
Neurl2
|
neuralized E3 ubiquitin protein ligase 2 |
| chr7_+_65616177 | 59.56 |
ENSRNOT00000006566
|
Gns
|
glucosamine (N-acetyl)-6-sulfatase |
| chr5_-_164844586 | 59.26 |
ENSRNOT00000011287
|
Clcn6
|
chloride voltage-gated channel 6 |
| chr7_+_63467216 | 51.95 |
ENSRNOT00000064349
|
LOC100909505
|
N-acetylglucosamine-6-sulfatase-like |
| chr1_+_48176106 | 50.58 |
ENSRNOT00000021840
|
Igf2r
|
insulin-like growth factor 2 receptor |
| chr10_-_13536899 | 49.83 |
ENSRNOT00000008537
|
Amdhd2
|
amidohydrolase domain containing 2 |
| chr10_+_56610051 | 43.01 |
ENSRNOT00000024348
|
Dvl2
|
dishevelled segment polarity protein 2 |
| chrX_-_105417323 | 40.88 |
ENSRNOT00000015494
|
Gla
|
galactosidase, alpha |
| chrX_+_134979646 | 40.64 |
ENSRNOT00000006035
|
Sash3
|
SAM and SH3 domain containing 3 |
| chr16_-_81706664 | 39.73 |
ENSRNOT00000026580
|
Lamp1
|
lysosomal-associated membrane protein 1 |
| chr9_-_82345262 | 39.05 |
ENSRNOT00000024975
|
Cnppd1
|
cyclin Pas1/PHO80 domain containing 1 |
| chr14_-_84189266 | 38.41 |
ENSRNOT00000005934
|
Tcn2
|
transcobalamin 2 |
| chr7_-_121058029 | 37.92 |
ENSRNOT00000068033
|
Cbx6
|
chromobox 6 |
| chr13_+_70174936 | 37.26 |
ENSRNOT00000064068
ENSRNOT00000079861 ENSRNOT00000092562 |
Arpc5
|
actin related protein 2/3 complex, subunit 5 |
| chr7_-_12741296 | 37.23 |
ENSRNOT00000060648
|
Arhgap45
|
Rho GTPase activating protein 45 |
| chr19_-_601469 | 36.04 |
ENSRNOT00000016462
|
Pdp2
|
pyruvate dehyrogenase phosphatase catalytic subunit 2 |
| chr2_+_164747677 | 35.58 |
ENSRNOT00000018489
|
Mfsd1
|
major facilitator superfamily domain containing 1 |
| chr1_+_166991474 | 35.30 |
ENSRNOT00000027150
|
LOC100361543
|
RhoA activator C11orf59-like |
| chr17_-_1879279 | 30.03 |
ENSRNOT00000025462
|
Ctsl
|
cathepsin L |
| chr7_-_67116980 | 29.85 |
ENSRNOT00000005798
|
Ppm1h
|
protein phosphatase, Mg2+/Mn2+ dependent, 1H |
| chr13_-_70174565 | 29.41 |
ENSRNOT00000067135
|
Rgl1
|
ral guanine nucleotide dissociation stimulator,-like 1 |
| chr5_+_90800082 | 28.99 |
ENSRNOT00000093696
ENSRNOT00000093206 |
Kdm4c
|
lysine demethylase 4C |
| chr6_+_135724455 | 28.91 |
ENSRNOT00000012469
|
Amn
|
amnion associated transmembrane protein |
| chr2_+_187697523 | 28.57 |
ENSRNOT00000026153
|
Glmp
|
glycosylated lysosomal membrane protein |
| chr5_-_147784311 | 28.13 |
ENSRNOT00000074172
|
Fam167b
|
family with sequence similarity 167, member B |
| chr2_+_188489362 | 28.01 |
ENSRNOT00000027815
|
Clk2
|
CDC-like kinase 2 |
| chr1_-_101457126 | 27.82 |
ENSRNOT00000087061
ENSRNOT00000028328 |
Bax
|
BCL2 associated X, apoptosis regulator |
| chr20_+_46250363 | 27.23 |
ENSRNOT00000076522
ENSRNOT00000000334 |
Cd164
|
CD164 molecule |
| chr1_+_103172987 | 26.71 |
ENSRNOT00000018688
|
Tmem86a
|
transmembrane protein 86A |
| chr16_+_20426566 | 26.53 |
ENSRNOT00000026225
|
Ifi30
|
IFI30, lysosomal thiol reductase |
| chr19_-_38120578 | 26.49 |
ENSRNOT00000026873
|
Esrp2
|
epithelial splicing regulatory protein 2 |
| chr12_+_2054680 | 26.38 |
ENSRNOT00000001290
|
Mcoln1
|
mucolipin 1 |
| chr4_-_82271893 | 26.29 |
ENSRNOT00000075005
|
Hoxa7
|
homeobox A7 |
| chr7_+_13062196 | 26.15 |
ENSRNOT00000000193
|
Plpp2
|
phospholipid phosphatase 2 |
| chr3_+_61604672 | 25.91 |
ENSRNOT00000080456
|
Hoxd11
|
homeobox D11 |
| chrX_-_54303729 | 25.91 |
ENSRNOT00000087919
ENSRNOT00000064340 ENSRNOT00000051249 ENSRNOT00000087547 |
Gk
|
glycerol kinase |
| chr1_-_32140136 | 25.83 |
ENSRNOT00000081339
ENSRNOT00000022635 |
Slc12a7
|
solute carrier family 12 member 7 |
| chr18_+_71395830 | 25.50 |
ENSRNOT00000024831
|
Smad7
|
SMAD family member 7 |
| chr2_-_33841499 | 25.27 |
ENSRNOT00000040533
|
Srek1
|
splicing regulatory glutamic acid and lysine rich protein 1 |
| chr5_-_79691258 | 24.96 |
ENSRNOT00000072920
|
Tnfsf8
|
tumor necrosis factor superfamily member 8 |
| chr8_+_23014956 | 24.89 |
ENSRNOT00000018009
|
Prkcsh
|
protein kinase C substrate 80K-H |
| chr6_+_26587443 | 24.44 |
ENSRNOT00000034207
|
Mpv17
|
MpV17 mitochondrial inner membrane protein |
| chrX_-_156399760 | 24.40 |
ENSRNOT00000086921
|
Fam50a
|
family with sequence similarity 50, member A |
| chr4_-_140220487 | 24.28 |
ENSRNOT00000009008
|
Sumf1
|
sulfatase modifying factor 1 |
| chr11_-_68197772 | 24.16 |
ENSRNOT00000003060
ENSRNOT00000081875 |
Hspbap1
|
Hspb associated protein 1 |
| chr8_+_117117430 | 24.15 |
ENSRNOT00000073247
|
Gpx1
|
glutathione peroxidase 1 |
| chr4_-_82186190 | 24.10 |
ENSRNOT00000071729
|
LOC100911622
|
homeobox protein Hox-A7-like |
| chr17_-_67904674 | 23.70 |
ENSRNOT00000078532
|
Klf6
|
Kruppel-like factor 6 |
| chr3_+_61613774 | 23.61 |
ENSRNOT00000002148
|
Hoxd10
|
homeo box D10 |
| chr6_-_55001464 | 23.60 |
ENSRNOT00000006618
|
Ahr
|
aryl hydrocarbon receptor |
| chr15_+_46316741 | 23.49 |
ENSRNOT00000014177
|
Ctsb
|
cathepsin B |
| chr14_+_63095720 | 23.06 |
ENSRNOT00000006071
|
Ppargc1a
|
PPARG coactivator 1 alpha |
| chr19_-_55423052 | 22.50 |
ENSRNOT00000019528
ENSRNOT00000079641 |
Galns
|
galactosamine (N-acetyl)-6-sulfatase |
| chr12_-_14175945 | 22.41 |
ENSRNOT00000001469
|
Ap5z1
|
adaptor-related protein complex 5, zeta 1 subunit |
| chr10_+_16970626 | 22.03 |
ENSRNOT00000005383
|
Dusp1
|
dual specificity phosphatase 1 |
| chr1_-_22625204 | 21.99 |
ENSRNOT00000021694
|
Vnn1
|
vanin 1 |
| chr3_+_28627084 | 21.59 |
ENSRNOT00000049884
|
Arhgap15
|
Rho GTPase activating protein 15 |
| chr10_-_56850085 | 21.53 |
ENSRNOT00000025767
|
Rnasek
|
ribonuclease K |
| chr4_+_78694447 | 21.32 |
ENSRNOT00000011945
|
Gpnmb
|
glycoprotein nmb |
| chr9_-_37144015 | 21.26 |
ENSRNOT00000015638
|
Phf3
|
PHD finger protein 3 |
| chr10_+_106785077 | 21.21 |
ENSRNOT00000075047
|
Tmc8
|
transmembrane channel-like 8 |
| chrX_-_10413984 | 21.20 |
ENSRNOT00000039551
ENSRNOT00000091448 |
Ddx3x
|
DEAD-box helicase 3, X-linked |
| chr11_+_73936750 | 21.07 |
ENSRNOT00000002350
|
Atp13a3
|
ATPase 13A3 |
| chr8_-_94922017 | 20.78 |
ENSRNOT00000083934
|
Cep162
|
centrosomal protein 162 |
| chr5_-_164898420 | 20.65 |
ENSRNOT00000011747
|
Agtrap
|
angiotensin II receptor-associated protein |
| chr8_+_50310405 | 20.59 |
ENSRNOT00000073507
|
Sik3
|
SIK family kinase 3 |
| chr19_-_55257876 | 20.46 |
ENSRNOT00000017564
|
Cyba
|
cytochrome b-245 alpha chain |
| chr5_+_78120607 | 20.44 |
ENSRNOT00000019379
|
Slc31a2
|
solute carrier family 31 member 2 |
| chr17_+_10463303 | 20.40 |
ENSRNOT00000060822
|
Rnf44
|
ring finger protein 44 |
| chr1_-_215553451 | 20.22 |
ENSRNOT00000027407
|
Ctsd
|
cathepsin D |
| chr12_-_48365784 | 20.21 |
ENSRNOT00000077317
|
Dao
|
D-amino-acid oxidase |
| chr1_-_260254600 | 20.21 |
ENSRNOT00000019014
|
Blnk
|
B-cell linker |
| chr10_+_84167331 | 20.21 |
ENSRNOT00000010965
|
Hoxb4
|
homeo box B4 |
| chr3_-_2573387 | 20.09 |
ENSRNOT00000017271
|
Dpp7
|
dipeptidylpeptidase 7 |
| chr8_-_23146689 | 19.96 |
ENSRNOT00000092200
|
Acp5
|
acid phosphatase 5, tartrate resistant |
| chr19_-_37525762 | 19.70 |
ENSRNOT00000023606
|
Atp6v0d1
|
ATPase H+ transporting V0 subunit D1 |
| chr10_+_47961056 | 19.64 |
ENSRNOT00000027312
|
Fam83g
|
family with sequence similarity 83, member G |
| chr19_+_9622611 | 19.53 |
ENSRNOT00000061498
|
Slc38a7
|
solute carrier family 38, member 7 |
| chr20_-_5533448 | 19.41 |
ENSRNOT00000000568
|
Cuta
|
cutA divalent cation tolerance homolog |
| chr4_-_82194927 | 19.27 |
ENSRNOT00000072302
|
LOC103692128
|
homeobox protein Hox-A9 |
| chr7_+_2737765 | 18.99 |
ENSRNOT00000004895
|
Cnpy2
|
canopy FGF signaling regulator 2 |
| chr10_-_14215957 | 18.73 |
ENSRNOT00000019767
|
Fahd1
|
fumarylacetoacetate hydrolase domain containing 1 |
| chr2_-_259898525 | 18.71 |
ENSRNOT00000082253
|
St6galnac3
|
ST6 N-acetylgalactosaminide alpha-2,6-sialyltransferase 3 |
| chr3_+_72238981 | 18.68 |
ENSRNOT00000011006
|
Slc43a1
|
solute carrier family 43 member 1 |
| chr1_+_154377447 | 18.67 |
ENSRNOT00000084268
ENSRNOT00000092086 ENSRNOT00000091470 ENSRNOT00000025415 |
Picalm
|
phosphatidylinositol binding clathrin assembly protein |
| chr6_-_3794489 | 18.54 |
ENSRNOT00000087891
ENSRNOT00000011000 ENSRNOT00000084499 |
Thumpd2
|
THUMP domain containing 2 |
| chr12_+_23544287 | 18.53 |
ENSRNOT00000001938
|
Orai2
|
ORAI calcium release-activated calcium modulator 2 |
| chr10_+_90376933 | 18.46 |
ENSRNOT00000028557
|
Grn
|
granulin precursor |
| chr1_-_73660593 | 18.43 |
ENSRNOT00000038802
|
Lilra5
|
leukocyte immunoglobulin-like receptor, subfamily A (with TM domain), member 5 |
| chr1_-_282170017 | 18.27 |
ENSRNOT00000066947
|
Eif3a
|
eukaryotic translation initiation factor 3, subunit A |
| chr6_+_86785771 | 18.07 |
ENSRNOT00000066702
|
Prpf39
|
pre-mRNA processing factor 39 |
| chr1_-_170594168 | 18.07 |
ENSRNOT00000026280
|
Tpp1
|
tripeptidyl peptidase 1 |
| chr10_-_4644570 | 18.04 |
ENSRNOT00000088279
|
Snn
|
stannin |
| chr17_+_9837402 | 18.04 |
ENSRNOT00000076436
|
Rab24
|
RAB24, member RAS oncogene family |
| chr1_+_144601410 | 17.97 |
ENSRNOT00000047408
|
Efl1
|
elongation factor like GTPase 1 |
| chr1_-_100537377 | 17.94 |
ENSRNOT00000026599
|
Spib
|
Spi-B transcription factor |
| chr4_-_120840111 | 17.93 |
ENSRNOT00000022231
|
Mcm2
|
minichromosome maintenance complex component 2 |
| chr12_+_22451596 | 17.81 |
ENSRNOT00000072838
|
Trip6
|
thyroid hormone receptor interactor 6 |
| chr2_+_93792601 | 17.58 |
ENSRNOT00000014701
ENSRNOT00000077311 |
Fabp4
|
fatty acid binding protein 4 |
| chr5_-_138470096 | 17.50 |
ENSRNOT00000011392
|
Ppcs
|
phosphopantothenoylcysteine synthetase |
| chr1_+_154377247 | 17.34 |
ENSRNOT00000092945
|
Picalm
|
phosphatidylinositol binding clathrin assembly protein |
| chr1_-_80544825 | 17.13 |
ENSRNOT00000057802
ENSRNOT00000040060 ENSRNOT00000067049 ENSRNOT00000052387 ENSRNOT00000073352 |
Relb
|
RELB proto-oncogene, NF-kB subunit |
| chr3_+_113415774 | 17.11 |
ENSRNOT00000056151
|
Serf2
|
small EDRK-rich factor 2 |
| chr10_+_90377103 | 17.09 |
ENSRNOT00000040472
|
Grn
|
granulin precursor |
| chr8_-_104995725 | 17.05 |
ENSRNOT00000037120
|
Slc25a36
|
solute carrier family 25 member 36 |
| chr19_+_26022849 | 17.04 |
ENSRNOT00000014887
|
Dnase2
|
deoxyribonuclease 2, lysosomal |
| chr1_-_222495382 | 17.02 |
ENSRNOT00000028759
|
Naa40
|
N(alpha)-acetyltransferase 40, NatD catalytic subunit |
| chr9_-_61690956 | 16.81 |
ENSRNOT00000066589
|
Hspd1
|
heat shock protein family D member 1 |
| chr12_+_16340922 | 16.71 |
ENSRNOT00000001696
|
Snx8
|
sorting nexin 8 |
| chrX_+_16170576 | 16.67 |
ENSRNOT00000003895
|
Clcn5
|
chloride voltage-gated channel 5 |
| chr2_-_104830898 | 16.65 |
ENSRNOT00000050440
|
Hps3
|
Hermansky-Pudlak syndrome 3 |
| chr1_-_219450451 | 16.50 |
ENSRNOT00000025317
|
Rad9a
|
RAD9 checkpoint clamp component A |
| chr10_-_62287189 | 16.41 |
ENSRNOT00000004365
|
Wdr81
|
WD repeat domain 81 |
| chr2_+_188516582 | 16.34 |
ENSRNOT00000074727
|
Gba
|
glucosylceramidase beta |
| chr2_+_266315036 | 16.20 |
ENSRNOT00000055245
|
Wls
|
wntless Wnt ligand secretion mediator |
| chr5_-_50362344 | 16.19 |
ENSRNOT00000035808
|
Zfp292
|
zinc finger protein 292 |
| chr2_-_178616719 | 15.96 |
ENSRNOT00000078610
|
Tmem144
|
transmembrane protein 144 |
| chr17_-_9837293 | 15.94 |
ENSRNOT00000091320
ENSRNOT00000022134 |
Prelid1
|
PRELI domain containing 1 |
| chr11_-_38457373 | 15.87 |
ENSRNOT00000041177
|
Zfp295
|
zinc finger protein 295 |
| chr8_-_121973125 | 15.85 |
ENSRNOT00000012114
|
Pdcd6ip
|
programmed cell death 6 interacting protein |
| chr2_-_52282548 | 15.84 |
ENSRNOT00000033627
|
Nnt
|
nicotinamide nucleotide transhydrogenase |
| chr20_-_5533600 | 15.83 |
ENSRNOT00000072319
|
Cuta
|
cutA divalent cation tolerance homolog |
| chr5_+_145138697 | 15.69 |
ENSRNOT00000019135
|
Zmym6
|
zinc finger MYM-type containing 6 |
| chr10_+_88997399 | 15.61 |
ENSRNOT00000027116
|
Mlx
|
MLX, MAX dimerization protein |
| chr1_-_164101578 | 15.60 |
ENSRNOT00000022176
|
Uvrag
|
UV radiation resistance associated |
| chr5_-_166259069 | 15.57 |
ENSRNOT00000055572
|
Ube4b
|
ubiquitination factor E4B |
| chr9_-_88086488 | 15.55 |
ENSRNOT00000019579
|
Irs1
|
insulin receptor substrate 1 |
| chr3_-_175709465 | 15.53 |
ENSRNOT00000089971
|
Gata5
|
GATA binding protein 5 |
| chr10_+_29067102 | 15.44 |
ENSRNOT00000005161
|
C1qtnf2
|
C1q and tumor necrosis factor related protein 2 |
| chr15_-_43667029 | 15.35 |
ENSRNOT00000014798
|
Bnip3l
|
BCL2/adenovirus E1B interacting protein 3-like |
| chr8_-_115621394 | 15.32 |
ENSRNOT00000018995
|
Rbm15b
|
RNA binding motif protein 15B |
| chr3_-_94808861 | 15.20 |
ENSRNOT00000038464
|
Prrg4
|
proline rich and Gla domain 4 |
| chr1_-_228194977 | 15.15 |
ENSRNOT00000028535
|
Stx3
|
syntaxin 3 |
| chr15_-_32780603 | 15.13 |
ENSRNOT00000046980
|
Trdv5
|
T cell receptor delta variable 5 |
| chr2_-_104958034 | 15.12 |
ENSRNOT00000080699
|
Gyg1
|
glycogenin 1 |
| chr2_+_190007216 | 15.12 |
ENSRNOT00000015612
|
S100a6
|
S100 calcium binding protein A6 |
| chr10_+_76343847 | 15.04 |
ENSRNOT00000055674
|
Trim25
|
tripartite motif-containing 25 |
| chr13_+_109713489 | 15.03 |
ENSRNOT00000004962
|
Batf3
|
basic leucine zipper ATF-like transcription factor 3 |
| chrX_+_33599671 | 14.99 |
ENSRNOT00000006843
|
Txlng
|
taxilin gamma |
| chr19_-_24831500 | 14.95 |
ENSRNOT00000005770
|
Pkn1
|
protein kinase N1 |
| chr7_+_3332788 | 14.86 |
ENSRNOT00000010180
|
Cd63
|
Cd63 molecule |
| chr20_-_11737050 | 14.72 |
ENSRNOT00000001637
|
Sumo3
|
small ubiquitin-like modifier 3 |
| chr4_-_82215022 | 14.70 |
ENSRNOT00000010256
|
Hoxa11
|
homeobox A11 |
| chr6_-_26820959 | 14.58 |
ENSRNOT00000043572
|
Khk
|
ketohexokinase |
| chrX_-_123474154 | 14.56 |
ENSRNOT00000092415
ENSRNOT00000092455 |
RGD1564541
|
similar to hypothetical protein FLJ22965 |
| chr11_+_80255790 | 14.41 |
ENSRNOT00000002522
|
Bcl6
|
B-cell CLL/lymphoma 6 |
| chr2_-_53827175 | 14.40 |
ENSRNOT00000078158
|
RGD1305938
|
similar to expressed sequence AW549877 |
| chr7_+_144628120 | 14.37 |
ENSRNOT00000022247
|
Hoxc5
|
homeo box C5 |
| chr2_+_122690278 | 14.28 |
ENSRNOT00000086831
|
AABR07010085.1
|
|
| chr10_-_109811323 | 14.06 |
ENSRNOT00000054970
|
Mafg
|
MAF bZIP transcription factor G |
| chr5_-_171648327 | 14.06 |
ENSRNOT00000082847
|
Arhgef16
|
Rho guanine nucleotide exchange factor 16 |
| chr1_-_101123402 | 13.94 |
ENSRNOT00000027976
|
Rpl13a
|
|
| chr1_-_102849430 | 13.80 |
ENSRNOT00000086856
|
Saa4
|
serum amyloid A4 |
| chr2_-_195423787 | 13.80 |
ENSRNOT00000071603
|
LOC103689947
|
selenium-binding protein 1 |
| chr3_+_62481323 | 13.78 |
ENSRNOT00000078872
|
Hnrnpa3
|
heterogeneous nuclear ribonucleoprotein A3 |
| chr12_+_47590154 | 13.77 |
ENSRNOT00000045946
|
Git2
|
GIT ArfGAP 2 |
| chr10_-_82326771 | 13.75 |
ENSRNOT00000004673
|
Acsf2
|
acyl-CoA synthetase family member 2 |
| chr8_+_77107536 | 13.72 |
ENSRNOT00000083255
|
Adam10
|
ADAM metallopeptidase domain 10 |
| chr18_+_48132414 | 13.68 |
ENSRNOT00000050631
|
Snx2
|
sorting nexin 2 |
| chr2_-_196113149 | 13.54 |
ENSRNOT00000088465
|
Selenbp1
|
selenium binding protein 1 |
| chr8_+_81863619 | 13.49 |
ENSRNOT00000080608
|
Fam214a
|
family with sequence similarity 214, member A |
| chr5_-_160352927 | 13.38 |
ENSRNOT00000017247
|
Dnajc16
|
DnaJ heat shock protein family (Hsp40) member C16 |
| chr7_-_12673659 | 13.29 |
ENSRNOT00000091650
ENSRNOT00000041277 ENSRNOT00000044865 |
Ptbp1
|
polypyrimidine tract binding protein 1 |
| chr3_+_155297566 | 13.28 |
ENSRNOT00000021435
ENSRNOT00000084866 |
Dhx35
|
DEAH-box helicase 35 |
| chr5_-_159577134 | 13.25 |
ENSRNOT00000011114
|
Crocc
|
ciliary rootlet coiled-coil, rootletin |
| chr4_+_82214342 | 13.23 |
ENSRNOT00000066360
|
Hoxa11-as
|
homeobox A11, opposite strand |
| chr5_-_171648563 | 13.21 |
ENSRNOT00000072786
|
Arhgef16
|
Rho guanine nucleotide exchange factor 16 |
| chr1_-_13175876 | 13.13 |
ENSRNOT00000084870
|
Abracl
|
ABRA C-terminal like |
| chr9_+_16647598 | 13.02 |
ENSRNOT00000087413
|
Klc4
|
kinesin light chain 4 |
| chr4_+_82300778 | 12.94 |
ENSRNOT00000075254
|
Hoxa11-as
|
homeobox A11, opposite strand |
| chr7_+_141249044 | 12.83 |
ENSRNOT00000084911
|
Aqp5
|
aquaporin 5 |
| chr7_-_27213651 | 12.79 |
ENSRNOT00000077041
ENSRNOT00000076468 |
Tdg
|
thymine-DNA glycosylase |
| chr13_+_35554964 | 12.73 |
ENSRNOT00000072632
|
Tmem185b
|
transmembrane protein 185B |
| chr4_+_122365093 | 12.67 |
ENSRNOT00000024011
|
Klf15
|
Kruppel-like factor 15 |
| chr16_-_60427474 | 12.66 |
ENSRNOT00000051720
|
Ppp1r3b
|
protein phosphatase 1, regulatory subunit 3B |
| chr19_+_14508616 | 12.50 |
ENSRNOT00000019192
|
Hmox1
|
heme oxygenase 1 |
| chr10_-_74298599 | 12.45 |
ENSRNOT00000007379
|
Ypel2
|
yippee-like 2 |
| chr2_+_40000313 | 12.45 |
ENSRNOT00000014270
|
Depdc1b
|
DEP domain containing 1B |
| chr18_-_24397551 | 12.42 |
ENSRNOT00000023032
|
Slc25a46
|
solute carrier family 25, member 46 |
| chr5_+_150725654 | 12.42 |
ENSRNOT00000089852
ENSRNOT00000017740 |
Dnajc8
|
DnaJ heat shock protein family (Hsp40) member C8 |
| chr11_+_27364916 | 12.35 |
ENSRNOT00000002151
|
Bach1
|
BTB domain and CNC homolog 1 |
| chr8_+_70994563 | 12.30 |
ENSRNOT00000051504
ENSRNOT00000077163 |
Spg21
|
spastic paraplegia 21 homolog (human) |
| chr10_-_35927268 | 12.29 |
ENSRNOT00000004740
|
Rufy1
|
RUN and FYVE domain containing 1 |
| chrX_-_4945944 | 12.16 |
ENSRNOT00000077238
|
Kdm6a
|
lysine demethylase 6A |
| chr14_-_2056762 | 12.14 |
ENSRNOT00000000048
|
Idua
|
iduronidase, alpha-L- |
| chr16_+_2278701 | 12.13 |
ENSRNOT00000016233
|
Dennd6a
|
DENN domain containing 6A |
| chrX_+_106823491 | 12.13 |
ENSRNOT00000045997
|
Bex3
|
brain expressed X-linked 3 |
| chr7_+_41114697 | 12.06 |
ENSRNOT00000041354
|
Atp2b1
|
ATPase plasma membrane Ca2+ transporting 1 |
| chr10_-_76263866 | 11.97 |
ENSRNOT00000003219
|
Scpep1
|
serine carboxypeptidase 1 |
| chr4_-_82300503 | 11.94 |
ENSRNOT00000071568
|
Hoxa11
|
homeobox A11 |
| chr6_-_102472926 | 11.88 |
ENSRNOT00000079351
|
Zfyve26
|
zinc finger FYVE-type containing 26 |
| chr1_+_171820423 | 11.80 |
ENSRNOT00000047831
|
Ppfibp2
|
PPFIA binding protein 2 |
| chr7_-_140291620 | 11.80 |
ENSRNOT00000088323
|
Adcy6
|
adenylate cyclase 6 |
| chr9_-_41337498 | 11.78 |
ENSRNOT00000039480
|
Fam168b
|
family with sequence similarity 168, member B |
| chr15_-_60766579 | 11.67 |
ENSRNOT00000079978
|
Akap11
|
A-kinase anchoring protein 11 |
| chrX_+_77076106 | 11.51 |
ENSRNOT00000091527
ENSRNOT00000089381 |
Atp7a
|
ATPase copper transporting alpha |
| chr4_+_99937558 | 11.50 |
ENSRNOT00000050249
|
St3gal5
|
ST3 beta-galactoside alpha-2,3-sialyltransferase 5 |
| chr2_-_236395067 | 11.48 |
ENSRNOT00000014658
|
Hadh
|
hydroxyacyl-CoA dehydrogenase |
Network of associatons between targets according to the STRING database.

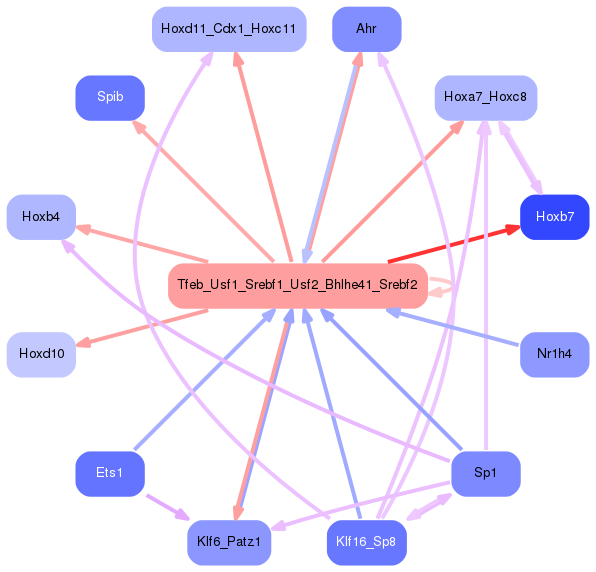
First level regulatory network of Tfeb_Usf1_Srebf1_Usf2_Bhlhe41_Srebf2
Gene Ontology Analysis
Gene overrepresentation in biological process category:
| Log-likelihood per target | Total log-likelihood | Term | Description |
|---|---|---|---|
| 18.9 | 113.2 | GO:1904714 | regulation of chaperone-mediated autophagy(GO:1904714) |
| 14.9 | 59.6 | GO:0042339 | keratan sulfate metabolic process(GO:0042339) |
| 13.5 | 67.3 | GO:0015889 | cobalamin transport(GO:0015889) |
| 13.2 | 39.7 | GO:0043323 | positive regulation of natural killer cell degranulation(GO:0043323) |
| 12.8 | 51.4 | GO:0019262 | N-acetylneuraminate catabolic process(GO:0019262) |
| 12.0 | 36.0 | GO:1902962 | regulation of aspartic-type endopeptidase activity involved in amyloid precursor protein catabolic process(GO:1902959) positive regulation of aspartic-type endopeptidase activity involved in amyloid precursor protein catabolic process(GO:1902961) regulation of metalloendopeptidase activity involved in amyloid precursor protein catabolic process(GO:1902962) negative regulation of metalloendopeptidase activity involved in amyloid precursor protein catabolic process(GO:1902963) regulation of aspartic-type peptidase activity(GO:1905245) positive regulation of aspartic-type peptidase activity(GO:1905247) |
| 9.3 | 9.3 | GO:1904586 | response to putrescine(GO:1904585) cellular response to putrescine(GO:1904586) |
| 9.3 | 27.8 | GO:0097296 | regulation of nitrogen utilization(GO:0006808) nitrogen utilization(GO:0019740) activation of cysteine-type endopeptidase activity involved in apoptotic signaling pathway(GO:0097296) regulation of mitochondrial membrane permeability involved in programmed necrotic cell death(GO:1902445) |
| 8.6 | 25.9 | GO:0046167 | glycerol-3-phosphate biosynthetic process(GO:0046167) |
| 8.0 | 24.1 | GO:0009609 | response to symbiotic bacterium(GO:0009609) |
| 8.0 | 64.0 | GO:0046477 | glycosylceramide catabolic process(GO:0046477) |
| 7.9 | 23.6 | GO:1902544 | regulation of DNA N-glycosylase activity(GO:1902544) |
| 7.7 | 23.1 | GO:1904638 | cellular response to nitrite(GO:0071250) response to nitrite(GO:0080033) response to resveratrol(GO:1904638) regulation of progesterone biosynthetic process(GO:2000182) |
| 7.5 | 37.5 | GO:0009758 | carbohydrate utilization(GO:0009758) |
| 7.2 | 43.0 | GO:0044340 | canonical Wnt signaling pathway involved in regulation of cell proliferation(GO:0044340) |
| 6.8 | 20.5 | GO:1904844 | response to L-glutamine(GO:1904844) cellular response to L-glutamine(GO:1904845) |
| 6.8 | 40.9 | GO:0032439 | endosome localization(GO:0032439) |
| 6.8 | 20.3 | GO:0042412 | taurine biosynthetic process(GO:0042412) |
| 6.7 | 20.2 | GO:0046416 | D-amino acid metabolic process(GO:0046416) |
| 6.7 | 26.9 | GO:0032763 | regulation of mast cell cytokine production(GO:0032763) |
| 6.5 | 19.5 | GO:0089709 | histidine transport(GO:0015817) L-histidine transmembrane transport(GO:0089709) L-histidine transport(GO:1902024) |
| 6.3 | 19.0 | GO:0045716 | positive regulation of low-density lipoprotein particle receptor biosynthetic process(GO:0045716) |
| 6.1 | 18.2 | GO:0043311 | positive regulation of eosinophil degranulation(GO:0043311) positive regulation of eosinophil activation(GO:1902568) |
| 5.9 | 17.8 | GO:0008588 | release of cytoplasmic sequestered NF-kappaB(GO:0008588) |
| 5.9 | 35.6 | GO:0001835 | blastocyst hatching(GO:0001835) hatching(GO:0035188) organism emergence from protective structure(GO:0071684) |
| 5.9 | 23.6 | GO:0040009 | regulation of growth rate(GO:0040009) |
| 5.7 | 17.0 | GO:0061357 | positive regulation of Wnt protein secretion(GO:0061357) |
| 5.6 | 16.8 | GO:0002840 | T cell mediated immune response to tumor cell(GO:0002424) regulation of T cell mediated immune response to tumor cell(GO:0002840) |
| 5.6 | 39.2 | GO:0042256 | mature ribosome assembly(GO:0042256) |
| 5.5 | 27.4 | GO:0042590 | antigen processing and presentation of exogenous peptide antigen via MHC class I(GO:0042590) |
| 5.3 | 37.2 | GO:0048102 | autophagic cell death(GO:0048102) |
| 5.3 | 15.8 | GO:0044837 | assembly of actomyosin apparatus involved in cytokinesis(GO:0000912) actomyosin contractile ring assembly(GO:0000915) actomyosin contractile ring organization(GO:0044837) |
| 5.3 | 15.8 | GO:0060764 | cell-cell signaling involved in mammary gland development(GO:0060764) |
| 5.2 | 15.5 | GO:1901420 | negative regulation of vitamin D receptor signaling pathway(GO:0070563) negative regulation of response to alcohol(GO:1901420) |
| 4.7 | 60.9 | GO:0060272 | embryonic skeletal joint morphogenesis(GO:0060272) |
| 4.7 | 4.7 | GO:0061034 | olfactory bulb mitral cell layer development(GO:0061034) |
| 4.6 | 4.6 | GO:0002397 | MHC class I protein complex assembly(GO:0002397) |
| 4.6 | 13.7 | GO:0051088 | PMA-inducible membrane protein ectodomain proteolysis(GO:0051088) |
| 4.6 | 18.3 | GO:0002188 | translation reinitiation(GO:0002188) |
| 4.4 | 13.3 | GO:0032053 | ciliary basal body organization(GO:0032053) positive regulation of protein localization to cilium(GO:1903566) |
| 4.1 | 12.4 | GO:0090149 | mitochondrial membrane fission(GO:0090149) |
| 4.1 | 37.3 | GO:0021769 | orbitofrontal cortex development(GO:0021769) |
| 4.1 | 8.2 | GO:0030043 | actin filament fragmentation(GO:0030043) |
| 4.1 | 16.4 | GO:0021615 | glossopharyngeal nerve morphogenesis(GO:0021615) |
| 4.1 | 4.1 | GO:0016240 | autophagosome docking(GO:0016240) |
| 4.1 | 32.6 | GO:1900113 | negative regulation of histone H3-K9 trimethylation(GO:1900113) |
| 4.0 | 12.1 | GO:2000049 | positive regulation of cell-cell adhesion mediated by cadherin(GO:2000049) |
| 4.0 | 20.2 | GO:0048539 | bone marrow development(GO:0048539) |
| 4.0 | 28.2 | GO:0045656 | negative regulation of monocyte differentiation(GO:0045656) |
| 3.9 | 15.6 | GO:0097680 | double-strand break repair via classical nonhomologous end joining(GO:0097680) |
| 3.9 | 15.6 | GO:0008626 | granzyme-mediated apoptotic signaling pathway(GO:0008626) |
| 3.8 | 11.4 | GO:1903774 | positive regulation of viral budding via host ESCRT complex(GO:1903774) |
| 3.8 | 11.3 | GO:0042822 | pyridoxal phosphate metabolic process(GO:0042822) |
| 3.6 | 25.5 | GO:2000317 | negative regulation of T-helper 17 type immune response(GO:2000317) negative regulation of T-helper 17 cell differentiation(GO:2000320) |
| 3.5 | 10.4 | GO:0003430 | growth plate cartilage chondrocyte growth(GO:0003430) |
| 3.4 | 23.7 | GO:0071409 | cellular response to cycloheximide(GO:0071409) |
| 3.3 | 9.9 | GO:0006552 | leucine catabolic process(GO:0006552) |
| 3.3 | 22.8 | GO:0006268 | DNA unwinding involved in DNA replication(GO:0006268) |
| 3.2 | 15.9 | GO:1901857 | positive regulation of cellular respiration(GO:1901857) |
| 3.2 | 9.5 | GO:0033540 | fatty acid beta-oxidation using acyl-CoA oxidase(GO:0033540) |
| 3.1 | 9.4 | GO:0031296 | B cell costimulation(GO:0031296) |
| 3.1 | 81.6 | GO:0090190 | positive regulation of branching involved in ureteric bud morphogenesis(GO:0090190) |
| 3.1 | 12.5 | GO:0045347 | negative regulation of MHC class II biosynthetic process(GO:0045347) |
| 3.1 | 9.4 | GO:0035964 | COPI-coated vesicle budding(GO:0035964) |
| 3.1 | 18.4 | GO:0032929 | negative regulation of superoxide anion generation(GO:0032929) |
| 3.0 | 14.9 | GO:0002634 | regulation of germinal center formation(GO:0002634) |
| 3.0 | 5.9 | GO:0000720 | pyrimidine dimer repair by nucleotide-excision repair(GO:0000720) |
| 3.0 | 11.8 | GO:1900224 | zygotic specification of dorsal/ventral axis(GO:0007352) positive regulation of nodal signaling pathway involved in determination of lateral mesoderm left/right asymmetry(GO:1900224) |
| 2.9 | 40.6 | GO:0002726 | positive regulation of T cell cytokine production(GO:0002726) |
| 2.9 | 11.5 | GO:1904959 | negative regulation of iron ion transmembrane transport(GO:0034760) elastin biosynthetic process(GO:0051542) regulation of cytochrome-c oxidase activity(GO:1904959) |
| 2.8 | 11.3 | GO:0090204 | protein localization to nuclear pore(GO:0090204) |
| 2.7 | 8.1 | GO:0006117 | acetaldehyde metabolic process(GO:0006117) |
| 2.7 | 32.4 | GO:0048935 | peripheral nervous system neuron differentiation(GO:0048934) peripheral nervous system neuron development(GO:0048935) |
| 2.7 | 13.3 | GO:0070094 | positive regulation of glucagon secretion(GO:0070094) |
| 2.5 | 2.5 | GO:1902304 | positive regulation of potassium ion export(GO:1902304) |
| 2.5 | 9.9 | GO:0050787 | detoxification of mercury ion(GO:0050787) |
| 2.4 | 12.2 | GO:0071557 | histone H3-K27 demethylation(GO:0071557) |
| 2.4 | 9.7 | GO:0046951 | ketone body biosynthetic process(GO:0046951) |
| 2.4 | 12.1 | GO:0030205 | dermatan sulfate metabolic process(GO:0030205) |
| 2.4 | 4.8 | GO:0009608 | response to symbiont(GO:0009608) |
| 2.4 | 7.2 | GO:1902309 | negative regulation of peptidyl-serine dephosphorylation(GO:1902309) |
| 2.4 | 4.7 | GO:1904587 | response to glycoprotein(GO:1904587) |
| 2.4 | 7.1 | GO:0035694 | mitochondrial protein catabolic process(GO:0035694) |
| 2.3 | 7.0 | GO:0021997 | neural plate axis specification(GO:0021997) |
| 2.3 | 30.4 | GO:0034498 | early endosome to Golgi transport(GO:0034498) |
| 2.3 | 9.3 | GO:0010748 | negative regulation of plasma membrane long-chain fatty acid transport(GO:0010748) |
| 2.3 | 4.6 | GO:1903463 | regulation of mitotic cell cycle DNA replication(GO:1903463) |
| 2.3 | 16.0 | GO:0043622 | cortical microtubule organization(GO:0043622) |
| 2.3 | 11.4 | GO:0009052 | pentose-phosphate shunt, non-oxidative branch(GO:0009052) |
| 2.3 | 6.8 | GO:0009227 | nucleotide-sugar catabolic process(GO:0009227) |
| 2.3 | 18.1 | GO:0000395 | mRNA 5'-splice site recognition(GO:0000395) |
| 2.2 | 6.7 | GO:0044565 | dendritic cell proliferation(GO:0044565) |
| 2.2 | 6.7 | GO:0032258 | CVT pathway(GO:0032258) |
| 2.2 | 6.5 | GO:0071163 | DNA replication preinitiation complex assembly(GO:0071163) |
| 2.2 | 15.2 | GO:0098881 | exocytic insertion of neurotransmitter receptor to plasma membrane(GO:0098881) exocytic insertion of neurotransmitter receptor to postsynaptic membrane(GO:0098967) |
| 2.1 | 8.6 | GO:0051142 | regulation of NK T cell proliferation(GO:0051140) positive regulation of NK T cell proliferation(GO:0051142) |
| 2.1 | 6.4 | GO:1903070 | negative regulation of ER-associated ubiquitin-dependent protein catabolic process(GO:1903070) |
| 2.1 | 4.2 | GO:0071288 | cellular response to mercury ion(GO:0071288) |
| 2.1 | 6.2 | GO:0030327 | prenylated protein catabolic process(GO:0030327) |
| 2.1 | 25.0 | GO:0043374 | CD8-positive, alpha-beta T cell differentiation(GO:0043374) |
| 2.0 | 4.1 | GO:0035973 | aggrephagy(GO:0035973) |
| 2.0 | 46.0 | GO:0002115 | store-operated calcium entry(GO:0002115) |
| 2.0 | 2.0 | GO:0070237 | positive regulation of activation-induced cell death of T cells(GO:0070237) |
| 2.0 | 11.8 | GO:0072658 | maintenance of protein location in membrane(GO:0072658) maintenance of protein location in plasma membrane(GO:0072660) |
| 2.0 | 7.9 | GO:0006957 | complement activation, alternative pathway(GO:0006957) |
| 1.9 | 5.7 | GO:0006478 | peptidyl-tyrosine sulfation(GO:0006478) |
| 1.9 | 7.6 | GO:1902683 | regulation of receptor localization to synapse(GO:1902683) |
| 1.9 | 5.7 | GO:0060665 | regulation of branching involved in salivary gland morphogenesis by mesenchymal-epithelial signaling(GO:0060665) |
| 1.9 | 16.9 | GO:0001766 | membrane raft polarization(GO:0001766) membrane raft distribution(GO:0031580) |
| 1.9 | 24.4 | GO:0032836 | glomerular basement membrane development(GO:0032836) |
| 1.9 | 20.6 | GO:0038166 | angiotensin-activated signaling pathway(GO:0038166) |
| 1.9 | 3.7 | GO:0002086 | diaphragm contraction(GO:0002086) |
| 1.9 | 14.9 | GO:2000680 | regulation of rubidium ion transport(GO:2000680) |
| 1.9 | 5.6 | GO:0021882 | regulation of transcription from RNA polymerase II promoter involved in forebrain neuron fate commitment(GO:0021882) commitment of multipotent stem cells to neuronal lineage in forebrain(GO:0021898) |
| 1.8 | 12.9 | GO:0035735 | intraciliary transport involved in cilium morphogenesis(GO:0035735) |
| 1.8 | 12.8 | GO:0015670 | carbon dioxide transport(GO:0015670) |
| 1.8 | 7.3 | GO:0015811 | L-cystine transport(GO:0015811) |
| 1.8 | 16.4 | GO:0035434 | copper ion transmembrane transport(GO:0035434) |
| 1.8 | 21.5 | GO:0071493 | cellular response to UV-B(GO:0071493) |
| 1.8 | 19.7 | GO:0005981 | regulation of glycogen catabolic process(GO:0005981) |
| 1.8 | 1.8 | GO:0033364 | mast cell secretory granule organization(GO:0033364) |
| 1.8 | 5.4 | GO:0046604 | positive regulation of mitotic centrosome separation(GO:0046604) |
| 1.8 | 5.3 | GO:0071529 | cementum mineralization(GO:0071529) |
| 1.8 | 10.6 | GO:0015860 | purine nucleoside transmembrane transport(GO:0015860) |
| 1.8 | 21.1 | GO:0038094 | Fc-gamma receptor signaling pathway(GO:0038094) |
| 1.7 | 10.5 | GO:0015074 | DNA integration(GO:0015074) |
| 1.7 | 7.0 | GO:0044725 | chromatin reprogramming in the zygote(GO:0044725) |
| 1.7 | 6.9 | GO:0046121 | deoxyribonucleoside catabolic process(GO:0046121) |
| 1.7 | 8.6 | GO:0002003 | angiotensin maturation(GO:0002003) |
| 1.7 | 15.4 | GO:0046479 | glycosphingolipid catabolic process(GO:0046479) |
| 1.7 | 8.5 | GO:0034059 | response to anoxia(GO:0034059) |
| 1.7 | 22.0 | GO:0090266 | regulation of spindle checkpoint(GO:0090231) regulation of mitotic cell cycle spindle assembly checkpoint(GO:0090266) regulation of mitotic spindle checkpoint(GO:1903504) |
| 1.7 | 22.0 | GO:2000400 | positive regulation of T cell differentiation in thymus(GO:0033089) negative regulation of oxidative stress-induced intrinsic apoptotic signaling pathway(GO:1902176) positive regulation of thymocyte aggregation(GO:2000400) |
| 1.7 | 15.2 | GO:0033299 | secretion of lysosomal enzymes(GO:0033299) |
| 1.7 | 5.0 | GO:0032474 | otolith morphogenesis(GO:0032474) |
| 1.7 | 15.1 | GO:0061418 | regulation of transcription from RNA polymerase II promoter in response to hypoxia(GO:0061418) |
| 1.7 | 5.0 | GO:0046833 | positive regulation of RNA export from nucleus(GO:0046833) |
| 1.7 | 13.3 | GO:0075522 | IRES-dependent viral translational initiation(GO:0075522) |
| 1.6 | 31.3 | GO:0006491 | N-glycan processing(GO:0006491) |
| 1.6 | 8.2 | GO:0007221 | positive regulation of transcription of Notch receptor target(GO:0007221) |
| 1.6 | 4.9 | GO:1904694 | negative regulation of vascular smooth muscle contraction(GO:1904694) |
| 1.6 | 11.5 | GO:1901098 | positive regulation of autophagosome maturation(GO:1901098) |
| 1.6 | 54.0 | GO:0060441 | epithelial tube branching involved in lung morphogenesis(GO:0060441) |
| 1.6 | 35.8 | GO:0097503 | sialylation(GO:0097503) |
| 1.6 | 11.4 | GO:0072717 | cellular response to actinomycin D(GO:0072717) |
| 1.6 | 3.2 | GO:1903936 | cellular response to sodium arsenite(GO:1903936) |
| 1.6 | 69.4 | GO:1903959 | regulation of anion transmembrane transport(GO:1903959) |
| 1.6 | 7.9 | GO:1904401 | cellular response to Thyroid stimulating hormone(GO:1904401) |
| 1.6 | 6.2 | GO:0035494 | SNARE complex disassembly(GO:0035494) |
| 1.5 | 7.6 | GO:0015808 | L-alanine transport(GO:0015808) |
| 1.5 | 7.5 | GO:0010936 | negative regulation of macrophage cytokine production(GO:0010936) |
| 1.5 | 6.0 | GO:0048549 | protein depalmitoylation(GO:0002084) positive regulation of pinocytosis(GO:0048549) |
| 1.5 | 4.5 | GO:0033512 | L-lysine catabolic process to acetyl-CoA via saccharopine(GO:0033512) |
| 1.5 | 33.8 | GO:0043011 | myeloid dendritic cell differentiation(GO:0043011) |
| 1.5 | 26.4 | GO:0097067 | cellular response to thyroid hormone stimulus(GO:0097067) |
| 1.5 | 8.7 | GO:0071386 | cellular response to corticosterone stimulus(GO:0071386) |
| 1.4 | 7.2 | GO:0097332 | response to antipsychotic drug(GO:0097332) |
| 1.4 | 4.3 | GO:1990737 | negative regulation of translational initiation in response to stress(GO:0032057) response to manganese-induced endoplasmic reticulum stress(GO:1990737) |
| 1.4 | 19.9 | GO:0032460 | negative regulation of protein oligomerization(GO:0032460) |
| 1.4 | 5.4 | GO:0060857 | establishment of glial blood-brain barrier(GO:0060857) |
| 1.3 | 2.7 | GO:1903691 | positive regulation of wound healing, spreading of epidermal cells(GO:1903691) |
| 1.3 | 9.3 | GO:2000074 | regulation of type B pancreatic cell development(GO:2000074) |
| 1.3 | 6.6 | GO:0007042 | lysosomal lumen acidification(GO:0007042) |
| 1.3 | 17.0 | GO:0006309 | apoptotic DNA fragmentation(GO:0006309) |
| 1.3 | 5.2 | GO:1903800 | positive regulation of production of miRNAs involved in gene silencing by miRNA(GO:1903800) |
| 1.3 | 3.9 | GO:1904431 | positive regulation of t-circle formation(GO:1904431) |
| 1.3 | 15.4 | GO:0046321 | positive regulation of fatty acid oxidation(GO:0046321) |
| 1.3 | 7.6 | GO:0006189 | 'de novo' IMP biosynthetic process(GO:0006189) |
| 1.3 | 2.5 | GO:1900126 | negative regulation of hyaluronan biosynthetic process(GO:1900126) |
| 1.3 | 8.8 | GO:0006610 | ribosomal protein import into nucleus(GO:0006610) |
| 1.3 | 2.5 | GO:0002447 | eosinophil activation involved in immune response(GO:0002278) eosinophil mediated immunity(GO:0002447) eosinophil degranulation(GO:0043308) |
| 1.2 | 2.5 | GO:0042539 | hypotonic salinity response(GO:0042539) cellular hypotonic salinity response(GO:0071477) |
| 1.2 | 6.2 | GO:0006685 | sphingomyelin catabolic process(GO:0006685) |
| 1.2 | 1.2 | GO:0097167 | circadian regulation of translation(GO:0097167) |
| 1.2 | 14.6 | GO:0009744 | response to sucrose(GO:0009744) response to disaccharide(GO:0034285) |
| 1.2 | 21.6 | GO:0015937 | coenzyme A biosynthetic process(GO:0015937) |
| 1.2 | 4.7 | GO:0033668 | negative regulation by symbiont of host apoptotic process(GO:0033668) negative regulation by symbiont of host programmed cell death(GO:0052041) negative regulation by organism of programmed cell death in other organism involved in symbiotic interaction(GO:0052490) |
| 1.2 | 10.6 | GO:1900119 | positive regulation of execution phase of apoptosis(GO:1900119) |
| 1.2 | 9.4 | GO:2000427 | positive regulation of apoptotic cell clearance(GO:2000427) |
| 1.2 | 19.8 | GO:0072112 | renal filtration cell differentiation(GO:0061318) glomerular visceral epithelial cell differentiation(GO:0072112) glomerular epithelial cell differentiation(GO:0072311) |
| 1.2 | 4.7 | GO:0014878 | response to electrical stimulus involved in regulation of muscle adaptation(GO:0014878) |
| 1.2 | 10.4 | GO:0045759 | cannabinoid signaling pathway(GO:0038171) negative regulation of action potential(GO:0045759) |
| 1.1 | 1.1 | GO:2000259 | positive regulation of complement activation(GO:0045917) positive regulation of protein activation cascade(GO:2000259) |
| 1.1 | 3.4 | GO:1903542 | negative regulation of exosomal secretion(GO:1903542) |
| 1.1 | 10.1 | GO:0018344 | protein geranylgeranylation(GO:0018344) |
| 1.1 | 3.3 | GO:1900220 | semaphorin-plexin signaling pathway involved in bone trabecula morphogenesis(GO:1900220) |
| 1.1 | 5.4 | GO:1903223 | cellular response to temperature stimulus(GO:0071502) positive regulation of oxidative stress-induced neuron death(GO:1903223) |
| 1.1 | 5.4 | GO:1904528 | positive regulation of microtubule binding(GO:1904528) |
| 1.1 | 7.6 | GO:0016259 | selenocysteine metabolic process(GO:0016259) |
| 1.1 | 4.2 | GO:0038110 | interleukin-2-mediated signaling pathway(GO:0038110) |
| 1.1 | 3.2 | GO:0033123 | positive regulation of purine nucleotide catabolic process(GO:0033123) |
| 1.0 | 6.3 | GO:2000051 | negative regulation of non-canonical Wnt signaling pathway(GO:2000051) |
| 1.0 | 17.6 | GO:0050872 | white fat cell differentiation(GO:0050872) |
| 1.0 | 25.7 | GO:0097352 | autophagosome maturation(GO:0097352) |
| 1.0 | 11.2 | GO:0044804 | nucleophagy(GO:0044804) |
| 1.0 | 29.9 | GO:0009303 | rRNA transcription(GO:0009303) |
| 1.0 | 4.9 | GO:0006868 | glutamine transport(GO:0006868) |
| 1.0 | 7.8 | GO:0051639 | actin filament network formation(GO:0051639) |
| 1.0 | 23.2 | GO:0060351 | cartilage development involved in endochondral bone morphogenesis(GO:0060351) |
| 1.0 | 41.3 | GO:0048009 | insulin-like growth factor receptor signaling pathway(GO:0048009) |
| 1.0 | 13.4 | GO:2000060 | positive regulation of protein ubiquitination involved in ubiquitin-dependent protein catabolic process(GO:2000060) |
| 1.0 | 2.9 | GO:0051124 | synaptic growth at neuromuscular junction(GO:0051124) |
| 1.0 | 17.2 | GO:0043968 | histone H2A acetylation(GO:0043968) |
| 1.0 | 7.6 | GO:1902715 | positive regulation of interferon-gamma secretion(GO:1902715) |
| 0.9 | 2.8 | GO:0002192 | IRES-dependent translational initiation(GO:0002192) |
| 0.9 | 46.4 | GO:0045214 | sarcomere organization(GO:0045214) |
| 0.9 | 30.3 | GO:0090004 | positive regulation of establishment of protein localization to plasma membrane(GO:0090004) |
| 0.9 | 2.8 | GO:1904706 | negative regulation of vascular smooth muscle cell proliferation(GO:1904706) |
| 0.9 | 6.4 | GO:0045059 | positive thymic T cell selection(GO:0045059) |
| 0.9 | 10.0 | GO:0006782 | protoporphyrinogen IX biosynthetic process(GO:0006782) |
| 0.9 | 4.5 | GO:0097070 | ductus arteriosus closure(GO:0097070) |
| 0.9 | 0.9 | GO:0032349 | positive regulation of aldosterone metabolic process(GO:0032346) positive regulation of aldosterone biosynthetic process(GO:0032349) |
| 0.9 | 2.7 | GO:0046061 | dATP catabolic process(GO:0046061) |
| 0.9 | 15.0 | GO:0046597 | negative regulation of viral entry into host cell(GO:0046597) |
| 0.9 | 5.3 | GO:0002315 | marginal zone B cell differentiation(GO:0002315) |
| 0.9 | 4.4 | GO:0008295 | spermidine biosynthetic process(GO:0008295) |
| 0.9 | 41.8 | GO:0000381 | regulation of alternative mRNA splicing, via spliceosome(GO:0000381) |
| 0.9 | 7.0 | GO:0046116 | queuosine biosynthetic process(GO:0008616) queuosine metabolic process(GO:0046116) |
| 0.9 | 6.9 | GO:0010044 | response to aluminum ion(GO:0010044) |
| 0.9 | 2.6 | GO:0046882 | negative regulation of follicle-stimulating hormone secretion(GO:0046882) |
| 0.9 | 3.4 | GO:0035795 | negative regulation of mitochondrial membrane permeability(GO:0035795) |
| 0.9 | 2.6 | GO:1900825 | regulation of membrane depolarization during cardiac muscle cell action potential(GO:1900825) |
| 0.8 | 5.9 | GO:0061450 | trophoblast cell migration(GO:0061450) |
| 0.8 | 3.4 | GO:0060174 | limb bud formation(GO:0060174) |
| 0.8 | 20.0 | GO:0031954 | positive regulation of protein autophosphorylation(GO:0031954) |
| 0.8 | 9.9 | GO:0021520 | spinal cord motor neuron cell fate specification(GO:0021520) |
| 0.8 | 9.0 | GO:0043162 | ubiquitin-dependent protein catabolic process via the multivesicular body sorting pathway(GO:0043162) |
| 0.8 | 3.2 | GO:0033132 | negative regulation of glucokinase activity(GO:0033132) negative regulation of hexokinase activity(GO:1903300) |
| 0.8 | 4.8 | GO:2001280 | positive regulation of prostaglandin biosynthetic process(GO:0031394) positive regulation of unsaturated fatty acid biosynthetic process(GO:2001280) |
| 0.8 | 6.4 | GO:0048304 | positive regulation of isotype switching to IgG isotypes(GO:0048304) |
| 0.8 | 9.4 | GO:1900363 | regulation of mRNA polyadenylation(GO:1900363) |
| 0.8 | 6.3 | GO:0006269 | DNA replication, synthesis of RNA primer(GO:0006269) |
| 0.8 | 17.9 | GO:0030225 | macrophage differentiation(GO:0030225) |
| 0.8 | 0.8 | GO:0060120 | auditory receptor cell fate commitment(GO:0009912) inner ear receptor cell fate commitment(GO:0060120) |
| 0.8 | 7.7 | GO:0016926 | protein desumoylation(GO:0016926) |
| 0.8 | 3.8 | GO:0000960 | mitochondrial RNA catabolic process(GO:0000957) regulation of mitochondrial RNA catabolic process(GO:0000960) |
| 0.8 | 2.3 | GO:0035483 | gastric emptying(GO:0035483) |
| 0.8 | 2.3 | GO:2001206 | positive regulation of osteoclast development(GO:2001206) |
| 0.7 | 2.2 | GO:1903715 | regulation of aerobic respiration(GO:1903715) |
| 0.7 | 8.1 | GO:2000641 | regulation of early endosome to late endosome transport(GO:2000641) |
| 0.7 | 8.8 | GO:2000615 | regulation of histone H3-K9 acetylation(GO:2000615) |
| 0.7 | 24.9 | GO:0034219 | carbohydrate transmembrane transport(GO:0034219) |
| 0.7 | 7.3 | GO:0015886 | heme transport(GO:0015886) |
| 0.7 | 2.9 | GO:0006546 | glycine catabolic process(GO:0006546) glycine decarboxylation via glycine cleavage system(GO:0019464) |
| 0.7 | 5.7 | GO:0060872 | semicircular canal morphogenesis(GO:0048752) semicircular canal development(GO:0060872) |
| 0.7 | 1.4 | GO:1990169 | detoxification of copper ion(GO:0010273) stress response to copper ion(GO:1990169) |
| 0.7 | 2.8 | GO:2000628 | regulation of miRNA metabolic process(GO:2000628) |
| 0.7 | 3.5 | GO:0050917 | sensory perception of umami taste(GO:0050917) |
| 0.7 | 4.9 | GO:0034058 | endosomal vesicle fusion(GO:0034058) |
| 0.7 | 2.8 | GO:0019072 | viral genome packaging(GO:0019072) viral RNA genome packaging(GO:0019074) |
| 0.7 | 2.1 | GO:0097010 | eukaryotic translation initiation factor 4F complex assembly(GO:0097010) |
| 0.7 | 2.7 | GO:0007182 | common-partner SMAD protein phosphorylation(GO:0007182) |
| 0.7 | 19.1 | GO:0006958 | complement activation, classical pathway(GO:0006958) |
| 0.7 | 2.0 | GO:0042414 | epinephrine metabolic process(GO:0042414) |
| 0.7 | 6.0 | GO:0052697 | xenobiotic glucuronidation(GO:0052697) |
| 0.7 | 18.1 | GO:0043171 | peptide catabolic process(GO:0043171) |
| 0.7 | 2.0 | GO:0033634 | positive regulation of cell-cell adhesion mediated by integrin(GO:0033634) |
| 0.7 | 1.3 | GO:0060154 | cellular process regulating host cell cycle in response to virus(GO:0060154) |
| 0.6 | 14.7 | GO:0001522 | pseudouridine synthesis(GO:0001522) |
| 0.6 | 2.5 | GO:0060454 | positive regulation of gastric acid secretion(GO:0060454) |
| 0.6 | 1.3 | GO:1904373 | response to kainic acid(GO:1904373) |
| 0.6 | 1.9 | GO:0060086 | circadian temperature homeostasis(GO:0060086) |
| 0.6 | 1.9 | GO:0061043 | positive regulation of vascular wound healing(GO:0035470) regulation of vascular wound healing(GO:0061043) |
| 0.6 | 3.1 | GO:0090435 | protein localization to nuclear envelope(GO:0090435) |
| 0.6 | 6.8 | GO:0006336 | DNA replication-independent nucleosome assembly(GO:0006336) |
| 0.6 | 6.0 | GO:0072531 | pyrimidine-containing compound transmembrane transport(GO:0072531) |
| 0.6 | 21.5 | GO:0046839 | phospholipid dephosphorylation(GO:0046839) |
| 0.6 | 18.7 | GO:0015804 | neutral amino acid transport(GO:0015804) |
| 0.6 | 1.7 | GO:0009197 | dUDP biosynthetic process(GO:0006227) pyrimidine nucleoside diphosphate biosynthetic process(GO:0009139) pyrimidine deoxyribonucleoside diphosphate metabolic process(GO:0009196) pyrimidine deoxyribonucleoside diphosphate biosynthetic process(GO:0009197) dUDP metabolic process(GO:0046077) |
| 0.6 | 11.0 | GO:0042036 | negative regulation of cytokine biosynthetic process(GO:0042036) |
| 0.6 | 2.9 | GO:1903142 | positive regulation of endothelial cell development(GO:1901552) positive regulation of establishment of endothelial barrier(GO:1903142) |
| 0.6 | 1.7 | GO:2000872 | positive regulation of progesterone secretion(GO:2000872) |
| 0.6 | 12.0 | GO:0042573 | retinoic acid metabolic process(GO:0042573) |
| 0.6 | 4.0 | GO:0035879 | plasma membrane lactate transport(GO:0035879) |
| 0.6 | 1.1 | GO:1901491 | negative regulation of lymphangiogenesis(GO:1901491) |
| 0.6 | 7.2 | GO:0003376 | sphingosine-1-phosphate signaling pathway(GO:0003376) |
| 0.6 | 8.3 | GO:1902358 | sulfate transport(GO:0008272) oxalate transport(GO:0019532) sulfate transmembrane transport(GO:1902358) |
| 0.6 | 3.9 | GO:0003374 | dynamin polymerization involved in membrane fission(GO:0003373) dynamin polymerization involved in mitochondrial fission(GO:0003374) |
| 0.5 | 15.3 | GO:0045839 | negative regulation of mitotic nuclear division(GO:0045839) |
| 0.5 | 6.9 | GO:0006308 | DNA catabolic process(GO:0006308) |
| 0.5 | 1.6 | GO:1903413 | cellular response to bile acid(GO:1903413) |
| 0.5 | 4.8 | GO:0015747 | urate transport(GO:0015747) |
| 0.5 | 2.6 | GO:0030421 | defecation(GO:0030421) |
| 0.5 | 12.1 | GO:0061462 | protein localization to lysosome(GO:0061462) |
| 0.5 | 5.2 | GO:0045351 | type I interferon biosynthetic process(GO:0045351) |
| 0.5 | 29.2 | GO:0007157 | heterophilic cell-cell adhesion via plasma membrane cell adhesion molecules(GO:0007157) |
| 0.5 | 15.1 | GO:0005978 | glycogen biosynthetic process(GO:0005978) glucan biosynthetic process(GO:0009250) |
| 0.5 | 3.1 | GO:0015866 | ADP transport(GO:0015866) |
| 0.5 | 8.3 | GO:0035162 | embryonic hemopoiesis(GO:0035162) |
| 0.5 | 5.7 | GO:0040034 | regulation of development, heterochronic(GO:0040034) |
| 0.5 | 5.2 | GO:0070257 | positive regulation of mucus secretion(GO:0070257) |
| 0.5 | 8.2 | GO:0000076 | DNA replication checkpoint(GO:0000076) |
| 0.5 | 1.5 | GO:0070084 | protein initiator methionine removal(GO:0070084) |
| 0.5 | 1.5 | GO:0070681 | glutaminyl-tRNAGln biosynthesis via transamidation(GO:0070681) |
| 0.5 | 3.5 | GO:0015871 | choline transport(GO:0015871) |
| 0.5 | 4.9 | GO:0006265 | DNA topological change(GO:0006265) |
| 0.5 | 4.4 | GO:0046085 | adenosine metabolic process(GO:0046085) |
| 0.5 | 2.0 | GO:0032808 | lacrimal gland development(GO:0032808) |
| 0.5 | 13.8 | GO:0048266 | behavioral response to pain(GO:0048266) |
| 0.5 | 2.4 | GO:0070164 | negative regulation of adiponectin secretion(GO:0070164) |
| 0.5 | 2.4 | GO:0071340 | skeletal muscle acetylcholine-gated channel clustering(GO:0071340) |
| 0.5 | 3.7 | GO:0003416 | endochondral bone growth(GO:0003416) |
| 0.5 | 1.4 | GO:0016129 | phytosteroid metabolic process(GO:0016128) phytosteroid biosynthetic process(GO:0016129) |
| 0.4 | 9.7 | GO:0006884 | cell volume homeostasis(GO:0006884) |
| 0.4 | 1.3 | GO:2000312 | regulation of kainate selective glutamate receptor activity(GO:2000312) |
| 0.4 | 13.3 | GO:0015991 | ATP hydrolysis coupled proton transport(GO:0015991) |
| 0.4 | 10.7 | GO:0072661 | protein targeting to plasma membrane(GO:0072661) |
| 0.4 | 1.3 | GO:0006435 | threonyl-tRNA aminoacylation(GO:0006435) |
| 0.4 | 5.1 | GO:0000083 | regulation of transcription involved in G1/S transition of mitotic cell cycle(GO:0000083) |
| 0.4 | 1.3 | GO:0021539 | subthalamus development(GO:0021539) |
| 0.4 | 1.7 | GO:1901894 | regulation of calcium-transporting ATPase activity(GO:1901894) |
| 0.4 | 0.8 | GO:0060266 | negative regulation of respiratory burst involved in inflammatory response(GO:0060266) |
| 0.4 | 15.0 | GO:0045604 | regulation of epidermal cell differentiation(GO:0045604) |
| 0.4 | 7.2 | GO:0070266 | necroptotic process(GO:0070266) |
| 0.4 | 13.5 | GO:0050873 | brown fat cell differentiation(GO:0050873) |
| 0.4 | 2.0 | GO:0009298 | GDP-mannose biosynthetic process(GO:0009298) |
| 0.4 | 12.8 | GO:0097502 | mannosylation(GO:0097502) |
| 0.4 | 15.8 | GO:0006739 | NADP metabolic process(GO:0006739) |
| 0.4 | 3.1 | GO:0032025 | response to cobalt ion(GO:0032025) |
| 0.4 | 3.4 | GO:0009083 | branched-chain amino acid catabolic process(GO:0009083) |
| 0.4 | 1.9 | GO:0019919 | peptidyl-arginine methylation, to asymmetrical-dimethyl arginine(GO:0019919) |
| 0.4 | 1.9 | GO:2000767 | positive regulation of cytoplasmic translation(GO:2000767) |
| 0.4 | 3.0 | GO:0038180 | nerve growth factor signaling pathway(GO:0038180) |
| 0.4 | 1.9 | GO:0032790 | ribosome disassembly(GO:0032790) |
| 0.4 | 1.9 | GO:1904995 | negative regulation of leukocyte tethering or rolling(GO:1903237) negative regulation of leukocyte adhesion to vascular endothelial cell(GO:1904995) |
| 0.4 | 5.9 | GO:0006895 | Golgi to endosome transport(GO:0006895) |
| 0.4 | 8.1 | GO:0019835 | cytolysis(GO:0019835) |
| 0.4 | 4.1 | GO:0048025 | negative regulation of mRNA splicing, via spliceosome(GO:0048025) |
| 0.4 | 1.5 | GO:0071955 | recycling endosome to Golgi transport(GO:0071955) |
| 0.4 | 3.2 | GO:0044090 | positive regulation of vacuole organization(GO:0044090) |
| 0.3 | 6.2 | GO:0043153 | entrainment of circadian clock by photoperiod(GO:0043153) |
| 0.3 | 7.9 | GO:0040019 | positive regulation of embryonic development(GO:0040019) |
| 0.3 | 4.7 | GO:0030071 | regulation of mitotic metaphase/anaphase transition(GO:0030071) |
| 0.3 | 2.7 | GO:0010866 | regulation of triglyceride biosynthetic process(GO:0010866) |
| 0.3 | 2.7 | GO:0043102 | amino acid salvage(GO:0043102) L-methionine salvage(GO:0071267) |
| 0.3 | 3.3 | GO:0015760 | hexose phosphate transport(GO:0015712) glucose-6-phosphate transport(GO:0015760) |
| 0.3 | 7.2 | GO:0016226 | iron-sulfur cluster assembly(GO:0016226) metallo-sulfur cluster assembly(GO:0031163) |
| 0.3 | 4.9 | GO:1901976 | regulation of cell cycle checkpoint(GO:1901976) |
| 0.3 | 1.6 | GO:0010939 | regulation of necrotic cell death(GO:0010939) |
| 0.3 | 0.3 | GO:0021593 | rhombomere morphogenesis(GO:0021593) |
| 0.3 | 1.3 | GO:0046351 | disaccharide biosynthetic process(GO:0046351) |
| 0.3 | 3.9 | GO:0046325 | negative regulation of glucose import(GO:0046325) |
| 0.3 | 1.0 | GO:0002949 | tRNA threonylcarbamoyladenosine modification(GO:0002949) |
| 0.3 | 2.9 | GO:2000778 | positive regulation of interleukin-6 secretion(GO:2000778) |
| 0.3 | 13.8 | GO:0006953 | acute-phase response(GO:0006953) |
| 0.3 | 29.0 | GO:0000724 | double-strand break repair via homologous recombination(GO:0000724) |
| 0.3 | 4.1 | GO:0001833 | inner cell mass cell proliferation(GO:0001833) |
| 0.3 | 0.3 | GO:0034136 | negative regulation of toll-like receptor 2 signaling pathway(GO:0034136) |
| 0.3 | 1.8 | GO:0045198 | establishment of epithelial cell apical/basal polarity(GO:0045198) |
| 0.3 | 3.3 | GO:0042178 | xenobiotic catabolic process(GO:0042178) |
| 0.3 | 8.3 | GO:0006099 | tricarboxylic acid cycle(GO:0006099) |
| 0.3 | 1.5 | GO:0044351 | macropinocytosis(GO:0044351) |
| 0.3 | 2.0 | GO:0006517 | protein deglycosylation(GO:0006517) |
| 0.3 | 1.5 | GO:0045039 | protein import into mitochondrial inner membrane(GO:0045039) |
| 0.3 | 2.3 | GO:0000244 | spliceosomal tri-snRNP complex assembly(GO:0000244) |
| 0.3 | 12.4 | GO:0030500 | regulation of bone mineralization(GO:0030500) |
| 0.3 | 1.4 | GO:0071233 | cellular response to leucine(GO:0071233) |
| 0.3 | 0.5 | GO:1904578 | response to thapsigargin(GO:1904578) cellular response to thapsigargin(GO:1904579) |
| 0.3 | 8.1 | GO:0000028 | ribosomal small subunit assembly(GO:0000028) |
| 0.3 | 20.5 | GO:0048706 | embryonic skeletal system development(GO:0048706) |
| 0.3 | 3.5 | GO:0001702 | gastrulation with mouth forming second(GO:0001702) |
| 0.3 | 0.8 | GO:0071031 | nuclear mRNA surveillance of mRNA 3'-end processing(GO:0071031) nuclear polyadenylation-dependent tRNA catabolic process(GO:0071038) nuclear retention of pre-mRNA with aberrant 3'-ends at the site of transcription(GO:0071049) |
| 0.3 | 1.0 | GO:0009649 | entrainment of circadian clock(GO:0009649) |
| 0.3 | 2.8 | GO:0006388 | tRNA splicing, via endonucleolytic cleavage and ligation(GO:0006388) |
| 0.2 | 10.8 | GO:0046676 | negative regulation of insulin secretion(GO:0046676) |
| 0.2 | 4.4 | GO:0090161 | Golgi ribbon formation(GO:0090161) |
| 0.2 | 6.2 | GO:0048538 | thymus development(GO:0048538) |
| 0.2 | 2.1 | GO:0060211 | regulation of nuclear-transcribed mRNA poly(A) tail shortening(GO:0060211) positive regulation of nuclear-transcribed mRNA poly(A) tail shortening(GO:0060213) |
| 0.2 | 1.4 | GO:0071918 | urea transmembrane transport(GO:0071918) |
| 0.2 | 21.0 | GO:0048678 | response to axon injury(GO:0048678) |
| 0.2 | 2.5 | GO:0019432 | triglyceride biosynthetic process(GO:0019432) |
| 0.2 | 2.0 | GO:0006983 | ER overload response(GO:0006983) |
| 0.2 | 15.1 | GO:0043473 | pigmentation(GO:0043473) |
| 0.2 | 6.3 | GO:0006024 | glycosaminoglycan biosynthetic process(GO:0006024) |
| 0.2 | 0.9 | GO:0015936 | coenzyme A metabolic process(GO:0015936) |
| 0.2 | 5.0 | GO:0030866 | cortical actin cytoskeleton organization(GO:0030866) |
| 0.2 | 0.9 | GO:1902775 | mitochondrial large ribosomal subunit assembly(GO:1902775) |
| 0.2 | 12.4 | GO:0030177 | positive regulation of Wnt signaling pathway(GO:0030177) |
| 0.2 | 2.1 | GO:0031340 | positive regulation of vesicle fusion(GO:0031340) |
| 0.2 | 3.4 | GO:0008535 | respiratory chain complex IV assembly(GO:0008535) |
| 0.2 | 0.8 | GO:0033326 | cerebrospinal fluid secretion(GO:0033326) |
| 0.2 | 9.6 | GO:0043966 | histone H3 acetylation(GO:0043966) |
| 0.2 | 26.5 | GO:0042113 | B cell activation(GO:0042113) |
| 0.2 | 3.5 | GO:0060712 | spongiotrophoblast layer development(GO:0060712) |
| 0.2 | 2.3 | GO:0046457 | prostaglandin biosynthetic process(GO:0001516) prostanoid biosynthetic process(GO:0046457) |
| 0.2 | 0.6 | GO:0045792 | negative regulation of cell size(GO:0045792) |
| 0.2 | 0.7 | GO:0010138 | pyrimidine ribonucleotide salvage(GO:0010138) pyrimidine nucleotide salvage(GO:0032262) UMP salvage(GO:0044206) |
| 0.2 | 8.0 | GO:0031338 | regulation of vesicle fusion(GO:0031338) |
| 0.2 | 2.9 | GO:0006890 | retrograde vesicle-mediated transport, Golgi to ER(GO:0006890) |
| 0.2 | 5.3 | GO:0006891 | intra-Golgi vesicle-mediated transport(GO:0006891) |
| 0.2 | 0.5 | GO:0097498 | endothelial tube lumen extension(GO:0097498) |
| 0.2 | 3.9 | GO:0072676 | lymphocyte migration(GO:0072676) |
| 0.2 | 1.2 | GO:0002063 | chondrocyte development(GO:0002063) |
| 0.2 | 1.2 | GO:1904294 | positive regulation of ERAD pathway(GO:1904294) |
| 0.2 | 4.7 | GO:0035458 | cellular response to interferon-beta(GO:0035458) |
| 0.2 | 0.3 | GO:0061534 | gamma-aminobutyric acid secretion, neurotransmission(GO:0061534) |
| 0.2 | 5.7 | GO:0097421 | liver regeneration(GO:0097421) |
| 0.2 | 4.8 | GO:0070936 | protein K48-linked ubiquitination(GO:0070936) |
| 0.2 | 6.2 | GO:0032945 | negative regulation of mononuclear cell proliferation(GO:0032945) negative regulation of lymphocyte proliferation(GO:0050672) |
| 0.2 | 0.5 | GO:0035606 | peptidyl-cysteine S-trans-nitrosylation(GO:0035606) |
| 0.2 | 2.9 | GO:0030033 | microvillus assembly(GO:0030033) |
| 0.2 | 1.4 | GO:0009396 | folic acid-containing compound biosynthetic process(GO:0009396) |
| 0.2 | 2.3 | GO:0000132 | establishment of mitotic spindle orientation(GO:0000132) |
| 0.2 | 7.1 | GO:2000181 | negative regulation of angiogenesis(GO:0016525) negative regulation of blood vessel morphogenesis(GO:2000181) |
| 0.2 | 9.9 | GO:1902476 | chloride transmembrane transport(GO:1902476) |
| 0.1 | 1.0 | GO:0007256 | activation of JNKK activity(GO:0007256) |
| 0.1 | 3.8 | GO:0006335 | DNA replication-dependent nucleosome assembly(GO:0006335) DNA replication-dependent nucleosome organization(GO:0034723) |
| 0.1 | 3.9 | GO:0006801 | superoxide metabolic process(GO:0006801) |
| 0.1 | 0.7 | GO:0003360 | brainstem development(GO:0003360) |
| 0.1 | 1.1 | GO:0035067 | negative regulation of histone acetylation(GO:0035067) |
| 0.1 | 1.3 | GO:0070070 | proton-transporting V-type ATPase complex assembly(GO:0070070) |
| 0.1 | 1.1 | GO:0046784 | viral mRNA export from host cell nucleus(GO:0046784) |
| 0.1 | 6.7 | GO:0008625 | extrinsic apoptotic signaling pathway via death domain receptors(GO:0008625) |
| 0.1 | 0.5 | GO:0036506 | maintenance of unfolded protein(GO:0036506) maintenance of unfolded protein involved in ERAD pathway(GO:1904378) |
| 0.1 | 2.8 | GO:0070979 | protein K11-linked ubiquitination(GO:0070979) |
| 0.1 | 4.8 | GO:0019915 | lipid storage(GO:0019915) |
| 0.1 | 0.9 | GO:0043686 | co-translational protein modification(GO:0043686) |
| 0.1 | 1.8 | GO:0009060 | aerobic respiration(GO:0009060) |
| 0.1 | 48.4 | GO:0043547 | positive regulation of GTPase activity(GO:0043547) |
| 0.1 | 3.6 | GO:0070527 | platelet aggregation(GO:0070527) |
| 0.1 | 2.1 | GO:0000154 | rRNA modification(GO:0000154) |
| 0.1 | 1.6 | GO:0042407 | cristae formation(GO:0042407) |
| 0.1 | 0.1 | GO:0006296 | nucleotide-excision repair, DNA incision, 5'-to lesion(GO:0006296) |
| 0.1 | 0.4 | GO:0014842 | regulation of skeletal muscle satellite cell proliferation(GO:0014842) |
| 0.1 | 1.7 | GO:0030511 | positive regulation of transforming growth factor beta receptor signaling pathway(GO:0030511) positive regulation of cellular response to transforming growth factor beta stimulus(GO:1903846) |
| 0.1 | 15.8 | GO:0006486 | protein glycosylation(GO:0006486) macromolecule glycosylation(GO:0043413) |
| 0.1 | 1.0 | GO:0000290 | deadenylation-dependent decapping of nuclear-transcribed mRNA(GO:0000290) |
| 0.1 | 0.6 | GO:0002943 | tRNA dihydrouridine synthesis(GO:0002943) |
| 0.1 | 1.9 | GO:1902235 | regulation of endoplasmic reticulum stress-induced intrinsic apoptotic signaling pathway(GO:1902235) |
| 0.1 | 1.8 | GO:0002385 | organ or tissue specific immune response(GO:0002251) mucosal immune response(GO:0002385) |
| 0.1 | 0.4 | GO:0090367 | negative regulation of mRNA modification(GO:0090367) |
| 0.1 | 6.1 | GO:0009408 | response to heat(GO:0009408) |
| 0.1 | 0.7 | GO:0060158 | phospholipase C-activating dopamine receptor signaling pathway(GO:0060158) |
| 0.1 | 2.6 | GO:0018345 | protein palmitoylation(GO:0018345) |
| 0.1 | 1.0 | GO:0071044 | histone mRNA catabolic process(GO:0071044) |
| 0.1 | 0.2 | GO:0006045 | N-acetylglucosamine biosynthetic process(GO:0006045) N-acetylneuraminate biosynthetic process(GO:0046380) glucosamine-containing compound biosynthetic process(GO:1901073) |
| 0.1 | 3.1 | GO:0033138 | positive regulation of peptidyl-serine phosphorylation(GO:0033138) |
| 0.1 | 5.2 | GO:0008344 | adult locomotory behavior(GO:0008344) |
| 0.1 | 2.0 | GO:0000245 | spliceosomal complex assembly(GO:0000245) |
| 0.1 | 4.8 | GO:0030217 | T cell differentiation(GO:0030217) |
| 0.1 | 0.9 | GO:0045672 | positive regulation of osteoclast differentiation(GO:0045672) |
| 0.1 | 1.8 | GO:2000649 | regulation of sodium ion transmembrane transporter activity(GO:2000649) |
| 0.1 | 5.6 | GO:0002244 | hematopoietic progenitor cell differentiation(GO:0002244) |
| 0.1 | 0.3 | GO:0070317 | negative regulation of G0 to G1 transition(GO:0070317) |
| 0.1 | 0.8 | GO:0032288 | myelin assembly(GO:0032288) |
| 0.1 | 2.5 | GO:0045445 | myoblast differentiation(GO:0045445) |
| 0.1 | 0.9 | GO:0043267 | negative regulation of potassium ion transport(GO:0043267) |
| 0.1 | 1.5 | GO:1904031 | positive regulation of cyclin-dependent protein kinase activity(GO:1904031) |
| 0.1 | 0.2 | GO:0007000 | nucleolus organization(GO:0007000) |
| 0.1 | 0.9 | GO:0061515 | myeloid cell development(GO:0061515) |
| 0.1 | 4.7 | GO:0071773 | response to BMP(GO:0071772) cellular response to BMP stimulus(GO:0071773) |
| 0.1 | 0.4 | GO:0072520 | seminiferous tubule development(GO:0072520) |
| 0.1 | 0.4 | GO:0060736 | prostate gland growth(GO:0060736) |
| 0.0 | 1.3 | GO:0006893 | Golgi to plasma membrane transport(GO:0006893) |
| 0.0 | 1.5 | GO:0042220 | response to cocaine(GO:0042220) |
| 0.0 | 0.5 | GO:0035902 | response to immobilization stress(GO:0035902) |
| 0.0 | 0.6 | GO:0031468 | nuclear envelope reassembly(GO:0031468) |
| 0.0 | 1.1 | GO:0071300 | cellular response to retinoic acid(GO:0071300) |
| 0.0 | 3.2 | GO:0006818 | hydrogen transport(GO:0006818) |
| 0.0 | 6.4 | GO:0010038 | response to metal ion(GO:0010038) |
| 0.0 | 1.6 | GO:0008286 | insulin receptor signaling pathway(GO:0008286) |
| 0.0 | 1.7 | GO:0006334 | nucleosome assembly(GO:0006334) |
| 0.0 | 0.3 | GO:0021554 | optic nerve development(GO:0021554) |
| 0.0 | 0.5 | GO:0000184 | nuclear-transcribed mRNA catabolic process, nonsense-mediated decay(GO:0000184) |
| 0.0 | 0.3 | GO:0051443 | positive regulation of ubiquitin-protein transferase activity(GO:0051443) |
| 0.0 | 0.8 | GO:0030490 | maturation of SSU-rRNA(GO:0030490) |
| 0.0 | 0.5 | GO:0048747 | muscle fiber development(GO:0048747) |
| 0.0 | 0.3 | GO:0010107 | potassium ion import(GO:0010107) |
| 0.0 | 0.1 | GO:0006607 | NLS-bearing protein import into nucleus(GO:0006607) |
| 0.0 | 0.7 | GO:0006888 | ER to Golgi vesicle-mediated transport(GO:0006888) |
Gene overrepresentation in cellular component category:
| Log-likelihood per target | Total log-likelihood | Term | Description |
|---|---|---|---|
| 13.0 | 64.8 | GO:0005927 | muscle tendon junction(GO:0005927) |
| 9.9 | 39.7 | GO:0061474 | phagolysosome membrane(GO:0061474) |
| 5.4 | 37.8 | GO:0071986 | Ragulator complex(GO:0071986) |
| 5.2 | 15.6 | GO:0005899 | insulin receptor complex(GO:0005899) |
| 5.1 | 15.2 | GO:1990796 | photoreceptor cell terminal bouton(GO:1990796) |
| 4.7 | 23.6 | GO:0034751 | aryl hydrocarbon receptor complex(GO:0034751) |
| 4.2 | 42.2 | GO:0005641 | nuclear envelope lumen(GO:0005641) |
| 4.2 | 29.1 | GO:0097136 | Bcl-2 family protein complex(GO:0097136) |
| 3.7 | 14.9 | GO:0097487 | multivesicular body, internal vesicle(GO:0097487) |
| 3.4 | 16.9 | GO:0097413 | Lewy body(GO:0097413) |
| 3.4 | 16.8 | GO:0046696 | lipopolysaccharide receptor complex(GO:0046696) |
| 3.3 | 36.0 | GO:0097418 | neurofibrillary tangle(GO:0097418) |
| 3.0 | 11.8 | GO:0071144 | SMAD2-SMAD3 protein complex(GO:0071144) |
| 2.9 | 37.3 | GO:0005885 | Arp2/3 protein complex(GO:0005885) |
| 2.8 | 11.2 | GO:0045273 | respiratory chain complex II(GO:0045273) succinate dehydrogenase complex(GO:0045281) |
| 2.7 | 21.8 | GO:0000243 | commitment complex(GO:0000243) |
| 2.7 | 26.8 | GO:0043020 | NADPH oxidase complex(GO:0043020) |
| 2.6 | 18.2 | GO:0000322 | storage vacuole(GO:0000322) |
| 2.5 | 15.1 | GO:0005879 | axonemal microtubule(GO:0005879) |
| 2.5 | 32.5 | GO:0033179 | proton-transporting V-type ATPase, V0 domain(GO:0033179) |
| 2.3 | 18.3 | GO:0071541 | eukaryotic translation initiation factor 3 complex, eIF3m(GO:0071541) |
| 2.2 | 8.7 | GO:0005968 | Rab-protein geranylgeranyltransferase complex(GO:0005968) |
| 2.1 | 17.2 | GO:0097452 | GAIT complex(GO:0097452) |
| 2.0 | 4.1 | GO:0097629 | extrinsic component of omegasome membrane(GO:0097629) |
| 2.0 | 19.7 | GO:0042587 | glycogen granule(GO:0042587) |
| 2.0 | 25.5 | GO:0016342 | catenin complex(GO:0016342) |
| 1.9 | 21.2 | GO:0005852 | eukaryotic translation initiation factor 3 complex(GO:0005852) |
| 1.9 | 17.1 | GO:0033256 | I-kappaB/NF-kappaB complex(GO:0033256) |
| 1.9 | 11.4 | GO:0071817 | MMXD complex(GO:0071817) |
| 1.7 | 3.5 | GO:0030906 | retromer, cargo-selective complex(GO:0030906) |
| 1.7 | 13.7 | GO:0097197 | tetraspanin-enriched microdomain(GO:0097197) |
| 1.7 | 8.5 | GO:0097169 | IPAF inflammasome complex(GO:0072557) AIM2 inflammasome complex(GO:0097169) |
| 1.6 | 18.0 | GO:0042555 | MCM complex(GO:0042555) |
| 1.6 | 7.9 | GO:0031085 | BLOC-3 complex(GO:0031085) |
| 1.6 | 9.4 | GO:0070765 | gamma-secretase complex(GO:0070765) |
| 1.6 | 14.0 | GO:0033263 | CORVET complex(GO:0033263) |
| 1.5 | 3.1 | GO:1990590 | ATF1-ATF4 transcription factor complex(GO:1990590) |
| 1.5 | 13.7 | GO:0031082 | BLOC complex(GO:0031082) |
| 1.5 | 6.0 | GO:0097025 | MPP7-DLG1-LIN7 complex(GO:0097025) |
| 1.5 | 6.0 | GO:0044393 | TCR signalosome(GO:0036398) microspike(GO:0044393) |
| 1.4 | 4.3 | GO:1990723 | cytoplasmic periphery of the nuclear pore complex(GO:1990723) |
| 1.4 | 10.9 | GO:1990316 | ATG1/ULK1 kinase complex(GO:1990316) |
| 1.4 | 8.2 | GO:0030896 | checkpoint clamp complex(GO:0030896) |
| 1.3 | 3.9 | GO:0033557 | Slx1-Slx4 complex(GO:0033557) |
| 1.3 | 6.3 | GO:0061689 | tricellular tight junction(GO:0061689) |
| 1.2 | 6.2 | GO:0070044 | synaptobrevin 2-SNAP-25-syntaxin-1a complex(GO:0070044) |
| 1.2 | 13.6 | GO:0005797 | Golgi medial cisterna(GO:0005797) |
| 1.2 | 8.4 | GO:0019907 | cyclin-dependent protein kinase activating kinase holoenzyme complex(GO:0019907) |
| 1.2 | 14.1 | GO:0030008 | TRAPP complex(GO:0030008) |
| 1.2 | 620.1 | GO:0005764 | lytic vacuole(GO:0000323) lysosome(GO:0005764) |
| 1.2 | 15.0 | GO:0030904 | retromer complex(GO:0030904) |
| 1.2 | 4.6 | GO:0033018 | sarcoplasmic reticulum lumen(GO:0033018) |
| 1.1 | 3.2 | GO:1990826 | nucleoplasmic periphery of the nuclear pore complex(GO:1990826) |
| 1.1 | 34.0 | GO:0005721 | pericentric heterochromatin(GO:0005721) |
| 1.0 | 3.1 | GO:0031510 | SUMO activating enzyme complex(GO:0031510) |
| 1.0 | 3.1 | GO:0031680 | G-protein beta/gamma-subunit complex(GO:0031680) |
| 1.0 | 13.3 | GO:0035253 | ciliary rootlet(GO:0035253) |
| 1.0 | 4.1 | GO:0034274 | Atg12-Atg5-Atg16 complex(GO:0034274) |
| 1.0 | 11.8 | GO:0005662 | DNA replication factor A complex(GO:0005662) |
| 1.0 | 2.9 | GO:0005960 | glycine cleavage complex(GO:0005960) |
| 1.0 | 10.5 | GO:0032541 | cortical endoplasmic reticulum(GO:0032541) |
| 0.9 | 91.6 | GO:0016605 | PML body(GO:0016605) |
| 0.9 | 11.5 | GO:0044666 | MLL3/4 complex(GO:0044666) |
| 0.9 | 7.0 | GO:0001940 | male pronucleus(GO:0001940) |
| 0.9 | 6.1 | GO:0005827 | polar microtubule(GO:0005827) |
| 0.9 | 7.7 | GO:0000813 | ESCRT I complex(GO:0000813) |
| 0.8 | 6.4 | GO:0042105 | alpha-beta T cell receptor complex(GO:0042105) |
| 0.8 | 7.2 | GO:0031464 | Cul4A-RING E3 ubiquitin ligase complex(GO:0031464) |
| 0.8 | 3.2 | GO:1990630 | IRE1-RACK1-PP2A complex(GO:1990630) |
| 0.8 | 5.4 | GO:0030981 | cortical microtubule cytoskeleton(GO:0030981) |
| 0.8 | 20.9 | GO:0030140 | trans-Golgi network transport vesicle(GO:0030140) |
| 0.8 | 2.3 | GO:0071149 | TEAD-1-YAP complex(GO:0071148) TEAD-2-YAP complex(GO:0071149) |
| 0.7 | 11.2 | GO:0000153 | cytoplasmic ubiquitin ligase complex(GO:0000153) |
| 0.7 | 5.0 | GO:0098797 | plasma membrane protein complex(GO:0098797) |
| 0.7 | 2.1 | GO:0061673 | mitotic spindle astral microtubule(GO:0061673) |
| 0.7 | 3.4 | GO:0005947 | mitochondrial alpha-ketoglutarate dehydrogenase complex(GO:0005947) |
| 0.7 | 10.3 | GO:0032591 | dendritic spine membrane(GO:0032591) |
| 0.7 | 4.7 | GO:0042382 | paraspeckles(GO:0042382) |
| 0.7 | 8.7 | GO:0030914 | STAGA complex(GO:0030914) |
| 0.7 | 5.3 | GO:0065010 | extracellular membrane-bounded organelle(GO:0065010) |
| 0.7 | 13.8 | GO:0031528 | microvillus membrane(GO:0031528) |
| 0.6 | 9.5 | GO:0035102 | PRC1 complex(GO:0035102) |
| 0.6 | 15.8 | GO:0032839 | dendrite cytoplasm(GO:0032839) |
| 0.6 | 3.6 | GO:0001651 | dense fibrillar component(GO:0001651) |
| 0.6 | 4.8 | GO:0042613 | MHC class II protein complex(GO:0042613) |
| 0.6 | 3.0 | GO:0048179 | activin receptor complex(GO:0048179) |
| 0.6 | 1.8 | GO:0033185 | dolichol-phosphate-mannose synthase complex(GO:0033185) |
| 0.6 | 1.8 | GO:0045203 | intrinsic component of cell outer membrane(GO:0031230) integral component of cell outer membrane(GO:0045203) |
| 0.6 | 37.0 | GO:0000792 | heterochromatin(GO:0000792) |
| 0.6 | 2.9 | GO:0005642 | annulate lamellae(GO:0005642) |
| 0.6 | 9.6 | GO:0005685 | U1 snRNP(GO:0005685) |
| 0.6 | 7.8 | GO:0001891 | phagocytic cup(GO:0001891) |
| 0.5 | 15.9 | GO:0001772 | immunological synapse(GO:0001772) |
| 0.5 | 37.1 | GO:0030136 | clathrin-coated vesicle(GO:0030136) |
| 0.5 | 33.7 | GO:1903293 | phosphatase complex(GO:1903293) |
| 0.5 | 12.9 | GO:0000242 | pericentriolar material(GO:0000242) |
| 0.5 | 33.5 | GO:0005811 | lipid particle(GO:0005811) |
| 0.5 | 75.6 | GO:0005741 | mitochondrial outer membrane(GO:0005741) |
| 0.5 | 8.6 | GO:0031235 | intrinsic component of the cytoplasmic side of the plasma membrane(GO:0031235) |
| 0.5 | 26.2 | GO:0048770 | melanosome(GO:0042470) pigment granule(GO:0048770) |
| 0.5 | 1.5 | GO:0030956 | glutamyl-tRNA(Gln) amidotransferase complex(GO:0030956) |
| 0.5 | 2.0 | GO:0071010 | prespliceosome(GO:0071010) |
| 0.5 | 1.5 | GO:0005818 | astral microtubule(GO:0000235) aster(GO:0005818) |
| 0.5 | 1.5 | GO:0045025 | mitochondrial degradosome(GO:0045025) |
| 0.5 | 5.2 | GO:0035631 | CD40 receptor complex(GO:0035631) |
| 0.5 | 9.3 | GO:0016460 | myosin II complex(GO:0016460) |
| 0.5 | 18.6 | GO:0009925 | basal plasma membrane(GO:0009925) |
| 0.5 | 31.5 | GO:0031526 | brush border membrane(GO:0031526) |
| 0.5 | 5.0 | GO:0044294 | dendritic growth cone(GO:0044294) |
| 0.4 | 33.4 | GO:0005770 | late endosome(GO:0005770) |
| 0.4 | 1.3 | GO:0044308 | axonal spine(GO:0044308) |
| 0.4 | 9.2 | GO:0035371 | microtubule plus-end(GO:0035371) |
| 0.4 | 4.5 | GO:0034364 | high-density lipoprotein particle(GO:0034364) |
| 0.4 | 2.1 | GO:0016281 | eukaryotic translation initiation factor 4F complex(GO:0016281) |
| 0.4 | 7.4 | GO:0031430 | M band(GO:0031430) |
| 0.4 | 17.8 | GO:0005776 | autophagosome(GO:0005776) |
| 0.4 | 7.6 | GO:0032588 | trans-Golgi network membrane(GO:0032588) |
| 0.4 | 24.9 | GO:0005901 | caveola(GO:0005901) |
| 0.4 | 17.1 | GO:0005871 | kinesin complex(GO:0005871) |
| 0.4 | 14.1 | GO:0032154 | cleavage furrow(GO:0032154) cell surface furrow(GO:0097610) |
| 0.4 | 1.8 | GO:0070761 | pre-snoRNP complex(GO:0070761) |
| 0.3 | 15.0 | GO:0045171 | intercellular bridge(GO:0045171) |
| 0.3 | 7.0 | GO:0005640 | nuclear outer membrane(GO:0005640) |
| 0.3 | 2.8 | GO:0072669 | tRNA-splicing ligase complex(GO:0072669) |
| 0.3 | 8.6 | GO:0035145 | exon-exon junction complex(GO:0035145) |
| 0.3 | 4.8 | GO:0005847 | mRNA cleavage and polyadenylation specificity factor complex(GO:0005847) |
| 0.3 | 2.9 | GO:0008290 | F-actin capping protein complex(GO:0008290) |
| 0.3 | 1.9 | GO:0042788 | polysomal ribosome(GO:0042788) |
| 0.3 | 1.2 | GO:0042405 | nuclear inclusion body(GO:0042405) |
| 0.3 | 1.5 | GO:0042719 | mitochondrial intermembrane space protein transporter complex(GO:0042719) |
| 0.3 | 4.6 | GO:0030126 | COPI vesicle coat(GO:0030126) |
| 0.3 | 42.2 | GO:0005681 | spliceosomal complex(GO:0005681) |
| 0.3 | 0.6 | GO:1990730 | VCP-NSFL1C complex(GO:1990730) |
| 0.3 | 7.0 | GO:0010494 | cytoplasmic stress granule(GO:0010494) |
| 0.3 | 25.5 | GO:0022625 | cytosolic large ribosomal subunit(GO:0022625) |
| 0.3 | 2.4 | GO:0099634 | postsynaptic specialization membrane(GO:0099634) |
| 0.3 | 5.3 | GO:0005614 | interstitial matrix(GO:0005614) |
| 0.3 | 30.0 | GO:0031234 | extrinsic component of cytoplasmic side of plasma membrane(GO:0031234) |
| 0.3 | 0.8 | GO:0032593 | insulin-responsive compartment(GO:0032593) |
| 0.3 | 3.9 | GO:0044217 | other organism(GO:0044215) other organism cell(GO:0044216) other organism part(GO:0044217) |
| 0.3 | 0.5 | GO:0071818 | BAT3 complex(GO:0071818) ER membrane insertion complex(GO:0072379) |
| 0.3 | 11.2 | GO:0005788 | endoplasmic reticulum lumen(GO:0005788) |
| 0.3 | 3.3 | GO:0000276 | mitochondrial proton-transporting ATP synthase complex, coupling factor F(o)(GO:0000276) |
| 0.3 | 58.4 | GO:0031965 | nuclear membrane(GO:0031965) |
| 0.2 | 1.0 | GO:0000408 | EKC/KEOPS complex(GO:0000408) |
| 0.2 | 3.4 | GO:0000346 | transcription export complex(GO:0000346) |
| 0.2 | 22.1 | GO:0005769 | early endosome(GO:0005769) |
| 0.2 | 1.4 | GO:0005952 | cAMP-dependent protein kinase complex(GO:0005952) |
| 0.2 | 11.4 | GO:0005657 | replication fork(GO:0005657) |
| 0.2 | 1.1 | GO:0008024 | cyclin/CDK positive transcription elongation factor complex(GO:0008024) |
| 0.2 | 1.6 | GO:0061617 | MICOS complex(GO:0061617) |
| 0.2 | 7.6 | GO:0060077 | inhibitory synapse(GO:0060077) |
| 0.2 | 0.9 | GO:0042824 | MHC class I peptide loading complex(GO:0042824) |
| 0.2 | 0.8 | GO:0044615 | nuclear pore nuclear basket(GO:0044615) |
| 0.2 | 24.9 | GO:0001650 | fibrillar center(GO:0001650) |
| 0.2 | 2.4 | GO:0030666 | endocytic vesicle membrane(GO:0030666) |
| 0.2 | 5.1 | GO:0000788 | nuclear nucleosome(GO:0000788) |
| 0.2 | 100.7 | GO:0016604 | nuclear body(GO:0016604) |
| 0.2 | 9.5 | GO:0031903 | peroxisomal membrane(GO:0005778) microbody membrane(GO:0031903) |
| 0.2 | 11.8 | GO:0000932 | cytoplasmic mRNA processing body(GO:0000932) |
| 0.2 | 0.6 | GO:0031931 | TORC1 complex(GO:0031931) |
| 0.2 | 11.3 | GO:0031463 | Cul3-RING ubiquitin ligase complex(GO:0031463) |
| 0.2 | 2.0 | GO:0031258 | lamellipodium membrane(GO:0031258) |
| 0.2 | 17.3 | GO:0032993 | protein-DNA complex(GO:0032993) |
| 0.2 | 27.7 | GO:0005925 | focal adhesion(GO:0005925) |
| 0.2 | 9.2 | GO:0005581 | collagen trimer(GO:0005581) |
| 0.2 | 0.7 | GO:0032299 | ribonuclease H2 complex(GO:0032299) |
| 0.2 | 2.7 | GO:0016459 | myosin complex(GO:0016459) |
| 0.2 | 4.3 | GO:0070382 | exocytic vesicle(GO:0070382) |
| 0.2 | 1.1 | GO:0005652 | nuclear lamina(GO:0005652) |
| 0.2 | 62.8 | GO:0005740 | mitochondrial envelope(GO:0005740) |
| 0.1 | 0.7 | GO:0045098 | type III intermediate filament(GO:0045098) |
| 0.1 | 2.8 | GO:0005680 | anaphase-promoting complex(GO:0005680) |
| 0.1 | 5.4 | GO:0046658 | anchored component of plasma membrane(GO:0046658) |
| 0.1 | 326.0 | GO:0070062 | extracellular exosome(GO:0070062) |
| 0.1 | 3.8 | GO:0005768 | endosome(GO:0005768) |
| 0.1 | 4.0 | GO:0000118 | histone deacetylase complex(GO:0000118) |
| 0.1 | 36.3 | GO:0000139 | Golgi membrane(GO:0000139) |
| 0.1 | 4.2 | GO:0055037 | recycling endosome(GO:0055037) |
| 0.1 | 4.4 | GO:0005774 | vacuolar membrane(GO:0005774) |
| 0.1 | 1.7 | GO:0000307 | cyclin-dependent protein kinase holoenzyme complex(GO:0000307) |
| 0.1 | 3.2 | GO:0015935 | small ribosomal subunit(GO:0015935) |
| 0.1 | 1.4 | GO:0031672 | A band(GO:0031672) |
| 0.1 | 1.7 | GO:0033017 | sarcoplasmic reticulum membrane(GO:0033017) |
| 0.1 | 2.6 | GO:0097060 | synaptic membrane(GO:0097060) |
| 0.1 | 3.4 | GO:0005840 | ribosome(GO:0005840) |
| 0.1 | 1.3 | GO:0000780 | condensed nuclear chromosome, centromeric region(GO:0000780) |
| 0.1 | 1.7 | GO:0005604 | basement membrane(GO:0005604) |
| 0.1 | 0.9 | GO:0008250 | oligosaccharyltransferase complex(GO:0008250) |
| 0.1 | 1.7 | GO:0030686 | 90S preribosome(GO:0030686) |
| 0.1 | 0.9 | GO:0005790 | smooth endoplasmic reticulum(GO:0005790) |
| 0.1 | 24.4 | GO:0005730 | nucleolus(GO:0005730) |
| 0.1 | 1.7 | GO:0098802 | plasma membrane receptor complex(GO:0098802) |
| 0.1 | 3.3 | GO:0001726 | ruffle(GO:0001726) |
| 0.1 | 1.2 | GO:0042645 | nucleoid(GO:0009295) mitochondrial nucleoid(GO:0042645) |
| 0.1 | 12.9 | GO:0000785 | chromatin(GO:0000785) |
| 0.1 | 0.4 | GO:0046930 | pore complex(GO:0046930) |
| 0.0 | 2.4 | GO:0030176 | integral component of endoplasmic reticulum membrane(GO:0030176) |
| 0.0 | 0.1 | GO:0031045 | dense core granule(GO:0031045) |
| 0.0 | 30.0 | GO:0005739 | mitochondrion(GO:0005739) |
| 0.0 | 16.4 | GO:0030054 | cell junction(GO:0030054) |
| 0.0 | 4.1 | GO:0005578 | proteinaceous extracellular matrix(GO:0005578) |
| 0.0 | 108.0 | GO:0016021 | integral component of membrane(GO:0016021) |
| 0.0 | 2.3 | GO:0016324 | apical plasma membrane(GO:0016324) |
| 0.0 | 14.8 | GO:0005783 | endoplasmic reticulum(GO:0005783) |
| 0.0 | 0.2 | GO:0045177 | apical part of cell(GO:0045177) |
Gene overrepresentation in molecular function category:
| Log-likelihood per target | Total log-likelihood | Term | Description |
|---|---|---|---|
| 31.3 | 125.2 | GO:0004185 | serine-type carboxypeptidase activity(GO:0004185) |
| 14.9 | 59.6 | GO:0008449 | N-acetylglucosamine-6-sulfatase activity(GO:0008449) |
| 13.4 | 53.5 | GO:0030984 | kininogen binding(GO:0030984) |
| 12.0 | 36.0 | GO:0004724 | magnesium-dependent protein serine/threonine phosphatase activity(GO:0004724) |
| 8.6 | 25.9 | GO:0004370 | glycerol kinase activity(GO:0004370) |
| 7.9 | 23.6 | GO:0004874 | aryl hydrocarbon receptor activity(GO:0004874) |
| 7.9 | 23.6 | GO:0008263 | pyrimidine-specific mismatch base pair DNA N-glycosylase activity(GO:0008263) |
| 7.3 | 22.0 | GO:0008330 | protein tyrosine/threonine phosphatase activity(GO:0008330) |
| 6.5 | 19.5 | GO:0005290 | L-histidine transmembrane transporter activity(GO:0005290) |
| 6.3 | 6.3 | GO:0070506 | high-density lipoprotein particle receptor activity(GO:0070506) |
| 6.2 | 18.7 | GO:0008948 | oxaloacetate decarboxylase activity(GO:0008948) hydrolase activity, acting on acid carbon-carbon bonds(GO:0016822) hydrolase activity, acting on acid carbon-carbon bonds, in ketonic substances(GO:0016823) |
| 6.1 | 18.2 | GO:0016230 | sphingomyelin phosphodiesterase activator activity(GO:0016230) |
| 5.9 | 29.4 | GO:0008321 | Ral guanyl-nucleotide exchange factor activity(GO:0008321) |
| 5.7 | 17.0 | GO:0031871 | proteinase activated receptor binding(GO:0031871) |
| 5.3 | 26.4 | GO:0072345 | NAADP-sensitive calcium-release channel activity(GO:0072345) |
| 5.3 | 47.3 | GO:0031995 | insulin-like growth factor II binding(GO:0031995) |
| 5.1 | 40.9 | GO:0016936 | galactoside binding(GO:0016936) |
| 5.0 | 40.3 | GO:0031419 | cobalamin binding(GO:0031419) |
| 4.6 | 27.8 | GO:0051434 | BH3 domain binding(GO:0051434) |
| 4.6 | 13.7 | GO:1990460 | leptin receptor binding(GO:1990460) |
| 4.5 | 18.1 | GO:0008240 | tripeptidyl-peptidase activity(GO:0008240) |
| 4.5 | 35.8 | GO:0005068 | transmembrane receptor protein tyrosine kinase adaptor activity(GO:0005068) |
| 4.4 | 13.3 | GO:0001069 | regulatory region RNA binding(GO:0001069) |
| 4.3 | 17.0 | GO:1990189 | peptide-serine-N-acetyltransferase activity(GO:1990189) |
| 4.2 | 12.5 | GO:0004392 | heme oxygenase (decyclizing) activity(GO:0004392) |
| 4.1 | 37.3 | GO:0005072 | transforming growth factor beta receptor, cytoplasmic mediator activity(GO:0005072) |
| 4.1 | 20.6 | GO:0004945 | angiotensin type II receptor activity(GO:0004945) |
| 3.9 | 19.5 | GO:0001665 | alpha-N-acetylgalactosaminide alpha-2,6-sialyltransferase activity(GO:0001665) |
| 3.5 | 31.9 | GO:0032050 | clathrin heavy chain binding(GO:0032050) |
| 3.5 | 66.9 | GO:0005247 | voltage-gated chloride channel activity(GO:0005247) |
| 3.5 | 24.4 | GO:0033592 | RNA strand annealing activity(GO:0033592) |
| 3.4 | 13.7 | GO:0005163 | nerve growth factor receptor binding(GO:0005163) |
| 3.4 | 16.8 | GO:0034186 | apolipoprotein A-I binding(GO:0034186) |
| 3.3 | 10.0 | GO:1990050 | phosphatidic acid transporter activity(GO:1990050) |
| 3.2 | 38.2 | GO:0015379 | potassium:chloride symporter activity(GO:0015379) potassium ion symporter activity(GO:0022820) |
| 3.1 | 24.6 | GO:0008430 | selenium binding(GO:0008430) |
| 3.0 | 12.2 | GO:0071558 | histone demethylase activity (H3-K27 specific)(GO:0071558) |
| 2.8 | 17.0 | GO:0070180 | large ribosomal subunit rRNA binding(GO:0070180) |
| 2.8 | 11.2 | GO:0000104 | succinate dehydrogenase activity(GO:0000104) |
| 2.8 | 11.2 | GO:0019776 | Atg8 ligase activity(GO:0019776) |
| 2.8 | 13.8 | GO:0051032 | nucleic acid transmembrane transporter activity(GO:0051032) RNA transmembrane transporter activity(GO:0051033) |
| 2.7 | 21.3 | GO:0045545 | syndecan binding(GO:0045545) |
| 2.6 | 10.4 | GO:0004949 | cannabinoid receptor activity(GO:0004949) |
| 2.5 | 7.6 | GO:0005302 | L-tyrosine transmembrane transporter activity(GO:0005302) |
| 2.5 | 27.9 | GO:0005375 | copper ion transmembrane transporter activity(GO:0005375) |
| 2.5 | 4.9 | GO:0015186 | L-glutamine transmembrane transporter activity(GO:0015186) |
| 2.5 | 12.3 | GO:0019770 | IgG receptor activity(GO:0019770) |
| 2.4 | 9.7 | GO:0016833 | oxo-acid-lyase activity(GO:0016833) |
| 2.4 | 26.1 | GO:0042577 | lipid phosphatase activity(GO:0042577) |
| 2.3 | 9.4 | GO:0035614 | snRNA stem-loop binding(GO:0035614) |
| 2.3 | 7.0 | GO:0005119 | smoothened binding(GO:0005119) |
| 2.3 | 16.2 | GO:0031852 | mu-type opioid receptor binding(GO:0031852) |
| 2.3 | 20.5 | GO:0016175 | superoxide-generating NADPH oxidase activity(GO:0016175) |
| 2.2 | 17.5 | GO:0004022 | alcohol dehydrogenase (NAD) activity(GO:0004022) |
| 2.2 | 15.1 | GO:0035251 | UDP-glucosyltransferase activity(GO:0035251) |
| 2.1 | 6.2 | GO:0005483 | soluble NSF attachment protein activity(GO:0005483) |
| 2.0 | 20.1 | GO:0008239 | dipeptidyl-peptidase activity(GO:0008239) |
| 2.0 | 11.8 | GO:0008294 | calcium- and calmodulin-responsive adenylate cyclase activity(GO:0008294) |
| 1.9 | 5.7 | GO:0008476 | protein-tyrosine sulfotransferase activity(GO:0008476) |
| 1.9 | 11.5 | GO:0030976 | thiamine pyrophosphate binding(GO:0030976) |
| 1.9 | 9.5 | GO:0003997 | acyl-CoA oxidase activity(GO:0003997) |
| 1.8 | 14.7 | GO:0031386 | protein tag(GO:0031386) |
| 1.8 | 9.2 | GO:0008499 | UDP-galactose:beta-N-acetylglucosamine beta-1,3-galactosyltransferase activity(GO:0008499) |
| 1.8 | 7.3 | GO:0015184 | L-cystine transmembrane transporter activity(GO:0015184) |
| 1.8 | 10.9 | GO:0042289 | MHC class II protein binding(GO:0042289) |
| 1.8 | 32.6 | GO:0032454 | histone demethylase activity (H3-K9 specific)(GO:0032454) |
| 1.8 | 7.2 | GO:0052794 | exo-alpha-(2->3)-sialidase activity(GO:0052794) exo-alpha-(2->6)-sialidase activity(GO:0052795) exo-alpha-(2->8)-sialidase activity(GO:0052796) |
| 1.8 | 5.3 | GO:0033906 | hyaluronoglucuronidase activity(GO:0033906) |
| 1.7 | 7.0 | GO:0070579 | methylcytosine dioxygenase activity(GO:0070579) |
| 1.7 | 6.9 | GO:0004176 | ATP-dependent peptidase activity(GO:0004176) |
| 1.7 | 6.8 | GO:0005534 | galactose binding(GO:0005534) |
| 1.7 | 13.4 | GO:0035184 | histone threonine kinase activity(GO:0035184) |
| 1.7 | 5.0 | GO:0017042 | glycosylceramidase activity(GO:0017042) |
| 1.6 | 8.2 | GO:0004563 | beta-N-acetylhexosaminidase activity(GO:0004563) |
| 1.6 | 6.4 | GO:1904288 | BAT3 complex binding(GO:1904288) |
| 1.6 | 4.8 | GO:0046976 | histone methyltransferase activity (H3-K27 specific)(GO:0046976) |
| 1.6 | 14.4 | GO:1904264 | ubiquitin protein ligase activity involved in ERAD pathway(GO:1904264) |
| 1.6 | 4.8 | GO:0032422 | purine-rich negative regulatory element binding(GO:0032422) |
| 1.6 | 9.4 | GO:0001849 | complement component C1q binding(GO:0001849) |
| 1.6 | 15.6 | GO:0034450 | ubiquitin-ubiquitin ligase activity(GO:0034450) |
| 1.6 | 4.7 | GO:0031432 | titin binding(GO:0031432) |
| 1.5 | 7.6 | GO:0005105 | type 1 fibroblast growth factor receptor binding(GO:0005105) |
| 1.4 | 11.4 | GO:0046527 | glucosyltransferase activity(GO:0046527) |
| 1.4 | 4.2 | GO:0004911 | interleukin-2 receptor activity(GO:0004911) |
| 1.4 | 16.9 | GO:0019911 | structural constituent of myelin sheath(GO:0019911) |
| 1.4 | 4.2 | GO:0003976 | UDP-N-acetylglucosamine-lysosomal-enzyme N-acetylglucosaminephosphotransferase activity(GO:0003976) |
| 1.4 | 25.1 | GO:0015279 | store-operated calcium channel activity(GO:0015279) |
| 1.4 | 15.2 | GO:0050544 | arachidonic acid binding(GO:0050544) |
| 1.4 | 31.5 | GO:0016641 | oxidoreductase activity, acting on the CH-NH2 group of donors, oxygen as acceptor(GO:0016641) |
| 1.3 | 24.1 | GO:0004602 | glutathione peroxidase activity(GO:0004602) |
| 1.3 | 19.0 | GO:0016889 | endodeoxyribonuclease activity, producing 3'-phosphomonoesters(GO:0016889) |
| 1.3 | 12.6 | GO:0008484 | sulfuric ester hydrolase activity(GO:0008484) |
| 1.3 | 2.5 | GO:0004698 | calcium-dependent protein kinase C activity(GO:0004698) |
| 1.2 | 3.7 | GO:0004574 | oligo-1,6-glucosidase activity(GO:0004574) |
| 1.2 | 13.7 | GO:0005346 | adenine nucleotide transmembrane transporter activity(GO:0000295) purine ribonucleotide transmembrane transporter activity(GO:0005346) |
| 1.2 | 9.9 | GO:0016421 | CoA carboxylase activity(GO:0016421) |
| 1.2 | 9.7 | GO:1990825 | sequence-specific mRNA binding(GO:1990825) |
| 1.2 | 7.2 | GO:0046624 | sphingolipid transporter activity(GO:0046624) |
| 1.2 | 6.0 | GO:0097016 | L27 domain binding(GO:0097016) |
| 1.2 | 7.2 | GO:0043141 | ATP-dependent 5'-3' DNA helicase activity(GO:0043141) |
| 1.2 | 30.0 | GO:0008198 | ferrous iron binding(GO:0008198) |
| 1.2 | 4.8 | GO:0003835 | beta-galactoside alpha-2,6-sialyltransferase activity(GO:0003835) |
| 1.2 | 21.1 | GO:0044548 | S100 protein binding(GO:0044548) |
| 1.1 | 11.5 | GO:0003857 | 3-hydroxyacyl-CoA dehydrogenase activity(GO:0003857) |
| 1.1 | 21.3 | GO:0016881 | acid-amino acid ligase activity(GO:0016881) |
| 1.1 | 8.9 | GO:0005168 | neurotrophin TRKA receptor binding(GO:0005168) |
| 1.1 | 8.7 | GO:0016308 | 1-phosphatidylinositol-4-phosphate 5-kinase activity(GO:0016308) |
| 1.1 | 23.5 | GO:0016922 | ligand-dependent nuclear receptor binding(GO:0016922) |
| 1.1 | 48.0 | GO:0048365 | Rac GTPase binding(GO:0048365) |
| 1.1 | 8.5 | GO:0016888 | endodeoxyribonuclease activity, producing 5'-phosphomonoesters(GO:0016888) |
| 1.1 | 6.4 | GO:0004616 | phosphogluconate dehydrogenase (decarboxylating) activity(GO:0004616) |
| 1.1 | 50.9 | GO:0019213 | deacetylase activity(GO:0019213) |
| 1.1 | 11.6 | GO:0001161 | intronic transcription regulatory region sequence-specific DNA binding(GO:0001161) |
| 1.0 | 3.1 | GO:0044388 | small protein activating enzyme binding(GO:0044388) |
| 1.0 | 9.4 | GO:0008553 | hydrogen-exporting ATPase activity, phosphorylative mechanism(GO:0008553) |
| 1.0 | 7.2 | GO:0008603 | cAMP-dependent protein kinase regulator activity(GO:0008603) |
| 1.0 | 4.1 | GO:0003831 | beta-N-acetylglucosaminylglycopeptide beta-1,4-galactosyltransferase activity(GO:0003831) |
| 1.0 | 4.1 | GO:0004594 | pantothenate kinase activity(GO:0004594) |
| 1.0 | 6.0 | GO:0043426 | MRF binding(GO:0043426) |
| 1.0 | 1.0 | GO:0015016 | [heparan sulfate]-glucosamine N-sulfotransferase activity(GO:0015016) |
| 1.0 | 3.0 | GO:0019912 | cyclin-dependent protein kinase activating kinase activity(GO:0019912) |
| 1.0 | 14.7 | GO:0009982 | pseudouridine synthase activity(GO:0009982) |
| 1.0 | 2.9 | GO:0004159 | dihydrouracil dehydrogenase (NAD+) activity(GO:0004159) dihydropyrimidine dehydrogenase (NADP+) activity(GO:0017113) |
| 1.0 | 4.9 | GO:0034597 | phosphatidylinositol-4,5-bisphosphate 4-phosphatase activity(GO:0034597) |
| 1.0 | 21.4 | GO:0005070 | SH3/SH2 adaptor activity(GO:0005070) |
| 1.0 | 41.6 | GO:0001205 | transcriptional activator activity, RNA polymerase II distal enhancer sequence-specific binding(GO:0001205) |
| 1.0 | 3.8 | GO:0030144 | alpha-1,6-mannosylglycoprotein 6-beta-N-acetylglucosaminyltransferase activity(GO:0030144) |
| 1.0 | 2.9 | GO:0051425 | PTB domain binding(GO:0051425) |
| 0.9 | 10.4 | GO:0003708 | retinoic acid receptor activity(GO:0003708) |
| 0.9 | 4.7 | GO:0001042 | RNA polymerase I core binding(GO:0001042) |
| 0.9 | 12.3 | GO:0042609 | CD4 receptor binding(GO:0042609) |
| 0.9 | 17.9 | GO:0005149 | interleukin-1 receptor binding(GO:0005149) |
| 0.9 | 20.5 | GO:0000983 | transcription factor activity, RNA polymerase II core promoter sequence-specific(GO:0000983) |
| 0.9 | 2.8 | GO:0004736 | pyruvate carboxylase activity(GO:0004736) |
| 0.9 | 2.8 | GO:0071535 | RING-like zinc finger domain binding(GO:0071535) |
| 0.9 | 5.4 | GO:0005384 | manganese ion transmembrane transporter activity(GO:0005384) |
| 0.9 | 10.0 | GO:0008656 | cysteine-type endopeptidase activator activity involved in apoptotic process(GO:0008656) |
| 0.9 | 6.3 | GO:0016176 | superoxide-generating NADPH oxidase activator activity(GO:0016176) |
| 0.9 | 7.1 | GO:0050291 | sphingosine N-acyltransferase activity(GO:0050291) |
| 0.9 | 7.1 | GO:0003680 | AT DNA binding(GO:0003680) |
| 0.9 | 6.2 | GO:0004767 | sphingomyelin phosphodiesterase activity(GO:0004767) |
| 0.9 | 7.0 | GO:0008479 | queuine tRNA-ribosyltransferase activity(GO:0008479) |
| 0.9 | 6.0 | GO:0098599 | palmitoyl-(protein) hydrolase activity(GO:0008474) palmitoyl hydrolase activity(GO:0098599) |
| 0.8 | 4.2 | GO:0015166 | polyol transmembrane transporter activity(GO:0015166) glycerol transmembrane transporter activity(GO:0015168) |
| 0.8 | 4.9 | GO:0003917 | DNA topoisomerase type I activity(GO:0003917) |
| 0.8 | 11.5 | GO:0008373 | sialyltransferase activity(GO:0008373) |
| 0.8 | 7.3 | GO:0015232 | heme transporter activity(GO:0015232) |
| 0.8 | 20.9 | GO:0004190 | aspartic-type endopeptidase activity(GO:0004190) |
| 0.8 | 3.2 | GO:0016426 | tRNA (adenine) methyltransferase activity(GO:0016426) |
| 0.8 | 38.2 | GO:0005507 | copper ion binding(GO:0005507) |
| 0.8 | 9.3 | GO:0070700 | BMP receptor binding(GO:0070700) |
| 0.8 | 8.5 | GO:0097200 | cysteine-type endopeptidase activity involved in apoptotic process(GO:0097153) cysteine-type endopeptidase activity involved in execution phase of apoptosis(GO:0097200) |
| 0.8 | 7.7 | GO:0016929 | SUMO-specific protease activity(GO:0016929) |
| 0.8 | 23.9 | GO:0030374 | ligand-dependent nuclear receptor transcription coactivator activity(GO:0030374) |
| 0.8 | 1.5 | GO:0050567 | glutaminyl-tRNA synthase (glutamine-hydrolyzing) activity(GO:0050567) |
| 0.8 | 4.5 | GO:0070403 | NAD+ binding(GO:0070403) |
| 0.8 | 16.5 | GO:0008327 | methyl-CpG binding(GO:0008327) |
| 0.8 | 36.8 | GO:0030971 | receptor tyrosine kinase binding(GO:0030971) |
| 0.7 | 15.3 | GO:0005521 | lamin binding(GO:0005521) |
| 0.7 | 3.6 | GO:0044547 | DNA topoisomerase binding(GO:0044547) |
| 0.7 | 10.8 | GO:0032266 | phosphatidylinositol-3-phosphate binding(GO:0032266) |
| 0.7 | 10.0 | GO:0005092 | GDP-dissociation inhibitor activity(GO:0005092) |
| 0.7 | 12.1 | GO:0005388 | calcium-transporting ATPase activity(GO:0005388) |
| 0.7 | 3.5 | GO:0015220 | choline transmembrane transporter activity(GO:0015220) |
| 0.7 | 2.7 | GO:0050693 | LBD domain binding(GO:0050693) |
| 0.7 | 30.8 | GO:0017112 | Rab guanyl-nucleotide exchange factor activity(GO:0017112) |
| 0.7 | 6.1 | GO:0016846 | carbon-sulfur lyase activity(GO:0016846) |
| 0.7 | 5.3 | GO:0004035 | alkaline phosphatase activity(GO:0004035) |
| 0.7 | 26.5 | GO:0016811 | hydrolase activity, acting on carbon-nitrogen (but not peptide) bonds, in linear amides(GO:0016811) |
| 0.7 | 6.0 | GO:0008381 | mechanically-gated ion channel activity(GO:0008381) mechanically gated channel activity(GO:0022833) |
| 0.7 | 48.2 | GO:0032947 | protein complex scaffold(GO:0032947) |
| 0.6 | 9.7 | GO:0070742 | C2H2 zinc finger domain binding(GO:0070742) |
| 0.6 | 10.2 | GO:0017166 | vinculin binding(GO:0017166) |
| 0.6 | 2.5 | GO:0086089 | voltage-gated potassium channel activity involved in atrial cardiac muscle cell action potential repolarization(GO:0086089) |
| 0.6 | 8.2 | GO:0005041 | low-density lipoprotein receptor activity(GO:0005041) |
| 0.6 | 8.1 | GO:0003796 | lysozyme activity(GO:0003796) |
| 0.6 | 1.2 | GO:0051538 | 3 iron, 4 sulfur cluster binding(GO:0051538) |
| 0.6 | 4.8 | GO:1901702 | urate transmembrane transporter activity(GO:0015143) salt transmembrane transporter activity(GO:1901702) |
| 0.6 | 22.0 | GO:0016831 | carboxy-lyase activity(GO:0016831) |
| 0.6 | 1.8 | GO:0004582 | dolichyl-phosphate beta-D-mannosyltransferase activity(GO:0004582) |
| 0.6 | 2.9 | GO:0031994 | insulin-like growth factor I binding(GO:0031994) neuregulin binding(GO:0038132) |
| 0.6 | 5.3 | GO:0015250 | water channel activity(GO:0015250) |
| 0.6 | 4.1 | GO:0019238 | cyclohydrolase activity(GO:0019238) |
| 0.6 | 1.7 | GO:0009041 | uridylate kinase activity(GO:0009041) nucleoside phosphate kinase activity(GO:0050145) |
| 0.6 | 2.9 | GO:0042608 | T cell receptor binding(GO:0042608) |
| 0.6 | 26.4 | GO:1901476 | carbohydrate transmembrane transporter activity(GO:0015144) carbohydrate transporter activity(GO:1901476) |
| 0.6 | 9.2 | GO:0031005 | filamin binding(GO:0031005) |
| 0.6 | 15.5 | GO:0036002 | pre-mRNA binding(GO:0036002) |
| 0.6 | 3.4 | GO:0016624 | oxidoreductase activity, acting on the aldehyde or oxo group of donors, disulfide as acceptor(GO:0016624) |
| 0.6 | 7.3 | GO:0003688 | DNA replication origin binding(GO:0003688) |
| 0.6 | 6.2 | GO:0071837 | HMG box domain binding(GO:0071837) |
| 0.5 | 18.7 | GO:0015175 | neutral amino acid transmembrane transporter activity(GO:0015175) |
| 0.5 | 11.0 | GO:0000030 | mannosyltransferase activity(GO:0000030) |
| 0.5 | 3.7 | GO:0038062 | protein tyrosine kinase collagen receptor activity(GO:0038062) |
| 0.5 | 2.7 | GO:0016661 | oxidoreductase activity, acting on other nitrogenous compounds as donors(GO:0016661) |
| 0.5 | 39.5 | GO:0003727 | single-stranded RNA binding(GO:0003727) |
| 0.5 | 12.8 | GO:0042288 | MHC class I protein binding(GO:0042288) |
| 0.5 | 6.4 | GO:1990405 | protein antigen binding(GO:1990405) |
| 0.5 | 3.7 | GO:1990247 | N6-methyladenosine-containing RNA binding(GO:1990247) |
| 0.5 | 2.5 | GO:0090554 | phosphatidylcholine-translocating ATPase activity(GO:0090554) phosphatidylethanolamine-translocating ATPase activity(GO:0090555) |
| 0.5 | 1.5 | GO:0009384 | N-acylmannosamine kinase activity(GO:0009384) |
| 0.5 | 2.5 | GO:0032051 | clathrin light chain binding(GO:0032051) |
| 0.5 | 4.0 | GO:0043495 | protein anchor(GO:0043495) |
| 0.5 | 1.5 | GO:0045340 | mercury ion binding(GO:0045340) |
| 0.5 | 2.5 | GO:0003988 | acetyl-CoA C-acyltransferase activity(GO:0003988) |
| 0.5 | 4.0 | GO:0015129 | lactate transmembrane transporter activity(GO:0015129) |
| 0.5 | 144.7 | GO:0001077 | transcriptional activator activity, RNA polymerase II core promoter proximal region sequence-specific binding(GO:0001077) |
| 0.5 | 12.7 | GO:0031492 | nucleosomal DNA binding(GO:0031492) |
| 0.5 | 28.8 | GO:0016667 | oxidoreductase activity, acting on a sulfur group of donors(GO:0016667) |
| 0.5 | 55.4 | GO:0017124 | SH3 domain binding(GO:0017124) |
| 0.5 | 20.9 | GO:0005080 | protein kinase C binding(GO:0005080) |
| 0.5 | 9.5 | GO:0005158 | insulin receptor binding(GO:0005158) |
| 0.5 | 3.3 | GO:0015119 | hexose phosphate transmembrane transporter activity(GO:0015119) organophosphate:inorganic phosphate antiporter activity(GO:0015315) hexose-phosphate:inorganic phosphate antiporter activity(GO:0015526) glucose 6-phosphate:inorganic phosphate antiporter activity(GO:0061513) |
| 0.5 | 1.4 | GO:0004661 | protein geranylgeranyltransferase activity(GO:0004661) |
| 0.5 | 1.9 | GO:0043184 | vascular endothelial growth factor receptor 2 binding(GO:0043184) |
| 0.5 | 6.9 | GO:0036442 | hydrogen-exporting ATPase activity(GO:0036442) |
| 0.5 | 25.7 | GO:0004722 | protein serine/threonine phosphatase activity(GO:0004722) |
| 0.4 | 3.6 | GO:0051400 | BH domain binding(GO:0051400) |
| 0.4 | 10.3 | GO:0070273 | phosphatidylinositol-4-phosphate binding(GO:0070273) |
| 0.4 | 13.4 | GO:0008536 | Ran GTPase binding(GO:0008536) |
| 0.4 | 12.6 | GO:0019200 | carbohydrate kinase activity(GO:0019200) |
| 0.4 | 9.4 | GO:0070006 | metalloaminopeptidase activity(GO:0070006) |
| 0.4 | 1.3 | GO:0005049 | nuclear export signal receptor activity(GO:0005049) |
| 0.4 | 1.3 | GO:0004829 | threonine-tRNA ligase activity(GO:0004829) |
| 0.4 | 2.9 | GO:0017070 | U6 snRNA binding(GO:0017070) |
| 0.4 | 2.9 | GO:0042030 | ATPase inhibitor activity(GO:0042030) |
| 0.4 | 19.5 | GO:0004402 | histone acetyltransferase activity(GO:0004402) |
| 0.4 | 1.2 | GO:0008254 | 3'-nucleotidase activity(GO:0008254) |
| 0.4 | 2.5 | GO:0008172 | S-methyltransferase activity(GO:0008172) |
| 0.4 | 1.2 | GO:0016748 | succinyltransferase activity(GO:0016748) |
| 0.4 | 3.5 | GO:0047498 | calcium-dependent phospholipase A2 activity(GO:0047498) |
| 0.4 | 7.1 | GO:0046966 | thyroid hormone receptor binding(GO:0046966) |
| 0.4 | 6.2 | GO:0008253 | 5'-nucleotidase activity(GO:0008253) |
| 0.4 | 2.7 | GO:0032554 | purine deoxyribonucleotide binding(GO:0032554) |
| 0.4 | 1.9 | GO:1990226 | histone methyltransferase binding(GO:1990226) |
| 0.4 | 11.8 | GO:0005504 | fatty acid binding(GO:0005504) |
| 0.4 | 3.3 | GO:0043295 | glutathione binding(GO:0043295) |
| 0.4 | 2.9 | GO:0030368 | interleukin-17 receptor activity(GO:0030368) |
| 0.4 | 35.7 | GO:0005200 | structural constituent of cytoskeleton(GO:0005200) |
| 0.4 | 2.5 | GO:0008195 | phosphatidate phosphatase activity(GO:0008195) |
| 0.4 | 2.8 | GO:0008190 | eukaryotic initiation factor 4E binding(GO:0008190) |
| 0.4 | 3.9 | GO:0048185 | activin binding(GO:0048185) |
| 0.3 | 1.0 | GO:0004706 | JUN kinase kinase kinase activity(GO:0004706) |
| 0.3 | 5.2 | GO:0031996 | thioesterase binding(GO:0031996) |
| 0.3 | 9.6 | GO:0008378 | galactosyltransferase activity(GO:0008378) |
| 0.3 | 2.4 | GO:0034185 | apolipoprotein binding(GO:0034185) |
| 0.3 | 15.8 | GO:0051287 | NAD binding(GO:0051287) |
| 0.3 | 4.0 | GO:0016832 | aldehyde-lyase activity(GO:0016832) |
| 0.3 | 15.1 | GO:0019894 | kinesin binding(GO:0019894) |
| 0.3 | 1.2 | GO:0035242 | protein-arginine omega-N asymmetric methyltransferase activity(GO:0035242) |
| 0.3 | 14.5 | GO:0004521 | endoribonuclease activity(GO:0004521) |
| 0.3 | 5.8 | GO:0051010 | microtubule plus-end binding(GO:0051010) |
| 0.3 | 3.3 | GO:0030215 | semaphorin receptor binding(GO:0030215) |
| 0.3 | 0.9 | GO:0046978 | TAP binding(GO:0046977) TAP1 binding(GO:0046978) TAP2 binding(GO:0046979) |
| 0.3 | 3.7 | GO:0042043 | neurexin family protein binding(GO:0042043) |
| 0.3 | 1.4 | GO:0015204 | urea transmembrane transporter activity(GO:0015204) |
| 0.3 | 9.2 | GO:0004683 | calmodulin-dependent protein kinase activity(GO:0004683) |
| 0.3 | 0.5 | GO:0016882 | cyclo-ligase activity(GO:0016882) |
| 0.3 | 7.3 | GO:0050699 | WW domain binding(GO:0050699) |
| 0.3 | 43.8 | GO:0001227 | transcriptional repressor activity, RNA polymerase II transcription regulatory region sequence-specific binding(GO:0001227) |
| 0.3 | 3.3 | GO:0016646 | oxidoreductase activity, acting on the CH-NH group of donors, NAD or NADP as acceptor(GO:0016646) |
| 0.2 | 3.4 | GO:0017154 | semaphorin receptor activity(GO:0017154) |
| 0.2 | 1.2 | GO:0031685 | adenosine receptor binding(GO:0031685) |
| 0.2 | 18.9 | GO:0042626 | ATPase activity, coupled to transmembrane movement of substances(GO:0042626) |
| 0.2 | 9.3 | GO:0030295 | protein kinase activator activity(GO:0030295) |
| 0.2 | 12.6 | GO:0004869 | cysteine-type endopeptidase inhibitor activity(GO:0004869) |
| 0.2 | 15.4 | GO:0004553 | hydrolase activity, hydrolyzing O-glycosyl compounds(GO:0004553) |
| 0.2 | 4.0 | GO:0004435 | phosphatidylinositol phospholipase C activity(GO:0004435) |
| 0.2 | 1.7 | GO:0070087 | chromo shadow domain binding(GO:0070087) |
| 0.2 | 3.1 | GO:0001671 | ATPase activator activity(GO:0001671) |
| 0.2 | 46.9 | GO:0005096 | GTPase activator activity(GO:0005096) |
| 0.2 | 4.9 | GO:0017147 | Wnt-protein binding(GO:0017147) |
| 0.2 | 6.2 | GO:0046332 | SMAD binding(GO:0046332) |
| 0.2 | 5.0 | GO:0035258 | steroid hormone receptor binding(GO:0035258) |
| 0.2 | 9.4 | GO:0019888 | protein phosphatase regulator activity(GO:0019888) |
| 0.2 | 10.8 | GO:0005089 | Rho guanyl-nucleotide exchange factor activity(GO:0005089) |
| 0.2 | 2.9 | GO:0042056 | chemoattractant activity(GO:0042056) |
| 0.2 | 1.9 | GO:0043023 | ribosomal large subunit binding(GO:0043023) |
| 0.2 | 97.0 | GO:0003700 | nucleic acid binding transcription factor activity(GO:0001071) transcription factor activity, sequence-specific DNA binding(GO:0003700) |
| 0.2 | 2.0 | GO:0016868 | intramolecular transferase activity, phosphotransferases(GO:0016868) |
| 0.2 | 1.3 | GO:0016681 | ubiquinol-cytochrome-c reductase activity(GO:0008121) oxidoreductase activity, acting on diphenols and related substances as donors, cytochrome as acceptor(GO:0016681) |
| 0.2 | 2.5 | GO:0051428 | peptide hormone receptor binding(GO:0051428) |
| 0.1 | 6.0 | GO:0005484 | SNAP receptor activity(GO:0005484) |
| 0.1 | 0.6 | GO:0047623 | AMP deaminase activity(GO:0003876) adenosine-phosphate deaminase activity(GO:0047623) |
| 0.1 | 21.6 | GO:0005125 | cytokine activity(GO:0005125) |
| 0.1 | 2.3 | GO:0004364 | glutathione transferase activity(GO:0004364) |
| 0.1 | 1.3 | GO:0043325 | phosphatidylinositol-3,4-bisphosphate binding(GO:0043325) |
| 0.1 | 2.0 | GO:0098641 | cadherin binding involved in cell-cell adhesion(GO:0098641) |
| 0.1 | 0.8 | GO:0030274 | LIM domain binding(GO:0030274) |
| 0.1 | 1.6 | GO:0008097 | 5S rRNA binding(GO:0008097) |
| 0.1 | 1.2 | GO:0016861 | intramolecular oxidoreductase activity, interconverting aldoses and ketoses(GO:0016861) |
| 0.1 | 1.3 | GO:0005545 | 1-phosphatidylinositol binding(GO:0005545) |
| 0.1 | 1.6 | GO:0004697 | protein kinase C activity(GO:0004697) |
| 0.1 | 2.9 | GO:0035254 | glutamate receptor binding(GO:0035254) |
| 0.1 | 1.3 | GO:0030898 | actin-dependent ATPase activity(GO:0030898) |
| 0.1 | 10.2 | GO:0030165 | PDZ domain binding(GO:0030165) |
| 0.1 | 1.8 | GO:0017080 | sodium channel regulator activity(GO:0017080) |
| 0.1 | 1.4 | GO:0004016 | adenylate cyclase activity(GO:0004016) guanylate cyclase activity(GO:0004383) |
| 0.1 | 2.8 | GO:0043548 | phosphatidylinositol 3-kinase binding(GO:0043548) |
| 0.1 | 1.2 | GO:0000978 | RNA polymerase II core promoter proximal region sequence-specific DNA binding(GO:0000978) |
| 0.1 | 1.9 | GO:1901505 | carbohydrate derivative transporter activity(GO:1901505) |
| 0.1 | 2.3 | GO:0033613 | activating transcription factor binding(GO:0033613) |
| 0.1 | 0.5 | GO:0001729 | ceramide kinase activity(GO:0001729) |
| 0.1 | 0.9 | GO:0023026 | MHC class II protein complex binding(GO:0023026) |
| 0.1 | 0.6 | GO:0017150 | tRNA dihydrouridine synthase activity(GO:0017150) |
| 0.1 | 3.3 | GO:0005246 | calcium channel regulator activity(GO:0005246) |
| 0.1 | 3.7 | GO:0008080 | N-acetyltransferase activity(GO:0008080) |
| 0.1 | 1.9 | GO:0005326 | neurotransmitter transporter activity(GO:0005326) |
| 0.1 | 0.8 | GO:0031748 | D1 dopamine receptor binding(GO:0031748) |
| 0.1 | 6.4 | GO:0051219 | phosphoprotein binding(GO:0051219) |
| 0.1 | 15.5 | GO:0000287 | magnesium ion binding(GO:0000287) |
| 0.1 | 1.6 | GO:0005035 | tumor necrosis factor-activated receptor activity(GO:0005031) death receptor activity(GO:0005035) |
| 0.1 | 4.1 | GO:0051087 | chaperone binding(GO:0051087) |
| 0.1 | 0.6 | GO:0047429 | nucleoside-triphosphate diphosphatase activity(GO:0047429) |
| 0.1 | 3.7 | GO:0048306 | calcium-dependent protein binding(GO:0048306) |
| 0.1 | 0.3 | GO:0030622 | U4 snRNA binding(GO:0030621) U4atac snRNA binding(GO:0030622) |
| 0.1 | 1.0 | GO:0003841 | 1-acylglycerol-3-phosphate O-acyltransferase activity(GO:0003841) |
| 0.1 | 8.9 | GO:0051015 | actin filament binding(GO:0051015) |
| 0.1 | 11.5 | GO:0004866 | endopeptidase inhibitor activity(GO:0004866) |
| 0.1 | 2.6 | GO:0019707 | protein-cysteine S-palmitoyltransferase activity(GO:0019706) protein-cysteine S-acyltransferase activity(GO:0019707) |
| 0.1 | 20.3 | GO:0003735 | structural constituent of ribosome(GO:0003735) |
| 0.1 | 0.2 | GO:0071208 | histone pre-mRNA DCP binding(GO:0071208) |
| 0.1 | 1.3 | GO:0015299 | solute:proton antiporter activity(GO:0015299) |
| 0.1 | 21.6 | GO:0019904 | protein domain specific binding(GO:0019904) |
| 0.1 | 10.7 | GO:0046906 | tetrapyrrole binding(GO:0046906) |
| 0.1 | 10.0 | GO:0016874 | ligase activity(GO:0016874) |
| 0.1 | 2.9 | GO:0005044 | scavenger receptor activity(GO:0005044) |
| 0.1 | 0.9 | GO:0016854 | racemase and epimerase activity(GO:0016854) |
| 0.1 | 0.9 | GO:0004576 | oligosaccharyl transferase activity(GO:0004576) dolichyl-diphosphooligosaccharide-protein glycotransferase activity(GO:0004579) |
| 0.1 | 1.5 | GO:0001786 | phosphatidylserine binding(GO:0001786) |
| 0.1 | 5.7 | GO:0004713 | protein tyrosine kinase activity(GO:0004713) |
| 0.1 | 1.6 | GO:0015269 | calcium-activated potassium channel activity(GO:0015269) |
| 0.1 | 11.7 | GO:0003924 | GTPase activity(GO:0003924) |
| 0.1 | 3.4 | GO:0005085 | guanyl-nucleotide exchange factor activity(GO:0005085) |
| 0.1 | 0.4 | GO:0008061 | chitin binding(GO:0008061) |
| 0.0 | 0.8 | GO:0005112 | Notch binding(GO:0005112) |
| 0.0 | 1.7 | GO:0015078 | hydrogen ion transmembrane transporter activity(GO:0015078) |
| 0.0 | 3.0 | GO:0004896 | cytokine receptor activity(GO:0004896) |
| 0.0 | 2.2 | GO:0017137 | Rab GTPase binding(GO:0017137) |
| 0.0 | 0.4 | GO:0002162 | dystroglycan binding(GO:0002162) |
| 0.0 | 0.1 | GO:0000703 | oxidized pyrimidine nucleobase lesion DNA N-glycosylase activity(GO:0000703) |
| 0.0 | 1.0 | GO:0004298 | threonine-type endopeptidase activity(GO:0004298) threonine-type peptidase activity(GO:0070003) |
| 0.0 | 2.2 | GO:0003777 | microtubule motor activity(GO:0003777) |
| 0.0 | 2.5 | GO:0004702 | receptor signaling protein serine/threonine kinase activity(GO:0004702) |
| 0.0 | 0.6 | GO:0004693 | cyclin-dependent protein serine/threonine kinase activity(GO:0004693) cyclin-dependent protein kinase activity(GO:0097472) |
| 0.0 | 0.7 | GO:0035064 | methylated histone binding(GO:0035064) |
| 0.0 | 0.2 | GO:0005167 | neurotrophin TRK receptor binding(GO:0005167) |
| 0.0 | 0.1 | GO:0019870 | potassium channel inhibitor activity(GO:0019870) sodium channel inhibitor activity(GO:0019871) |
| 0.0 | 1.7 | GO:0016503 | pheromone receptor activity(GO:0016503) |
| 0.0 | 1.4 | GO:0008201 | heparin binding(GO:0008201) |
Gene overrepresentation in curated gene sets: canonical pathways category:
| Log-likelihood per target | Total log-likelihood | Term | Description |
|---|---|---|---|
| 3.0 | 23.7 | ST ERK1 ERK2 MAPK PATHWAY | ERK1/ERK2 MAPK Pathway |
| 1.9 | 34.7 | SA MMP CYTOKINE CONNECTION | Cytokines can induce activation of matrix metalloproteinases, which degrade extracellular matrix. |
| 1.8 | 29.1 | SA PROGRAMMED CELL DEATH | Programmed cell death, or apoptosis, eliminates damaged or unneeded cells. |
| 1.7 | 36.6 | PID BETA CATENIN DEG PATHWAY | Degradation of beta catenin |
| 1.2 | 73.9 | PID AP1 PATHWAY | AP-1 transcription factor network |
| 1.1 | 47.0 | PID FRA PATHWAY | Validated transcriptional targets of AP1 family members Fra1 and Fra2 |
| 1.1 | 24.9 | SIG IL4RECEPTOR IN B LYPHOCYTES | Genes related to IL4 rceptor signaling in B lymphocytes |
| 1.0 | 65.5 | PID RAC1 PATHWAY | RAC1 signaling pathway |
| 1.0 | 9.7 | PID P38 GAMMA DELTA PATHWAY | Signaling mediated by p38-gamma and p38-delta |
| 0.9 | 8.9 | PID PDGFRA PATHWAY | PDGFR-alpha signaling pathway |
| 0.9 | 20.0 | SA B CELL RECEPTOR COMPLEXES | Antigen binding to B cell receptors activates protein tyrosine kinases, such as the Src family, which ultimate activate MAP kinases. |
| 0.9 | 23.1 | PID HDAC CLASSIII PATHWAY | Signaling events mediated by HDAC Class III |
| 0.9 | 36.6 | PID ECADHERIN STABILIZATION PATHWAY | Stabilization and expansion of the E-cadherin adherens junction |
| 0.8 | 25.5 | PID ALK1 PATHWAY | ALK1 signaling events |
| 0.8 | 41.6 | PID LKB1 PATHWAY | LKB1 signaling events |
| 0.8 | 18.9 | PID MYC PATHWAY | C-MYC pathway |
| 0.8 | 30.8 | PID ATR PATHWAY | ATR signaling pathway |
| 0.7 | 16.8 | PID TOLL ENDOGENOUS PATHWAY | Endogenous TLR signaling |
| 0.7 | 33.7 | PID IL12 2PATHWAY | IL12-mediated signaling events |
| 0.7 | 11.8 | PID LPA4 PATHWAY | LPA4-mediated signaling events |
| 0.7 | 14.4 | PID TCR CALCIUM PATHWAY | Calcium signaling in the CD4+ TCR pathway |
| 0.7 | 5.2 | ST TYPE I INTERFERON PATHWAY | Type I Interferon (alpha/beta IFN) Pathway |
| 0.6 | 143.6 | NABA ECM REGULATORS | Genes encoding enzymes and their regulators involved in the remodeling of the extracellular matrix |
| 0.6 | 15.7 | PID HDAC CLASSII PATHWAY | Signaling events mediated by HDAC Class II |
| 0.5 | 14.7 | PID GLYPICAN 1PATHWAY | Glypican 1 network |
| 0.5 | 17.6 | PID ILK PATHWAY | Integrin-linked kinase signaling |
| 0.5 | 6.8 | PID CIRCADIAN PATHWAY | Circadian rhythm pathway |
| 0.4 | 7.0 | PID HEDGEHOG 2PATHWAY | Signaling events mediated by the Hedgehog family |
| 0.4 | 16.0 | PID P53 REGULATION PATHWAY | p53 pathway |
| 0.4 | 1.6 | SA TRKA RECEPTOR | The TrkA receptor binds nerve growth factor to activate MAP kinase pathways and promote cell growth. |
| 0.4 | 11.3 | PID NFAT TFPATHWAY | Calcineurin-regulated NFAT-dependent transcription in lymphocytes |
| 0.4 | 9.0 | PID RETINOIC ACID PATHWAY | Retinoic acid receptors-mediated signaling |
| 0.4 | 19.4 | PID RHOA REG PATHWAY | Regulation of RhoA activity |
| 0.4 | 8.9 | ST DIFFERENTIATION PATHWAY IN PC12 CELLS | Differentiation Pathway in PC12 Cells; this is a specific case of PAC1 Receptor Pathway. |
| 0.3 | 34.3 | PID P53 DOWNSTREAM PATHWAY | Direct p53 effectors |
| 0.3 | 6.0 | PID ECADHERIN NASCENT AJ PATHWAY | E-cadherin signaling in the nascent adherens junction |
| 0.3 | 4.3 | PID IL1 PATHWAY | IL1-mediated signaling events |
| 0.3 | 9.3 | PID P73PATHWAY | p73 transcription factor network |
| 0.3 | 10.8 | PID HNF3B PATHWAY | FOXA2 and FOXA3 transcription factor networks |
| 0.3 | 11.1 | PID BMP PATHWAY | BMP receptor signaling |
| 0.3 | 12.3 | PID HIF1 TFPATHWAY | HIF-1-alpha transcription factor network |
| 0.2 | 2.4 | PID IL12 STAT4 PATHWAY | IL12 signaling mediated by STAT4 |
| 0.2 | 4.2 | PID SYNDECAN 4 PATHWAY | Syndecan-4-mediated signaling events |
| 0.2 | 16.7 | WNT SIGNALING | Genes related to Wnt-mediated signal transduction |
| 0.2 | 2.6 | PID PI3K PLC TRK PATHWAY | Trk receptor signaling mediated by PI3K and PLC-gamma |
| 0.2 | 6.1 | PID KIT PATHWAY | Signaling events mediated by Stem cell factor receptor (c-Kit) |
| 0.2 | 5.2 | PID TGFBR PATHWAY | TGF-beta receptor signaling |
| 0.2 | 1.9 | PID IL2 PI3K PATHWAY | IL2 signaling events mediated by PI3K |
| 0.2 | 1.9 | PID VEGF VEGFR PATHWAY | VEGF and VEGFR signaling network |
| 0.2 | 2.7 | PID NCADHERIN PATHWAY | N-cadherin signaling events |
| 0.2 | 3.7 | PID ATM PATHWAY | ATM pathway |
| 0.2 | 2.6 | PID FAS PATHWAY | FAS (CD95) signaling pathway |
| 0.2 | 9.3 | PID AR PATHWAY | Coregulation of Androgen receptor activity |
| 0.2 | 26.1 | NABA ECM AFFILIATED | Genes encoding proteins affiliated structurally or functionally to extracellular matrix proteins |
| 0.2 | 1.1 | PID SYNDECAN 3 PATHWAY | Syndecan-3-mediated signaling events |
| 0.2 | 1.5 | PID P38 MK2 PATHWAY | p38 signaling mediated by MAPKAP kinases |
| 0.2 | 2.4 | PID CDC42 REG PATHWAY | Regulation of CDC42 activity |
| 0.2 | 1.6 | PID AJDISS 2PATHWAY | Posttranslational regulation of adherens junction stability and dissassembly |
| 0.2 | 7.2 | PID CMYB PATHWAY | C-MYB transcription factor network |
| 0.1 | 3.8 | PID ENDOTHELIN PATHWAY | Endothelins |
| 0.1 | 4.7 | PID NOTCH PATHWAY | Notch signaling pathway |
| 0.1 | 1.3 | ST PHOSPHOINOSITIDE 3 KINASE PATHWAY | PI3K Pathway |
| 0.1 | 5.0 | PID AURORA B PATHWAY | Aurora B signaling |
| 0.1 | 2.8 | PID INSULIN PATHWAY | Insulin Pathway |
| 0.1 | 2.2 | PID ERBB4 PATHWAY | ErbB4 signaling events |
| 0.1 | 1.7 | PID DELTA NP63 PATHWAY | Validated transcriptional targets of deltaNp63 isoforms |
| 0.1 | 0.9 | ST G ALPHA I PATHWAY | G alpha i Pathway |
| 0.1 | 1.0 | ST JNK MAPK PATHWAY | JNK MAPK Pathway |
| 0.1 | 1.7 | ST T CELL SIGNAL TRANSDUCTION | T Cell Signal Transduction |
| 0.0 | 1.1 | PID IL4 2PATHWAY | IL4-mediated signaling events |
| 0.0 | 0.1 | PID PI3KCI AKT PATHWAY | Class I PI3K signaling events mediated by Akt |
| 0.0 | 0.8 | ST INTEGRIN SIGNALING PATHWAY | Integrin Signaling Pathway |
| 0.0 | 5.2 | NABA MATRISOME ASSOCIATED | Ensemble of genes encoding ECM-associated proteins including ECM-affilaited proteins, ECM regulators and secreted factors |
| 0.0 | 0.5 | PID HNF3A PATHWAY | FOXA1 transcription factor network |
| 0.0 | 0.2 | PID RHOA PATHWAY | RhoA signaling pathway |
Gene overrepresentation in curated gene sets: REACTOME pathways category:
| Log-likelihood per target | Total log-likelihood | Term | Description |
|---|---|---|---|
| 5.4 | 59.6 | REACTOME KERATAN SULFATE DEGRADATION | Genes involved in Keratan sulfate degradation |
| 5.4 | 209.5 | REACTOME GLYCOSPHINGOLIPID METABOLISM | Genes involved in Glycosphingolipid metabolism |
| 3.2 | 31.9 | REACTOME N GLYCAN TRIMMING IN THE ER AND CALNEXIN CALRETICULIN CYCLE | Genes involved in N-glycan trimming in the ER and Calnexin/Calreticulin cycle |
| 2.7 | 26.8 | REACTOME LATENT INFECTION OF HOMO SAPIENS WITH MYCOBACTERIUM TUBERCULOSIS | Genes involved in Latent infection of Homo sapiens with Mycobacterium tuberculosis |
| 2.4 | 24.1 | REACTOME PURINE CATABOLISM | Genes involved in Purine catabolism |
| 2.3 | 35.1 | REACTOME REGULATION OF PYRUVATE DEHYDROGENASE PDH COMPLEX | Genes involved in Regulation of pyruvate dehydrogenase (PDH) complex |
| 2.2 | 40.9 | REACTOME PROTEOLYTIC CLEAVAGE OF SNARE COMPLEX PROTEINS | Genes involved in Proteolytic cleavage of SNARE complex proteins |
| 2.1 | 27.4 | REACTOME TRAFFICKING AND PROCESSING OF ENDOSOMAL TLR | Genes involved in Trafficking and processing of endosomal TLR |
| 2.0 | 46.8 | REACTOME SIGNALING BY HIPPO | Genes involved in Signaling by Hippo |
| 1.9 | 11.4 | REACTOME MEMBRANE BINDING AND TARGETTING OF GAG PROTEINS | Genes involved in Membrane binding and targetting of GAG proteins |
| 1.7 | 103.7 | REACTOME TRANS GOLGI NETWORK VESICLE BUDDING | Genes involved in trans-Golgi Network Vesicle Budding |
| 1.7 | 29.2 | REACTOME CITRIC ACID CYCLE TCA CYCLE | Genes involved in Citric acid cycle (TCA cycle) |
| 1.7 | 18.6 | REACTOME UNWINDING OF DNA | Genes involved in Unwinding of DNA |
| 1.7 | 21.6 | REACTOME VITAMIN B5 PANTOTHENATE METABOLISM | Genes involved in Vitamin B5 (pantothenate) metabolism |
| 1.6 | 14.5 | REACTOME RECEPTOR LIGAND BINDING INITIATES THE SECOND PROTEOLYTIC CLEAVAGE OF NOTCH RECEPTOR | Genes involved in Receptor-ligand binding initiates the second proteolytic cleavage of Notch receptor |
| 1.6 | 23.5 | REACTOME TERMINATION OF O GLYCAN BIOSYNTHESIS | Genes involved in Termination of O-glycan biosynthesis |
| 1.6 | 21.8 | REACTOME TRAF3 DEPENDENT IRF ACTIVATION PATHWAY | Genes involved in TRAF3-dependent IRF activation pathway |
| 1.5 | 27.3 | REACTOME HDL MEDIATED LIPID TRANSPORT | Genes involved in HDL-mediated lipid transport |
| 1.5 | 22.5 | REACTOME SIGNAL ATTENUATION | Genes involved in Signal attenuation |
| 1.5 | 20.9 | REACTOME REGULATION OF COMPLEMENT CASCADE | Genes involved in Regulation of Complement cascade |
| 1.3 | 22.5 | REACTOME METABOLISM OF PORPHYRINS | Genes involved in Metabolism of porphyrins |
| 1.3 | 37.3 | REACTOME SMAD2 SMAD3 SMAD4 HETEROTRIMER REGULATES TRANSCRIPTION | Genes involved in SMAD2/SMAD3:SMAD4 heterotrimer regulates transcription |
| 1.2 | 17.6 | REACTOME HORMONE SENSITIVE LIPASE HSL MEDIATED TRIACYLGLYCEROL HYDROLYSIS | Genes involved in Hormone-sensitive lipase (HSL)-mediated triacylglycerol hydrolysis |
| 1.2 | 18.5 | REACTOME SYNTHESIS OF SUBSTRATES IN N GLYCAN BIOSYTHESIS | Genes involved in Synthesis of substrates in N-glycan biosythesis |
| 1.1 | 14.7 | REACTOME BASE FREE SUGAR PHOSPHATE REMOVAL VIA THE SINGLE NUCLEOTIDE REPLACEMENT PATHWAY | Genes involved in Base-free sugar-phosphate removal via the single-nucleotide replacement pathway |
| 1.1 | 8.9 | REACTOME PECAM1 INTERACTIONS | Genes involved in PECAM1 interactions |
| 1.1 | 12.1 | REACTOME CS DS DEGRADATION | Genes involved in CS/DS degradation |
| 1.1 | 30.2 | REACTOME TRANSFERRIN ENDOCYTOSIS AND RECYCLING | Genes involved in Transferrin endocytosis and recycling |
| 1.1 | 18.3 | REACTOME FORMATION OF THE TERNARY COMPLEX AND SUBSEQUENTLY THE 43S COMPLEX | Genes involved in Formation of the ternary complex, and subsequently, the 43S complex |
| 1.1 | 12.8 | REACTOME PYRUVATE METABOLISM AND CITRIC ACID TCA CYCLE | Genes involved in Pyruvate metabolism and Citric Acid (TCA) cycle |
| 1.1 | 20.2 | REACTOME REGULATION OF SIGNALING BY CBL | Genes involved in Regulation of signaling by CBL |
| 1.0 | 9.9 | REACTOME SIGNAL REGULATORY PROTEIN SIRP FAMILY INTERACTIONS | Genes involved in Signal regulatory protein (SIRP) family interactions |
| 1.0 | 4.9 | REACTOME MTORC1 MEDIATED SIGNALLING | Genes involved in mTORC1-mediated signalling |
| 1.0 | 9.5 | REACTOME ALPHA LINOLENIC ACID ALA METABOLISM | Genes involved in alpha-linolenic acid (ALA) metabolism |
| 0.9 | 19.0 | REACTOME PKA MEDIATED PHOSPHORYLATION OF CREB | Genes involved in PKA-mediated phosphorylation of CREB |
| 0.9 | 6.4 | REACTOME TRANSLOCATION OF ZAP 70 TO IMMUNOLOGICAL SYNAPSE | Genes involved in Translocation of ZAP-70 to Immunological synapse |
| 0.9 | 34.2 | REACTOME BMAL1 CLOCK NPAS2 ACTIVATES CIRCADIAN EXPRESSION | Genes involved in BMAL1:CLOCK/NPAS2 Activates Circadian Expression |
| 0.9 | 12.4 | REACTOME MITOCHONDRIAL FATTY ACID BETA OXIDATION | Genes involved in Mitochondrial Fatty Acid Beta-Oxidation |
| 0.8 | 31.3 | REACTOME AMINO ACID TRANSPORT ACROSS THE PLASMA MEMBRANE | Genes involved in Amino acid transport across the plasma membrane |
| 0.8 | 9.4 | REACTOME PASSIVE TRANSPORT BY AQUAPORINS | Genes involved in Passive Transport by Aquaporins |
| 0.8 | 11.0 | REACTOME BIOSYNTHESIS OF THE N GLYCAN PRECURSOR DOLICHOL LIPID LINKED OLIGOSACCHARIDE LLO AND TRANSFER TO A NASCENT PROTEIN | Genes involved in Biosynthesis of the N-glycan precursor (dolichol lipid-linked oligosaccharide, LLO) and transfer to a nascent protein |
| 0.8 | 13.3 | REACTOME BRANCHED CHAIN AMINO ACID CATABOLISM | Genes involved in Branched-chain amino acid catabolism |
| 0.8 | 29.0 | REACTOME INTRINSIC PATHWAY FOR APOPTOSIS | Genes involved in Intrinsic Pathway for Apoptosis |
| 0.8 | 22.1 | REACTOME SULFUR AMINO ACID METABOLISM | Genes involved in Sulfur amino acid metabolism |
| 0.8 | 4.6 | REACTOME P53 INDEPENDENT G1 S DNA DAMAGE CHECKPOINT | Genes involved in p53-Independent G1/S DNA damage checkpoint |
| 0.7 | 87.2 | REACTOME MRNA SPLICING | Genes involved in mRNA Splicing |
| 0.6 | 6.4 | REACTOME NEF MEDIATES DOWN MODULATION OF CELL SURFACE RECEPTORS BY RECRUITING THEM TO CLATHRIN ADAPTERS | Genes involved in Nef-mediates down modulation of cell surface receptors by recruiting them to clathrin adapters |
| 0.6 | 7.6 | REACTOME PURINE RIBONUCLEOSIDE MONOPHOSPHATE BIOSYNTHESIS | Genes involved in Purine ribonucleoside monophosphate biosynthesis |
| 0.6 | 61.3 | REACTOME PEPTIDE CHAIN ELONGATION | Genes involved in Peptide chain elongation |
| 0.6 | 7.9 | REACTOME INITIAL TRIGGERING OF COMPLEMENT | Genes involved in Initial triggering of complement |
| 0.5 | 5.3 | REACTOME COPI MEDIATED TRANSPORT | Genes involved in COPI Mediated Transport |
| 0.5 | 5.3 | REACTOME HYALURONAN UPTAKE AND DEGRADATION | Genes involved in Hyaluronan uptake and degradation |
| 0.5 | 25.8 | REACTOME METABOLISM OF VITAMINS AND COFACTORS | Genes involved in Metabolism of vitamins and cofactors |
| 0.5 | 5.8 | REACTOME METABOLISM OF POLYAMINES | Genes involved in Metabolism of polyamines |
| 0.5 | 4.1 | REACTOME ADP SIGNALLING THROUGH P2RY1 | Genes involved in ADP signalling through P2Y purinoceptor 1 |
| 0.5 | 11.5 | REACTOME G BETA GAMMA SIGNALLING THROUGH PLC BETA | Genes involved in G beta:gamma signalling through PLC beta |
| 0.5 | 4.3 | REACTOME ACTIVATION OF CHAPERONE GENES BY ATF6 ALPHA | Genes involved in Activation of Chaperone Genes by ATF6-alpha |
| 0.4 | 3.5 | REACTOME REGULATION OF RHEB GTPASE ACTIVITY BY AMPK | Genes involved in Regulation of Rheb GTPase activity by AMPK |
| 0.4 | 8.7 | REACTOME GLYCOGEN BREAKDOWN GLYCOGENOLYSIS | Genes involved in Glycogen breakdown (glycogenolysis) |
| 0.4 | 4.8 | REACTOME ORGANIC CATION ANION ZWITTERION TRANSPORT | Genes involved in Organic cation/anion/zwitterion transport |
| 0.4 | 12.8 | REACTOME KINESINS | Genes involved in Kinesins |
| 0.4 | 62.5 | REACTOME SIGNALING BY RHO GTPASES | Genes involved in Signaling by Rho GTPases |
| 0.4 | 3.3 | REACTOME NOTCH HLH TRANSCRIPTION PATHWAY | Genes involved in Notch-HLH transcription pathway |
| 0.4 | 5.1 | REACTOME ACTIVATION OF KAINATE RECEPTORS UPON GLUTAMATE BINDING | Genes involved in Activation of Kainate Receptors upon glutamate binding |
| 0.4 | 17.5 | REACTOME MITOCHONDRIAL PROTEIN IMPORT | Genes involved in Mitochondrial Protein Import |
| 0.4 | 3.7 | REACTOME PYRIMIDINE CATABOLISM | Genes involved in Pyrimidine catabolism |
| 0.4 | 4.3 | REACTOME AKT PHOSPHORYLATES TARGETS IN THE CYTOSOL | Genes involved in AKT phosphorylates targets in the cytosol |
| 0.4 | 5.3 | REACTOME PRE NOTCH PROCESSING IN GOLGI | Genes involved in Pre-NOTCH Processing in Golgi |
| 0.4 | 26.1 | REACTOME TRANSPORT OF INORGANIC CATIONS ANIONS AND AMINO ACIDS OLIGOPEPTIDES | Genes involved in Transport of inorganic cations/anions and amino acids/oligopeptides |
| 0.4 | 6.0 | REACTOME G1 S SPECIFIC TRANSCRIPTION | Genes involved in G1/S-Specific Transcription |
| 0.3 | 4.0 | REACTOME FACILITATIVE NA INDEPENDENT GLUCOSE TRANSPORTERS | Genes involved in Facilitative Na+-independent glucose transporters |
| 0.3 | 5.9 | REACTOME RECYCLING PATHWAY OF L1 | Genes involved in Recycling pathway of L1 |
| 0.3 | 13.6 | REACTOME TRIGLYCERIDE BIOSYNTHESIS | Genes involved in Triglyceride Biosynthesis |
| 0.3 | 2.9 | REACTOME P75NTR RECRUITS SIGNALLING COMPLEXES | Genes involved in p75NTR recruits signalling complexes |
| 0.3 | 6.1 | REACTOME SEMA4D IN SEMAPHORIN SIGNALING | Genes involved in Sema4D in semaphorin signaling |
| 0.3 | 3.4 | REACTOME SEMA3A PLEXIN REPULSION SIGNALING BY INHIBITING INTEGRIN ADHESION | Genes involved in SEMA3A-Plexin repulsion signaling by inhibiting Integrin adhesion |
| 0.3 | 1.1 | REACTOME HOST INTERACTIONS OF HIV FACTORS | Genes involved in Host Interactions of HIV factors |
| 0.3 | 9.6 | REACTOME O LINKED GLYCOSYLATION OF MUCINS | Genes involved in O-linked glycosylation of mucins |
| 0.3 | 2.9 | REACTOME IL 7 SIGNALING | Genes involved in Interleukin-7 signaling |
| 0.3 | 2.9 | REACTOME ADVANCED GLYCOSYLATION ENDPRODUCT RECEPTOR SIGNALING | Genes involved in Advanced glycosylation endproduct receptor signaling |
| 0.2 | 4.2 | REACTOME IL RECEPTOR SHC SIGNALING | Genes involved in Interleukin receptor SHC signaling |
| 0.2 | 2.5 | REACTOME YAP1 AND WWTR1 TAZ STIMULATED GENE EXPRESSION | Genes involved in YAP1- and WWTR1 (TAZ)-stimulated gene expression |
| 0.2 | 8.0 | REACTOME INTERACTIONS OF VPR WITH HOST CELLULAR PROTEINS | Genes involved in Interactions of Vpr with host cellular proteins |
| 0.2 | 9.7 | REACTOME IMMUNOREGULATORY INTERACTIONS BETWEEN A LYMPHOID AND A NON LYMPHOID CELL | Genes involved in Immunoregulatory interactions between a Lymphoid and a non-Lymphoid cell |
| 0.2 | 8.9 | REACTOME FATTY ACID TRIACYLGLYCEROL AND KETONE BODY METABOLISM | Genes involved in Fatty acid, triacylglycerol, and ketone body metabolism |
| 0.2 | 3.0 | REACTOME ARMS MEDIATED ACTIVATION | Genes involved in ARMS-mediated activation |
| 0.2 | 7.7 | REACTOME ABC FAMILY PROTEINS MEDIATED TRANSPORT | Genes involved in ABC-family proteins mediated transport |
| 0.2 | 6.8 | REACTOME TRANSPORT OF VITAMINS NUCLEOSIDES AND RELATED MOLECULES | Genes involved in Transport of vitamins, nucleosides, and related molecules |
| 0.2 | 2.1 | REACTOME RECRUITMENT OF NUMA TO MITOTIC CENTROSOMES | Genes involved in Recruitment of NuMA to mitotic centrosomes |
| 0.2 | 10.1 | REACTOME ASPARAGINE N LINKED GLYCOSYLATION | Genes involved in Asparagine N-linked glycosylation |
| 0.2 | 3.6 | REACTOME SYNTHESIS AND INTERCONVERSION OF NUCLEOTIDE DI AND TRIPHOSPHATES | Genes involved in Synthesis and interconversion of nucleotide di- and triphosphates |
| 0.2 | 11.9 | REACTOME CYCLIN E ASSOCIATED EVENTS DURING G1 S TRANSITION | Genes involved in Cyclin E associated events during G1/S transition |
| 0.2 | 1.9 | REACTOME VEGF LIGAND RECEPTOR INTERACTIONS | Genes involved in VEGF ligand-receptor interactions |
| 0.2 | 1.5 | REACTOME SIGNALLING TO RAS | Genes involved in Signalling to RAS |
| 0.2 | 9.1 | REACTOME INTERFERON ALPHA BETA SIGNALING | Genes involved in Interferon alpha/beta signaling |
| 0.2 | 28.6 | REACTOME METABOLISM OF CARBOHYDRATES | Genes involved in Metabolism of carbohydrates |
| 0.2 | 11.1 | REACTOME FACTORS INVOLVED IN MEGAKARYOCYTE DEVELOPMENT AND PLATELET PRODUCTION | Genes involved in Factors involved in megakaryocyte development and platelet production |
| 0.2 | 1.2 | REACTOME IRAK2 MEDIATED ACTIVATION OF TAK1 COMPLEX UPON TLR7 8 OR 9 STIMULATION | Genes involved in IRAK2 mediated activation of TAK1 complex upon TLR7/8 or 9 stimulation |
| 0.2 | 7.5 | REACTOME ION TRANSPORT BY P TYPE ATPASES | Genes involved in Ion transport by P-type ATPases |
| 0.2 | 9.3 | REACTOME INTEGRATION OF ENERGY METABOLISM | Genes involved in Integration of energy metabolism |
| 0.2 | 16.4 | REACTOME METABOLISM OF AMINO ACIDS AND DERIVATIVES | Genes involved in Metabolism of amino acids and derivatives |
| 0.1 | 3.3 | REACTOME GLUTATHIONE CONJUGATION | Genes involved in Glutathione conjugation |
| 0.1 | 1.7 | REACTOME G1 PHASE | Genes involved in G1 Phase |
| 0.1 | 7.9 | REACTOME TRANSCRIPTIONAL REGULATION OF WHITE ADIPOCYTE DIFFERENTIATION | Genes involved in Transcriptional Regulation of White Adipocyte Differentiation |
| 0.1 | 2.9 | REACTOME CASPASE MEDIATED CLEAVAGE OF CYTOSKELETAL PROTEINS | Genes involved in Caspase-mediated cleavage of cytoskeletal proteins |
| 0.1 | 1.7 | REACTOME GLUCURONIDATION | Genes involved in Glucuronidation |
| 0.1 | 5.3 | REACTOME CHEMOKINE RECEPTORS BIND CHEMOKINES | Genes involved in Chemokine receptors bind chemokines |
| 0.1 | 3.0 | REACTOME IL1 SIGNALING | Genes involved in Interleukin-1 signaling |
| 0.1 | 7.0 | REACTOME CLASS B 2 SECRETIN FAMILY RECEPTORS | Genes involved in Class B/2 (Secretin family receptors) |
| 0.1 | 2.5 | REACTOME G2 M CHECKPOINTS | Genes involved in G2/M Checkpoints |
| 0.1 | 1.0 | REACTOME FORMATION OF TUBULIN FOLDING INTERMEDIATES BY CCT TRIC | Genes involved in Formation of tubulin folding intermediates by CCT/TriC |
| 0.1 | 3.3 | REACTOME CELL SURFACE INTERACTIONS AT THE VASCULAR WALL | Genes involved in Cell surface interactions at the vascular wall |
| 0.1 | 2.1 | REACTOME MHC CLASS II ANTIGEN PRESENTATION | Genes involved in MHC class II antigen presentation |
| 0.1 | 1.0 | REACTOME MRNA DECAY BY 5 TO 3 EXORIBONUCLEASE | Genes involved in mRNA Decay by 5' to 3' Exoribonuclease |
| 0.1 | 6.2 | REACTOME MITOTIC PROMETAPHASE | Genes involved in Mitotic Prometaphase |
| 0.1 | 1.1 | REACTOME SIGNALING BY NODAL | Genes involved in Signaling by NODAL |
| 0.1 | 1.2 | REACTOME DESTABILIZATION OF MRNA BY KSRP | Genes involved in Destabilization of mRNA by KSRP |
| 0.1 | 0.9 | REACTOME PLC BETA MEDIATED EVENTS | Genes involved in PLC beta mediated events |
| 0.1 | 1.6 | REACTOME CGMP EFFECTS | Genes involved in cGMP effects |
| 0.1 | 2.7 | REACTOME MEIOTIC RECOMBINATION | Genes involved in Meiotic Recombination |
| 0.1 | 0.3 | REACTOME DSCAM INTERACTIONS | Genes involved in DSCAM interactions |
| 0.0 | 1.4 | REACTOME AMINE COMPOUND SLC TRANSPORTERS | Genes involved in Amine compound SLC transporters |
| 0.0 | 1.4 | REACTOME TRANSPORT OF GLUCOSE AND OTHER SUGARS BILE SALTS AND ORGANIC ACIDS METAL IONS AND AMINE COMPOUNDS | Genes involved in Transport of glucose and other sugars, bile salts and organic acids, metal ions and amine compounds |
| 0.0 | 1.7 | REACTOME CELL JUNCTION ORGANIZATION | Genes involved in Cell junction organization |
| 0.0 | 0.3 | REACTOME INHIBITION OF VOLTAGE GATED CA2 CHANNELS VIA GBETA GAMMA SUBUNITS | Genes involved in Inhibition of voltage gated Ca2+ channels via Gbeta/gamma subunits |