Project
GSE53960: rat RNA-Seq transcriptomic Bodymap
Navigation
Downloads
Results for Tfap2c
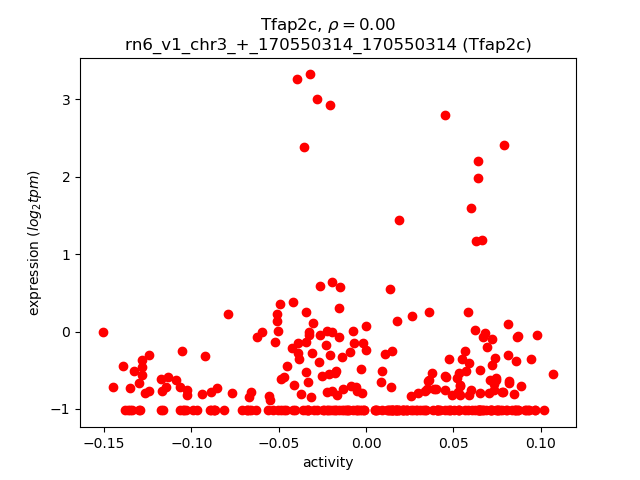
Z-value: 1.13
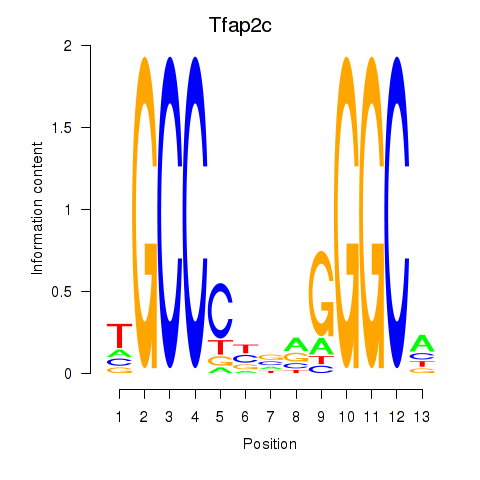
Motif logo
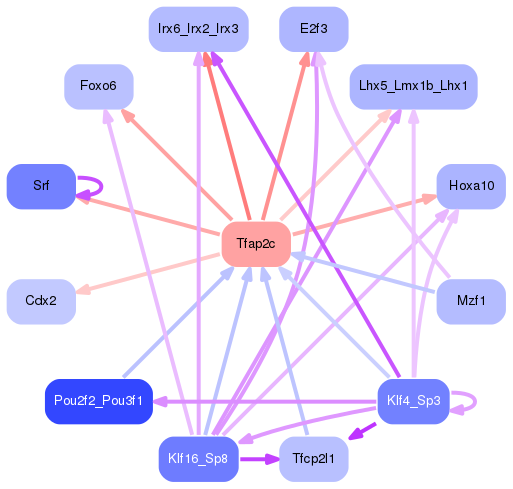
Transcription factors associated with Tfap2c
| Gene Symbol | Gene ID | Gene Info |
|---|---|---|
|
Tfap2c
|
ENSRNOG00000005246 | transcription factor AP-2 gamma |
Activity-expression correlation:
| Gene | Promoter | Pearson corr. coef. | P-value | Plot |
|---|---|---|---|---|
| Tfap2c | rn6_v1_chr3_+_170550314_170550314 | 0.00 | 9.6e-01 | Click! |
Activity profile of Tfap2c motif
Sorted Z-values of Tfap2c motif
| Promoter | Log-likelihood | Transcript | Gene | Gene Info |
|---|---|---|---|---|
| chr1_+_226435979 | 51.62 |
ENSRNOT00000048704
ENSRNOT00000036232 ENSRNOT00000035576 ENSRNOT00000036180 ENSRNOT00000036168 ENSRNOT00000047964 ENSRNOT00000036283 ENSRNOT00000007429 |
Syt7
|
synaptotagmin 7 |
| chrX_+_39711201 | 29.82 |
ENSRNOT00000080512
ENSRNOT00000009802 |
Cnksr2
|
connector enhancer of kinase suppressor of Ras 2 |
| chr2_+_260884337 | 27.09 |
ENSRNOT00000032808
|
Cryz
|
crystallin zeta |
| chr18_+_17091310 | 26.75 |
ENSRNOT00000093285
|
Fhod3
|
formin homology 2 domain containing 3 |
| chr4_-_117268178 | 25.58 |
ENSRNOT00000043201
ENSRNOT00000084049 |
Fbxo41
|
F-box protein 41 |
| chr5_+_151692108 | 25.21 |
ENSRNOT00000086144
|
Fam46b
|
family with sequence similarity 46, member B |
| chr3_-_11382004 | 25.20 |
ENSRNOT00000047921
ENSRNOT00000064039 |
Dnm1
|
dynamin 1 |
| chr9_-_82461903 | 25.08 |
ENSRNOT00000026654
|
Ptprn
|
protein tyrosine phosphatase, receptor type, N |
| chr10_-_82197848 | 23.31 |
ENSRNOT00000081307
|
Cacna1g
|
calcium voltage-gated channel subunit alpha1 G |
| chr5_+_147323240 | 23.23 |
ENSRNOT00000047152
|
Fndc5
|
fibronectin type III domain containing 5 |
| chr16_-_71319449 | 22.55 |
ENSRNOT00000029284
|
Fgfr1
|
Fibroblast growth factor receptor 1 |
| chr7_-_130405347 | 21.62 |
ENSRNOT00000013985
|
Cpt1b
|
carnitine palmitoyltransferase 1B |
| chr4_+_132137793 | 20.69 |
ENSRNOT00000014455
|
Gpr27
|
G protein-coupled receptor 27 |
| chr5_-_124642569 | 19.96 |
ENSRNOT00000010680
|
Prkaa2
|
protein kinase AMP-activated catalytic subunit alpha 2 |
| chr18_+_83471342 | 19.94 |
ENSRNOT00000019384
|
Neto1
|
neuropilin and tolloid like 1 |
| chr16_-_71319052 | 19.83 |
ENSRNOT00000050980
|
Fgfr1
|
Fibroblast growth factor receptor 1 |
| chr10_-_82197520 | 19.57 |
ENSRNOT00000092024
|
Cacna1g
|
calcium voltage-gated channel subunit alpha1 G |
| chr14_-_78707861 | 19.45 |
ENSRNOT00000091927
|
Ppp2r2c
|
protein phosphatase 2, regulatory subunit B, gamma |
| chr6_-_105097054 | 19.21 |
ENSRNOT00000048606
|
Slc8a3
|
solute carrier family 8 member A3 |
| chr10_-_51669297 | 19.01 |
ENSRNOT00000071595
|
Arhgap44
|
Rho GTPase activating protein 44 |
| chr13_-_102790639 | 18.52 |
ENSRNOT00000003177
|
RGD1310587
|
similar to hypothetical protein FLJ14146 |
| chr19_-_15840990 | 18.45 |
ENSRNOT00000015583
|
Irx3
|
iroquois homeobox 3 |
| chr1_-_53038229 | 18.12 |
ENSRNOT00000017282
|
Mpc1
|
mitochondrial pyruvate carrier 1 |
| chr15_-_48670257 | 17.87 |
ENSRNOT00000071464
|
Fzd3
|
frizzled class receptor 3 |
| chr7_-_29070928 | 17.86 |
ENSRNOT00000080939
|
Chpt1
|
choline phosphotransferase 1 |
| chr7_+_117409576 | 16.89 |
ENSRNOT00000017067
|
Cyc1
|
cytochrome c-1 |
| chr11_+_82734613 | 16.88 |
ENSRNOT00000074826
|
Tmem41a
|
transmembrane protein 41a |
| chr9_+_90857308 | 16.82 |
ENSRNOT00000073993
|
LOC100911572
|
collagen alpha-3(IV) chain-like |
| chr3_+_111597102 | 16.22 |
ENSRNOT00000081462
|
Tyro3
|
TYRO3 protein tyrosine kinase |
| chr8_+_63600663 | 16.19 |
ENSRNOT00000012644
|
Hcn4
|
hyperpolarization activated cyclic nucleotide-gated potassium channel 4 |
| chr1_-_248376750 | 16.18 |
ENSRNOT00000089073
|
Gldc
|
glycine decarboxylase |
| chr11_-_68842320 | 15.89 |
ENSRNOT00000049180
|
Adcy5
|
adenylate cyclase 5 |
| chr6_+_9483594 | 15.32 |
ENSRNOT00000089272
|
AABR07062799.2
|
|
| chrX_-_134866210 | 15.22 |
ENSRNOT00000005331
|
Apln
|
apelin |
| chr10_+_57322331 | 14.79 |
ENSRNOT00000041493
|
Kif1c
|
kinesin family member 1C |
| chr18_-_57245666 | 14.70 |
ENSRNOT00000080365
|
Ablim3
|
actin binding LIM protein family, member 3 |
| chr5_-_65073012 | 14.66 |
ENSRNOT00000007957
|
Grin3a
|
glutamate ionotropic receptor NMDA type subunit 3A |
| chr10_-_89916400 | 14.60 |
ENSRNOT00000055194
|
Dusp3
|
dual specificity phosphatase 3 |
| chr6_+_137063611 | 14.23 |
ENSRNOT00000017504
|
LOC691485
|
hypothetical protein LOC691485 |
| chrX_-_104493714 | 14.14 |
ENSRNOT00000064458
ENSRNOT00000080386 |
Pcdh19
|
protocadherin 19 |
| chr5_+_79055521 | 14.00 |
ENSRNOT00000010333
|
Col27a1
|
collagen type XXVII alpha 1 chain |
| chr17_+_36334147 | 13.78 |
ENSRNOT00000050261
|
E2f3
|
E2F transcription factor 3 |
| chr8_+_117068582 | 13.57 |
ENSRNOT00000073559
|
Amt
|
aminomethyltransferase |
| chr3_-_1924827 | 13.20 |
ENSRNOT00000006162
|
Cacna1b
|
calcium voltage-gated channel subunit alpha1 B |
| chr14_+_80248140 | 13.06 |
ENSRNOT00000010852
|
Htra3
|
HtrA serine peptidase 3 |
| chr10_+_70262361 | 12.87 |
ENSRNOT00000064625
ENSRNOT00000076973 |
Unc45b
|
unc-45 myosin chaperone B |
| chr5_-_74029238 | 12.62 |
ENSRNOT00000031432
|
Frrs1l
|
ferric-chelate reductase 1-like |
| chr8_-_107681512 | 12.57 |
ENSRNOT00000077963
|
Mras
|
muscle RAS oncogene homolog |
| chr6_-_132183434 | 12.25 |
ENSRNOT00000079807
|
AABR07065498.1
|
|
| chr10_-_15311189 | 12.21 |
ENSRNOT00000027371
|
Prr35
|
proline rich 35 |
| chr1_-_71290337 | 12.13 |
ENSRNOT00000063956
|
Zfp667
|
zinc finger protein 667 |
| chr3_+_172385672 | 11.94 |
ENSRNOT00000090989
|
Gnas
|
GNAS complex locus |
| chrX_+_15114892 | 11.77 |
ENSRNOT00000078168
|
Wdr13
|
WD repeat domain 13 |
| chr1_+_220362064 | 11.58 |
ENSRNOT00000074361
|
LOC108348067
|
endosialin |
| chr1_-_214181686 | 11.28 |
ENSRNOT00000022363
ENSRNOT00000079464 |
Hras
|
Harvey rat sarcoma virus oncogene |
| chr1_+_220446425 | 11.01 |
ENSRNOT00000027339
|
LOC100911932
|
endosialin-like |
| chr10_+_65767930 | 10.93 |
ENSRNOT00000039954
|
Vtn
|
vitronectin |
| chr5_-_164747083 | 10.77 |
ENSRNOT00000010433
|
Plod1
|
procollagen-lysine, 2-oxoglutarate 5-dioxygenase 1 |
| chr9_+_101005082 | 10.69 |
ENSRNOT00000082949
|
Neu4
|
neuraminidase 4 |
| chr14_+_39661968 | 10.66 |
ENSRNOT00000064779
|
Gabra2
|
gamma-aminobutyric acid type A receptor alpha2 subunit |
| chr1_-_73753128 | 10.35 |
ENSRNOT00000068459
|
Ttyh1
|
tweety family member 1 |
| chr16_-_20686317 | 10.34 |
ENSRNOT00000060097
|
Crlf1
|
cytokine receptor-like factor 1 |
| chr1_-_64030175 | 10.28 |
ENSRNOT00000089950
|
Tsen34l1
|
tRNA splicing endonuclease subunit 34-like 1 |
| chr5_+_169519212 | 10.27 |
ENSRNOT00000024732
|
Chd5
|
chromodomain helicase DNA binding protein 5 |
| chr1_-_84491466 | 9.90 |
ENSRNOT00000034609
|
Map3k10
|
mitogen activated protein kinase kinase kinase 10 |
| chr5_-_139227196 | 9.87 |
ENSRNOT00000050941
|
Foxo6
|
forkhead box O6 |
| chr9_+_47386626 | 9.79 |
ENSRNOT00000021270
|
Slc9a2
|
solute carrier family 9 member A2 |
| chr19_+_2393059 | 9.70 |
ENSRNOT00000018535
|
Cdh11
|
cadherin 11 |
| chr1_+_220353356 | 9.56 |
ENSRNOT00000080189
|
Cd248
|
CD248 molecule |
| chr2_+_207923775 | 9.55 |
ENSRNOT00000019997
ENSRNOT00000051835 |
Kcnd3
|
potassium voltage-gated channel subfamily D member 3 |
| chr10_-_68517564 | 9.36 |
ENSRNOT00000086961
|
Asic2
|
acid sensing ion channel subunit 2 |
| chr1_+_30681681 | 9.16 |
ENSRNOT00000015395
|
Rspo3
|
R-spondin 3 |
| chr9_+_17340341 | 9.11 |
ENSRNOT00000026637
ENSRNOT00000026559 ENSRNOT00000042790 ENSRNOT00000044163 ENSRNOT00000083811 |
Vegfa
|
vascular endothelial growth factor A |
| chr5_+_18901039 | 9.00 |
ENSRNOT00000012066
|
Fam110b
|
family with sequence similarity 110, member B |
| chr9_-_82673898 | 8.98 |
ENSRNOT00000027165
|
Chpf
|
chondroitin polymerizing factor |
| chr7_+_116745061 | 8.68 |
ENSRNOT00000076174
|
Rhpn1
|
rhophilin, Rho GTPase binding protein 1 |
| chr20_+_5815837 | 8.58 |
ENSRNOT00000036999
|
Lhfpl5
|
lipoma HMGIC fusion partner-like 5 |
| chr15_+_61731735 | 8.43 |
ENSRNOT00000015517
|
Kbtbd6
|
kelch repeat and BTB domain containing 6 |
| chr19_-_53688597 | 8.38 |
ENSRNOT00000074448
|
Zcchc14
|
zinc finger CCHC-type containing 14 |
| chr14_+_83724933 | 8.31 |
ENSRNOT00000029848
|
Pla2g3
|
phospholipase A2, group III |
| chr10_+_56824505 | 8.28 |
ENSRNOT00000067128
|
Slc16a11
|
solute carrier family 16, member 11 |
| chr1_-_18058055 | 8.26 |
ENSRNOT00000020988
|
Ptprk
|
protein tyrosine phosphatase, receptor type, K |
| chr9_+_16737642 | 7.94 |
ENSRNOT00000061430
|
Srf
|
serum response factor |
| chr3_+_123434409 | 7.83 |
ENSRNOT00000028847
|
Atrn
|
attractin |
| chr8_-_68966108 | 7.75 |
ENSRNOT00000012155
|
Smad6
|
SMAD family member 6 |
| chr4_-_82203154 | 7.51 |
ENSRNOT00000086210
|
LOC100912608
|
homeobox protein Hox-A10-like |
| chr19_+_37476095 | 7.51 |
ENSRNOT00000092794
ENSRNOT00000023130 |
Hsd11b2
|
hydroxysteroid 11-beta dehydrogenase 2 |
| chr7_-_117259791 | 7.49 |
ENSRNOT00000086550
|
Plec
|
plectin |
| chr3_+_171832500 | 7.35 |
ENSRNOT00000007554
|
Vapb
|
VAMP associated protein B and C |
| chr4_-_82289672 | 7.09 |
ENSRNOT00000036394
|
Hoxa10
|
homeobox A10 |
| chr7_-_117288018 | 7.04 |
ENSRNOT00000091285
|
Plec
|
plectin |
| chr4_-_157829241 | 7.00 |
ENSRNOT00000026184
|
Ltbr
|
lymphotoxin beta receptor |
| chr14_-_84978255 | 6.93 |
ENSRNOT00000078179
|
Cabp7
|
calcium binding protein 7 |
| chr8_-_23063041 | 6.90 |
ENSRNOT00000018416
|
Elavl3
|
ELAV like RNA binding protein 3 |
| chr8_+_116324040 | 6.89 |
ENSRNOT00000081353
|
Hyal2
|
hyaluronoglucosaminidase 2 |
| chr1_-_99303048 | 6.83 |
ENSRNOT00000025631
|
LOC687880
|
similar to Kallikrein-1 precursor (Tissue kallikrein) (Kidney/pancreas/salivary gland kallikrein) |
| chr3_-_11410732 | 6.81 |
ENSRNOT00000034930
|
RGD1561113
|
similar to Hypothetical UPF0184 protein C9orf16 homolog |
| chr19_-_57699113 | 6.73 |
ENSRNOT00000026767
|
Egln1
|
egl-9 family hypoxia-inducible factor 1 |
| chr10_-_109224370 | 6.57 |
ENSRNOT00000005839
|
Aatk
|
apoptosis-associated tyrosine kinase |
| chr9_+_82120059 | 6.51 |
ENSRNOT00000057368
|
Cdk5r2
|
cyclin-dependent kinase 5 regulatory subunit 2 |
| chrX_-_32355296 | 6.47 |
ENSRNOT00000081652
ENSRNOT00000065075 |
Ap1s2
|
adaptor-related protein complex 1, sigma 2 subunit |
| chr3_+_160908769 | 6.46 |
ENSRNOT00000030054
|
Sys1
|
Sys1 golgi trafficking protein |
| chr6_-_99783047 | 6.41 |
ENSRNOT00000009028
|
Sptb
|
spectrin, beta, erythrocytic |
| chr1_+_170383682 | 6.30 |
ENSRNOT00000024224
|
Smpd1
|
sphingomyelin phosphodiesterase 1 |
| chr5_+_150080072 | 6.24 |
ENSRNOT00000047917
|
Tmem200b
|
transmembrane protein 200B |
| chr15_-_3410423 | 6.09 |
ENSRNOT00000080274
|
Adk
|
adenosine kinase |
| chr7_-_49250953 | 6.08 |
ENSRNOT00000066975
ENSRNOT00000082141 |
Acss3
|
acyl-CoA synthetase short-chain family member 3 |
| chr11_+_28692708 | 6.04 |
ENSRNOT00000002135
|
Krtap13-1
|
keratin associated protein 13-1 |
| chr1_+_100299626 | 6.00 |
ENSRNOT00000092327
ENSRNOT00000044257 |
Shank1
|
SH3 and multiple ankyrin repeat domains 1 |
| chr5_+_123905166 | 5.95 |
ENSRNOT00000082021
|
Dab1
|
DAB1, reelin adaptor protein |
| chr8_-_63350269 | 5.95 |
ENSRNOT00000042681
|
Cd276
|
Cd276 molecule |
| chr2_-_260884449 | 5.92 |
ENSRNOT00000032874
|
Tyw3
|
tRNA-yW synthesizing protein 3 homolog |
| chr5_+_143500441 | 5.91 |
ENSRNOT00000045513
|
Grik3
|
glutamate ionotropic receptor kainate type subunit 3 |
| chr5_+_162031722 | 5.89 |
ENSRNOT00000020483
|
Lrrc38
|
leucine rich repeat containing 38 |
| chr6_-_86822094 | 5.85 |
ENSRNOT00000006531
|
Fkbp3
|
FK506 binding protein 3 |
| chr9_+_16862248 | 5.78 |
ENSRNOT00000080104
ENSRNOT00000024824 |
Ttbk1
|
tau tubulin kinase 1 |
| chr8_-_43854765 | 5.47 |
ENSRNOT00000081506
|
Olr1335
|
olfactory receptor 1335 |
| chr5_-_64789318 | 5.31 |
ENSRNOT00000078957
|
Mrpl50
|
mitochondrial ribosomal protein L50 |
| chr3_-_105470475 | 5.29 |
ENSRNOT00000011078
|
Gjd2
|
gap junction protein, delta 2 |
| chr10_+_65780494 | 5.18 |
ENSRNOT00000013100
|
Poldip2
|
DNA polymerase delta interacting protein 2 |
| chr10_+_13836128 | 4.96 |
ENSRNOT00000012720
|
Pgp
|
phosphoglycolate phosphatase |
| chr1_+_142679345 | 4.92 |
ENSRNOT00000034267
|
Zscan2
|
zinc finger and SCAN domain containing 2 |
| chr5_-_160619650 | 4.68 |
ENSRNOT00000089981
|
Tmem51
|
transmembrane protein 51 |
| chr1_+_220400855 | 4.57 |
ENSRNOT00000027178
|
Slc29a2
|
solute carrier family 29 member 2 |
| chr1_-_218100272 | 4.53 |
ENSRNOT00000028411
ENSRNOT00000088588 |
Ccnd1
|
cyclin D1 |
| chr12_-_30304036 | 4.52 |
ENSRNOT00000001218
|
Nupr2
|
nuclear protein 2, transcriptional regulator |
| chr15_+_23665202 | 4.49 |
ENSRNOT00000089226
|
Samd4a
|
sterile alpha motif domain containing 4A |
| chr1_+_15620653 | 4.37 |
ENSRNOT00000017401
|
Map7
|
microtubule-associated protein 7 |
| chr18_-_56331991 | 4.12 |
ENSRNOT00000085841
ENSRNOT00000091220 |
Slc6a7
|
solute carrier family 6 member 7 |
| chr6_-_88232252 | 4.11 |
ENSRNOT00000047597
|
Rpl10l
|
ribosomal protein L10-like |
| chr1_+_220307394 | 4.00 |
ENSRNOT00000071891
|
LOC108348052
|
equilibrative nucleoside transporter 2 |
| chr8_+_81949877 | 3.92 |
ENSRNOT00000030221
|
LOC100360828
|
cAMP-regulated phosphoprotein 19-like |
| chr1_+_230305923 | 3.78 |
ENSRNOT00000074432
|
Olr365
|
olfactory receptor 365 |
| chr6_-_107461041 | 3.77 |
ENSRNOT00000058127
|
Heatr4
|
HEAT repeat containing 4 |
| chr5_-_135285311 | 3.74 |
ENSRNOT00000088261
ENSRNOT00000085235 |
Mast2
|
microtubule associated serine/threonine kinase 2 |
| chr1_-_266333105 | 3.67 |
ENSRNOT00000027093
|
Arl3
|
ADP ribosylation factor like GTPase 3 |
| chr3_+_93648343 | 3.62 |
ENSRNOT00000091164
|
AABR07053136.1
|
|
| chr6_-_110904288 | 3.58 |
ENSRNOT00000014645
|
Irf2bpl
|
interferon regulatory factor 2 binding protein-like |
| chr4_+_157230769 | 3.57 |
ENSRNOT00000091464
ENSRNOT00000017472 |
Phb2
|
prohibitin 2 |
| chr4_+_57050214 | 3.53 |
ENSRNOT00000025165
|
Ahcyl2
|
adenosylhomocysteinase-like 2 |
| chr3_+_177188044 | 3.40 |
ENSRNOT00000022073
|
Tcea2
|
transcription elongation factor A2 |
| chr10_-_46145548 | 3.36 |
ENSRNOT00000033483
|
Pld6
|
phospholipase D family, member 6 |
| chr1_+_165170645 | 3.34 |
ENSRNOT00000022879
|
Lipt2
|
lipoyl(octanoyl) transferase 2 (putative) |
| chr2_+_221823687 | 3.11 |
ENSRNOT00000072735
|
Dpyd
|
dihydropyrimidine dehydrogenase |
| chr6_+_134958854 | 3.08 |
ENSRNOT00000073950
ENSRNOT00000009377 |
Dync1h1
|
dynein cytoplasmic 1 heavy chain 1 |
| chr10_-_43895376 | 3.06 |
ENSRNOT00000031811
|
Olr1413
|
olfactory receptor 1413 |
| chr17_+_31236015 | 3.05 |
ENSRNOT00000023149
|
Slc22a23
|
solute carrier family 22, member 23 |
| chr17_+_5382034 | 3.04 |
ENSRNOT00000037597
|
Golm1
|
golgi membrane protein 1 |
| chr18_+_56887354 | 2.77 |
ENSRNOT00000044346
ENSRNOT00000066133 |
Csnk1a1
|
casein kinase 1, alpha 1 |
| chr8_+_48094673 | 2.55 |
ENSRNOT00000008614
|
Nectin1
|
nectin cell adhesion molecule 1 |
| chr7_+_130532435 | 2.41 |
ENSRNOT00000092672
ENSRNOT00000092535 |
Shank3
|
SH3 and multiple ankyrin repeat domains 3 |
| chr5_-_86696388 | 2.41 |
ENSRNOT00000007812
|
Megf9
|
multiple EGF-like-domains 9 |
| chr1_-_174588529 | 2.28 |
ENSRNOT00000017485
|
Dennd5a
|
DENN domain containing 5A |
| chr1_-_99955717 | 2.24 |
ENSRNOT00000079624
|
Klk1c6
|
kallikrein 1-related peptidase C6 |
| chr2_-_187863503 | 2.24 |
ENSRNOT00000093036
ENSRNOT00000026705 ENSRNOT00000082174 |
Lmna
|
lamin A/C |
| chr1_-_146029840 | 2.23 |
ENSRNOT00000016455
|
Mesdc1
|
mesoderm development candidate 1 |
| chr1_-_82108083 | 2.22 |
ENSRNOT00000027677
ENSRNOT00000084530 |
Gsk3a
|
glycogen synthase kinase 3 alpha |
| chr10_+_90134193 | 2.18 |
ENSRNOT00000028375
|
G6pc3
|
glucose 6 phosphatase catalytic subunit 3 |
| chr7_-_101140308 | 2.04 |
ENSRNOT00000006279
|
Fam84b
|
family with sequence similarity 84, member B |
| chr11_-_45510961 | 2.00 |
ENSRNOT00000002238
|
Tomm70
|
translocase of outer mitochondrial membrane 70 |
| chr7_+_2504695 | 1.99 |
ENSRNOT00000003965
|
Atp5b
|
ATP synthase, H+ transporting, mitochondrial F1 complex, beta polypeptide |
| chr1_-_99894353 | 1.47 |
ENSRNOT00000045756
|
Klk1c10
|
kallikrein 1-related peptidase C10 |
| chr19_-_26181449 | 1.23 |
ENSRNOT00000036953
|
LOC685513
|
similar to Guanine nucleotide-binding protein G(I)/G(S)/G(O) gamma-12 subunit precursor |
| chr3_-_8432593 | 1.22 |
ENSRNOT00000090574
|
AC114363.1
|
|
| chr10_-_65780349 | 1.21 |
ENSRNOT00000013220
|
Tmem199
|
transmembrane protein 199 |
| chr19_-_37938857 | 1.21 |
ENSRNOT00000026730
|
Slc12a4
|
solute carrier family 12 member 4 |
| chr3_+_159887036 | 1.16 |
ENSRNOT00000031868
|
R3hdml
|
R3H domain containing-like |
| chr18_-_29497410 | 1.04 |
ENSRNOT00000024671
|
Sra1
|
steroid receptor RNA activator 1 |
| chr2_-_96520137 | 0.97 |
ENSRNOT00000066966
|
Zc2hc1a
|
zinc finger, C2HC-type containing 1A |
| chr16_+_55152748 | 0.96 |
ENSRNOT00000000121
|
Fgf20
|
fibroblast growth factor 20 |
| chr20_+_8325041 | 0.90 |
ENSRNOT00000000640
|
Cmtr1
|
cap methyltransferase 1 |
| chr9_-_16611899 | 0.80 |
ENSRNOT00000089168
|
Mea1
|
male-enhanced antigen 1 |
| chr12_+_9464026 | 0.79 |
ENSRNOT00000048188
|
Cdx2
|
caudal type homeo box 2 |
| chr2_-_187149017 | 0.73 |
ENSRNOT00000092760
|
Ntrk1
|
neurotrophic receptor tyrosine kinase 1 |
| chr20_-_27308069 | 0.65 |
ENSRNOT00000056047
|
Slc25a16
|
solute carrier family 25 member 16 |
| chr12_-_41671437 | 0.64 |
ENSRNOT00000001883
|
Lhx5
|
LIM homeobox 5 |
| chr1_-_80630038 | 0.62 |
ENSRNOT00000025281
|
Tomm40
|
translocase of outer mitochondrial membrane 40 |
| chr16_+_60925093 | 0.60 |
ENSRNOT00000015813
|
Tnks
|
tankyrase |
| chr9_+_121802673 | 0.54 |
ENSRNOT00000086534
|
Yes1
|
YES proto-oncogene 1, Src family tyrosine kinase |
| chr8_-_56696968 | 0.54 |
ENSRNOT00000016637
|
Zc3h12c
|
zinc finger CCCH type containing 12C |
| chr1_-_266934303 | 0.52 |
ENSRNOT00000036202
|
Calhm3
|
calcium homeostasis modulator 3 |
| chr18_+_56887722 | 0.38 |
ENSRNOT00000078783
|
Csnk1a1
|
casein kinase 1, alpha 1 |
| chr11_-_83546674 | 0.35 |
ENSRNOT00000044896
|
Ephb3
|
Eph receptor B3 |
| chr3_+_108795235 | 0.20 |
ENSRNOT00000007028
|
Spred1
|
sprouty-related, EVH1 domain containing 1 |
Network of associatons between targets according to the STRING database.

First level regulatory network of Tfap2c
Gene Ontology Analysis
Gene overrepresentation in biological process category:
| Log-likelihood per target | Total log-likelihood | Term | Description |
|---|---|---|---|
| 17.2 | 51.6 | GO:1990926 | short-term synaptic potentiation(GO:1990926) |
| 14.1 | 42.4 | GO:0048378 | ventricular zone neuroblast division(GO:0021847) fibroblast growth factor receptor signaling pathway involved in orbitofrontal cortex development(GO:0035607) lateral mesodermal cell fate commitment(GO:0048372) lateral mesodermal cell fate specification(GO:0048377) regulation of lateral mesodermal cell fate specification(GO:0048378) |
| 7.4 | 29.7 | GO:0006546 | glycine catabolic process(GO:0006546) glycine decarboxylation via glycine cleavage system(GO:0019464) |
| 7.1 | 42.9 | GO:0010045 | response to nickel cation(GO:0010045) |
| 6.9 | 20.7 | GO:1900738 | positive regulation of phospholipase C-activating G-protein coupled receptor signaling pathway(GO:1900738) |
| 6.6 | 19.9 | GO:2000312 | regulation of kainate selective glutamate receptor activity(GO:2000312) |
| 6.0 | 18.1 | GO:0061732 | mitochondrial acetyl-CoA biosynthetic process from pyruvate(GO:0061732) |
| 6.0 | 17.9 | GO:0006663 | platelet activating factor biosynthetic process(GO:0006663) |
| 4.8 | 19.0 | GO:0098886 | modification of dendritic spine(GO:0098886) |
| 4.6 | 18.5 | GO:0072086 | specification of loop of Henle identity(GO:0072086) |
| 4.2 | 16.9 | GO:0042776 | mitochondrial ATP synthesis coupled proton transport(GO:0042776) |
| 4.0 | 11.9 | GO:0040032 | post-embryonic body morphogenesis(GO:0040032) |
| 3.8 | 15.2 | GO:0043397 | corticotropin-releasing hormone secretion(GO:0043396) regulation of corticotropin-releasing hormone secretion(GO:0043397) |
| 3.6 | 25.2 | GO:0016185 | synaptic vesicle budding from presynaptic endocytic zone membrane(GO:0016185) |
| 3.6 | 10.8 | GO:0046946 | hydroxylysine metabolic process(GO:0046946) hydroxylysine biosynthetic process(GO:0046947) |
| 3.6 | 17.9 | GO:0045448 | regulation of mitotic cell cycle, embryonic(GO:0009794) serotonergic neuron axon guidance(GO:0036515) mitotic cell cycle, embryonic(GO:0045448) |
| 3.2 | 16.2 | GO:1904045 | cellular response to aldosterone(GO:1904045) |
| 3.0 | 9.1 | GO:0060948 | neuropilin signaling pathway(GO:0038189) VEGF-activated neuropilin signaling pathway(GO:0038190) cardiac vascular smooth muscle cell development(GO:0060948) positive regulation of lymphangiogenesis(GO:1901492) |
| 2.8 | 14.0 | GO:0003431 | growth plate cartilage chondrocyte development(GO:0003431) |
| 2.6 | 7.9 | GO:1900222 | negative regulation of beta-amyloid clearance(GO:1900222) |
| 2.6 | 23.2 | GO:0090336 | positive regulation of brown fat cell differentiation(GO:0090336) |
| 2.6 | 10.3 | GO:0000379 | tRNA-type intron splice site recognition and cleavage(GO:0000379) |
| 2.5 | 36.9 | GO:0061469 | regulation of type B pancreatic cell proliferation(GO:0061469) |
| 2.4 | 19.2 | GO:1990034 | calcium ion export from cell(GO:1990034) |
| 2.1 | 27.1 | GO:0042178 | xenobiotic catabolic process(GO:0042178) |
| 2.1 | 10.3 | GO:2000672 | negative regulation of motor neuron apoptotic process(GO:2000672) |
| 2.0 | 6.1 | GO:0009216 | purine deoxyribonucleotide biosynthetic process(GO:0009153) purine deoxyribonucleoside triphosphate biosynthetic process(GO:0009216) AMP salvage(GO:0044209) adenosine biosynthetic process(GO:0046086) |
| 2.0 | 5.9 | GO:0021577 | hindbrain structural organization(GO:0021577) cerebellum structural organization(GO:0021589) neuronal-glial interaction involved in cerebral cortex radial glia guided migration(GO:0021812) |
| 2.0 | 5.9 | GO:0045077 | negative regulation of interferon-gamma biosynthetic process(GO:0045077) |
| 1.9 | 7.8 | GO:0007352 | zygotic specification of dorsal/ventral axis(GO:0007352) |
| 1.9 | 11.3 | GO:2000630 | positive regulation of miRNA metabolic process(GO:2000630) |
| 1.8 | 26.7 | GO:0051639 | actin filament network formation(GO:0051639) |
| 1.7 | 10.3 | GO:0035093 | spermatogenesis, exchange of chromosomal proteins(GO:0035093) |
| 1.7 | 6.7 | GO:0051344 | negative regulation of cyclic-nucleotide phosphodiesterase activity(GO:0051344) |
| 1.6 | 6.5 | GO:0021586 | pons maturation(GO:0021586) |
| 1.6 | 15.9 | GO:0007191 | adenylate cyclase-activating dopamine receptor signaling pathway(GO:0007191) |
| 1.5 | 4.6 | GO:0015864 | pyrimidine nucleoside transport(GO:0015864) |
| 1.5 | 6.0 | GO:0050893 | sensory processing(GO:0050893) |
| 1.5 | 7.3 | GO:0006987 | activation of signaling protein activity involved in unfolded protein response(GO:0006987) negative regulation by virus of viral protein levels in host cell(GO:0046725) |
| 1.4 | 6.9 | GO:0019064 | fusion of virus membrane with host plasma membrane(GO:0019064) membrane fusion involved in viral entry into host cell(GO:0039663) multi-organism membrane fusion(GO:0044800) |
| 1.3 | 9.4 | GO:0050915 | regulation of systemic arterial blood pressure by baroreceptor feedback(GO:0003025) sensory perception of sour taste(GO:0050915) |
| 1.3 | 20.0 | GO:0045821 | positive regulation of glycolytic process(GO:0045821) |
| 1.2 | 5.0 | GO:0006114 | glycerol biosynthetic process(GO:0006114) |
| 1.2 | 10.7 | GO:0006689 | ganglioside catabolic process(GO:0006689) |
| 1.1 | 4.5 | GO:0000320 | re-entry into mitotic cell cycle(GO:0000320) |
| 1.1 | 3.4 | GO:0030719 | oocyte construction(GO:0007308) oocyte axis specification(GO:0007309) oocyte anterior/posterior axis specification(GO:0007314) pole plasm assembly(GO:0007315) maternal determination of anterior/posterior axis, embryo(GO:0008358) P granule organization(GO:0030719) |
| 1.1 | 3.3 | GO:0009106 | lipoate metabolic process(GO:0009106) |
| 1.1 | 10.9 | GO:0061302 | smooth muscle cell-matrix adhesion(GO:0061302) |
| 1.0 | 6.3 | GO:0023021 | termination of signal transduction(GO:0023021) |
| 1.0 | 3.1 | GO:0006214 | thymidine catabolic process(GO:0006214) pyrimidine deoxyribonucleoside catabolic process(GO:0046127) |
| 1.0 | 16.2 | GO:0060068 | vagina development(GO:0060068) neuron cellular homeostasis(GO:0070050) |
| 1.0 | 14.7 | GO:0060134 | prepulse inhibition(GO:0060134) |
| 0.9 | 15.5 | GO:0070262 | peptidyl-serine dephosphorylation(GO:0070262) |
| 0.9 | 7.2 | GO:0046543 | development of secondary female sexual characteristics(GO:0046543) |
| 0.9 | 9.8 | GO:1990118 | sodium ion import across plasma membrane(GO:0098719) sodium ion import into cell(GO:1990118) |
| 0.8 | 8.3 | GO:0019372 | lipoxygenase pathway(GO:0019372) |
| 0.8 | 14.5 | GO:0031581 | hemidesmosome assembly(GO:0031581) |
| 0.8 | 9.1 | GO:0097623 | potassium ion export across plasma membrane(GO:0097623) |
| 0.7 | 9.0 | GO:0030206 | chondroitin sulfate biosynthetic process(GO:0030206) |
| 0.7 | 2.2 | GO:0044027 | hypermethylation of CpG island(GO:0044027) |
| 0.7 | 9.7 | GO:0021957 | corticospinal tract morphogenesis(GO:0021957) |
| 0.7 | 9.6 | GO:0060033 | anatomical structure regression(GO:0060033) |
| 0.7 | 9.2 | GO:2000052 | positive regulation of non-canonical Wnt signaling pathway(GO:2000052) |
| 0.6 | 8.6 | GO:0060088 | auditory receptor cell stereocilium organization(GO:0060088) |
| 0.6 | 2.4 | GO:0097117 | guanylate kinase-associated protein clustering(GO:0097117) |
| 0.6 | 7.5 | GO:0001977 | renal system process involved in regulation of blood volume(GO:0001977) |
| 0.5 | 14.8 | GO:0000188 | inactivation of MAPK activity(GO:0000188) |
| 0.5 | 5.9 | GO:0007196 | adenylate cyclase-inhibiting G-protein coupled glutamate receptor signaling pathway(GO:0007196) |
| 0.5 | 3.7 | GO:0042090 | interleukin-12 biosynthetic process(GO:0042090) regulation of interleukin-12 biosynthetic process(GO:0045075) |
| 0.5 | 1.5 | GO:0035105 | sterol regulatory element binding protein import into nucleus(GO:0035105) negative regulation of adipose tissue development(GO:1904178) |
| 0.5 | 6.6 | GO:0010839 | negative regulation of keratinocyte proliferation(GO:0010839) |
| 0.5 | 3.5 | GO:0033353 | S-adenosylmethionine cycle(GO:0033353) |
| 0.5 | 2.0 | GO:0006933 | negative regulation of cell adhesion involved in substrate-bound cell migration(GO:0006933) |
| 0.5 | 12.6 | GO:1900449 | regulation of glutamate receptor signaling pathway(GO:1900449) |
| 0.5 | 13.2 | GO:0001956 | positive regulation of neurotransmitter secretion(GO:0001956) |
| 0.4 | 14.8 | GO:0006890 | retrograde vesicle-mediated transport, Golgi to ER(GO:0006890) |
| 0.4 | 5.9 | GO:0007256 | activation of JNKK activity(GO:0007256) |
| 0.4 | 4.1 | GO:0035524 | proline transmembrane transport(GO:0035524) |
| 0.4 | 6.5 | GO:0000042 | protein targeting to Golgi(GO:0000042) |
| 0.4 | 5.4 | GO:0032482 | Rab protein signal transduction(GO:0032482) |
| 0.4 | 4.0 | GO:1901642 | nucleoside transmembrane transport(GO:1901642) |
| 0.3 | 2.6 | GO:1902414 | protein localization to cell junction(GO:1902414) |
| 0.3 | 3.2 | GO:1904424 | regulation of GTP binding(GO:1904424) |
| 0.3 | 21.6 | GO:0015909 | long-chain fatty acid transport(GO:0015909) |
| 0.3 | 0.6 | GO:0070213 | protein auto-ADP-ribosylation(GO:0070213) |
| 0.3 | 0.9 | GO:0036451 | cap mRNA methylation(GO:0036451) |
| 0.3 | 13.1 | GO:0030514 | negative regulation of BMP signaling pathway(GO:0030514) |
| 0.3 | 7.1 | GO:0060065 | uterus development(GO:0060065) |
| 0.3 | 18.7 | GO:0061077 | chaperone-mediated protein folding(GO:0061077) |
| 0.3 | 2.8 | GO:0070345 | negative regulation of fat cell proliferation(GO:0070345) |
| 0.3 | 10.7 | GO:0007214 | gamma-aminobutyric acid signaling pathway(GO:0007214) |
| 0.2 | 3.1 | GO:0034063 | stress granule assembly(GO:0034063) |
| 0.2 | 4.4 | GO:0033327 | Leydig cell differentiation(GO:0033327) |
| 0.2 | 2.2 | GO:0015760 | hexose phosphate transport(GO:0015712) glucose-6-phosphate transport(GO:0015760) |
| 0.2 | 5.2 | GO:0070584 | mitochondrion morphogenesis(GO:0070584) |
| 0.2 | 6.4 | GO:0006779 | porphyrin-containing compound biosynthetic process(GO:0006779) |
| 0.2 | 4.5 | GO:0071157 | negative regulation of cell cycle arrest(GO:0071157) |
| 0.2 | 10.3 | GO:0046847 | filopodium assembly(GO:0046847) |
| 0.2 | 14.7 | GO:0030032 | lamellipodium assembly(GO:0030032) |
| 0.2 | 0.7 | GO:0043137 | DNA replication, removal of RNA primer(GO:0043137) |
| 0.2 | 0.6 | GO:0021937 | cerebellar Purkinje cell-granule cell precursor cell signaling involved in regulation of granule cell precursor cell proliferation(GO:0021937) |
| 0.2 | 4.1 | GO:0000027 | ribosomal large subunit assembly(GO:0000027) |
| 0.1 | 0.7 | GO:0061368 | behavioral response to chemical pain(GO:0061366) behavioral response to formalin induced pain(GO:0061368) |
| 0.1 | 6.5 | GO:0060612 | adipose tissue development(GO:0060612) |
| 0.1 | 7.0 | GO:2001238 | positive regulation of extrinsic apoptotic signaling pathway(GO:2001238) |
| 0.1 | 5.8 | GO:0021762 | substantia nigra development(GO:0021762) |
| 0.1 | 7.8 | GO:0040014 | regulation of multicellular organism growth(GO:0040014) |
| 0.1 | 4.6 | GO:0060999 | positive regulation of dendritic spine development(GO:0060999) |
| 0.1 | 3.7 | GO:0042073 | intraciliary transport(GO:0042073) |
| 0.1 | 12.8 | GO:0007156 | homophilic cell adhesion via plasma membrane adhesion molecules(GO:0007156) |
| 0.1 | 0.8 | GO:0014807 | regulation of somitogenesis(GO:0014807) |
| 0.0 | 4.5 | GO:0045727 | positive regulation of translation(GO:0045727) |
| 0.0 | 0.6 | GO:0030150 | protein import into mitochondrial matrix(GO:0030150) |
| 0.0 | 1.0 | GO:0060043 | regulation of cardiac muscle cell proliferation(GO:0060043) |
| 0.0 | 2.3 | GO:0042147 | retrograde transport, endosome to Golgi(GO:0042147) |
| 0.0 | 0.4 | GO:0022038 | corpus callosum development(GO:0022038) |
| 0.0 | 1.0 | GO:2000273 | positive regulation of receptor activity(GO:2000273) |
| 0.0 | 2.7 | GO:0000086 | G2/M transition of mitotic cell cycle(GO:0000086) |
| 0.0 | 1.2 | GO:1902476 | chloride transmembrane transport(GO:1902476) |
Gene overrepresentation in cellular component category:
| Log-likelihood per target | Total log-likelihood | Term | Description |
|---|---|---|---|
| 5.4 | 16.2 | GO:0098855 | HCN channel complex(GO:0098855) |
| 5.4 | 16.2 | GO:0005960 | glycine cleavage complex(GO:0005960) |
| 4.7 | 51.6 | GO:0032009 | early phagosome(GO:0032009) |
| 3.4 | 10.3 | GO:0097058 | CRLF-CLCF1 complex(GO:0097058) |
| 2.2 | 6.5 | GO:0016533 | cyclin-dependent protein kinase 5 holoenzyme complex(GO:0016533) |
| 2.1 | 10.3 | GO:0030868 | smooth endoplasmic reticulum membrane(GO:0030868) smooth endoplasmic reticulum part(GO:0097425) |
| 2.1 | 10.3 | GO:0000214 | tRNA-intron endonuclease complex(GO:0000214) |
| 1.8 | 10.9 | GO:0048237 | rough endoplasmic reticulum lumen(GO:0048237) |
| 1.7 | 19.9 | GO:0098839 | postsynaptic density membrane(GO:0098839) |
| 1.5 | 16.9 | GO:0005750 | mitochondrial respiratory chain complex III(GO:0005750) |
| 1.5 | 19.8 | GO:0017146 | NMDA selective glutamate receptor complex(GO:0017146) |
| 1.3 | 25.2 | GO:0043196 | varicosity(GO:0043196) |
| 1.2 | 14.0 | GO:0005583 | fibrillar collagen trimer(GO:0005583) banded collagen fibril(GO:0098643) |
| 1.1 | 17.9 | GO:0032433 | filopodium tip(GO:0032433) |
| 1.1 | 20.0 | GO:0031588 | nucleotide-activated protein kinase complex(GO:0031588) |
| 1.1 | 26.7 | GO:0005865 | striated muscle thin filament(GO:0005865) |
| 1.1 | 47.7 | GO:0005891 | voltage-gated calcium channel complex(GO:0005891) |
| 0.7 | 8.6 | GO:0032426 | stereocilium tip(GO:0032426) |
| 0.7 | 14.5 | GO:0030056 | hemidesmosome(GO:0030056) |
| 0.7 | 18.9 | GO:0032588 | trans-Golgi network membrane(GO:0032588) |
| 0.6 | 6.4 | GO:0014731 | spectrin(GO:0008091) spectrin-associated cytoskeleton(GO:0014731) |
| 0.6 | 15.9 | GO:0008074 | guanylate cyclase complex, soluble(GO:0008074) |
| 0.6 | 18.1 | GO:0031304 | intrinsic component of mitochondrial inner membrane(GO:0031304) integral component of mitochondrial inner membrane(GO:0031305) |
| 0.6 | 15.5 | GO:0000159 | protein phosphatase type 2A complex(GO:0000159) |
| 0.5 | 9.5 | GO:0097038 | perinuclear endoplasmic reticulum(GO:0097038) |
| 0.5 | 10.7 | GO:0098563 | integral component of synaptic vesicle membrane(GO:0030285) intrinsic component of synaptic vesicle membrane(GO:0098563) GABA-A receptor complex(GO:1902711) |
| 0.4 | 9.7 | GO:0016581 | NuRD complex(GO:0016581) CHD-type complex(GO:0090545) |
| 0.4 | 7.3 | GO:0070971 | endoplasmic reticulum exit site(GO:0070971) |
| 0.4 | 6.9 | GO:0031362 | anchored component of external side of plasma membrane(GO:0031362) |
| 0.4 | 19.0 | GO:0048786 | presynaptic active zone(GO:0048786) |
| 0.4 | 14.6 | GO:0001772 | immunological synapse(GO:0001772) |
| 0.3 | 23.2 | GO:0005778 | peroxisomal membrane(GO:0005778) microbody membrane(GO:0031903) |
| 0.3 | 50.4 | GO:0005741 | mitochondrial outer membrane(GO:0005741) |
| 0.3 | 2.6 | GO:0032584 | growth cone membrane(GO:0032584) |
| 0.3 | 3.2 | GO:0030877 | beta-catenin destruction complex(GO:0030877) |
| 0.3 | 8.3 | GO:0042629 | mast cell granule(GO:0042629) |
| 0.3 | 1.2 | GO:0030663 | COPI-coated vesicle membrane(GO:0030663) |
| 0.3 | 6.3 | GO:0042599 | lamellar body(GO:0042599) |
| 0.3 | 6.8 | GO:0030867 | rough endoplasmic reticulum membrane(GO:0030867) |
| 0.3 | 5.3 | GO:0005922 | connexon complex(GO:0005922) |
| 0.2 | 2.0 | GO:0045261 | mitochondrial proton-transporting ATP synthase complex, catalytic core F(1)(GO:0000275) proton-transporting ATP synthase complex, catalytic core F(1)(GO:0045261) |
| 0.2 | 5.9 | GO:0032839 | dendrite cytoplasm(GO:0032839) |
| 0.2 | 14.8 | GO:0005871 | kinesin complex(GO:0005871) |
| 0.2 | 0.7 | GO:0005760 | gamma DNA polymerase complex(GO:0005760) |
| 0.2 | 16.9 | GO:0001725 | stress fiber(GO:0001725) contractile actin filament bundle(GO:0097517) |
| 0.2 | 1.5 | GO:0005638 | lamin filament(GO:0005638) |
| 0.2 | 6.6 | GO:0044295 | axonal growth cone(GO:0044295) |
| 0.2 | 16.5 | GO:0005604 | basement membrane(GO:0005604) |
| 0.2 | 6.5 | GO:0030173 | integral component of Golgi membrane(GO:0030173) |
| 0.1 | 25.1 | GO:0043204 | perikaryon(GO:0043204) |
| 0.1 | 9.0 | GO:0032580 | Golgi cisterna membrane(GO:0032580) |
| 0.1 | 16.8 | GO:0045211 | postsynaptic membrane(GO:0045211) |
| 0.1 | 34.7 | GO:0043235 | receptor complex(GO:0043235) |
| 0.1 | 5.2 | GO:0009295 | nucleoid(GO:0009295) mitochondrial nucleoid(GO:0042645) |
| 0.1 | 3.1 | GO:0005868 | cytoplasmic dynein complex(GO:0005868) |
| 0.1 | 3.7 | GO:0032391 | photoreceptor connecting cilium(GO:0032391) |
| 0.1 | 2.3 | GO:0030904 | retromer complex(GO:0030904) |
| 0.1 | 5.3 | GO:0000315 | organellar large ribosomal subunit(GO:0000315) mitochondrial large ribosomal subunit(GO:0005762) |
| 0.1 | 3.9 | GO:0000307 | cyclin-dependent protein kinase holoenzyme complex(GO:0000307) |
| 0.1 | 8.3 | GO:0031256 | leading edge membrane(GO:0031256) |
| 0.1 | 6.3 | GO:0043197 | dendritic spine(GO:0043197) |
| 0.1 | 6.5 | GO:0030117 | membrane coat(GO:0030117) coated membrane(GO:0048475) |
| 0.1 | 5.9 | GO:0005903 | brush border(GO:0005903) |
| 0.1 | 3.9 | GO:0031463 | Cul3-RING ubiquitin ligase complex(GO:0031463) |
| 0.0 | 8.7 | GO:0030424 | axon(GO:0030424) |
| 0.0 | 3.5 | GO:0000139 | Golgi membrane(GO:0000139) |
| 0.0 | 1.2 | GO:0005834 | heterotrimeric G-protein complex(GO:0005834) |
| 0.0 | 17.4 | GO:0005815 | microtubule organizing center(GO:0005815) |
| 0.0 | 8.7 | GO:0015630 | microtubule cytoskeleton(GO:0015630) |
| 0.0 | 21.9 | GO:0005887 | integral component of plasma membrane(GO:0005887) |
| 0.0 | 8.7 | GO:0019866 | organelle inner membrane(GO:0019866) |
| 0.0 | 1.0 | GO:0045171 | intercellular bridge(GO:0045171) |
| 0.0 | 5.5 | GO:0005578 | proteinaceous extracellular matrix(GO:0005578) |
| 0.0 | 0.8 | GO:0017053 | transcriptional repressor complex(GO:0017053) |
| 0.0 | 53.5 | GO:0016021 | integral component of membrane(GO:0016021) |
Gene overrepresentation in molecular function category:
| Log-likelihood per target | Total log-likelihood | Term | Description |
|---|---|---|---|
| 8.6 | 42.9 | GO:0008332 | low voltage-gated calcium channel activity(GO:0008332) |
| 5.4 | 27.1 | GO:0070404 | NADH binding(GO:0070404) |
| 5.4 | 21.6 | GO:0016416 | carnitine O-palmitoyltransferase activity(GO:0004095) O-palmitoyltransferase activity(GO:0016416) |
| 5.3 | 42.4 | GO:0005007 | fibroblast growth factor-activated receptor activity(GO:0005007) |
| 4.2 | 25.2 | GO:0031749 | D2 dopamine receptor binding(GO:0031749) |
| 3.6 | 18.1 | GO:0050833 | pyruvate transmembrane transporter activity(GO:0050833) |
| 3.6 | 10.8 | GO:0008475 | procollagen-lysine 5-dioxygenase activity(GO:0008475) procollagen glucosyltransferase activity(GO:0033823) |
| 3.4 | 10.3 | GO:0072320 | volume-sensitive chloride channel activity(GO:0072320) |
| 3.4 | 10.3 | GO:0061628 | H3K27me3 modified histone binding(GO:0061628) |
| 2.7 | 19.2 | GO:0005432 | calcium:sodium antiporter activity(GO:0005432) |
| 2.6 | 15.9 | GO:0008294 | calcium- and calmodulin-responsive adenylate cyclase activity(GO:0008294) |
| 2.6 | 7.8 | GO:0070698 | type I activin receptor binding(GO:0070698) |
| 2.5 | 7.5 | GO:0003845 | 11-beta-hydroxysteroid dehydrogenase [NAD(P)] activity(GO:0003845) |
| 2.3 | 6.9 | GO:0033906 | hyaluronoglucuronidase activity(GO:0033906) |
| 2.2 | 17.9 | GO:0017169 | CDP-alcohol phosphatidyltransferase activity(GO:0017169) |
| 2.1 | 10.7 | GO:0008503 | benzodiazepine receptor activity(GO:0008503) |
| 2.1 | 10.3 | GO:0000213 | tRNA-intron endonuclease activity(GO:0000213) |
| 2.0 | 11.9 | GO:0051430 | corticotropin-releasing hormone receptor 1 binding(GO:0051430) |
| 1.9 | 9.5 | GO:0005250 | A-type (transient outward) potassium channel activity(GO:0005250) |
| 1.8 | 7.3 | GO:0033149 | FFAT motif binding(GO:0033149) |
| 1.8 | 10.7 | GO:0004308 | exo-alpha-sialidase activity(GO:0004308) alpha-sialidase activity(GO:0016997) |
| 1.7 | 10.3 | GO:0005127 | ciliary neurotrophic factor receptor binding(GO:0005127) |
| 1.6 | 30.8 | GO:0016594 | glycine binding(GO:0016594) |
| 1.6 | 16.2 | GO:0005222 | intracellular cAMP activated cation channel activity(GO:0005222) |
| 1.5 | 5.9 | GO:0004706 | JUN kinase kinase kinase activity(GO:0004706) |
| 1.3 | 20.0 | GO:0004679 | AMP-activated protein kinase activity(GO:0004679) |
| 1.2 | 8.4 | GO:0030160 | GKAP/Homer scaffold activity(GO:0030160) |
| 1.1 | 17.9 | GO:0042813 | Wnt-activated receptor activity(GO:0042813) |
| 1.0 | 9.4 | GO:0015280 | ligand-gated sodium channel activity(GO:0015280) |
| 1.0 | 3.1 | GO:0004159 | dihydrouracil dehydrogenase (NAD+) activity(GO:0004159) dihydropyrimidine dehydrogenase (NADP+) activity(GO:0017113) |
| 1.0 | 9.8 | GO:0015386 | potassium:proton antiporter activity(GO:0015386) |
| 0.9 | 6.3 | GO:0004767 | sphingomyelin phosphodiesterase activity(GO:0004767) |
| 0.9 | 3.5 | GO:0016802 | adenosylhomocysteinase activity(GO:0004013) trialkylsulfonium hydrolase activity(GO:0016802) |
| 0.8 | 5.9 | GO:0015277 | kainate selective glutamate receptor activity(GO:0015277) |
| 0.8 | 6.7 | GO:0031545 | peptidyl-proline 4-dioxygenase activity(GO:0031545) |
| 0.8 | 3.3 | GO:0016415 | octanoyltransferase activity(GO:0016415) |
| 0.8 | 5.0 | GO:0098519 | nucleotide phosphatase activity, acting on free nucleotides(GO:0098519) |
| 0.8 | 47.1 | GO:0001786 | phosphatidylserine binding(GO:0001786) |
| 0.8 | 14.6 | GO:0033549 | MAP kinase phosphatase activity(GO:0033549) |
| 0.8 | 7.9 | GO:0070878 | primary miRNA binding(GO:0070878) |
| 0.8 | 3.1 | GO:0008569 | ATP-dependent microtubule motor activity, minus-end-directed(GO:0008569) |
| 0.6 | 5.4 | GO:0043184 | vascular endothelial growth factor receptor 2 binding(GO:0043184) |
| 0.6 | 8.3 | GO:0045295 | gamma-catenin binding(GO:0045295) |
| 0.6 | 20.9 | GO:0030506 | ankyrin binding(GO:0030506) |
| 0.5 | 15.2 | GO:0071855 | neuropeptide receptor binding(GO:0071855) |
| 0.5 | 19.9 | GO:0035255 | ionotropic glutamate receptor binding(GO:0035255) |
| 0.5 | 30.8 | GO:0005201 | extracellular matrix structural constituent(GO:0005201) |
| 0.5 | 13.1 | GO:0005520 | insulin-like growth factor binding(GO:0005520) |
| 0.5 | 10.9 | GO:0001871 | pattern binding(GO:0001871) polysaccharide binding(GO:0030247) |
| 0.4 | 5.8 | GO:0005528 | macrolide binding(GO:0005527) FK506 binding(GO:0005528) |
| 0.4 | 2.2 | GO:0050309 | glucose-6-phosphatase activity(GO:0004346) sugar-terminal-phosphatase activity(GO:0050309) |
| 0.4 | 4.1 | GO:0015193 | L-proline transmembrane transporter activity(GO:0015193) |
| 0.4 | 19.6 | GO:0030507 | spectrin binding(GO:0030507) |
| 0.4 | 6.1 | GO:0019206 | nucleoside kinase activity(GO:0019206) |
| 0.4 | 2.0 | GO:0043532 | angiostatin binding(GO:0043532) |
| 0.4 | 4.9 | GO:0008331 | high voltage-gated calcium channel activity(GO:0008331) |
| 0.4 | 19.0 | GO:0048365 | Rac GTPase binding(GO:0048365) |
| 0.4 | 12.6 | GO:0030742 | GTP-dependent protein binding(GO:0030742) |
| 0.4 | 11.8 | GO:1990841 | promoter-specific chromatin binding(GO:1990841) |
| 0.3 | 12.9 | GO:0051879 | Hsp90 protein binding(GO:0051879) |
| 0.3 | 7.0 | GO:0005031 | tumor necrosis factor-activated receptor activity(GO:0005031) death receptor activity(GO:0005035) |
| 0.3 | 9.0 | GO:0008376 | acetylgalactosaminyltransferase activity(GO:0008376) |
| 0.3 | 2.6 | GO:0046790 | virion binding(GO:0046790) |
| 0.3 | 0.9 | GO:0004483 | mRNA (nucleoside-2'-O-)-methyltransferase activity(GO:0004483) |
| 0.3 | 17.3 | GO:0004714 | transmembrane receptor protein tyrosine kinase activity(GO:0004714) |
| 0.3 | 19.5 | GO:0019888 | protein phosphatase regulator activity(GO:0019888) |
| 0.3 | 8.7 | GO:0005109 | frizzled binding(GO:0005109) |
| 0.3 | 6.9 | GO:0017091 | AU-rich element binding(GO:0017091) |
| 0.3 | 16.9 | GO:0009055 | electron carrier activity(GO:0009055) |
| 0.3 | 8.3 | GO:0004623 | phospholipase A2 activity(GO:0004623) |
| 0.2 | 13.7 | GO:0019003 | GDP binding(GO:0019003) |
| 0.2 | 4.6 | GO:0005337 | nucleoside transmembrane transporter activity(GO:0005337) |
| 0.2 | 6.5 | GO:0043539 | protein serine/threonine kinase activator activity(GO:0043539) |
| 0.2 | 14.8 | GO:0003777 | microtubule motor activity(GO:0003777) |
| 0.2 | 22.3 | GO:0005179 | hormone activity(GO:0005179) |
| 0.2 | 9.6 | GO:0050840 | extracellular matrix binding(GO:0050840) |
| 0.2 | 0.7 | GO:0016890 | site-specific endodeoxyribonuclease activity, specific for altered base(GO:0016890) |
| 0.2 | 4.5 | GO:0070064 | proline-rich region binding(GO:0070064) |
| 0.1 | 1.5 | GO:0008157 | protein phosphatase 1 binding(GO:0008157) |
| 0.1 | 2.2 | GO:0034236 | protein kinase A catalytic subunit binding(GO:0034236) |
| 0.1 | 1.0 | GO:0010861 | thyroid hormone receptor activator activity(GO:0010861) |
| 0.1 | 1.2 | GO:0022820 | potassium:chloride symporter activity(GO:0015379) potassium ion symporter activity(GO:0022820) |
| 0.1 | 3.4 | GO:0004521 | endoribonuclease activity(GO:0004521) |
| 0.1 | 0.6 | GO:0015266 | protein channel activity(GO:0015266) |
| 0.1 | 10.3 | GO:0008168 | methyltransferase activity(GO:0008168) |
| 0.0 | 9.5 | GO:0004252 | serine-type endopeptidase activity(GO:0004252) |
| 0.0 | 1.0 | GO:0005104 | fibroblast growth factor receptor binding(GO:0005104) |
| 0.0 | 0.2 | GO:0005173 | stem cell factor receptor binding(GO:0005173) |
| 0.0 | 0.6 | GO:0003950 | NAD+ ADP-ribosyltransferase activity(GO:0003950) |
| 0.0 | 6.7 | GO:0033218 | amide binding(GO:0033218) |
| 0.0 | 2.3 | GO:0005262 | calcium channel activity(GO:0005262) |
| 0.0 | 3.1 | GO:0008514 | organic anion transmembrane transporter activity(GO:0008514) |
| 0.0 | 29.8 | GO:0004930 | G-protein coupled receptor activity(GO:0004930) |
| 0.0 | 9.7 | GO:0005509 | calcium ion binding(GO:0005509) |
| 0.0 | 4.6 | GO:0003779 | actin binding(GO:0003779) |
Gene overrepresentation in curated gene sets: canonical pathways category:
| Log-likelihood per target | Total log-likelihood | Term | Description |
|---|---|---|---|
| 1.1 | 44.1 | PID GLYPICAN 1PATHWAY | Glypican 1 network |
| 1.0 | 25.2 | PID IL8 CXCR1 PATHWAY | IL8- and CXCR1-mediated signaling events |
| 0.9 | 11.3 | PID TCR RAS PATHWAY | Ras signaling in the CD4+ TCR pathway |
| 0.8 | 15.9 | PID LPA4 PATHWAY | LPA4-mediated signaling events |
| 0.6 | 10.9 | PID INTEGRIN5 PATHWAY | Beta5 beta6 beta7 and beta8 integrin cell surface interactions |
| 0.4 | 21.6 | PID HNF3B PATHWAY | FOXA2 and FOXA3 transcription factor networks |
| 0.4 | 4.5 | PID P38 GAMMA DELTA PATHWAY | Signaling mediated by p38-gamma and p38-delta |
| 0.4 | 15.5 | PID LIS1 PATHWAY | Lissencephaly gene (LIS1) in neuronal migration and development |
| 0.4 | 9.9 | PID P38 MKK3 6PATHWAY | p38 MAPK signaling pathway |
| 0.4 | 7.9 | PID P38 MK2 PATHWAY | p38 signaling mediated by MAPKAP kinases |
| 0.3 | 20.0 | PID VEGFR1 2 PATHWAY | Signaling events mediated by VEGFR1 and VEGFR2 |
| 0.3 | 6.7 | PID HIF1A PATHWAY | Hypoxic and oxygen homeostasis regulation of HIF-1-alpha |
| 0.3 | 17.4 | WNT SIGNALING | Genes related to Wnt-mediated signal transduction |
| 0.3 | 5.4 | PID BETA CATENIN DEG PATHWAY | Degradation of beta catenin |
| 0.2 | 7.1 | PID HDAC CLASSIII PATHWAY | Signaling events mediated by HDAC Class III |
| 0.2 | 2.4 | PID RET PATHWAY | Signaling events regulated by Ret tyrosine kinase |
| 0.2 | 7.8 | PID BMP PATHWAY | BMP receptor signaling |
| 0.1 | 30.7 | NABA ECM REGULATORS | Genes encoding enzymes and their regulators involved in the remodeling of the extracellular matrix |
| 0.1 | 6.3 | PID CERAMIDE PATHWAY | Ceramide signaling pathway |
| 0.1 | 5.3 | PID HDAC CLASSI PATHWAY | Signaling events mediated by HDAC Class I |
| 0.1 | 4.6 | PID ERA GENOMIC PATHWAY | Validated nuclear estrogen receptor alpha network |
| 0.1 | 3.2 | PID NFAT TFPATHWAY | Calcineurin-regulated NFAT-dependent transcription in lymphocytes |
| 0.1 | 2.8 | PID RB 1PATHWAY | Regulation of retinoblastoma protein |
| 0.0 | 2.8 | PID BETA CATENIN NUC PATHWAY | Regulation of nuclear beta catenin signaling and target gene transcription |
| 0.0 | 1.5 | PID CASPASE PATHWAY | Caspase cascade in apoptosis |
| 0.0 | 1.5 | NABA COLLAGENS | Genes encoding collagen proteins |
| 0.0 | 0.7 | ST DIFFERENTIATION PATHWAY IN PC12 CELLS | Differentiation Pathway in PC12 Cells; this is a specific case of PAC1 Receptor Pathway. |
| 0.0 | 0.4 | PID EPHB FWD PATHWAY | EPHB forward signaling |
| 0.0 | 0.2 | PID KIT PATHWAY | Signaling events mediated by Stem cell factor receptor (c-Kit) |
Gene overrepresentation in curated gene sets: REACTOME pathways category:
| Log-likelihood per target | Total log-likelihood | Term | Description |
|---|---|---|---|
| 3.3 | 43.3 | REACTOME SIGNALING BY ACTIVATED POINT MUTANTS OF FGFR1 | Genes involved in Signaling by activated point mutants of FGFR1 |
| 2.8 | 25.2 | REACTOME GAP JUNCTION DEGRADATION | Genes involved in Gap junction degradation |
| 2.2 | 20.0 | REACTOME REGULATION OF RHEB GTPASE ACTIVITY BY AMPK | Genes involved in Regulation of Rheb GTPase activity by AMPK |
| 1.4 | 21.6 | REACTOME ACTIVATED AMPK STIMULATES FATTY ACID OXIDATION IN MUSCLE | Genes involved in Activated AMPK stimulates fatty-acid oxidation in muscle |
| 1.1 | 11.3 | REACTOME RAF MAP KINASE CASCADE | Genes involved in RAF/MAP kinase cascade |
| 1.1 | 15.9 | REACTOME ADENYLATE CYCLASE ACTIVATING PATHWAY | Genes involved in Adenylate cyclase activating pathway |
| 1.0 | 14.6 | REACTOME ERKS ARE INACTIVATED | Genes involved in ERKs are inactivated |
| 0.8 | 6.5 | REACTOME NEF MEDIATED DOWNREGULATION OF MHC CLASS I COMPLEX CELL SURFACE EXPRESSION | Genes involved in Nef mediated downregulation of MHC class I complex cell surface expression |
| 0.8 | 34.5 | REACTOME NCAM1 INTERACTIONS | Genes involved in NCAM1 interactions |
| 0.8 | 19.2 | REACTOME PLATELET CALCIUM HOMEOSTASIS | Genes involved in Platelet calcium homeostasis |
| 0.7 | 17.9 | REACTOME SYNTHESIS OF PC | Genes involved in Synthesis of PC |
| 0.6 | 10.7 | REACTOME GABA A RECEPTOR ACTIVATION | Genes involved in GABA A receptor activation |
| 0.6 | 15.8 | REACTOME REGULATION OF HYPOXIA INDUCIBLE FACTOR HIF BY OXYGEN | Genes involved in Regulation of Hypoxia-inducible Factor (HIF) by Oxygen |
| 0.5 | 6.9 | REACTOME HYALURONAN UPTAKE AND DEGRADATION | Genes involved in Hyaluronan uptake and degradation |
| 0.5 | 14.5 | REACTOME CASPASE MEDIATED CLEAVAGE OF CYTOSKELETAL PROTEINS | Genes involved in Caspase-mediated cleavage of cytoskeletal proteins |
| 0.5 | 11.9 | REACTOME PROSTACYCLIN SIGNALLING THROUGH PROSTACYCLIN RECEPTOR | Genes involved in Prostacyclin signalling through prostacyclin receptor |
| 0.5 | 17.0 | REACTOME GLYCOSPHINGOLIPID METABOLISM | Genes involved in Glycosphingolipid metabolism |
| 0.4 | 9.0 | REACTOME CHONDROITIN SULFATE BIOSYNTHESIS | Genes involved in Chondroitin sulfate biosynthesis |
| 0.4 | 19.5 | REACTOME MITOCHONDRIAL PROTEIN IMPORT | Genes involved in Mitochondrial Protein Import |
| 0.4 | 6.1 | REACTOME PURINE SALVAGE | Genes involved in Purine salvage |
| 0.4 | 5.9 | REACTOME IONOTROPIC ACTIVITY OF KAINATE RECEPTORS | Genes involved in Ionotropic activity of Kainate Receptors |
| 0.3 | 9.7 | REACTOME ADHERENS JUNCTIONS INTERACTIONS | Genes involved in Adherens junctions interactions |
| 0.3 | 7.8 | REACTOME SIGNALING BY BMP | Genes involved in Signaling by BMP |
| 0.3 | 8.3 | REACTOME ACYL CHAIN REMODELLING OF PE | Genes involved in Acyl chain remodelling of PE |
| 0.3 | 3.2 | REACTOME CTNNB1 PHOSPHORYLATION CASCADE | Genes involved in Beta-catenin phosphorylation cascade |
| 0.3 | 5.3 | REACTOME GAP JUNCTION ASSEMBLY | Genes involved in Gap junction assembly |
| 0.3 | 12.3 | REACTOME COLLAGEN FORMATION | Genes involved in Collagen formation |
| 0.3 | 7.3 | REACTOME PRE NOTCH TRANSCRIPTION AND TRANSLATION | Genes involved in Pre-NOTCH Transcription and Translation |
| 0.3 | 6.8 | REACTOME DCC MEDIATED ATTRACTIVE SIGNALING | Genes involved in DCC mediated attractive signaling |
| 0.2 | 25.3 | REACTOME POTASSIUM CHANNELS | Genes involved in Potassium Channels |
| 0.2 | 3.1 | REACTOME PYRIMIDINE CATABOLISM | Genes involved in Pyrimidine catabolism |
| 0.2 | 17.4 | REACTOME CLASS B 2 SECRETIN FAMILY RECEPTORS | Genes involved in Class B/2 (Secretin family receptors) |
| 0.2 | 6.4 | REACTOME INTERACTION BETWEEN L1 AND ANKYRINS | Genes involved in Interaction between L1 and Ankyrins |
| 0.2 | 7.3 | REACTOME SPHINGOLIPID DE NOVO BIOSYNTHESIS | Genes involved in Sphingolipid de novo biosynthesis |
| 0.2 | 4.1 | REACTOME NA CL DEPENDENT NEUROTRANSMITTER TRANSPORTERS | Genes involved in Na+/Cl- dependent neurotransmitter transporters |
| 0.1 | 10.9 | REACTOME INTEGRIN CELL SURFACE INTERACTIONS | Genes involved in Integrin cell surface interactions |
| 0.1 | 2.2 | REACTOME AKT PHOSPHORYLATES TARGETS IN THE CYTOSOL | Genes involved in AKT phosphorylates targets in the cytosol |
| 0.1 | 4.6 | REACTOME TRANSPORT OF VITAMINS NUCLEOSIDES AND RELATED MOLECULES | Genes involved in Transport of vitamins, nucleosides, and related molecules |
| 0.1 | 0.7 | REACTOME RETROGRADE NEUROTROPHIN SIGNALLING | Genes involved in Retrograde neurotrophin signalling |
| 0.1 | 9.5 | REACTOME TRANSPORT OF INORGANIC CATIONS ANIONS AND AMINO ACIDS OLIGOPEPTIDES | Genes involved in Transport of inorganic cations/anions and amino acids/oligopeptides |
| 0.1 | 12.3 | REACTOME TRANSMISSION ACROSS CHEMICAL SYNAPSES | Genes involved in Transmission across Chemical Synapses |
| 0.1 | 0.5 | REACTOME CTLA4 INHIBITORY SIGNALING | Genes involved in CTLA4 inhibitory signaling |
| 0.1 | 1.5 | REACTOME APOPTOTIC CLEAVAGE OF CELLULAR PROTEINS | Genes involved in Apoptotic cleavage of cellular proteins |
| 0.1 | 0.8 | REACTOME SYNTHESIS SECRETION AND INACTIVATION OF GLP1 | Genes involved in Synthesis, Secretion, and Inactivation of Glucagon-like Peptide-1 (GLP-1) |
| 0.0 | 7.0 | REACTOME SIGNALING BY RHO GTPASES | Genes involved in Signaling by Rho GTPases |
| 0.0 | 3.1 | REACTOME LOSS OF NLP FROM MITOTIC CENTROSOMES | Genes involved in Loss of Nlp from mitotic centrosomes |