Project
GSE53960: rat RNA-Seq transcriptomic Bodymap
Navigation
Downloads
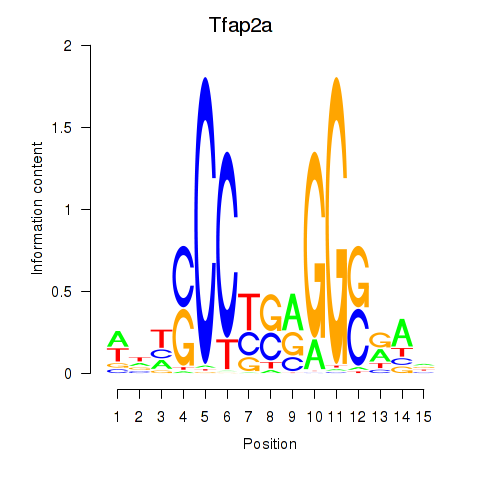
Results for Tfap2a
Z-value: 0.98
Motif logo
Transcription factors associated with Tfap2a
| Gene Symbol | Gene ID | Gene Info |
|---|---|---|
|
Tfap2a
|
ENSRNOG00000015522 | transcription factor AP-2 alpha |
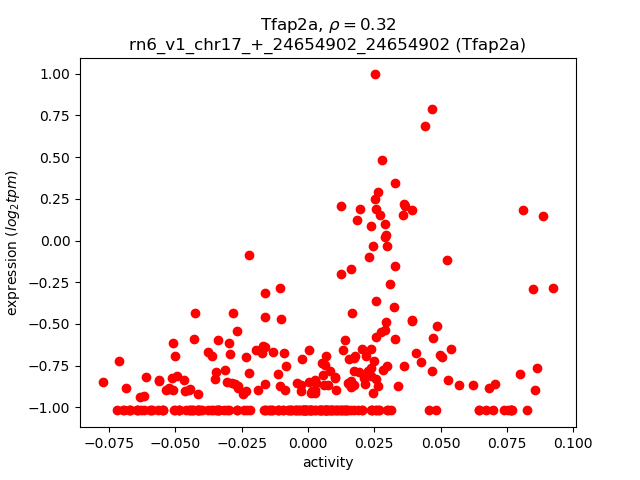
Activity-expression correlation:
| Gene | Promoter | Pearson corr. coef. | P-value | Plot |
|---|---|---|---|---|
| Tfap2a | rn6_v1_chr17_+_24654902_24654902 | 0.32 | 3.0e-09 | Click! |
Activity profile of Tfap2a motif
Sorted Z-values of Tfap2a motif
| Promoter | Log-likelihood | Transcript | Gene | Gene Info |
|---|---|---|---|---|
| chr14_-_60276794 | 21.12 |
ENSRNOT00000048509
|
Slc34a2
|
solute carrier family 34 member 2 |
| chr17_+_22619891 | 20.92 |
ENSRNOT00000060403
|
Adtrp
|
androgen-dependent TFPI-regulating protein |
| chr2_+_60920257 | 18.84 |
ENSRNOT00000025170
|
C1qtnf3
|
C1q and tumor necrosis factor related protein 3 |
| chr2_-_195935878 | 18.62 |
ENSRNOT00000028440
|
Cgn
|
cingulin |
| chr1_-_84145916 | 18.45 |
ENSRNOT00000081796
|
Ltbp4
|
latent transforming growth factor beta binding protein 4 |
| chr1_-_80716143 | 18.19 |
ENSRNOT00000092048
ENSRNOT00000025829 |
Cblc
|
Cbl proto-oncogene C |
| chr10_-_88060561 | 17.65 |
ENSRNOT00000019133
|
Krt19
|
keratin 19 |
| chr10_+_104368247 | 15.51 |
ENSRNOT00000006519
|
Llgl2
|
LLGL2, scribble cell polarity complex component |
| chr4_+_120133713 | 15.23 |
ENSRNOT00000017240
|
Gata2
|
GATA binding protein 2 |
| chr4_+_72718458 | 14.68 |
ENSRNOT00000044780
|
Arhgef5
|
Rho guanine nucleotide exchange factor 5 |
| chr13_-_80745347 | 13.92 |
ENSRNOT00000041908
|
Fmo1
|
flavin containing monooxygenase 1 |
| chr8_-_72836159 | 13.88 |
ENSRNOT00000024617
|
Tpm1
|
tropomyosin 1, alpha |
| chr4_+_168832910 | 12.82 |
ENSRNOT00000011134
|
Gprc5a
|
G protein-coupled receptor, class C, group 5, member A |
| chr5_+_152559577 | 12.44 |
ENSRNOT00000082245
|
Slc30a2
|
solute carrier family 30 member 2 |
| chr15_-_48670257 | 12.36 |
ENSRNOT00000071464
|
Fzd3
|
frizzled class receptor 3 |
| chr11_-_57993548 | 12.27 |
ENSRNOT00000002957
|
Nectin3
|
nectin cell adhesion molecule 3 |
| chr5_-_169331163 | 12.20 |
ENSRNOT00000042301
|
Espn
|
espin |
| chr11_+_46009322 | 12.09 |
ENSRNOT00000002233
|
Tmem45a
|
transmembrane protein 45A |
| chr7_-_49250953 | 11.71 |
ENSRNOT00000066975
ENSRNOT00000082141 |
Acss3
|
acyl-CoA synthetase short-chain family member 3 |
| chr14_-_2032593 | 11.67 |
ENSRNOT00000000037
|
Fgfrl1
|
fibroblast growth factor receptor-like 1 |
| chr1_-_199377035 | 11.51 |
ENSRNOT00000026572
|
Prss8
|
protease, serine, 8 |
| chr10_-_105668593 | 11.46 |
ENSRNOT00000016622
|
St6galnac2
|
ST6 N-acetylgalactosaminide alpha-2,6-sialyltransferase 2 |
| chr3_-_55822551 | 11.38 |
ENSRNOT00000082624
|
Lrp2
|
LDL receptor related protein 2 |
| chr9_+_88357556 | 11.13 |
ENSRNOT00000020669
|
Col4a3
|
collagen type IV alpha 3 chain |
| chr2_+_242882306 | 11.04 |
ENSRNOT00000013661
|
Ddit4l
|
DNA-damage-inducible transcript 4-like |
| chr1_+_219233750 | 10.92 |
ENSRNOT00000024112
|
Acy3
|
aminoacylase 3 |
| chr7_-_117679219 | 10.91 |
ENSRNOT00000071522
|
Slc39a4
|
solute carrier family 39 member 4 |
| chr1_+_178636544 | 10.85 |
ENSRNOT00000092099
|
Spon1
|
spondin 1 |
| chr2_+_188543137 | 10.82 |
ENSRNOT00000027850
|
Muc1
|
mucin 1, cell surface associated |
| chr13_-_80775230 | 10.77 |
ENSRNOT00000091389
ENSRNOT00000004762 |
Fmo2
|
flavin containing monooxygenase 2 |
| chr2_+_242634399 | 10.76 |
ENSRNOT00000035700
|
Emcn
|
endomucin |
| chr1_-_72461547 | 10.45 |
ENSRNOT00000022480
|
Ssc5d
|
scavenger receptor cysteine rich family member with 5 domains |
| chr9_+_98073038 | 10.32 |
ENSRNOT00000026795
|
Mlph
|
melanophilin |
| chr20_+_41266566 | 10.18 |
ENSRNOT00000000653
|
Frk
|
fyn-related Src family tyrosine kinase |
| chr2_+_199162745 | 10.15 |
ENSRNOT00000023488
|
Gja5
|
gap junction protein, alpha 5 |
| chr8_+_54925607 | 10.04 |
ENSRNOT00000059210
|
Plet1
|
placenta expressed transcript 1 |
| chr11_-_38088753 | 9.83 |
ENSRNOT00000002713
|
Tmprss2
|
transmembrane protease, serine 2 |
| chr3_+_109862117 | 9.69 |
ENSRNOT00000083351
ENSRNOT00000070912 |
Thbs1
|
thrombospondin 1 |
| chr19_-_25134055 | 9.50 |
ENSRNOT00000007519
|
Misp3
|
MISP family member 3 |
| chr6_-_147172022 | 9.31 |
ENSRNOT00000080675
|
Itgb8
|
integrin subunit beta 8 |
| chr5_+_58855773 | 9.21 |
ENSRNOT00000072869
|
Rusc2
|
RUN and SH3 domain containing 2 |
| chr1_+_78933372 | 9.18 |
ENSRNOT00000029810
|
Ccdc8
|
coiled-coil domain containing 8 |
| chr4_+_175431904 | 9.13 |
ENSRNOT00000032843
|
Pde3a
|
phosphodiesterase 3A |
| chr5_+_159967839 | 8.88 |
ENSRNOT00000051317
|
Hspb7
|
heat shock protein family B (small) member 7 |
| chr5_+_2813131 | 8.87 |
ENSRNOT00000009530
|
Sbspon
|
somatomedin B and thrombospondin, type 1 domain containing |
| chr8_-_40078165 | 8.77 |
ENSRNOT00000014866
|
Spa17
|
sperm autoantigenic protein 17 |
| chr14_+_86922223 | 8.68 |
ENSRNOT00000086468
|
Ramp3
|
receptor activity modifying protein 3 |
| chr9_+_119353840 | 8.67 |
ENSRNOT00000085362
|
Myom1
|
myomesin 1 |
| chr14_+_86101277 | 8.62 |
ENSRNOT00000018846
|
Aebp1
|
AE binding protein 1 |
| chr7_+_141249044 | 8.58 |
ENSRNOT00000084911
|
Aqp5
|
aquaporin 5 |
| chr19_+_52647070 | 8.57 |
ENSRNOT00000068389
ENSRNOT00000087857 |
Crispld2
|
cysteine-rich secretory protein LCCL domain containing 2 |
| chr1_+_264504591 | 8.41 |
ENSRNOT00000050076
|
Pax2
|
paired box 2 |
| chr6_+_105364668 | 8.29 |
ENSRNOT00000009513
ENSRNOT00000087090 |
Ttc9
|
tetratricopeptide repeat domain 9 |
| chr2_+_114423533 | 7.87 |
ENSRNOT00000091221
|
Slc2a2
|
solute carrier family 2 member 2 |
| chr9_+_99998275 | 7.74 |
ENSRNOT00000074395
|
Gpc1
|
glypican 1 |
| chr8_-_50531423 | 7.67 |
ENSRNOT00000090985
ENSRNOT00000074942 |
Apoc3
|
apolipoprotein C3 |
| chr1_+_166433109 | 7.67 |
ENSRNOT00000026428
|
Stard10
|
StAR-related lipid transfer domain containing 10 |
| chr9_+_111028824 | 7.58 |
ENSRNOT00000041418
ENSRNOT00000056457 |
Pam
|
peptidylglycine alpha-amidating monooxygenase |
| chr2_-_142885604 | 7.56 |
ENSRNOT00000031487
|
Frem2
|
Fras1 related extracellular matrix protein 2 |
| chr1_-_189960073 | 7.54 |
ENSRNOT00000088482
|
Crym
|
crystallin, mu |
| chr9_+_68414339 | 7.52 |
ENSRNOT00000040778
|
Pard3b
|
par-3 family cell polarity regulator beta |
| chr18_+_53609214 | 7.48 |
ENSRNOT00000077443
|
Slc27a6
|
solute carrier family 27 member 6 |
| chr8_-_47404010 | 7.39 |
ENSRNOT00000038647
|
Tmem136
|
transmembrane protein 136 |
| chr17_+_11953552 | 7.29 |
ENSRNOT00000090782
|
Ror2
|
receptor tyrosine kinase-like orphan receptor 2 |
| chr8_+_22189600 | 7.23 |
ENSRNOT00000061100
|
Pde4a
|
phosphodiesterase 4A |
| chr10_-_39228090 | 7.21 |
ENSRNOT00000011340
ENSRNOT00000086644 |
LOC303140
|
up-regulator of carnitine transporter, OCTN2 |
| chr7_+_126619196 | 7.17 |
ENSRNOT00000030082
|
Ppara
|
peroxisome proliferator activated receptor alpha |
| chr5_-_168123030 | 7.10 |
ENSRNOT00000092747
|
Per3
|
period circadian clock 3 |
| chr18_-_40716686 | 7.08 |
ENSRNOT00000000172
|
Cdo1
|
cysteine dioxygenase type 1 |
| chrX_+_72684329 | 6.93 |
ENSRNOT00000057644
|
Dmrtc1c1
|
DMRT-like family C1c1 |
| chr13_+_80125391 | 6.90 |
ENSRNOT00000044190
|
Mir199a2
|
microRNA 199a-2 |
| chr1_+_134699299 | 6.88 |
ENSRNOT00000068766
|
Rgma
|
repulsive guidance molecule family member A |
| chr16_-_18757918 | 6.86 |
ENSRNOT00000084172
|
Sftpd
|
surfactant protein D |
| chr11_+_75434197 | 6.85 |
ENSRNOT00000032569
|
Mb21d2
|
Mab-21 domain containing 2 |
| chr6_+_2969333 | 6.84 |
ENSRNOT00000047356
|
Morn2
|
MORN repeat containing 2 |
| chr4_+_100166863 | 6.83 |
ENSRNOT00000014505
|
Sftpb
|
surfactant protein B |
| chr13_+_75175254 | 6.81 |
ENSRNOT00000044008
|
Sec16b
|
SEC16 homolog B, endoplasmic reticulum export factor |
| chr13_-_72890841 | 6.81 |
ENSRNOT00000093726
|
RGD1304622
|
similar to 6820428L09 protein |
| chr15_-_88036354 | 6.80 |
ENSRNOT00000014747
|
Ednrb
|
endothelin receptor type B |
| chr1_+_245237736 | 6.76 |
ENSRNOT00000035814
|
Vldlr
|
very low density lipoprotein receptor |
| chr2_-_21437193 | 6.75 |
ENSRNOT00000084002
|
Ckmt2
|
creatine kinase, mitochondrial 2 |
| chrX_-_37705263 | 6.74 |
ENSRNOT00000043666
|
Map3k15
|
mitogen-activated protein kinase kinase kinase 15 |
| chr7_-_120026755 | 6.70 |
ENSRNOT00000077677
|
Card10
|
caspase recruitment domain family, member 10 |
| chr1_-_216920625 | 6.69 |
ENSRNOT00000028119
|
Osbpl5
|
oxysterol binding protein-like 5 |
| chr1_-_72632185 | 6.66 |
ENSRNOT00000066383
|
Tmem190
|
transmembrane protein 190 |
| chr3_+_119015412 | 6.64 |
ENSRNOT00000013605
|
Slc27a2
|
solute carrier family 27 member 2 |
| chr16_+_19097391 | 6.61 |
ENSRNOT00000018018
|
Calr3
|
calreticulin 3 |
| chr1_+_80321585 | 6.59 |
ENSRNOT00000022895
|
Ckm
|
creatine kinase, M-type |
| chr4_-_45332420 | 6.58 |
ENSRNOT00000083039
|
Wnt2
|
wingless-type MMTV integration site family member 2 |
| chr6_-_65319527 | 6.58 |
ENSRNOT00000005618
|
Stxbp6
|
syntaxin binding protein 6 |
| chr9_-_115382445 | 6.56 |
ENSRNOT00000091316
|
Ptprm
|
protein tyrosine phosphatase, receptor type, M |
| chr7_-_120027026 | 6.54 |
ENSRNOT00000011215
|
Card10
|
caspase recruitment domain family, member 10 |
| chr4_+_121612332 | 6.54 |
ENSRNOT00000077374
ENSRNOT00000084494 |
Txnrd3
|
thioredoxin reductase 3 |
| chr6_-_127127413 | 6.53 |
ENSRNOT00000011906
|
Prima1
|
proline rich membrane anchor 1 |
| chr11_+_34557679 | 6.53 |
ENSRNOT00000002289
|
Ripply3
|
ripply transcriptional repressor 3 |
| chr3_-_156905892 | 6.51 |
ENSRNOT00000022424
|
Emilin3
|
elastin microfibril interfacer 3 |
| chr3_-_120106697 | 6.48 |
ENSRNOT00000020354
|
Prom2
|
prominin 2 |
| chr5_-_77248563 | 6.44 |
ENSRNOT00000052243
|
LOC259245
|
alpha-2u globulin PGCL5 |
| chr3_-_11417546 | 6.43 |
ENSRNOT00000018776
|
Lcn2
|
lipocalin 2 |
| chr1_+_101704746 | 6.42 |
ENSRNOT00000028564
|
Fam83e
|
family with sequence similarity 83, member E |
| chr1_-_164307084 | 6.40 |
ENSRNOT00000086091
|
Serpinh1
|
serpin family H member 1 |
| chrX_+_152999016 | 6.38 |
ENSRNOT00000088234
|
Zfp185
|
zinc finger protein 185 |
| chr17_-_56909992 | 6.31 |
ENSRNOT00000021801
|
Bambi
|
BMP and activin membrane-bound inhibitor |
| chr6_-_25616995 | 6.29 |
ENSRNOT00000077894
|
Fosl2
|
FOS like 2, AP-1 transcription factor subunit |
| chr10_+_89578212 | 6.28 |
ENSRNOT00000028178
|
Arl4d
|
ADP-ribosylation factor like GTPase 4D |
| chr8_+_59278262 | 6.26 |
ENSRNOT00000017053
|
Dnaja4
|
DnaJ heat shock protein family (Hsp40) member A4 |
| chr10_+_59743544 | 6.21 |
ENSRNOT00000093497
ENSRNOT00000056460 |
Tax1bp3
|
Tax1 binding protein 3 |
| chrX_+_152196129 | 6.16 |
ENSRNOT00000087679
|
Magea4
|
melanoma antigen, family A, 4 |
| chr10_+_65448950 | 6.13 |
ENSRNOT00000082348
ENSRNOT00000037016 |
Rab34
|
RAB34, member RAS oncogene family |
| chr1_+_81456984 | 6.05 |
ENSRNOT00000027075
|
Ethe1
|
ETHE1, persulfide dioxygenase |
| chr3_+_143172686 | 6.00 |
ENSRNOT00000006869
|
Cst9l
|
cystatin 9-like |
| chr5_-_168123395 | 5.94 |
ENSRNOT00000024932
|
Per3
|
period circadian clock 3 |
| chr2_-_188672226 | 5.93 |
ENSRNOT00000027970
ENSRNOT00000050868 |
Adam15
|
ADAM metallopeptidase domain 15 |
| chr1_-_7480825 | 5.92 |
ENSRNOT00000048754
|
Phactr2
|
phosphatase and actin regulator 2 |
| chr1_-_90520012 | 5.89 |
ENSRNOT00000028698
|
Kctd15
|
potassium channel tetramerization domain containing 15 |
| chr10_-_98018014 | 5.88 |
ENSRNOT00000005367
|
Fam20a
|
FAM20A, golgi associated secretory pathway pseudokinase |
| chr6_+_122920317 | 5.88 |
ENSRNOT00000068595
ENSRNOT00000082856 |
Ttc8
|
tetratricopeptide repeat domain 8 |
| chr13_-_86671515 | 5.85 |
ENSRNOT00000082869
|
AABR07021704.1
|
|
| chr10_-_91186054 | 5.84 |
ENSRNOT00000004140
|
Plcd3
|
phospholipase C, delta 3 |
| chr1_+_236031988 | 5.79 |
ENSRNOT00000016164
|
Pcsk5
|
proprotein convertase subtilisin/kexin type 5 |
| chr6_+_26797126 | 5.78 |
ENSRNOT00000010586
|
Cgref1
|
cell growth regulator with EF hand domain 1 |
| chrX_+_15035569 | 5.70 |
ENSRNOT00000006491
ENSRNOT00000078392 |
Porcn
|
porcupine homolog (Drosophila) |
| chr10_+_49231730 | 5.68 |
ENSRNOT00000065335
|
Trim16
|
tripartite motif-containing 16 |
| chr1_+_220446425 | 5.63 |
ENSRNOT00000027339
|
LOC100911932
|
endosialin-like |
| chr20_+_28078500 | 5.61 |
ENSRNOT00000030005
|
Ccdc138
|
coiled-coil domain containing 138 |
| chr3_-_160891190 | 5.55 |
ENSRNOT00000019386
|
Sdc4
|
syndecan 4 |
| chr12_+_40553741 | 5.51 |
ENSRNOT00000057396
|
LOC100360238
|
rCG21419-like |
| chr18_-_11858744 | 5.49 |
ENSRNOT00000061417
ENSRNOT00000082891 |
Dsc2
|
desmocollin 2 |
| chr19_+_23389375 | 5.49 |
ENSRNOT00000018629
|
Sall1
|
spalt-like transcription factor 1 |
| chr1_-_90520344 | 5.48 |
ENSRNOT00000078598
|
Kctd15
|
potassium channel tetramerization domain containing 15 |
| chr6_-_108596446 | 5.47 |
ENSRNOT00000031331
ENSRNOT00000077458 ENSRNOT00000082792 |
Ltbp2
|
latent transforming growth factor beta binding protein 2 |
| chr18_+_47740328 | 5.46 |
ENSRNOT00000025119
|
Sncaip
|
synuclein, alpha interacting protein |
| chr7_+_27174882 | 5.42 |
ENSRNOT00000051181
|
Glt8d2
|
glycosyltransferase 8 domain containing 2 |
| chr19_-_11302938 | 5.40 |
ENSRNOT00000038212
|
AC128848.1
|
|
| chr4_-_120467932 | 5.40 |
ENSRNOT00000018454
|
Sec61a1
|
Sec61 translocon alpha 1 subunit |
| chr1_+_220353356 | 5.39 |
ENSRNOT00000080189
|
Cd248
|
CD248 molecule |
| chr2_+_251863069 | 5.37 |
ENSRNOT00000036282
|
Syde2
|
synapse defective Rho GTPase homolog 2 |
| chr1_-_198794947 | 5.36 |
ENSRNOT00000024639
|
Znf768
|
zinc finger protein 768 |
| chr6_+_26399950 | 5.32 |
ENSRNOT00000085424
|
Ift172
|
intraflagellar transport 172 |
| chr19_+_50246402 | 5.29 |
ENSRNOT00000018795
|
Hsd17b2
|
hydroxysteroid (17-beta) dehydrogenase 2 |
| chr8_-_22625959 | 5.26 |
ENSRNOT00000012138
|
Yipf2
|
Yip1 domain family, member 2 |
| chr18_+_56364620 | 5.24 |
ENSRNOT00000068535
ENSRNOT00000086033 |
Pdgfrb
|
platelet derived growth factor receptor beta |
| chr1_+_82419947 | 5.20 |
ENSRNOT00000027964
|
B3gnt8
|
UDP-GlcNAc:betaGal beta-1,3-N-acetylglucosaminyltransferase 8 |
| chr13_+_75059927 | 5.17 |
ENSRNOT00000080801
|
LOC680254
|
hypothetical protein LOC680254 |
| chr7_+_144052061 | 5.14 |
ENSRNOT00000020103
ENSRNOT00000091378 |
Amhr2
|
anti-Mullerian hormone receptor type 2 |
| chr4_+_130172727 | 5.12 |
ENSRNOT00000051121
|
Mitf
|
melanogenesis associated transcription factor |
| chr16_-_19097329 | 5.12 |
ENSRNOT00000030617
|
RGD1311847
|
similar to 1700030K09Rik protein |
| chr1_+_266530477 | 5.10 |
ENSRNOT00000054699
|
Cnnm2
|
cyclin and CBS domain divalent metal cation transport mediator 2 |
| chr7_-_63578490 | 5.09 |
ENSRNOT00000007295
|
Rassf3
|
Ras association domain family member 3 |
| chr11_+_70967439 | 5.05 |
ENSRNOT00000032518
|
Iqcg
|
IQ motif containing G |
| chr3_-_94686989 | 5.04 |
ENSRNOT00000016677
|
Depdc7
|
DEP domain containing 7 |
| chr5_-_172769421 | 5.03 |
ENSRNOT00000021285
|
Prkcz
|
protein kinase C, zeta |
| chr8_-_108777717 | 5.03 |
ENSRNOT00000034188
|
Il20rb
|
interleukin 20 receptor subunit beta |
| chr8_-_63350269 | 5.01 |
ENSRNOT00000042681
|
Cd276
|
Cd276 molecule |
| chr6_+_43234526 | 5.01 |
ENSRNOT00000086808
|
Asap2
|
ArfGAP with SH3 domain, ankyrin repeat and PH domain 2 |
| chr19_-_58399816 | 5.00 |
ENSRNOT00000026843
|
Sipa1l2
|
signal-induced proliferation-associated 1 like 2 |
| chr11_-_61748768 | 4.95 |
ENSRNOT00000078879
|
Ccdc191
|
coiled-coil domain containing 191 |
| chr7_+_12619774 | 4.94 |
ENSRNOT00000015257
|
Med16
|
mediator complex subunit 16 |
| chr10_-_105771972 | 4.94 |
ENSRNOT00000074286
ENSRNOT00000066137 |
Mxra7
|
matrix remodeling associated 7 |
| chr4_-_179700130 | 4.94 |
ENSRNOT00000021306
|
Lmntd1
|
lamin tail domain containing 1 |
| chr5_-_77492013 | 4.93 |
ENSRNOT00000012293
|
LOC259245
|
alpha-2u globulin PGCL5 |
| chr7_-_51353068 | 4.90 |
ENSRNOT00000008222
|
Pawr
|
pro-apoptotic WT1 regulator |
| chr1_+_128924966 | 4.89 |
ENSRNOT00000019267
|
Igf1r
|
insulin-like growth factor 1 receptor |
| chr11_-_61748583 | 4.86 |
ENSRNOT00000093431
|
Ccdc191
|
coiled-coil domain containing 191 |
| chr6_+_127766470 | 4.82 |
ENSRNOT00000013138
|
Serpina5
|
serpin family A member 5 |
| chr15_+_23665202 | 4.80 |
ENSRNOT00000089226
|
Samd4a
|
sterile alpha motif domain containing 4A |
| chr13_-_81214494 | 4.77 |
ENSRNOT00000004950
ENSRNOT00000082385 |
Prrx1
|
paired related homeobox 1 |
| chr10_+_36099263 | 4.75 |
ENSRNOT00000083568
|
Adamts2
|
ADAM metallopeptidase with thrombospondin type 1 motif, 2 |
| chr3_+_95233874 | 4.74 |
ENSRNOT00000079743
|
LOC691083
|
hypothetical protein LOC691083 |
| chr4_+_42202838 | 4.68 |
ENSRNOT00000082453
|
Mdfic
|
MyoD family inhibitor domain containing |
| chr2_-_186480278 | 4.68 |
ENSRNOT00000031743
|
Kirrel
|
kin of IRRE like (Drosophila) |
| chr6_-_7961207 | 4.67 |
ENSRNOT00000007174
|
Abcg5
|
ATP binding cassette subfamily G member 5 |
| chr4_+_44597123 | 4.63 |
ENSRNOT00000078250
|
Cav1
|
caveolin 1 |
| chr8_-_65587658 | 4.61 |
ENSRNOT00000091982
|
Lrrc49
|
leucine rich repeat containing 49 |
| chr1_+_15642153 | 4.59 |
ENSRNOT00000079845
|
Map7
|
microtubule-associated protein 7 |
| chr8_+_116332796 | 4.57 |
ENSRNOT00000021408
|
Hyal1
|
hyaluronoglucosaminidase 1 |
| chr10_-_47857326 | 4.57 |
ENSRNOT00000085703
ENSRNOT00000091963 |
Epn2
|
epsin 2 |
| chr10_+_63662986 | 4.56 |
ENSRNOT00000088722
|
Scarf1
|
scavenger receptor class F, member 1 |
| chr9_+_111649631 | 4.56 |
ENSRNOT00000056430
|
Fer
|
FER tyrosine kinase |
| chr19_+_26173771 | 4.55 |
ENSRNOT00000005581
|
Fbxw9
|
F-box and WD repeat domain containing 9 |
| chr6_+_137288810 | 4.52 |
ENSRNOT00000030246
|
Cep170b
|
centrosomal protein 170B |
| chr10_-_56403188 | 4.48 |
ENSRNOT00000019947
|
Chrnb1
|
cholinergic receptor nicotinic beta 1 subunit |
| chr12_+_19599834 | 4.47 |
ENSRNOT00000092039
ENSRNOT00000042006 |
Stag3
|
stromal antigen 3 |
| chr5_-_77342299 | 4.44 |
ENSRNOT00000075994
|
RGD1566134
|
similar to alpha-2u-globulin |
| chr8_+_28352772 | 4.42 |
ENSRNOT00000012391
|
Igsf9b
|
immunoglobulin superfamily, member 9B |
| chr6_-_99870024 | 4.41 |
ENSRNOT00000010043
|
Rab15
|
RAB15, member RAS oncogene family |
| chr10_+_55138633 | 4.35 |
ENSRNOT00000057223
|
Mfsd6l
|
major facilitator superfamily domain containing 6-like |
| chr1_-_222178725 | 4.35 |
ENSRNOT00000028697
|
Esrra
|
estrogen related receptor, alpha |
| chr1_+_65576535 | 4.31 |
ENSRNOT00000026575
|
Slc27a5
|
solute carrier family 27 member 5 |
| chr18_-_31071371 | 4.29 |
ENSRNOT00000060432
|
Diaph1
|
diaphanous-related formin 1 |
| chr1_-_143535583 | 4.29 |
ENSRNOT00000087785
|
Homer2
|
homer scaffolding protein 2 |
| chr1_+_83711251 | 4.25 |
ENSRNOT00000028237
ENSRNOT00000092008 |
Cyp2a1
|
cytochrome P450, family 2, subfamily a, polypeptide 1 |
| chr2_+_188844073 | 4.24 |
ENSRNOT00000028117
|
Kcnn3
|
potassium calcium-activated channel subfamily N member 3 |
| chr13_-_75059326 | 4.20 |
ENSRNOT00000089062
|
Rasal2
|
RAS protein activator like 2 |
| chr14_-_8432195 | 4.18 |
ENSRNOT00000089800
|
Arhgap24
|
Rho GTPase activating protein 24 |
| chr7_-_3342491 | 4.17 |
ENSRNOT00000081756
|
Rdh5
|
retinol dehydrogenase 5 |
| chr2_+_203200427 | 4.13 |
ENSRNOT00000020566
|
Vtcn1
|
V-set domain containing T cell activation inhibitor 1 |
| chr5_-_137372993 | 4.11 |
ENSRNOT00000092823
|
Tmem125
|
transmembrane protein 125 |
| chr9_-_15582556 | 4.10 |
ENSRNOT00000020516
|
RGD1561662
|
similar to AI661453 protein |
| chr5_-_77433847 | 4.07 |
ENSRNOT00000076906
ENSRNOT00000043056 |
LOC500473
Mup4
|
similar to alpha-2u globulin PGCL2 major urinary protein 4 |
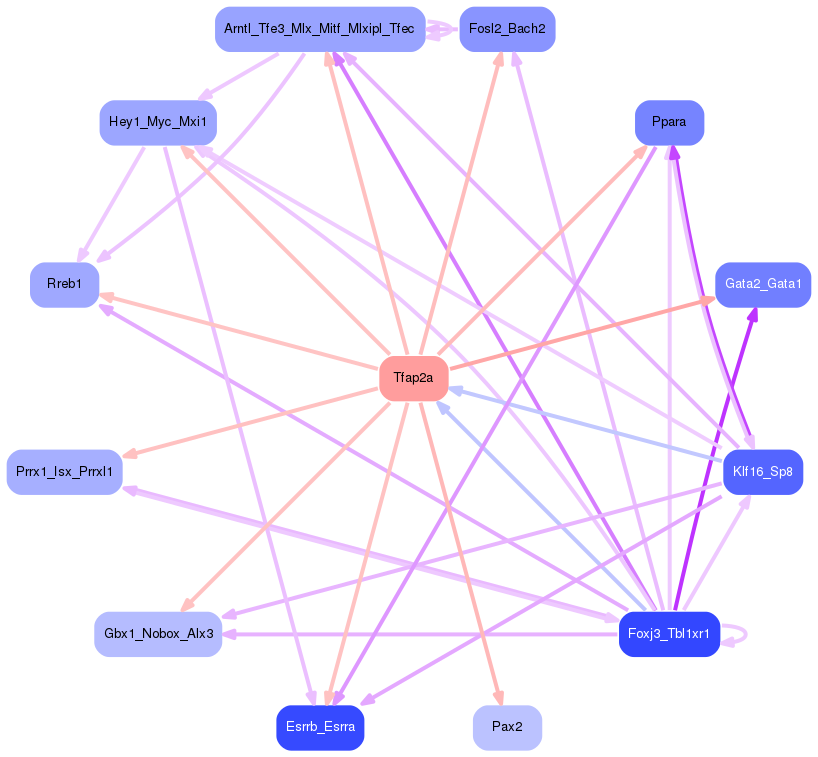
Network of associatons between targets according to the STRING database.

First level regulatory network of Tfap2a
Gene Ontology Analysis
Gene overrepresentation in biological process category:
| Log-likelihood per target | Total log-likelihood | Term | Description |
|---|---|---|---|
| 5.1 | 15.2 | GO:0010725 | regulation of primitive erythrocyte differentiation(GO:0010725) |
| 4.6 | 13.9 | GO:0003065 | positive regulation of heart rate by epinephrine(GO:0003065) |
| 3.9 | 15.5 | GO:0016332 | establishment or maintenance of polarity of embryonic epithelium(GO:0016332) |
| 3.6 | 10.9 | GO:0034224 | cellular response to zinc ion starvation(GO:0034224) |
| 3.4 | 10.2 | GO:0010643 | cell communication by chemical coupling(GO:0010643) |
| 3.2 | 9.7 | GO:0002581 | negative regulation of antigen processing and presentation of peptide or polysaccharide antigen via MHC class II(GO:0002581) regulation of cGMP-mediated signaling(GO:0010752) |
| 3.0 | 21.1 | GO:0044341 | sodium-dependent phosphate transport(GO:0044341) |
| 2.9 | 14.7 | GO:0002408 | myeloid dendritic cell chemotaxis(GO:0002408) |
| 2.8 | 31.0 | GO:0007175 | negative regulation of epidermal growth factor-activated receptor activity(GO:0007175) |
| 2.8 | 8.4 | GO:0035566 | regulation of metanephros size(GO:0035566) |
| 2.7 | 13.7 | GO:0050828 | regulation of liquid surface tension(GO:0050828) |
| 2.7 | 18.9 | GO:0033278 | cell proliferation in midbrain(GO:0033278) |
| 2.7 | 10.8 | GO:0072592 | oxygen metabolic process(GO:0072592) |
| 2.7 | 18.8 | GO:0071638 | negative regulation of monocyte chemotactic protein-1 production(GO:0071638) |
| 2.6 | 10.5 | GO:0042494 | detection of bacterial lipoprotein(GO:0042494) |
| 2.6 | 7.7 | GO:0030200 | heparan sulfate proteoglycan catabolic process(GO:0030200) |
| 2.6 | 10.3 | GO:0014826 | vein smooth muscle contraction(GO:0014826) |
| 2.6 | 7.7 | GO:0010982 | negative regulation of very-low-density lipoprotein particle remodeling(GO:0010903) regulation of high-density lipoprotein particle clearance(GO:0010982) |
| 2.4 | 2.4 | GO:0071579 | regulation of zinc ion transport(GO:0071579) |
| 2.4 | 7.1 | GO:0042412 | taurine biosynthetic process(GO:0042412) |
| 2.2 | 11.1 | GO:0048550 | negative regulation of pinocytosis(GO:0048550) |
| 2.2 | 6.6 | GO:0097089 | methyl-branched fatty acid metabolic process(GO:0097089) |
| 2.1 | 6.4 | GO:0015891 | iron chelate transport(GO:0015688) siderophore transport(GO:0015891) |
| 2.0 | 9.9 | GO:0009758 | carbohydrate utilization(GO:0009758) |
| 2.0 | 5.9 | GO:0048560 | establishment of anatomical structure orientation(GO:0048560) |
| 1.9 | 3.9 | GO:0007172 | signal complex assembly(GO:0007172) |
| 1.9 | 7.6 | GO:0031179 | peptide modification(GO:0031179) |
| 1.8 | 5.5 | GO:2000384 | regulation of ectoderm development(GO:2000383) negative regulation of ectoderm development(GO:2000384) |
| 1.8 | 9.1 | GO:0060282 | positive regulation of oocyte development(GO:0060282) |
| 1.8 | 7.3 | GO:0030538 | embryonic genitalia morphogenesis(GO:0030538) |
| 1.8 | 7.2 | GO:0072369 | regulation of lipid transport by positive regulation of transcription from RNA polymerase II promoter(GO:0072369) |
| 1.7 | 12.2 | GO:0030046 | parallel actin filament bundle assembly(GO:0030046) |
| 1.7 | 6.8 | GO:0034436 | glycoprotein transport(GO:0034436) |
| 1.7 | 5.0 | GO:0001807 | regulation of type IV hypersensitivity(GO:0001807) |
| 1.7 | 5.0 | GO:0045077 | negative regulation of interferon-gamma biosynthetic process(GO:0045077) |
| 1.6 | 4.9 | GO:0043133 | hindgut contraction(GO:0043133) regulation of hindgut contraction(GO:0043134) positive regulation of neuronal action potential(GO:1904457) |
| 1.6 | 4.9 | GO:1904193 | cholangiocyte apoptotic process(GO:1902488) regulation of cholangiocyte apoptotic process(GO:1904192) negative regulation of cholangiocyte apoptotic process(GO:1904193) |
| 1.6 | 3.2 | GO:1903691 | positive regulation of wound healing, spreading of epidermal cells(GO:1903691) |
| 1.5 | 13.9 | GO:0070995 | NADPH oxidation(GO:0070995) |
| 1.5 | 6.1 | GO:0070813 | hydrogen sulfide metabolic process(GO:0070813) |
| 1.5 | 1.5 | GO:0021775 | smoothened signaling pathway involved in ventral spinal cord interneuron specification(GO:0021775) smoothened signaling pathway involved in spinal cord motor neuron cell fate specification(GO:0021776) |
| 1.4 | 5.6 | GO:0035887 | aortic smooth muscle cell differentiation(GO:0035887) positive regulation of extracellular exosome assembly(GO:1903553) |
| 1.4 | 12.3 | GO:1902414 | protein localization to cell junction(GO:1902414) |
| 1.4 | 4.1 | GO:0061146 | Peyer's patch morphogenesis(GO:0061146) |
| 1.4 | 10.8 | GO:0090240 | negative regulation of cell adhesion mediated by integrin(GO:0033629) positive regulation of histone H4 acetylation(GO:0090240) |
| 1.3 | 4.0 | GO:0046946 | hydroxylysine metabolic process(GO:0046946) hydroxylysine biosynthetic process(GO:0046947) |
| 1.3 | 5.2 | GO:0072277 | cell migration involved in vasculogenesis(GO:0035441) VEGF-activated platelet-derived growth factor receptor signaling pathway(GO:0038086) positive regulation of cell proliferation by VEGF-activated platelet derived growth factor receptor signaling pathway(GO:0038091) metanephric glomerulus morphogenesis(GO:0072275) metanephric glomerulus vasculature morphogenesis(GO:0072276) metanephric glomerular capillary formation(GO:0072277) |
| 1.3 | 3.8 | GO:0046078 | dUMP metabolic process(GO:0046078) |
| 1.3 | 3.8 | GO:0072156 | distal tubule morphogenesis(GO:0072156) |
| 1.2 | 8.7 | GO:0002074 | extraocular skeletal muscle development(GO:0002074) |
| 1.2 | 8.6 | GO:0015670 | carbon dioxide transport(GO:0015670) |
| 1.2 | 3.6 | GO:0016107 | sesquiterpenoid catabolic process(GO:0016107) farnesol metabolic process(GO:0016487) farnesol catabolic process(GO:0016488) |
| 1.2 | 4.8 | GO:0061107 | seminal vesicle development(GO:0061107) |
| 1.2 | 3.6 | GO:2000820 | negative regulation of transcription from RNA polymerase II promoter involved in smooth muscle cell differentiation(GO:2000820) |
| 1.2 | 5.9 | GO:0044691 | tooth eruption(GO:0044691) |
| 1.2 | 2.4 | GO:0046379 | extracellular polysaccharide biosynthetic process(GO:0045226) extracellular polysaccharide metabolic process(GO:0046379) |
| 1.2 | 3.5 | GO:0002426 | immunoglobulin production in mucosal tissue(GO:0002426) |
| 1.1 | 4.6 | GO:0036118 | hyaluranon cable assembly(GO:0036118) regulation of hyaluranon cable assembly(GO:1900104) positive regulation of hyaluranon cable assembly(GO:1900106) |
| 1.1 | 4.6 | GO:0050904 | Kit signaling pathway(GO:0038109) diapedesis(GO:0050904) |
| 1.1 | 12.4 | GO:0032119 | sequestering of zinc ion(GO:0032119) regulation of sequestering of zinc ion(GO:0061088) |
| 1.1 | 3.4 | GO:0051695 | actin filament uncapping(GO:0051695) |
| 1.1 | 3.4 | GO:0008588 | release of cytoplasmic sequestered NF-kappaB(GO:0008588) |
| 1.1 | 8.9 | GO:0035360 | positive regulation of peroxisome proliferator activated receptor signaling pathway(GO:0035360) |
| 1.1 | 3.3 | GO:1901873 | regulation of post-translational protein modification(GO:1901873) |
| 1.1 | 4.4 | GO:1902606 | regulation of large conductance calcium-activated potassium channel activity(GO:1902606) positive regulation of large conductance calcium-activated potassium channel activity(GO:1902608) |
| 1.1 | 5.4 | GO:0039019 | pronephric nephron development(GO:0039019) |
| 1.1 | 4.3 | GO:0046951 | ketone body biosynthetic process(GO:0046951) |
| 1.1 | 11.7 | GO:0060539 | diaphragm development(GO:0060539) |
| 1.1 | 3.2 | GO:0006990 | positive regulation of transcription from RNA polymerase II promoter involved in unfolded protein response(GO:0006990) |
| 1.0 | 3.1 | GO:0090271 | positive regulation of fibroblast growth factor production(GO:0090271) |
| 1.0 | 5.2 | GO:0030309 | poly-N-acetyllactosamine metabolic process(GO:0030309) poly-N-acetyllactosamine biosynthetic process(GO:0030311) |
| 1.0 | 6.1 | GO:0044351 | macropinocytosis(GO:0044351) |
| 1.0 | 5.0 | GO:2000664 | positive regulation of T-helper 2 cell cytokine production(GO:2000553) positive regulation of interleukin-5 secretion(GO:2000664) positive regulation of interleukin-10 secretion(GO:2001181) |
| 1.0 | 3.0 | GO:0006114 | glycerol biosynthetic process(GO:0006114) |
| 1.0 | 6.9 | GO:0009804 | coumarin metabolic process(GO:0009804) |
| 1.0 | 5.8 | GO:0002001 | renin secretion into blood stream(GO:0002001) |
| 0.9 | 4.7 | GO:0030300 | regulation of intestinal cholesterol absorption(GO:0030300) |
| 0.9 | 5.7 | GO:0048386 | positive regulation of retinoic acid receptor signaling pathway(GO:0048386) |
| 0.9 | 11.1 | GO:0032836 | glomerular basement membrane development(GO:0032836) |
| 0.9 | 9.8 | GO:0046598 | positive regulation of viral entry into host cell(GO:0046598) |
| 0.9 | 5.1 | GO:0044336 | canonical Wnt signaling pathway involved in negative regulation of apoptotic process(GO:0044336) |
| 0.8 | 2.5 | GO:0021577 | hindbrain structural organization(GO:0021577) cerebellum structural organization(GO:0021589) response to methamphetamine hydrochloride(GO:1904313) |
| 0.8 | 2.4 | GO:0006083 | acetate metabolic process(GO:0006083) propionate metabolic process(GO:0019541) |
| 0.8 | 2.4 | GO:0006574 | valine catabolic process(GO:0006574) |
| 0.8 | 4.0 | GO:0033026 | negative regulation of mast cell apoptotic process(GO:0033026) mast cell proliferation(GO:0070662) regulation of mast cell proliferation(GO:0070666) positive regulation of mast cell proliferation(GO:0070668) |
| 0.8 | 6.4 | GO:0003433 | chondrocyte development involved in endochondral bone morphogenesis(GO:0003433) |
| 0.8 | 1.6 | GO:0002930 | trabecular meshwork development(GO:0002930) |
| 0.8 | 6.3 | GO:0001661 | conditioned taste aversion(GO:0001661) |
| 0.8 | 5.5 | GO:0086073 | bundle of His cell-Purkinje myocyte adhesion involved in cell communication(GO:0086073) |
| 0.8 | 9.4 | GO:0086103 | G-protein coupled receptor signaling pathway involved in heart process(GO:0086103) |
| 0.8 | 13.2 | GO:0007250 | activation of NF-kappaB-inducing kinase activity(GO:0007250) |
| 0.8 | 3.1 | GO:0033326 | cerebrospinal fluid secretion(GO:0033326) |
| 0.8 | 3.8 | GO:0070366 | regulation of hepatocyte differentiation(GO:0070366) |
| 0.8 | 2.3 | GO:2000661 | positive regulation of interleukin-1-mediated signaling pathway(GO:2000661) |
| 0.8 | 6.8 | GO:0048207 | vesicle targeting, rough ER to cis-Golgi(GO:0048207) COPII vesicle coating(GO:0048208) |
| 0.8 | 2.3 | GO:0060490 | orthogonal dichotomous subdivision of terminal units involved in lung branching morphogenesis(GO:0060488) planar dichotomous subdivision of terminal units involved in lung branching morphogenesis(GO:0060489) lateral sprouting involved in lung morphogenesis(GO:0060490) |
| 0.7 | 11.5 | GO:0070633 | transepithelial transport(GO:0070633) |
| 0.7 | 7.2 | GO:0060033 | anatomical structure regression(GO:0060033) |
| 0.7 | 2.9 | GO:0071799 | response to prostaglandin D(GO:0071798) cellular response to prostaglandin D stimulus(GO:0071799) |
| 0.7 | 4.9 | GO:0060670 | branching involved in labyrinthine layer morphogenesis(GO:0060670) |
| 0.7 | 1.4 | GO:0038183 | bile acid signaling pathway(GO:0038183) |
| 0.7 | 4.1 | GO:0072602 | interleukin-4 secretion(GO:0072602) |
| 0.7 | 7.5 | GO:0070327 | thyroid hormone transport(GO:0070327) |
| 0.7 | 2.0 | GO:0098749 | cerebellar neuron development(GO:0098749) |
| 0.7 | 10.2 | GO:1900121 | negative regulation of receptor binding(GO:1900121) |
| 0.7 | 11.4 | GO:0045056 | transcytosis(GO:0045056) |
| 0.7 | 5.3 | GO:0061525 | hindgut development(GO:0061525) |
| 0.7 | 9.3 | GO:0001573 | ganglioside metabolic process(GO:0001573) |
| 0.7 | 7.2 | GO:0090084 | negative regulation of inclusion body assembly(GO:0090084) |
| 0.7 | 2.0 | GO:0051012 | microtubule sliding(GO:0051012) negative regulation of nonmotile primary cilium assembly(GO:1902856) |
| 0.6 | 2.6 | GO:0006546 | glycine catabolic process(GO:0006546) glycine decarboxylation via glycine cleavage system(GO:0019464) |
| 0.6 | 8.9 | GO:0015693 | magnesium ion transport(GO:0015693) |
| 0.6 | 6.3 | GO:0035413 | positive regulation of catenin import into nucleus(GO:0035413) |
| 0.6 | 8.8 | GO:0051601 | exocyst localization(GO:0051601) |
| 0.6 | 3.7 | GO:0072675 | osteoclast fusion(GO:0072675) |
| 0.6 | 6.5 | GO:0006957 | complement activation, alternative pathway(GO:0006957) |
| 0.6 | 5.3 | GO:0006703 | estrogen biosynthetic process(GO:0006703) |
| 0.6 | 1.7 | GO:0006436 | tryptophanyl-tRNA aminoacylation(GO:0006436) |
| 0.5 | 1.1 | GO:0046066 | purine deoxyribonucleoside diphosphate metabolic process(GO:0009182) dGDP metabolic process(GO:0046066) |
| 0.5 | 6.5 | GO:0042135 | neurotransmitter catabolic process(GO:0042135) |
| 0.5 | 1.6 | GO:0006788 | heme oxidation(GO:0006788) |
| 0.5 | 11.5 | GO:0097503 | sialylation(GO:0097503) |
| 0.5 | 1.6 | GO:1990401 | regulation of branching involved in salivary gland morphogenesis by epithelial-mesenchymal signaling(GO:0060683) embryonic lung development(GO:1990401) |
| 0.5 | 3.5 | GO:2000507 | positive regulation of energy homeostasis(GO:2000507) |
| 0.5 | 5.5 | GO:0090083 | regulation of inclusion body assembly(GO:0090083) |
| 0.5 | 6.4 | GO:0010838 | positive regulation of keratinocyte proliferation(GO:0010838) |
| 0.5 | 3.4 | GO:2001135 | regulation of endocytic recycling(GO:2001135) |
| 0.5 | 2.4 | GO:0070172 | positive regulation of tooth mineralization(GO:0070172) |
| 0.5 | 14.2 | GO:0035313 | wound healing, spreading of epidermal cells(GO:0035313) |
| 0.5 | 1.4 | GO:0071934 | thiamine transmembrane transport(GO:0071934) |
| 0.5 | 6.4 | GO:0007288 | sperm axoneme assembly(GO:0007288) |
| 0.5 | 5.0 | GO:2000009 | negative regulation of protein localization to cell surface(GO:2000009) |
| 0.5 | 3.2 | GO:0046959 | habituation(GO:0046959) |
| 0.5 | 3.2 | GO:0000711 | meiotic DNA repair synthesis(GO:0000711) |
| 0.4 | 4.5 | GO:0035095 | behavioral response to nicotine(GO:0035095) |
| 0.4 | 1.3 | GO:0006589 | octopamine biosynthetic process(GO:0006589) octopamine metabolic process(GO:0046333) |
| 0.4 | 2.2 | GO:0001579 | medium-chain fatty acid transport(GO:0001579) |
| 0.4 | 4.8 | GO:0048664 | neuron fate determination(GO:0048664) |
| 0.4 | 10.3 | GO:0032400 | melanosome localization(GO:0032400) |
| 0.4 | 2.5 | GO:0002439 | chronic inflammatory response to antigenic stimulus(GO:0002439) |
| 0.4 | 3.3 | GO:0019852 | L-ascorbic acid metabolic process(GO:0019852) |
| 0.4 | 14.2 | GO:0060706 | cell differentiation involved in embryonic placenta development(GO:0060706) |
| 0.4 | 0.8 | GO:0033092 | positive regulation of immature T cell proliferation in thymus(GO:0033092) |
| 0.4 | 1.9 | GO:0001552 | ovarian follicle atresia(GO:0001552) |
| 0.4 | 1.1 | GO:0046356 | coenzyme A catabolic process(GO:0015938) nucleoside bisphosphate catabolic process(GO:0033869) ribonucleoside bisphosphate catabolic process(GO:0034031) purine nucleoside bisphosphate catabolic process(GO:0034034) acetyl-CoA catabolic process(GO:0046356) |
| 0.4 | 1.1 | GO:1901069 | guanosine-containing compound catabolic process(GO:1901069) |
| 0.4 | 10.8 | GO:0035428 | hexose transmembrane transport(GO:0035428) glucose transmembrane transport(GO:1904659) |
| 0.4 | 1.4 | GO:0042374 | phylloquinone metabolic process(GO:0042374) phylloquinone catabolic process(GO:0042376) quinone catabolic process(GO:1901662) |
| 0.3 | 14.5 | GO:0070830 | bicellular tight junction assembly(GO:0070830) |
| 0.3 | 5.8 | GO:0060716 | labyrinthine layer blood vessel development(GO:0060716) |
| 0.3 | 2.1 | GO:0060666 | dichotomous subdivision of terminal units involved in salivary gland branching(GO:0060666) |
| 0.3 | 1.4 | GO:1904975 | response to bleomycin(GO:1904975) |
| 0.3 | 8.4 | GO:0010842 | retina layer formation(GO:0010842) |
| 0.3 | 2.3 | GO:0000103 | sulfate assimilation(GO:0000103) |
| 0.3 | 1.3 | GO:2001199 | negative regulation of dendritic cell differentiation(GO:2001199) |
| 0.3 | 1.0 | GO:1901526 | positive regulation of macromitophagy(GO:1901526) positive regulation of mitophagy in response to mitochondrial depolarization(GO:1904925) |
| 0.3 | 1.6 | GO:0001582 | detection of chemical stimulus involved in sensory perception of sweet taste(GO:0001582) |
| 0.3 | 4.3 | GO:0071420 | cellular response to histamine(GO:0071420) |
| 0.3 | 1.4 | GO:0000706 | meiotic DNA double-strand break processing(GO:0000706) |
| 0.3 | 3.2 | GO:0019720 | Mo-molybdopterin cofactor biosynthetic process(GO:0006777) Mo-molybdopterin cofactor metabolic process(GO:0019720) |
| 0.3 | 3.4 | GO:0048680 | positive regulation of axon regeneration(GO:0048680) |
| 0.3 | 1.7 | GO:0010835 | regulation of protein ADP-ribosylation(GO:0010835) |
| 0.3 | 4.4 | GO:0098828 | positive regulation of inhibitory postsynaptic potential(GO:0097151) modulation of inhibitory postsynaptic potential(GO:0098828) |
| 0.3 | 6.5 | GO:0060037 | pharyngeal system development(GO:0060037) |
| 0.3 | 1.1 | GO:0090204 | protein localization to nuclear pore(GO:0090204) |
| 0.3 | 2.4 | GO:2000766 | negative regulation of cytoplasmic translation(GO:2000766) |
| 0.3 | 3.4 | GO:0098719 | sodium ion import across plasma membrane(GO:0098719) sodium ion import into cell(GO:1990118) |
| 0.3 | 1.6 | GO:0045714 | regulation of low-density lipoprotein particle receptor biosynthetic process(GO:0045714) |
| 0.3 | 8.8 | GO:0007339 | binding of sperm to zona pellucida(GO:0007339) |
| 0.3 | 7.1 | GO:0010738 | regulation of protein kinase A signaling(GO:0010738) |
| 0.3 | 4.3 | GO:0048875 | chemical homeostasis within a tissue(GO:0048875) |
| 0.2 | 4.6 | GO:0033327 | Leydig cell differentiation(GO:0033327) |
| 0.2 | 10.3 | GO:0006749 | glutathione metabolic process(GO:0006749) |
| 0.2 | 2.9 | GO:2000060 | positive regulation of protein ubiquitination involved in ubiquitin-dependent protein catabolic process(GO:2000060) |
| 0.2 | 0.9 | GO:0042339 | keratan sulfate metabolic process(GO:0042339) |
| 0.2 | 1.4 | GO:0010571 | positive regulation of nuclear cell cycle DNA replication(GO:0010571) |
| 0.2 | 0.7 | GO:0045347 | negative regulation of MHC class II biosynthetic process(GO:0045347) |
| 0.2 | 0.9 | GO:0071502 | cellular response to temperature stimulus(GO:0071502) |
| 0.2 | 2.4 | GO:0006388 | tRNA splicing, via endonucleolytic cleavage and ligation(GO:0006388) |
| 0.2 | 4.8 | GO:0000289 | nuclear-transcribed mRNA poly(A) tail shortening(GO:0000289) |
| 0.2 | 0.6 | GO:0000973 | posttranscriptional tethering of RNA polymerase II gene DNA at nuclear periphery(GO:0000973) |
| 0.2 | 3.9 | GO:0006828 | manganese ion transport(GO:0006828) |
| 0.2 | 2.8 | GO:0031507 | heterochromatin assembly(GO:0031507) |
| 0.2 | 1.8 | GO:0003215 | cardiac right ventricle morphogenesis(GO:0003215) |
| 0.2 | 1.0 | GO:0006102 | isocitrate metabolic process(GO:0006102) |
| 0.2 | 3.9 | GO:0002385 | organ or tissue specific immune response(GO:0002251) mucosal immune response(GO:0002385) |
| 0.2 | 4.3 | GO:1900078 | positive regulation of cellular response to insulin stimulus(GO:1900078) |
| 0.2 | 2.1 | GO:0002710 | negative regulation of T cell mediated immunity(GO:0002710) |
| 0.2 | 1.6 | GO:0040037 | negative regulation of fibroblast growth factor receptor signaling pathway(GO:0040037) |
| 0.2 | 0.4 | GO:0030186 | melatonin metabolic process(GO:0030186) |
| 0.2 | 0.4 | GO:0038108 | negative regulation of appetite by leptin-mediated signaling pathway(GO:0038108) |
| 0.2 | 2.1 | GO:0033689 | negative regulation of osteoblast proliferation(GO:0033689) |
| 0.2 | 1.0 | GO:0014816 | skeletal muscle satellite cell differentiation(GO:0014816) |
| 0.2 | 2.8 | GO:0016558 | protein import into peroxisome matrix(GO:0016558) |
| 0.2 | 1.5 | GO:0048631 | regulation of skeletal muscle tissue growth(GO:0048631) |
| 0.2 | 2.3 | GO:0033235 | positive regulation of protein sumoylation(GO:0033235) |
| 0.2 | 4.9 | GO:0007257 | activation of JUN kinase activity(GO:0007257) |
| 0.2 | 0.5 | GO:2001034 | histone H3-K36 dimethylation(GO:0097676) positive regulation of double-strand break repair via nonhomologous end joining(GO:2001034) |
| 0.1 | 1.7 | GO:0010839 | negative regulation of keratinocyte proliferation(GO:0010839) |
| 0.1 | 3.2 | GO:0097435 | fibril organization(GO:0097435) |
| 0.1 | 4.8 | GO:0030199 | collagen fibril organization(GO:0030199) |
| 0.1 | 1.8 | GO:0035970 | peptidyl-threonine dephosphorylation(GO:0035970) |
| 0.1 | 0.3 | GO:0001844 | protein insertion into mitochondrial membrane involved in apoptotic signaling pathway(GO:0001844) |
| 0.1 | 1.6 | GO:0097577 | intracellular sequestering of iron ion(GO:0006880) sequestering of iron ion(GO:0097577) |
| 0.1 | 5.3 | GO:0007528 | neuromuscular junction development(GO:0007528) |
| 0.1 | 3.5 | GO:0015986 | energy coupled proton transport, down electrochemical gradient(GO:0015985) ATP synthesis coupled proton transport(GO:0015986) |
| 0.1 | 1.4 | GO:0033622 | integrin activation(GO:0033622) |
| 0.1 | 0.7 | GO:0010668 | ectodermal cell differentiation(GO:0010668) |
| 0.1 | 0.9 | GO:0098789 | pre-mRNA cleavage required for polyadenylation(GO:0098789) |
| 0.1 | 4.9 | GO:0046580 | negative regulation of Ras protein signal transduction(GO:0046580) |
| 0.1 | 3.9 | GO:0033627 | cell adhesion mediated by integrin(GO:0033627) |
| 0.1 | 0.6 | GO:0098914 | membrane repolarization during atrial cardiac muscle cell action potential(GO:0098914) |
| 0.1 | 5.9 | GO:0015914 | phospholipid transport(GO:0015914) |
| 0.1 | 4.4 | GO:0006904 | vesicle docking involved in exocytosis(GO:0006904) |
| 0.1 | 0.9 | GO:0061302 | smooth muscle cell-matrix adhesion(GO:0061302) |
| 0.1 | 7.4 | GO:0010923 | negative regulation of phosphatase activity(GO:0010923) |
| 0.1 | 0.6 | GO:0002943 | tRNA dihydrouridine synthesis(GO:0002943) |
| 0.1 | 2.2 | GO:0051443 | positive regulation of ubiquitin-protein transferase activity(GO:0051443) |
| 0.1 | 1.0 | GO:0070257 | positive regulation of mucus secretion(GO:0070257) |
| 0.1 | 4.5 | GO:0007129 | synapsis(GO:0007129) |
| 0.1 | 2.3 | GO:0044030 | regulation of DNA methylation(GO:0044030) |
| 0.1 | 0.1 | GO:2000286 | receptor internalization involved in canonical Wnt signaling pathway(GO:2000286) |
| 0.1 | 1.7 | GO:0031581 | hemidesmosome assembly(GO:0031581) |
| 0.1 | 2.1 | GO:0060046 | regulation of acrosome reaction(GO:0060046) |
| 0.1 | 1.5 | GO:0043248 | proteasome assembly(GO:0043248) |
| 0.1 | 1.4 | GO:0006744 | ubiquinone biosynthetic process(GO:0006744) quinone biosynthetic process(GO:1901663) |
| 0.1 | 1.0 | GO:0097264 | self proteolysis(GO:0097264) |
| 0.1 | 0.8 | GO:0015732 | prostaglandin transport(GO:0015732) |
| 0.1 | 0.3 | GO:0015684 | ferrous iron transport(GO:0015684) ferrous iron transmembrane transport(GO:1903874) |
| 0.1 | 2.3 | GO:1901998 | toxin transport(GO:1901998) |
| 0.1 | 1.0 | GO:0045116 | protein neddylation(GO:0045116) |
| 0.1 | 0.1 | GO:0060527 | prostate glandular acinus morphogenesis(GO:0060526) prostate epithelial cord arborization involved in prostate glandular acinus morphogenesis(GO:0060527) |
| 0.1 | 1.8 | GO:0019730 | antimicrobial humoral response(GO:0019730) |
| 0.1 | 7.1 | GO:0009408 | response to heat(GO:0009408) |
| 0.1 | 3.1 | GO:0061077 | chaperone-mediated protein folding(GO:0061077) |
| 0.1 | 1.4 | GO:0000301 | retrograde transport, vesicle recycling within Golgi(GO:0000301) |
| 0.1 | 1.4 | GO:0035864 | response to potassium ion(GO:0035864) |
| 0.1 | 2.0 | GO:0007032 | endosome organization(GO:0007032) |
| 0.1 | 2.4 | GO:0048662 | negative regulation of smooth muscle cell proliferation(GO:0048662) |
| 0.1 | 6.1 | GO:0006457 | protein folding(GO:0006457) |
| 0.1 | 3.9 | GO:0006367 | transcription initiation from RNA polymerase II promoter(GO:0006367) |
| 0.1 | 0.3 | GO:0070973 | protein localization to endoplasmic reticulum exit site(GO:0070973) regulation of guanyl-nucleotide exchange factor activity(GO:1905097) |
| 0.0 | 4.1 | GO:0006497 | protein lipidation(GO:0006497) |
| 0.0 | 3.9 | GO:1903955 | positive regulation of protein targeting to mitochondrion(GO:1903955) |
| 0.0 | 0.4 | GO:0009133 | nucleoside diphosphate biosynthetic process(GO:0009133) |
| 0.0 | 3.9 | GO:1902600 | hydrogen ion transmembrane transport(GO:1902600) |
| 0.0 | 0.4 | GO:1902083 | negative regulation of peptidyl-cysteine S-nitrosylation(GO:1902083) |
| 0.0 | 0.1 | GO:0033386 | geranylgeranyl diphosphate metabolic process(GO:0033385) geranylgeranyl diphosphate biosynthetic process(GO:0033386) |
| 0.0 | 1.3 | GO:1904377 | positive regulation of protein localization to plasma membrane(GO:1903078) positive regulation of protein localization to cell periphery(GO:1904377) |
| 0.0 | 0.7 | GO:0042304 | regulation of fatty acid biosynthetic process(GO:0042304) |
| 0.0 | 0.6 | GO:0071380 | cellular response to prostaglandin E stimulus(GO:0071380) |
| 0.0 | 0.7 | GO:0009251 | glycogen catabolic process(GO:0005980) glucan catabolic process(GO:0009251) cellular polysaccharide catabolic process(GO:0044247) |
| 0.0 | 1.2 | GO:0035019 | somatic stem cell population maintenance(GO:0035019) |
| 0.0 | 2.6 | GO:0001676 | long-chain fatty acid metabolic process(GO:0001676) |
| 0.0 | 0.5 | GO:0030866 | cortical actin cytoskeleton organization(GO:0030866) |
| 0.0 | 0.3 | GO:1902018 | negative regulation of cilium assembly(GO:1902018) |
| 0.0 | 1.4 | GO:0070206 | protein trimerization(GO:0070206) |
| 0.0 | 0.1 | GO:0019355 | nicotinamide nucleotide biosynthetic process from aspartate(GO:0019355) 'de novo' NAD biosynthetic process from aspartate(GO:0034628) |
| 0.0 | 1.0 | GO:0045669 | positive regulation of osteoblast differentiation(GO:0045669) |
| 0.0 | 0.8 | GO:0042462 | eye photoreceptor cell development(GO:0042462) |
| 0.0 | 0.3 | GO:0071157 | negative regulation of cell cycle arrest(GO:0071157) |
| 0.0 | 0.3 | GO:0042574 | retinal metabolic process(GO:0042574) |
| 0.0 | 2.0 | GO:0006694 | steroid biosynthetic process(GO:0006694) |
| 0.0 | 0.5 | GO:0045747 | positive regulation of Notch signaling pathway(GO:0045747) |
| 0.0 | 0.3 | GO:0046855 | phosphorylated carbohydrate dephosphorylation(GO:0046838) inositol phosphate dephosphorylation(GO:0046855) |
| 0.0 | 1.2 | GO:0009062 | fatty acid catabolic process(GO:0009062) |
| 0.0 | 0.2 | GO:0033148 | positive regulation of intracellular estrogen receptor signaling pathway(GO:0033148) |
| 0.0 | 0.7 | GO:0051290 | protein heterotetramerization(GO:0051290) |
| 0.0 | 0.1 | GO:0075525 | viral translational termination-reinitiation(GO:0075525) |
| 0.0 | 0.7 | GO:0070373 | negative regulation of ERK1 and ERK2 cascade(GO:0070373) |
| 0.0 | 1.7 | GO:0046546 | male gonad development(GO:0008584) development of primary male sexual characteristics(GO:0046546) |
| 0.0 | 0.5 | GO:1902652 | cholesterol metabolic process(GO:0008203) secondary alcohol metabolic process(GO:1902652) |
| 0.0 | 0.1 | GO:0015871 | choline transport(GO:0015871) |
| 0.0 | 0.5 | GO:0007422 | peripheral nervous system development(GO:0007422) |
| 0.0 | 0.0 | GO:0051461 | negative regulation of histone deacetylation(GO:0031064) regulation of corticotropin secretion(GO:0051459) positive regulation of corticotropin secretion(GO:0051461) |
Gene overrepresentation in cellular component category:
| Log-likelihood per target | Total log-likelihood | Term | Description |
|---|---|---|---|
| 3.1 | 9.3 | GO:0034686 | integrin alphav-beta8 complex(GO:0034686) |
| 2.5 | 7.6 | GO:0000802 | transverse filament(GO:0000802) |
| 2.5 | 17.7 | GO:1990357 | terminal web(GO:1990357) |
| 2.0 | 13.9 | GO:0005862 | muscle thin filament tropomyosin(GO:0005862) |
| 1.7 | 6.7 | GO:0002079 | inner acrosomal membrane(GO:0002079) |
| 1.6 | 6.5 | GO:0071914 | microspike(GO:0044393) prominosome(GO:0071914) |
| 1.5 | 9.2 | GO:1990393 | 3M complex(GO:1990393) |
| 1.5 | 4.6 | GO:0036117 | hyaluranon cable(GO:0036117) |
| 1.4 | 11.1 | GO:0098645 | collagen type IV trimer(GO:0005587) network-forming collagen trimer(GO:0098642) collagen network(GO:0098645) |
| 1.3 | 7.7 | GO:0034363 | intermediate-density lipoprotein particle(GO:0034363) |
| 1.2 | 4.9 | GO:0035867 | alphav-beta3 integrin-IGF-1-IGF1R complex(GO:0035867) |
| 1.2 | 9.7 | GO:0005577 | fibrinogen complex(GO:0005577) |
| 1.2 | 16.5 | GO:0032426 | stereocilium tip(GO:0032426) |
| 1.1 | 10.3 | GO:0016461 | unconventional myosin complex(GO:0016461) |
| 1.1 | 21.1 | GO:0031528 | microvillus membrane(GO:0031528) |
| 0.9 | 3.8 | GO:0042567 | insulin-like growth factor ternary complex(GO:0042567) |
| 0.9 | 12.8 | GO:0032433 | filopodium tip(GO:0032433) |
| 0.9 | 5.3 | GO:0097598 | sperm cytoplasmic droplet(GO:0097598) |
| 0.8 | 2.4 | GO:0043190 | ATP-binding cassette (ABC) transporter complex(GO:0043190) |
| 0.6 | 5.0 | GO:0043203 | axon hillock(GO:0043203) |
| 0.6 | 6.2 | GO:0034464 | BBSome(GO:0034464) |
| 0.6 | 8.7 | GO:0043202 | lysosomal lumen(GO:0043202) |
| 0.6 | 7.7 | GO:0046581 | intercellular canaliculus(GO:0046581) |
| 0.6 | 2.9 | GO:0045252 | mitochondrial alpha-ketoglutarate dehydrogenase complex(GO:0005947) oxoglutarate dehydrogenase complex(GO:0045252) |
| 0.6 | 8.8 | GO:0035686 | sperm fibrous sheath(GO:0035686) |
| 0.6 | 6.4 | GO:0002177 | manchette(GO:0002177) |
| 0.6 | 5.8 | GO:1990635 | proximal dendrite(GO:1990635) |
| 0.6 | 5.1 | GO:0034098 | VCP-NPL4-UFD1 AAA ATPase complex(GO:0034098) |
| 0.6 | 3.9 | GO:0036056 | filtration diaphragm(GO:0036056) slit diaphragm(GO:0036057) |
| 0.5 | 6.8 | GO:0034361 | very-low-density lipoprotein particle(GO:0034361) triglyceride-rich lipoprotein particle(GO:0034385) |
| 0.5 | 6.8 | GO:0097208 | alveolar lamellar body(GO:0097208) |
| 0.5 | 43.9 | GO:0044291 | cell-cell contact zone(GO:0044291) |
| 0.4 | 8.0 | GO:0031231 | integral component of peroxisomal membrane(GO:0005779) intrinsic component of peroxisomal membrane(GO:0031231) |
| 0.4 | 2.8 | GO:0031094 | platelet dense tubular network(GO:0031094) |
| 0.4 | 2.0 | GO:0070695 | FHF complex(GO:0070695) |
| 0.4 | 8.7 | GO:0031430 | M band(GO:0031430) |
| 0.4 | 17.4 | GO:0016459 | myosin complex(GO:0016459) |
| 0.4 | 4.0 | GO:0001527 | microfibril(GO:0001527) fibril(GO:0043205) |
| 0.4 | 5.7 | GO:0031235 | intrinsic component of the cytoplasmic side of the plasma membrane(GO:0031235) |
| 0.3 | 23.8 | GO:0005581 | collagen trimer(GO:0005581) |
| 0.3 | 3.4 | GO:0044352 | pinosome(GO:0044352) macropinosome(GO:0044354) |
| 0.3 | 14.6 | GO:0046658 | anchored component of plasma membrane(GO:0046658) |
| 0.3 | 3.5 | GO:0016010 | dystrophin-associated glycoprotein complex(GO:0016010) glycoprotein complex(GO:0090665) |
| 0.3 | 2.8 | GO:0005677 | chromatin silencing complex(GO:0005677) |
| 0.3 | 1.6 | GO:1903767 | sweet taste receptor complex(GO:1903767) taste receptor complex(GO:1903768) |
| 0.3 | 18.3 | GO:0031225 | anchored component of membrane(GO:0031225) |
| 0.3 | 1.2 | GO:0072487 | MSL complex(GO:0072487) |
| 0.3 | 1.7 | GO:0005608 | laminin-3 complex(GO:0005608) |
| 0.3 | 5.6 | GO:0043034 | costamere(GO:0043034) |
| 0.3 | 12.9 | GO:0009925 | basal plasma membrane(GO:0009925) |
| 0.3 | 19.3 | GO:0031526 | brush border membrane(GO:0031526) |
| 0.3 | 3.5 | GO:0000276 | mitochondrial proton-transporting ATP synthase complex, coupling factor F(o)(GO:0000276) |
| 0.3 | 6.7 | GO:0034451 | centriolar satellite(GO:0034451) |
| 0.3 | 0.8 | GO:1902560 | GMP reductase complex(GO:1902560) |
| 0.3 | 6.6 | GO:0000145 | exocyst(GO:0000145) |
| 0.3 | 12.2 | GO:0030173 | integral component of Golgi membrane(GO:0030173) |
| 0.2 | 1.7 | GO:0031314 | extrinsic component of mitochondrial inner membrane(GO:0031314) |
| 0.2 | 3.9 | GO:0030061 | mitochondrial crista(GO:0030061) |
| 0.2 | 6.1 | GO:0030670 | phagocytic vesicle membrane(GO:0030670) |
| 0.2 | 2.5 | GO:0034663 | endoplasmic reticulum chaperone complex(GO:0034663) |
| 0.2 | 2.7 | GO:0030008 | TRAPP complex(GO:0030008) |
| 0.2 | 4.5 | GO:0005892 | acetylcholine-gated channel complex(GO:0005892) |
| 0.2 | 4.0 | GO:0005614 | interstitial matrix(GO:0005614) |
| 0.2 | 0.6 | GO:1990462 | omegasome membrane(GO:1903349) omegasome(GO:1990462) |
| 0.2 | 1.4 | GO:0001651 | dense fibrillar component(GO:0001651) |
| 0.2 | 1.4 | GO:0031105 | septin complex(GO:0031105) sperm annulus(GO:0097227) |
| 0.2 | 1.5 | GO:0031931 | TORC1 complex(GO:0031931) |
| 0.2 | 2.0 | GO:0017071 | intracellular cyclic nucleotide activated cation channel complex(GO:0017071) |
| 0.2 | 50.1 | GO:0005578 | proteinaceous extracellular matrix(GO:0005578) |
| 0.2 | 0.7 | GO:0000938 | GARP complex(GO:0000938) EARP complex(GO:1990745) |
| 0.2 | 1.5 | GO:0008541 | proteasome regulatory particle, lid subcomplex(GO:0008541) |
| 0.1 | 2.8 | GO:0005665 | DNA-directed RNA polymerase II, core complex(GO:0005665) |
| 0.1 | 9.1 | GO:0005788 | endoplasmic reticulum lumen(GO:0005788) |
| 0.1 | 1.5 | GO:0034045 | pre-autophagosomal structure membrane(GO:0034045) |
| 0.1 | 6.1 | GO:0045171 | intercellular bridge(GO:0045171) |
| 0.1 | 6.9 | GO:0015030 | Cajal body(GO:0015030) |
| 0.1 | 3.6 | GO:0000788 | nuclear nucleosome(GO:0000788) |
| 0.1 | 0.7 | GO:0005952 | cAMP-dependent protein kinase complex(GO:0005952) |
| 0.1 | 0.6 | GO:0044614 | nuclear pore cytoplasmic filaments(GO:0044614) |
| 0.1 | 5.6 | GO:0016592 | mediator complex(GO:0016592) |
| 0.1 | 2.4 | GO:0005942 | phosphatidylinositol 3-kinase complex(GO:0005942) |
| 0.1 | 2.0 | GO:1990124 | messenger ribonucleoprotein complex(GO:1990124) |
| 0.1 | 6.6 | GO:0031594 | neuromuscular junction(GO:0031594) |
| 0.1 | 1.6 | GO:0030127 | COPII vesicle coat(GO:0030127) |
| 0.1 | 4.3 | GO:0005903 | brush border(GO:0005903) |
| 0.1 | 3.2 | GO:0035869 | ciliary transition zone(GO:0035869) |
| 0.1 | 0.4 | GO:0097165 | nuclear stress granule(GO:0097165) |
| 0.1 | 0.5 | GO:0033268 | node of Ranvier(GO:0033268) |
| 0.1 | 1.7 | GO:0008250 | oligosaccharyltransferase complex(GO:0008250) |
| 0.1 | 0.7 | GO:0031595 | nuclear proteasome complex(GO:0031595) |
| 0.1 | 25.0 | GO:0016324 | apical plasma membrane(GO:0016324) |
| 0.1 | 6.6 | GO:0005913 | cell-cell adherens junction(GO:0005913) |
| 0.1 | 12.2 | GO:0001650 | fibrillar center(GO:0001650) |
| 0.1 | 3.0 | GO:0005902 | microvillus(GO:0005902) |
| 0.1 | 1.7 | GO:0032588 | trans-Golgi network membrane(GO:0032588) |
| 0.1 | 4.1 | GO:0005884 | actin filament(GO:0005884) |
| 0.1 | 5.7 | GO:0030018 | Z disc(GO:0030018) |
| 0.1 | 11.1 | GO:0005770 | late endosome(GO:0005770) |
| 0.1 | 7.3 | GO:0030176 | integral component of endoplasmic reticulum membrane(GO:0030176) |
| 0.1 | 0.7 | GO:0042555 | MCM complex(GO:0042555) |
| 0.1 | 1.4 | GO:0035267 | NuA4 histone acetyltransferase complex(GO:0035267) H4/H2A histone acetyltransferase complex(GO:0043189) H4 histone acetyltransferase complex(GO:1902562) |
| 0.1 | 0.9 | GO:0005847 | mRNA cleavage and polyadenylation specificity factor complex(GO:0005847) |
| 0.1 | 3.1 | GO:0030175 | filopodium(GO:0030175) |
| 0.0 | 7.4 | GO:0031012 | extracellular matrix(GO:0031012) |
| 0.0 | 2.1 | GO:0045271 | mitochondrial respiratory chain complex I(GO:0005747) NADH dehydrogenase complex(GO:0030964) respiratory chain complex I(GO:0045271) |
| 0.0 | 3.0 | GO:0045095 | keratin filament(GO:0045095) |
| 0.0 | 0.3 | GO:0016272 | prefoldin complex(GO:0016272) |
| 0.0 | 0.7 | GO:0032420 | stereocilium(GO:0032420) |
| 0.0 | 0.3 | GO:0070971 | endoplasmic reticulum exit site(GO:0070971) |
| 0.0 | 0.5 | GO:0032045 | guanyl-nucleotide exchange factor complex(GO:0032045) |
| 0.0 | 2.0 | GO:0030016 | myofibril(GO:0030016) |
| 0.0 | 7.5 | GO:0045121 | membrane raft(GO:0045121) membrane microdomain(GO:0098857) |
| 0.0 | 0.5 | GO:0030126 | COPI vesicle coat(GO:0030126) |
| 0.0 | 1.2 | GO:0042645 | nucleoid(GO:0009295) mitochondrial nucleoid(GO:0042645) |
| 0.0 | 16.2 | GO:0005789 | endoplasmic reticulum membrane(GO:0005789) |
| 0.0 | 2.0 | GO:0031463 | Cul3-RING ubiquitin ligase complex(GO:0031463) |
| 0.0 | 0.9 | GO:0060077 | inhibitory synapse(GO:0060077) |
| 0.0 | 0.2 | GO:0000808 | origin recognition complex(GO:0000808) nuclear origin of replication recognition complex(GO:0005664) |
| 0.0 | 2.4 | GO:0042579 | peroxisome(GO:0005777) microbody(GO:0042579) |
| 0.0 | 0.2 | GO:0030315 | T-tubule(GO:0030315) |
| 0.0 | 0.5 | GO:0035861 | site of double-strand break(GO:0035861) |
| 0.0 | 0.1 | GO:0001518 | voltage-gated sodium channel complex(GO:0001518) |
Gene overrepresentation in molecular function category:
| Log-likelihood per target | Total log-likelihood | Term | Description |
|---|---|---|---|
| 4.2 | 21.1 | GO:0015321 | sodium-dependent phosphate transmembrane transporter activity(GO:0015321) |
| 3.6 | 10.9 | GO:0004046 | aminoacylase activity(GO:0004046) |
| 3.5 | 17.4 | GO:0070052 | collagen V binding(GO:0070052) |
| 2.6 | 5.1 | GO:0005024 | transforming growth factor beta-activated receptor activity(GO:0005024) |
| 2.6 | 7.7 | GO:0070653 | high-density lipoprotein particle receptor binding(GO:0070653) |
| 2.5 | 10.2 | GO:0086077 | gap junction channel activity involved in cardiac conduction electrical coupling(GO:0086075) gap junction channel activity involved in AV node cell-bundle of His cell electrical coupling(GO:0086077) |
| 2.3 | 6.8 | GO:0034437 | glycoprotein transporter activity(GO:0034437) |
| 2.1 | 24.7 | GO:0004499 | N,N-dimethylaniline monooxygenase activity(GO:0004499) |
| 2.0 | 20.3 | GO:0031957 | very long-chain fatty acid-CoA ligase activity(GO:0031957) |
| 2.0 | 11.7 | GO:0042954 | lipoprotein transporter activity(GO:0042954) |
| 1.9 | 7.6 | GO:0016842 | amidine-lyase activity(GO:0016842) |
| 1.7 | 5.2 | GO:0005017 | platelet-derived growth factor-activated receptor activity(GO:0005017) |
| 1.6 | 7.9 | GO:0005550 | pheromone binding(GO:0005550) |
| 1.5 | 11.7 | GO:0005007 | fibroblast growth factor-activated receptor activity(GO:0005007) |
| 1.4 | 6.9 | GO:0050501 | hyaluronan synthase activity(GO:0050501) |
| 1.3 | 4.0 | GO:0033823 | procollagen-lysine 5-dioxygenase activity(GO:0008475) procollagen glucosyltransferase activity(GO:0033823) |
| 1.3 | 3.9 | GO:0042015 | interleukin-20 binding(GO:0042015) |
| 1.2 | 8.6 | GO:0004111 | creatine kinase activity(GO:0004111) |
| 1.2 | 3.6 | GO:0045550 | geranylgeranyl reductase activity(GO:0045550) |
| 1.2 | 4.8 | GO:0032190 | acrosin binding(GO:0032190) |
| 1.2 | 3.6 | GO:0035939 | microsatellite binding(GO:0035939) |
| 1.2 | 3.5 | GO:0004956 | prostaglandin D receptor activity(GO:0004956) |
| 1.2 | 3.5 | GO:0031708 | endothelin B receptor binding(GO:0031708) |
| 1.1 | 23.7 | GO:0070742 | C2H2 zinc finger domain binding(GO:0070742) |
| 1.1 | 3.3 | GO:0019797 | procollagen-proline 3-dioxygenase activity(GO:0019797) |
| 1.0 | 5.2 | GO:0016262 | protein N-acetylglucosaminyltransferase activity(GO:0016262) |
| 1.0 | 29.2 | GO:0017147 | Wnt-protein binding(GO:0017147) |
| 1.0 | 5.0 | GO:0004962 | endothelin receptor activity(GO:0004962) |
| 1.0 | 15.6 | GO:0015026 | coreceptor activity(GO:0015026) |
| 0.9 | 7.9 | GO:0055056 | D-glucose transmembrane transporter activity(GO:0055056) |
| 0.8 | 3.3 | GO:0050610 | oxidoreductase activity, acting on a sulfur group of donors, quinone or similar compound as acceptor(GO:0016672) oxidoreductase activity, acting on phosphorus or arsenic in donors(GO:0030613) oxidoreductase activity, acting on phosphorus or arsenic in donors, disulfide as acceptor(GO:0030614) glutathione dehydrogenase (ascorbate) activity(GO:0045174) methylarsonate reductase activity(GO:0050610) |
| 0.8 | 23.7 | GO:0005385 | zinc ion transmembrane transporter activity(GO:0005385) |
| 0.8 | 2.3 | GO:0004779 | adenylylsulfate kinase activity(GO:0004020) sulfate adenylyltransferase activity(GO:0004779) sulfate adenylyltransferase (ATP) activity(GO:0004781) |
| 0.8 | 2.3 | GO:0004909 | interleukin-1, Type I, activating receptor activity(GO:0004909) |
| 0.8 | 13.7 | GO:0004115 | 3',5'-cyclic-AMP phosphodiesterase activity(GO:0004115) |
| 0.8 | 5.3 | GO:0047035 | testosterone dehydrogenase (NAD+) activity(GO:0047035) |
| 0.7 | 2.2 | GO:0060002 | plus-end directed microfilament motor activity(GO:0060002) |
| 0.7 | 2.2 | GO:0016414 | carnitine O-octanoyltransferase activity(GO:0008458) O-octanoyltransferase activity(GO:0016414) |
| 0.7 | 6.6 | GO:0005001 | transmembrane receptor protein tyrosine phosphatase activity(GO:0005001) transmembrane receptor protein phosphatase activity(GO:0019198) |
| 0.7 | 6.5 | GO:0043495 | protein anchor(GO:0043495) |
| 0.7 | 5.7 | GO:0051525 | NFAT protein binding(GO:0051525) |
| 0.7 | 31.6 | GO:0008307 | structural constituent of muscle(GO:0008307) |
| 0.7 | 18.5 | GO:0050431 | transforming growth factor beta binding(GO:0050431) |
| 0.6 | 5.7 | GO:0019966 | interleukin-1 binding(GO:0019966) |
| 0.6 | 7.5 | GO:0070324 | thyroid hormone binding(GO:0070324) |
| 0.6 | 6.3 | GO:0005412 | glucose:sodium symporter activity(GO:0005412) |
| 0.6 | 3.7 | GO:0016176 | superoxide-generating NADPH oxidase activator activity(GO:0016176) |
| 0.6 | 8.6 | GO:0015250 | water channel activity(GO:0015250) |
| 0.6 | 2.4 | GO:0003987 | acetate-CoA ligase activity(GO:0003987) |
| 0.6 | 4.0 | GO:0016286 | small conductance calcium-activated potassium channel activity(GO:0016286) |
| 0.6 | 4.0 | GO:0005173 | stem cell factor receptor binding(GO:0005173) |
| 0.6 | 1.7 | GO:0004830 | tryptophan-tRNA ligase activity(GO:0004830) |
| 0.6 | 3.9 | GO:1990430 | extracellular matrix protein binding(GO:1990430) |
| 0.6 | 4.4 | GO:0004966 | galanin receptor activity(GO:0004966) |
| 0.5 | 4.9 | GO:0030375 | thyroid hormone receptor coactivator activity(GO:0030375) |
| 0.5 | 4.9 | GO:0043559 | insulin binding(GO:0043559) |
| 0.5 | 1.6 | GO:0004392 | heme oxygenase (decyclizing) activity(GO:0004392) |
| 0.5 | 3.2 | GO:0031726 | CCR1 chemokine receptor binding(GO:0031726) |
| 0.5 | 3.7 | GO:0003988 | acetyl-CoA C-acyltransferase activity(GO:0003988) |
| 0.5 | 4.7 | GO:0030957 | Tat protein binding(GO:0030957) |
| 0.5 | 1.5 | GO:0004724 | magnesium-dependent protein serine/threonine phosphatase activity(GO:0004724) |
| 0.5 | 3.0 | GO:0098519 | nucleotide phosphatase activity, acting on free nucleotides(GO:0098519) |
| 0.5 | 11.5 | GO:0008373 | sialyltransferase activity(GO:0008373) |
| 0.5 | 16.0 | GO:0001968 | fibronectin binding(GO:0001968) |
| 0.5 | 4.7 | GO:0017127 | cholesterol transporter activity(GO:0017127) |
| 0.5 | 1.4 | GO:0015234 | thiamine transmembrane transporter activity(GO:0015234) |
| 0.5 | 6.6 | GO:0051787 | misfolded protein binding(GO:0051787) |
| 0.5 | 6.5 | GO:0004791 | thioredoxin-disulfide reductase activity(GO:0004791) |
| 0.5 | 15.3 | GO:0005109 | frizzled binding(GO:0005109) |
| 0.5 | 5.1 | GO:0019870 | potassium channel inhibitor activity(GO:0019870) |
| 0.5 | 6.8 | GO:0015095 | magnesium ion transmembrane transporter activity(GO:0015095) |
| 0.4 | 1.3 | GO:0004500 | dopamine beta-monooxygenase activity(GO:0004500) |
| 0.4 | 8.9 | GO:0031005 | filamin binding(GO:0031005) |
| 0.4 | 10.1 | GO:0001871 | pattern binding(GO:0001871) polysaccharide binding(GO:0030247) |
| 0.4 | 2.4 | GO:0004616 | phosphogluconate dehydrogenase (decarboxylating) activity(GO:0004616) |
| 0.4 | 3.2 | GO:0005095 | GTPase inhibitor activity(GO:0005095) |
| 0.4 | 1.6 | GO:0003842 | 1-pyrroline-5-carboxylate dehydrogenase activity(GO:0003842) |
| 0.4 | 8.5 | GO:0051010 | microtubule plus-end binding(GO:0051010) |
| 0.4 | 6.9 | GO:0017160 | Ral GTPase binding(GO:0017160) |
| 0.4 | 1.5 | GO:0001156 | TFIIIC-class transcription factor binding(GO:0001156) |
| 0.4 | 1.1 | GO:0044715 | 8-oxo-dGDP phosphatase activity(GO:0044715) |
| 0.4 | 3.9 | GO:0070679 | inositol 1,4,5 trisphosphate binding(GO:0070679) |
| 0.4 | 4.6 | GO:0005355 | glucose transmembrane transporter activity(GO:0005355) |
| 0.4 | 4.6 | GO:0045295 | gamma-catenin binding(GO:0045295) |
| 0.3 | 1.4 | GO:0005499 | vitamin D binding(GO:0005499) bile acid receptor activity(GO:0038181) vitamin D response element binding(GO:0070644) |
| 0.3 | 3.8 | GO:0019869 | chloride channel inhibitor activity(GO:0019869) |
| 0.3 | 3.4 | GO:0015386 | potassium:proton antiporter activity(GO:0015386) |
| 0.3 | 4.6 | GO:0030169 | low-density lipoprotein particle binding(GO:0030169) |
| 0.3 | 1.0 | GO:0051538 | 3 iron, 4 sulfur cluster binding(GO:0051538) |
| 0.3 | 3.9 | GO:0008432 | JUN kinase binding(GO:0008432) |
| 0.3 | 8.7 | GO:0016702 | oxidoreductase activity, acting on single donors with incorporation of molecular oxygen, incorporation of two atoms of oxygen(GO:0016702) |
| 0.3 | 2.3 | GO:0008430 | selenium binding(GO:0008430) |
| 0.3 | 13.2 | GO:0015485 | cholesterol binding(GO:0015485) |
| 0.3 | 6.6 | GO:0098641 | cadherin binding involved in cell-cell adhesion(GO:0098641) |
| 0.3 | 2.4 | GO:0035005 | 1-phosphatidylinositol-4-phosphate 3-kinase activity(GO:0035005) |
| 0.3 | 2.1 | GO:0004065 | arylsulfatase activity(GO:0004065) |
| 0.3 | 12.6 | GO:0001784 | phosphotyrosine binding(GO:0001784) |
| 0.3 | 5.8 | GO:0004435 | phosphatidylinositol phospholipase C activity(GO:0004435) |
| 0.3 | 1.4 | GO:0004090 | carbonyl reductase (NADPH) activity(GO:0004090) |
| 0.3 | 1.1 | GO:0003986 | acetyl-CoA hydrolase activity(GO:0003986) |
| 0.3 | 4.8 | GO:0005522 | profilin binding(GO:0005522) |
| 0.3 | 0.8 | GO:0003920 | GMP reductase activity(GO:0003920) oxidoreductase activity, acting on NAD(P)H, nitrogenous group as acceptor(GO:0016657) |
| 0.3 | 4.5 | GO:0022848 | acetylcholine-gated cation channel activity(GO:0022848) |
| 0.3 | 7.6 | GO:0030371 | translation repressor activity(GO:0030371) |
| 0.3 | 6.9 | GO:0008395 | steroid hydroxylase activity(GO:0008395) |
| 0.3 | 4.1 | GO:0005149 | interleukin-1 receptor binding(GO:0005149) |
| 0.3 | 2.5 | GO:0016861 | intramolecular oxidoreductase activity, interconverting aldoses and ketoses(GO:0016861) |
| 0.3 | 1.3 | GO:0004427 | inorganic diphosphatase activity(GO:0004427) |
| 0.2 | 3.0 | GO:0097027 | ubiquitin-protein transferase activator activity(GO:0097027) |
| 0.2 | 3.0 | GO:0004000 | adenosine deaminase activity(GO:0004000) |
| 0.2 | 6.6 | GO:0044183 | protein binding involved in protein folding(GO:0044183) |
| 0.2 | 3.4 | GO:0043522 | leucine zipper domain binding(GO:0043522) |
| 0.2 | 3.2 | GO:0043395 | heparan sulfate proteoglycan binding(GO:0043395) |
| 0.2 | 4.0 | GO:0004745 | retinol dehydrogenase activity(GO:0004745) |
| 0.2 | 1.4 | GO:0030274 | LIM domain binding(GO:0030274) |
| 0.2 | 5.9 | GO:0004864 | protein phosphatase inhibitor activity(GO:0004864) |
| 0.2 | 0.2 | GO:0086089 | voltage-gated potassium channel activity involved in atrial cardiac muscle cell action potential repolarization(GO:0086089) |
| 0.2 | 2.0 | GO:0005222 | intracellular cAMP activated cation channel activity(GO:0005222) |
| 0.2 | 3.9 | GO:0005070 | SH3/SH2 adaptor activity(GO:0005070) |
| 0.2 | 3.8 | GO:0005520 | insulin-like growth factor binding(GO:0005520) |
| 0.2 | 4.3 | GO:0000062 | fatty-acyl-CoA binding(GO:0000062) |
| 0.2 | 3.5 | GO:0046933 | proton-transporting ATP synthase activity, rotational mechanism(GO:0046933) |
| 0.2 | 0.7 | GO:0042289 | MHC class II protein binding(GO:0042289) |
| 0.2 | 2.9 | GO:0008253 | 5'-nucleotidase activity(GO:0008253) |
| 0.2 | 4.3 | GO:0071837 | HMG box domain binding(GO:0071837) |
| 0.2 | 11.0 | GO:0051082 | unfolded protein binding(GO:0051082) |
| 0.2 | 5.3 | GO:0051539 | 4 iron, 4 sulfur cluster binding(GO:0051539) |
| 0.2 | 1.0 | GO:0019158 | glucokinase activity(GO:0004340) hexokinase activity(GO:0004396) fructokinase activity(GO:0008865) mannokinase activity(GO:0019158) |
| 0.2 | 0.9 | GO:0001517 | N-acetylglucosamine 6-O-sulfotransferase activity(GO:0001517) |
| 0.2 | 1.6 | GO:0048407 | platelet-derived growth factor binding(GO:0048407) |
| 0.2 | 2.0 | GO:0005528 | macrolide binding(GO:0005527) FK506 binding(GO:0005528) |
| 0.2 | 1.2 | GO:0050693 | LBD domain binding(GO:0050693) |
| 0.1 | 2.1 | GO:0017154 | semaphorin receptor activity(GO:0017154) |
| 0.1 | 12.3 | GO:0008013 | beta-catenin binding(GO:0008013) |
| 0.1 | 2.1 | GO:0097602 | cullin family protein binding(GO:0097602) |
| 0.1 | 0.7 | GO:0071253 | connexin binding(GO:0071253) |
| 0.1 | 1.7 | GO:0042043 | neurexin family protein binding(GO:0042043) |
| 0.1 | 2.5 | GO:0016881 | acid-amino acid ligase activity(GO:0016881) |
| 0.1 | 6.9 | GO:0005201 | extracellular matrix structural constituent(GO:0005201) |
| 0.1 | 3.9 | GO:0015002 | cytochrome-c oxidase activity(GO:0004129) heme-copper terminal oxidase activity(GO:0015002) oxidoreductase activity, acting on a heme group of donors, oxygen as acceptor(GO:0016676) |
| 0.1 | 0.9 | GO:0038062 | protein tyrosine kinase collagen receptor activity(GO:0038062) |
| 0.1 | 1.3 | GO:0030306 | ADP-ribosylation factor binding(GO:0030306) |
| 0.1 | 1.3 | GO:0005540 | hyaluronic acid binding(GO:0005540) |
| 0.1 | 0.9 | GO:0016421 | CoA carboxylase activity(GO:0016421) |
| 0.1 | 10.6 | GO:0005089 | Rho guanyl-nucleotide exchange factor activity(GO:0005089) |
| 0.1 | 0.7 | GO:0036402 | proteasome-activating ATPase activity(GO:0036402) |
| 0.1 | 1.6 | GO:0016805 | dipeptidase activity(GO:0016805) |
| 0.1 | 1.3 | GO:0070492 | oligosaccharide binding(GO:0070492) |
| 0.1 | 18.9 | GO:0017137 | Rab GTPase binding(GO:0017137) |
| 0.1 | 8.1 | GO:0002039 | p53 binding(GO:0002039) |
| 0.1 | 6.5 | GO:0048029 | monosaccharide binding(GO:0048029) |
| 0.1 | 1.6 | GO:0019789 | SUMO transferase activity(GO:0019789) |
| 0.1 | 1.4 | GO:0003796 | lysozyme activity(GO:0003796) |
| 0.1 | 0.6 | GO:0017150 | tRNA dihydrouridine synthase activity(GO:0017150) |
| 0.1 | 11.5 | GO:0008201 | heparin binding(GO:0008201) |
| 0.1 | 0.7 | GO:0030160 | GKAP/Homer scaffold activity(GO:0030160) |
| 0.1 | 2.4 | GO:0005158 | insulin receptor binding(GO:0005158) |
| 0.1 | 0.3 | GO:0004445 | inositol-polyphosphate 5-phosphatase activity(GO:0004445) |
| 0.1 | 0.4 | GO:0034452 | dynactin binding(GO:0034452) |
| 0.1 | 4.9 | GO:0043621 | protein self-association(GO:0043621) |
| 0.1 | 1.6 | GO:0008199 | ferric iron binding(GO:0008199) |
| 0.1 | 7.7 | GO:0002020 | protease binding(GO:0002020) |
| 0.1 | 3.4 | GO:0005496 | steroid binding(GO:0005496) |
| 0.1 | 3.9 | GO:0043022 | ribosome binding(GO:0043022) |
| 0.1 | 3.4 | GO:0051018 | protein kinase A binding(GO:0051018) |
| 0.1 | 2.6 | GO:0070888 | E-box binding(GO:0070888) |
| 0.1 | 12.4 | GO:0004252 | serine-type endopeptidase activity(GO:0004252) |
| 0.1 | 0.9 | GO:0051378 | serotonin binding(GO:0051378) |
| 0.1 | 5.6 | GO:0017124 | SH3 domain binding(GO:0017124) |
| 0.1 | 4.9 | GO:0004867 | serine-type endopeptidase inhibitor activity(GO:0004867) |
| 0.0 | 0.7 | GO:0004679 | AMP-activated protein kinase activity(GO:0004679) |
| 0.0 | 2.3 | GO:0008138 | protein tyrosine/serine/threonine phosphatase activity(GO:0008138) |
| 0.0 | 0.5 | GO:0000014 | single-stranded DNA endodeoxyribonuclease activity(GO:0000014) |
| 0.0 | 4.2 | GO:0004222 | metalloendopeptidase activity(GO:0004222) |
| 0.0 | 11.3 | GO:0045296 | cadherin binding(GO:0045296) |
| 0.0 | 1.1 | GO:0008536 | Ran GTPase binding(GO:0008536) |
| 0.0 | 0.4 | GO:0017110 | nucleoside-diphosphatase activity(GO:0017110) |
| 0.0 | 2.3 | GO:0030674 | protein binding, bridging(GO:0030674) |
| 0.0 | 0.5 | GO:0031402 | sodium ion binding(GO:0031402) |
| 0.0 | 1.1 | GO:0030145 | manganese ion binding(GO:0030145) |
| 0.0 | 1.5 | GO:0097110 | scaffold protein binding(GO:0097110) |
| 0.0 | 0.1 | GO:0000309 | nicotinamide-nucleotide adenylyltransferase activity(GO:0000309) nicotinate-nucleotide adenylyltransferase activity(GO:0004515) |
| 0.0 | 6.0 | GO:0016757 | transferase activity, transferring glycosyl groups(GO:0016757) |
| 0.0 | 4.8 | GO:0030246 | carbohydrate binding(GO:0030246) |
| 0.0 | 0.1 | GO:0004161 | dimethylallyltranstransferase activity(GO:0004161) geranyltranstransferase activity(GO:0004337) |
| 0.0 | 3.3 | GO:0005179 | hormone activity(GO:0005179) |
| 0.0 | 0.8 | GO:0008028 | monocarboxylic acid transmembrane transporter activity(GO:0008028) |
| 0.0 | 0.3 | GO:0043539 | protein serine/threonine kinase activator activity(GO:0043539) |
| 0.0 | 0.4 | GO:0008171 | O-methyltransferase activity(GO:0008171) |
| 0.0 | 0.7 | GO:0015459 | potassium channel regulator activity(GO:0015459) |
| 0.0 | 2.4 | GO:0005096 | GTPase activator activity(GO:0005096) |
| 0.0 | 0.2 | GO:0003688 | DNA replication origin binding(GO:0003688) |
Gene overrepresentation in curated gene sets: canonical pathways category:
| Log-likelihood per target | Total log-likelihood | Term | Description |
|---|---|---|---|
| 0.5 | 80.1 | NABA ECM AFFILIATED | Genes encoding proteins affiliated structurally or functionally to extracellular matrix proteins |
| 0.5 | 13.9 | PID WNT SIGNALING PATHWAY | Wnt signaling network |
| 0.5 | 9.3 | PID INTEGRIN5 PATHWAY | Beta5 beta6 beta7 and beta8 integrin cell surface interactions |
| 0.5 | 10.7 | PID NECTIN PATHWAY | Nectin adhesion pathway |
| 0.4 | 1.7 | PID SYNDECAN 1 PATHWAY | Syndecan-1-mediated signaling events |
| 0.4 | 6.8 | PID HEDGEHOG GLI PATHWAY | Hedgehog signaling events mediated by Gli proteins |
| 0.4 | 20.5 | PID P38 ALPHA BETA DOWNSTREAM PATHWAY | Signaling mediated by p38-alpha and p38-beta |
| 0.4 | 7.7 | ST G ALPHA S PATHWAY | G alpha s Pathway |
| 0.4 | 14.7 | PID INTEGRIN3 PATHWAY | Beta3 integrin cell surface interactions |
| 0.4 | 21.8 | PID AR TF PATHWAY | Regulation of Androgen receptor activity |
| 0.3 | 4.6 | PID ALK2 PATHWAY | ALK2 signaling events |
| 0.3 | 64.6 | NABA ECM GLYCOPROTEINS | Genes encoding structural ECM glycoproteins |
| 0.3 | 9.2 | PID INSULIN GLUCOSE PATHWAY | Insulin-mediated glucose transport |
| 0.3 | 3.9 | PID EPO PATHWAY | EPO signaling pathway |
| 0.3 | 12.7 | PID BMP PATHWAY | BMP receptor signaling |
| 0.3 | 4.6 | PID PDGFRA PATHWAY | PDGFR-alpha signaling pathway |
| 0.3 | 14.0 | PID ECADHERIN STABILIZATION PATHWAY | Stabilization and expansion of the E-cadherin adherens junction |
| 0.3 | 21.0 | WNT SIGNALING | Genes related to Wnt-mediated signal transduction |
| 0.3 | 11.3 | PID ARF6 TRAFFICKING PATHWAY | Arf6 trafficking events |
| 0.2 | 0.5 | SA FAS SIGNALING | The TNF-type receptor Fas induces apoptosis on ligand binding. |
| 0.2 | 6.8 | PID LIS1 PATHWAY | Lissencephaly gene (LIS1) in neuronal migration and development |
| 0.2 | 56.2 | NABA ECM REGULATORS | Genes encoding enzymes and their regulators involved in the remodeling of the extracellular matrix |
| 0.2 | 2.6 | PID ANTHRAX PATHWAY | Cellular roles of Anthrax toxin |
| 0.2 | 1.6 | ST JAK STAT PATHWAY | Jak-STAT Pathway |
| 0.2 | 10.6 | PID RHOA REG PATHWAY | Regulation of RhoA activity |
| 0.2 | 8.1 | PID KIT PATHWAY | Signaling events mediated by Stem cell factor receptor (c-Kit) |
| 0.2 | 4.2 | PID RHODOPSIN PATHWAY | Visual signal transduction: Rods |
| 0.2 | 2.3 | ST P38 MAPK PATHWAY | p38 MAPK Pathway |
| 0.1 | 7.7 | PID DELTA NP63 PATHWAY | Validated transcriptional targets of deltaNp63 isoforms |
| 0.1 | 3.0 | PID ENDOTHELIN PATHWAY | Endothelins |
| 0.1 | 2.0 | PID PI3KCI AKT PATHWAY | Class I PI3K signaling events mediated by Akt |
| 0.1 | 5.3 | PID RB 1PATHWAY | Regulation of retinoblastoma protein |
| 0.1 | 1.0 | PID ERB GENOMIC PATHWAY | Validated nuclear estrogen receptor beta network |
| 0.1 | 2.5 | PID ERBB1 INTERNALIZATION PATHWAY | Internalization of ErbB1 |
| 0.1 | 2.2 | PID BARD1 PATHWAY | BARD1 signaling events |
| 0.1 | 0.8 | PID HDAC CLASSIII PATHWAY | Signaling events mediated by HDAC Class III |
| 0.0 | 1.2 | PID HIF2PATHWAY | HIF-2-alpha transcription factor network |
| 0.0 | 0.7 | PID IL1 PATHWAY | IL1-mediated signaling events |
| 0.0 | 1.0 | PID P53 REGULATION PATHWAY | p53 pathway |
| 0.0 | 0.8 | PID HES HEY PATHWAY | Notch-mediated HES/HEY network |
| 0.0 | 1.0 | PID MYC REPRESS PATHWAY | Validated targets of C-MYC transcriptional repression |
| 0.0 | 0.6 | PID CERAMIDE PATHWAY | Ceramide signaling pathway |
Gene overrepresentation in curated gene sets: REACTOME pathways category:
| Log-likelihood per target | Total log-likelihood | Term | Description |
|---|---|---|---|
| 1.2 | 23.4 | REACTOME ZINC TRANSPORTERS | Genes involved in Zinc transporters |
| 1.0 | 5.8 | REACTOME SIGNALLING BY NGF | Genes involved in Signalling by NGF |
| 0.9 | 10.9 | REACTOME SYNTHESIS OF BILE ACIDS AND BILE SALTS VIA 24 HYDROXYCHOLESTEROL | Genes involved in Synthesis of bile acids and bile salts via 24-hydroxycholesterol |
| 0.9 | 17.0 | REACTOME TGF BETA RECEPTOR SIGNALING IN EMT EPITHELIAL TO MESENCHYMAL TRANSITION | Genes involved in TGF-beta receptor signaling in EMT (epithelial to mesenchymal transition) |
| 0.9 | 16.5 | REACTOME HS GAG DEGRADATION | Genes involved in HS-GAG degradation |
| 0.8 | 11.5 | REACTOME TERMINATION OF O GLYCAN BIOSYNTHESIS | Genes involved in Termination of O-glycan biosynthesis |
| 0.7 | 8.6 | REACTOME PASSIVE TRANSPORT BY AQUAPORINS | Genes involved in Passive Transport by Aquaporins |
| 0.7 | 5.4 | REACTOME ER PHAGOSOME PATHWAY | Genes involved in ER-Phagosome pathway |
| 0.6 | 10.4 | REACTOME FACILITATIVE NA INDEPENDENT GLUCOSE TRANSPORTERS | Genes involved in Facilitative Na+-independent glucose transporters |
| 0.6 | 15.3 | REACTOME SMOOTH MUSCLE CONTRACTION | Genes involved in Smooth Muscle Contraction |
| 0.6 | 10.2 | REACTOME GAP JUNCTION ASSEMBLY | Genes involved in Gap junction assembly |
| 0.5 | 4.6 | REACTOME SIGNALING BY SCF KIT | Genes involved in Signaling by SCF-KIT |
| 0.5 | 22.8 | REACTOME PHASE1 FUNCTIONALIZATION OF COMPOUNDS | Genes involved in Phase 1 - Functionalization of compounds |
| 0.5 | 11.4 | REACTOME STEROID HORMONES | Genes involved in Steroid hormones |
| 0.5 | 28.2 | REACTOME COLLAGEN FORMATION | Genes involved in Collagen formation |
| 0.5 | 7.7 | REACTOME CHYLOMICRON MEDIATED LIPID TRANSPORT | Genes involved in Chylomicron-mediated lipid transport |
| 0.5 | 6.5 | REACTOME REGULATION OF COMPLEMENT CASCADE | Genes involved in Regulation of Complement cascade |
| 0.5 | 13.1 | REACTOME SULFUR AMINO ACID METABOLISM | Genes involved in Sulfur amino acid metabolism |
| 0.4 | 4.6 | REACTOME HYALURONAN UPTAKE AND DEGRADATION | Genes involved in Hyaluronan uptake and degradation |
| 0.4 | 2.4 | REACTOME HYALURONAN METABOLISM | Genes involved in Hyaluronan metabolism |
| 0.4 | 2.9 | REACTOME PROSTANOID LIGAND RECEPTORS | Genes involved in Prostanoid ligand receptors |
| 0.3 | 4.0 | REACTOME REGULATION OF KIT SIGNALING | Genes involved in Regulation of KIT signaling |
| 0.3 | 1.3 | REACTOME REGULATION OF WATER BALANCE BY RENAL AQUAPORINS | Genes involved in Regulation of Water Balance by Renal Aquaporins |
| 0.3 | 3.9 | REACTOME ELEVATION OF CYTOSOLIC CA2 LEVELS | Genes involved in Elevation of cytosolic Ca2+ levels |
| 0.3 | 23.8 | REACTOME INTEGRIN CELL SURFACE INTERACTIONS | Genes involved in Integrin cell surface interactions |
| 0.3 | 4.6 | REACTOME HORMONE SENSITIVE LIPASE HSL MEDIATED TRIACYLGLYCEROL HYDROLYSIS | Genes involved in Hormone-sensitive lipase (HSL)-mediated triacylglycerol hydrolysis |
| 0.3 | 4.7 | REACTOME LIPID DIGESTION MOBILIZATION AND TRANSPORT | Genes involved in Lipid digestion, mobilization, and transport |
| 0.3 | 3.8 | REACTOME PYRIMIDINE CATABOLISM | Genes involved in Pyrimidine catabolism |
| 0.3 | 26.9 | REACTOME CLASS B 2 SECRETIN FAMILY RECEPTORS | Genes involved in Class B/2 (Secretin family receptors) |
| 0.3 | 4.8 | REACTOME BRANCHED CHAIN AMINO ACID CATABOLISM | Genes involved in Branched-chain amino acid catabolism |
| 0.3 | 7.2 | REACTOME YAP1 AND WWTR1 TAZ STIMULATED GENE EXPRESSION | Genes involved in YAP1- and WWTR1 (TAZ)-stimulated gene expression |
| 0.2 | 3.9 | REACTOME FORMATION OF ATP BY CHEMIOSMOTIC COUPLING | Genes involved in Formation of ATP by chemiosmotic coupling |
| 0.2 | 2.5 | REACTOME ACTIVATION OF CHAPERONE GENES BY ATF6 ALPHA | Genes involved in Activation of Chaperone Genes by ATF6-alpha |
| 0.2 | 2.4 | REACTOME SYNTHESIS OF PIPS AT THE LATE ENDOSOME MEMBRANE | Genes involved in Synthesis of PIPs at the late endosome membrane |
| 0.2 | 2.1 | REACTOME THE ACTIVATION OF ARYLSULFATASES | Genes involved in The activation of arylsulfatases |
| 0.2 | 20.4 | REACTOME TRANSPORT OF INORGANIC CATIONS ANIONS AND AMINO ACIDS OLIGOPEPTIDES | Genes involved in Transport of inorganic cations/anions and amino acids/oligopeptides |
| 0.2 | 3.8 | REACTOME REGULATION OF INSULIN LIKE GROWTH FACTOR IGF ACTIVITY BY INSULIN LIKE GROWTH FACTOR BINDING PROTEINS IGFBPS | Genes involved in Regulation of Insulin-like Growth Factor (IGF) Activity by Insulin-like Growth Factor Binding Proteins (IGFBPs) |
| 0.2 | 2.3 | REACTOME CYTOSOLIC SULFONATION OF SMALL MOLECULES | Genes involved in Cytosolic sulfonation of small molecules |
| 0.1 | 17.1 | REACTOME FACTORS INVOLVED IN MEGAKARYOCYTE DEVELOPMENT AND PLATELET PRODUCTION | Genes involved in Factors involved in megakaryocyte development and platelet production |
| 0.1 | 2.2 | REACTOME CELL EXTRACELLULAR MATRIX INTERACTIONS | Genes involved in Cell-extracellular matrix interactions |
| 0.1 | 1.8 | REACTOME MITOCHONDRIAL FATTY ACID BETA OXIDATION | Genes involved in Mitochondrial Fatty Acid Beta-Oxidation |
| 0.1 | 2.1 | REACTOME OTHER SEMAPHORIN INTERACTIONS | Genes involved in Other semaphorin interactions |
| 0.1 | 2.1 | REACTOME POST CHAPERONIN TUBULIN FOLDING PATHWAY | Genes involved in Post-chaperonin tubulin folding pathway |
| 0.1 | 2.6 | REACTOME NCAM1 INTERACTIONS | Genes involved in NCAM1 interactions |
| 0.1 | 0.5 | REACTOME ACTIVATION OF CHAPERONES BY ATF6 ALPHA | Genes involved in Activation of Chaperones by ATF6-alpha |
| 0.1 | 1.5 | REACTOME REGULATION OF PYRUVATE DEHYDROGENASE PDH COMPLEX | Genes involved in Regulation of pyruvate dehydrogenase (PDH) complex |
| 0.1 | 4.2 | REACTOME ACTIVATION OF CHAPERONE GENES BY XBP1S | Genes involved in Activation of Chaperone Genes by XBP1(S) |
| 0.1 | 3.7 | REACTOME O LINKED GLYCOSYLATION OF MUCINS | Genes involved in O-linked glycosylation of mucins |
| 0.1 | 2.6 | REACTOME CGMP EFFECTS | Genes involved in cGMP effects |
| 0.1 | 1.6 | REACTOME CLASS C 3 METABOTROPIC GLUTAMATE PHEROMONE RECEPTORS | Genes involved in Class C/3 (Metabotropic glutamate/pheromone receptors) |
| 0.1 | 5.7 | REACTOME MEIOTIC SYNAPSIS | Genes involved in Meiotic Synapsis |
| 0.1 | 3.3 | REACTOME TRANSPORT OF VITAMINS NUCLEOSIDES AND RELATED MOLECULES | Genes involved in Transport of vitamins, nucleosides, and related molecules |
| 0.1 | 0.7 | REACTOME REGULATION OF RHEB GTPASE ACTIVITY BY AMPK | Genes involved in Regulation of Rheb GTPase activity by AMPK |
| 0.1 | 1.5 | REACTOME GLUTATHIONE CONJUGATION | Genes involved in Glutathione conjugation |
| 0.1 | 0.9 | REACTOME SEROTONIN RECEPTORS | Genes involved in Serotonin receptors |
| 0.1 | 3.3 | REACTOME METABOLISM OF VITAMINS AND COFACTORS | Genes involved in Metabolism of vitamins and cofactors |
| 0.1 | 1.4 | REACTOME SIGNALING BY FGFR1 FUSION MUTANTS | Genes involved in Signaling by FGFR1 fusion mutants |
| 0.1 | 1.0 | REACTOME CITRIC ACID CYCLE TCA CYCLE | Genes involved in Citric acid cycle (TCA cycle) |
| 0.1 | 2.2 | REACTOME NOTCH1 INTRACELLULAR DOMAIN REGULATES TRANSCRIPTION | Genes involved in NOTCH1 Intracellular Domain Regulates Transcription |
| 0.1 | 0.8 | REACTOME PURINE SALVAGE | Genes involved in Purine salvage |
| 0.0 | 7.1 | REACTOME G ALPHA Q SIGNALLING EVENTS | Genes involved in G alpha (q) signalling events |
| 0.0 | 0.9 | REACTOME KERATAN SULFATE BIOSYNTHESIS | Genes involved in Keratan sulfate biosynthesis |
| 0.0 | 0.9 | REACTOME MITOCHONDRIAL TRNA AMINOACYLATION | Genes involved in Mitochondrial tRNA aminoacylation |
| 0.0 | 2.9 | REACTOME TRANSCRIPTIONAL REGULATION OF WHITE ADIPOCYTE DIFFERENTIATION | Genes involved in Transcriptional Regulation of White Adipocyte Differentiation |
| 0.0 | 0.8 | REACTOME PEROXISOMAL LIPID METABOLISM | Genes involved in Peroxisomal lipid metabolism |
| 0.0 | 0.7 | REACTOME GLYCOGEN BREAKDOWN GLYCOGENOLYSIS | Genes involved in Glycogen breakdown (glycogenolysis) |
| 0.0 | 0.9 | REACTOME SMAD2 SMAD3 SMAD4 HETEROTRIMER REGULATES TRANSCRIPTION | Genes involved in SMAD2/SMAD3:SMAD4 heterotrimer regulates transcription |
| 0.0 | 0.5 | REACTOME MTORC1 MEDIATED SIGNALLING | Genes involved in mTORC1-mediated signalling |
| 0.0 | 2.1 | REACTOME RESPIRATORY ELECTRON TRANSPORT | Genes involved in Respiratory electron transport |
| 0.0 | 1.4 | REACTOME NUCLEAR RECEPTOR TRANSCRIPTION PATHWAY | Genes involved in Nuclear Receptor transcription pathway |
| 0.0 | 0.6 | REACTOME TRNA AMINOACYLATION | Genes involved in tRNA Aminoacylation |
| 0.0 | 1.7 | REACTOME CELL JUNCTION ORGANIZATION | Genes involved in Cell junction organization |
| 0.0 | 0.3 | REACTOME SYNTHESIS OF PIPS AT THE GOLGI MEMBRANE | Genes involved in Synthesis of PIPs at the Golgi membrane |
| 0.0 | 0.6 | REACTOME PPARA ACTIVATES GENE EXPRESSION | Genes involved in PPARA Activates Gene Expression |
| 0.0 | 0.2 | REACTOME E2F ENABLED INHIBITION OF PRE REPLICATION COMPLEX FORMATION | Genes involved in E2F-enabled inhibition of pre-replication complex formation |