Project
GSE53960: rat RNA-Seq transcriptomic Bodymap
Navigation
Downloads
Results for Tcf7_Tcf7l2
Z-value: 0.86
Motif logo
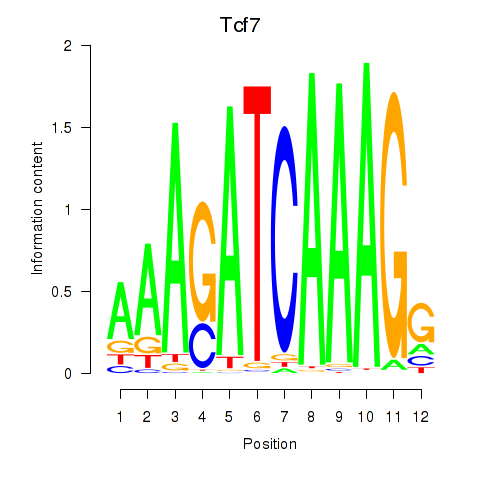
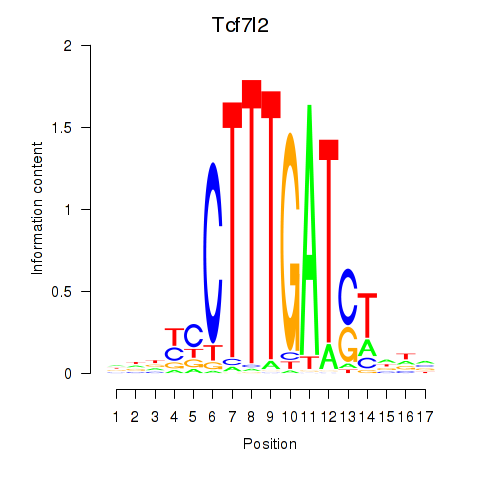
Transcription factors associated with Tcf7_Tcf7l2
| Gene Symbol | Gene ID | Gene Info |
|---|---|---|
|
Tcf7
|
ENSRNOG00000005872 | transcription factor 7 (T-cell specific, HMG-box) |
|
Tcf7l2
|
ENSRNOG00000049232 | transcription factor 7 like 2 |
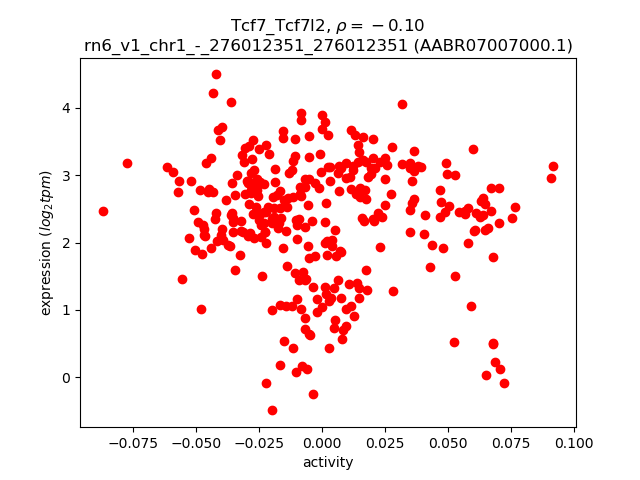
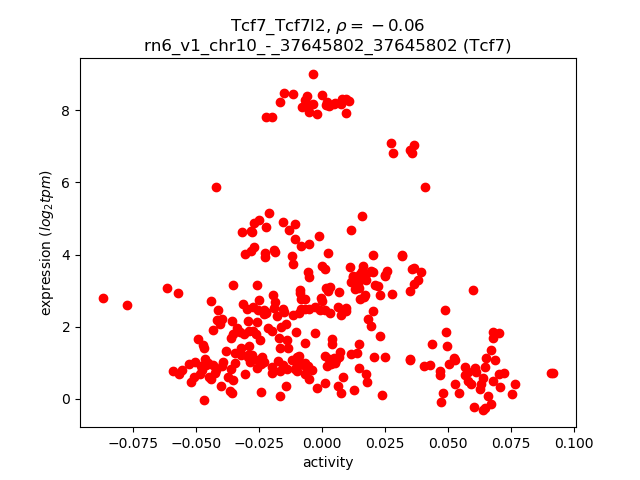
Activity-expression correlation:
| Gene | Promoter | Pearson corr. coef. | P-value | Plot |
|---|---|---|---|---|
| AABR07007000.1 | rn6_v1_chr1_-_276012351_276012351 | -0.10 | 8.2e-02 | Click! |
| Tcf7 | rn6_v1_chr10_-_37645802_37645802 | -0.06 | 3.1e-01 | Click! |
Activity profile of Tcf7_Tcf7l2 motif
Sorted Z-values of Tcf7_Tcf7l2 motif
| Promoter | Log-likelihood | Transcript | Gene | Gene Info |
|---|---|---|---|---|
| chr5_-_78985990 | 35.96 |
ENSRNOT00000009248
|
Ambp
|
alpha-1-microglobulin/bikunin precursor |
| chr13_-_56877611 | 34.55 |
ENSRNOT00000079040
ENSRNOT00000017195 |
Cfhr1
|
complement factor H-related 1 |
| chrX_+_143097525 | 32.32 |
ENSRNOT00000004559
|
F9
|
coagulation factor IX |
| chr4_+_65110746 | 28.02 |
ENSRNOT00000017675
|
Akr1d1
|
aldo-keto reductase family 1, member D1 |
| chr10_-_109840047 | 27.27 |
ENSRNOT00000054947
|
Notum
|
NOTUM, palmitoleoyl-protein carboxylesterase |
| chr7_-_143538579 | 23.75 |
ENSRNOT00000081518
|
Krt79
|
keratin 79 |
| chr17_+_22619891 | 21.11 |
ENSRNOT00000060403
|
Adtrp
|
androgen-dependent TFPI-regulating protein |
| chr4_+_122244711 | 17.64 |
ENSRNOT00000038251
|
Uroc1
|
urocanate hydratase 1 |
| chr9_+_9721105 | 17.05 |
ENSRNOT00000073042
ENSRNOT00000075494 |
C3
|
complement C3 |
| chr5_-_50193571 | 16.65 |
ENSRNOT00000051243
|
Cfap206
|
cilia and flagella associated protein 206 |
| chr4_+_172119331 | 16.12 |
ENSRNOT00000010579
|
Mgst1
|
microsomal glutathione S-transferase 1 |
| chr19_-_41686229 | 15.59 |
ENSRNOT00000022721
|
Tat
|
tyrosine aminotransferase |
| chr6_+_127743971 | 14.80 |
ENSRNOT00000013045
|
Serpina4
|
serpin family A member 4 |
| chr4_+_99063181 | 13.99 |
ENSRNOT00000008840
|
Fabp1
|
fatty acid binding protein 1 |
| chr17_+_72160735 | 13.29 |
ENSRNOT00000038817
|
Itih2
|
inter-alpha-trypsin inhibitor heavy chain 2 |
| chr7_+_117759083 | 13.22 |
ENSRNOT00000050556
|
Gpt
|
glutamic--pyruvic transaminase |
| chr10_+_90085559 | 13.10 |
ENSRNOT00000028332
|
Nags
|
N-acetylglutamate synthase |
| chr3_-_2719513 | 12.90 |
ENSRNOT00000020997
|
Lcn12
|
lipocalin 12 |
| chr3_-_2719135 | 12.75 |
ENSRNOT00000080257
|
Lcn12
|
lipocalin 12 |
| chr6_+_127927650 | 12.27 |
ENSRNOT00000057271
|
LOC100909605
|
serine protease inhibitor A3F-like |
| chr2_-_181905300 | 12.21 |
ENSRNOT00000035411
|
Lrat
|
lecithin-retinol acyltransferase (phosphatidylcholine-retinol-O-acyltransferase) |
| chr8_-_50539331 | 12.19 |
ENSRNOT00000088997
|
AABR07073400.1
|
|
| chr17_+_8489266 | 11.98 |
ENSRNOT00000016252
|
Lect2
|
leukocyte cell-derived chemotaxin 2 |
| chr18_+_46148849 | 11.98 |
ENSRNOT00000026724
|
Prr16
|
proline rich 16 |
| chr7_-_70661891 | 11.38 |
ENSRNOT00000010240
|
Inhbc
|
inhibin beta C subunit |
| chr1_-_76722965 | 11.06 |
ENSRNOT00000052129
|
LOC100912485
|
alcohol sulfotransferase-like |
| chr1_+_84304228 | 10.90 |
ENSRNOT00000024771
|
Prx
|
periaxin |
| chr6_+_129052503 | 10.81 |
ENSRNOT00000044152
|
RGD1565462
|
similar to BC049975 protein |
| chr11_+_67555658 | 10.78 |
ENSRNOT00000039075
|
Csta
|
cystatin A (stefin A) |
| chr8_+_50537009 | 10.77 |
ENSRNOT00000080658
|
Apoa4
|
apolipoprotein A4 |
| chr1_-_52894832 | 10.50 |
ENSRNOT00000016471
|
T
|
T brachyury transcription factor |
| chr15_-_47338976 | 10.18 |
ENSRNOT00000016562
|
RGD1565212
|
similar to 4930578I06Rik protein |
| chr17_+_9736577 | 10.18 |
ENSRNOT00000066586
|
F12
|
coagulation factor XII |
| chr3_-_14112851 | 10.03 |
ENSRNOT00000092736
|
C5
|
complement C5 |
| chr7_+_1206648 | 9.91 |
ENSRNOT00000073689
|
Pros1
|
protein S (alpha) |
| chr5_-_140657745 | 9.77 |
ENSRNOT00000019080
|
Mfsd2a
|
major facilitator superfamily domain containing 2A |
| chr13_-_56958549 | 9.71 |
ENSRNOT00000017293
ENSRNOT00000083912 |
RGD1564614
|
similar to complement factor H-related protein |
| chr12_+_35612896 | 9.57 |
ENSRNOT00000073223
|
AABR07036187.1
|
|
| chr10_-_98294522 | 9.49 |
ENSRNOT00000005489
|
Abca8
|
ATP binding cassette subfamily A member 8 |
| chr4_-_78759408 | 9.42 |
ENSRNOT00000050994
|
Igf2bp3
|
insulin-like growth factor 2 mRNA binding protein 3 |
| chr10_-_82209459 | 9.35 |
ENSRNOT00000004377
|
Spata20
|
spermatogenesis associated 20 |
| chr10_+_53778662 | 9.27 |
ENSRNOT00000045718
|
Myh2
|
myosin heavy chain 2 |
| chr20_-_14193690 | 9.03 |
ENSRNOT00000058237
|
Upb1
|
beta-ureidopropionase 1 |
| chr1_-_52962388 | 8.51 |
ENSRNOT00000033685
|
T2
|
brachyury 2 |
| chr13_-_53870428 | 8.27 |
ENSRNOT00000000812
|
Nr5a2
|
nuclear receptor subfamily 5, group A, member 2 |
| chr2_+_221823687 | 8.24 |
ENSRNOT00000072735
|
Dpyd
|
dihydropyrimidine dehydrogenase |
| chr7_-_139872900 | 7.82 |
ENSRNOT00000046402
|
H1fnt
|
H1 histone family, member N, testis-specific |
| chr5_+_68908892 | 7.60 |
ENSRNOT00000007515
|
RGD1309291
|
similar to RIKEN cDNA 4930547C10 |
| chr7_-_123655896 | 7.59 |
ENSRNOT00000012413
|
Cyp2d2
|
cytochrome P450, family 2, subfamily d, polypeptide 2 |
| chr12_-_19114399 | 7.58 |
ENSRNOT00000073099
|
Cyp3a9
|
cytochrome P450, family 3, subfamily a, polypeptide 9 |
| chr20_+_13778178 | 7.55 |
ENSRNOT00000058314
|
Gstt4
|
glutathione S-transferase, theta 4 |
| chr5_+_165415136 | 7.50 |
ENSRNOT00000016317
ENSRNOT00000079407 |
Masp2
|
mannan-binding lectin serine peptidase 2 |
| chr7_+_116655145 | 7.48 |
ENSRNOT00000009823
|
Zfp41
|
zinc finger protein 41 |
| chr4_+_133540540 | 7.37 |
ENSRNOT00000073232
|
AABR07061556.1
|
|
| chr14_-_18839420 | 7.26 |
ENSRNOT00000034090
|
Cxcl3
|
chemokine (C-X-C motif) ligand 3 |
| chr6_+_108123816 | 7.23 |
ENSRNOT00000089242
ENSRNOT00000063900 |
Bbof1
|
basal body orientation factor 1 |
| chr16_-_18643309 | 7.23 |
ENSRNOT00000031680
|
Dydc2
|
DPY30 domain containing 2 |
| chr9_+_95256627 | 7.16 |
ENSRNOT00000025291
|
Ugt1a5
|
UDP glucuronosyltransferase family 1 member A5 |
| chr1_+_229030233 | 7.07 |
ENSRNOT00000084503
|
Glyatl1
|
glycine-N-acyltransferase-like 1 |
| chr18_-_13183263 | 6.98 |
ENSRNOT00000050933
|
Ccdc178
|
coiled-coil domain containing 178 |
| chr13_+_27238767 | 6.81 |
ENSRNOT00000003495
|
Serpinb11
|
serpin family B member 11 |
| chr2_-_201678244 | 6.78 |
ENSRNOT00000071087
|
AABR07012658.1
|
|
| chr17_-_2827001 | 6.61 |
ENSRNOT00000047872
|
Prss47
|
protease, serine, 47 |
| chr1_+_264741911 | 6.61 |
ENSRNOT00000019956
|
Sema4g
|
semaphorin 4G |
| chr11_+_54137639 | 6.58 |
ENSRNOT00000066343
|
LOC100909977
|
leukocyte surface antigen CD47-like |
| chr13_-_50499060 | 6.58 |
ENSRNOT00000065347
ENSRNOT00000076924 |
Etnk2
|
ethanolamine kinase 2 |
| chr1_-_4550768 | 6.58 |
ENSRNOT00000061954
|
Adgb
|
androglobin |
| chr8_-_112648880 | 6.53 |
ENSRNOT00000015265
|
Ackr4
|
atypical chemokine receptor 4 |
| chr1_-_164142206 | 6.50 |
ENSRNOT00000081669
|
Dgat2
|
diacylglycerol O-acyltransferase 2 |
| chr4_-_101156576 | 6.50 |
ENSRNOT00000020894
|
Dnah6
|
dynein, axonemal, heavy chain 6 |
| chr1_+_128614138 | 6.48 |
ENSRNOT00000076227
ENSRNOT00000078707 |
Ttc23
|
tetratricopeptide repeat domain 23 |
| chr2_-_98610368 | 6.48 |
ENSRNOT00000011641
|
Zfhx4
|
zinc finger homeobox 4 |
| chr2_-_208633945 | 6.48 |
ENSRNOT00000049155
|
Pifo
|
primary cilia formation |
| chr17_-_43504604 | 6.44 |
ENSRNOT00000083829
ENSRNOT00000066313 |
Slc17a1
|
solute carrier family 17 member 1 |
| chr10_-_46593009 | 6.33 |
ENSRNOT00000047053
|
Srebf1
|
sterol regulatory element binding transcription factor 1 |
| chr2_-_155176260 | 6.25 |
ENSRNOT00000071864
|
AABR07010919.1
|
|
| chr13_+_75177965 | 6.20 |
ENSRNOT00000007321
|
Sec16b
|
SEC16 homolog B, endoplasmic reticulum export factor |
| chr4_-_101393329 | 6.19 |
ENSRNOT00000007636
|
RGD1562515
|
similar to RIKEN cDNA 4931417E11 |
| chr2_+_93712992 | 5.95 |
ENSRNOT00000059326
|
Fabp12
|
fatty acid binding protein 12 |
| chr9_+_76913639 | 5.90 |
ENSRNOT00000089203
|
AABR07068007.2
|
|
| chr1_+_257970345 | 5.88 |
ENSRNOT00000088853
|
Cyp2c11
|
cytochrome P450, subfamily 2, polypeptide 11 |
| chr4_+_70755795 | 5.87 |
ENSRNOT00000043527
|
LOC683849
|
similar to Anionic trypsin II precursor (Pretrypsinogen II) |
| chr14_-_86190659 | 5.80 |
ENSRNOT00000086474
|
Gck
|
glucokinase |
| chr10_+_89285855 | 5.69 |
ENSRNOT00000028033
|
G6pc
|
glucose-6-phosphatase, catalytic subunit |
| chr10_-_88009576 | 5.67 |
ENSRNOT00000018566
|
Krt35
|
keratin 35 |
| chr15_+_35032049 | 5.52 |
ENSRNOT00000091757
|
Mcpt2
|
mast cell protease 2 |
| chr2_+_188449210 | 5.52 |
ENSRNOT00000027700
|
Pklr
|
pyruvate kinase, liver and RBC |
| chr3_+_148510779 | 5.47 |
ENSRNOT00000012156
|
Xkr7
|
XK related 7 |
| chr14_+_13751231 | 5.17 |
ENSRNOT00000044244
|
Gk2
|
glycerol kinase 2 |
| chr12_+_24158766 | 5.08 |
ENSRNOT00000001963
|
Ccl26
|
C-C motif chemokine ligand 26 |
| chr4_-_161278293 | 4.86 |
ENSRNOT00000050332
|
AABR07062108.1
|
|
| chr7_-_20070772 | 4.79 |
ENSRNOT00000071008
|
LOC102551633
|
sperm motility kinase W-like |
| chr18_-_786674 | 4.76 |
ENSRNOT00000021955
|
Cetn1
|
centrin 1 |
| chr8_+_2659865 | 4.72 |
ENSRNOT00000088553
ENSRNOT00000010243 |
Casp12
|
caspase 12 |
| chr9_+_95161157 | 4.72 |
ENSRNOT00000071200
|
Ugt1a5
|
UDP glucuronosyltransferase family 1 member A5 |
| chr18_-_41899450 | 4.69 |
ENSRNOT00000057099
|
RGD1561114
|
similar to hypothetical protein 4930474N05 |
| chr10_-_74413745 | 4.62 |
ENSRNOT00000038296
|
Prr11
|
proline rich 11 |
| chr17_-_88095729 | 4.58 |
ENSRNOT00000025140
|
Enkur
|
enkurin, TRPC channel interacting protein |
| chr1_-_248377093 | 4.58 |
ENSRNOT00000067612
|
Gldc
|
glycine decarboxylase |
| chr20_+_8109635 | 4.54 |
ENSRNOT00000000609
|
Armc12
|
armadillo repeat containing 12 |
| chr10_+_58875826 | 4.53 |
ENSRNOT00000020071
|
Fbxo39
|
F-box protein 39 |
| chr4_-_69149520 | 4.42 |
ENSRNOT00000017611
|
Prss58
|
protease, serine, 58 |
| chr4_-_77489535 | 4.39 |
ENSRNOT00000008728
|
Pdia4
|
protein disulfide isomerase family A, member 4 |
| chr10_-_105412627 | 4.38 |
ENSRNOT00000034817
|
Qrich2
|
glutamine rich 2 |
| chr7_+_54859104 | 4.34 |
ENSRNOT00000087341
|
Caps2
|
calcyphosine 2 |
| chr1_-_82236179 | 4.31 |
ENSRNOT00000027845
|
Cnfn
|
cornifelin |
| chr10_-_88152064 | 4.29 |
ENSRNOT00000019477
|
Krt16
|
keratin 16 |
| chr1_-_101198801 | 4.24 |
ENSRNOT00000037998
|
Ccdc155
|
coiled-coil domain containing 155 |
| chr14_-_92495894 | 4.14 |
ENSRNOT00000064483
|
Cobl
|
cordon-bleu WH2 repeat protein |
| chr4_+_7144669 | 4.01 |
ENSRNOT00000077682
ENSRNOT00000014998 |
Iqca1l
|
IQ motif containing with AAA domain 1 like |
| chr13_-_36022197 | 3.97 |
ENSRNOT00000091280
|
Cfap221
|
cilia and flagella associated protein 221 |
| chr17_-_389967 | 3.97 |
ENSRNOT00000023865
|
Fbp2
|
fructose-bisphosphatase 2 |
| chr3_-_134406576 | 3.94 |
ENSRNOT00000081589
|
Sel1l2
|
SEL1L2 ERAD E3 ligase adaptor subunit |
| chr19_+_21541742 | 3.83 |
ENSRNOT00000021095
ENSRNOT00000042077 |
Abcc12
|
ATP binding cassette subfamily C member 12 |
| chr3_+_138974871 | 3.81 |
ENSRNOT00000012524
|
Scp2d1
|
SCP2 sterol-binding domain containing 1 |
| chr20_+_9313271 | 3.80 |
ENSRNOT00000071939
ENSRNOT00000000651 |
Dnah8
|
dynein, axonemal, heavy chain 8 |
| chr12_-_52596076 | 3.74 |
ENSRNOT00000056639
|
Chfr
|
checkpoint with forkhead and ring finger domains |
| chr1_+_80880856 | 3.71 |
ENSRNOT00000026060
|
Ceacam20
|
carcinoembryonic antigen-related cell adhesion molecule 20 |
| chr9_-_70450170 | 3.60 |
ENSRNOT00000017207
|
Mdh1b
|
malate dehydrogenase 1B |
| chr12_-_30083824 | 3.59 |
ENSRNOT00000084968
|
Tpst1
|
tyrosylprotein sulfotransferase 1 |
| chr6_-_140102325 | 3.57 |
ENSRNOT00000072238
|
AABR07065750.2
|
|
| chr11_-_61530567 | 3.56 |
ENSRNOT00000076277
|
Naa50
|
N(alpha)-acetyltransferase 50, NatE catalytic subunit |
| chr16_-_81309954 | 3.56 |
ENSRNOT00000092361
|
LOC290876
|
similar to RIKEN cDNA 1700029H14 |
| chr4_+_159410799 | 3.55 |
ENSRNOT00000079225
|
Akap3
|
A-kinase anchoring protein 3 |
| chr7_+_54859326 | 3.50 |
ENSRNOT00000039141
|
Caps2
|
calcyphosine 2 |
| chr18_-_40134504 | 3.49 |
ENSRNOT00000022294
|
Trim36
|
tripartite motif-containing 36 |
| chr9_-_82195722 | 3.45 |
ENSRNOT00000077085
ENSRNOT00000084276 |
Cfap65
|
cilia and flagella associated protein 65 |
| chr10_+_38104558 | 3.44 |
ENSRNOT00000067809
|
Fstl4
|
follistatin-like 4 |
| chr13_-_36174908 | 3.42 |
ENSRNOT00000072295
|
Dbi
|
diazepam binding inhibitor, acyl-CoA binding protein |
| chr1_-_189238776 | 3.34 |
ENSRNOT00000020817
|
Pdilt
|
protein disulfide isomerase-like, testis expressed |
| chr3_-_149356160 | 3.33 |
ENSRNOT00000037589
ENSRNOT00000081775 |
Sun5
|
Sad1 and UNC84 domain containing 5 |
| chr16_+_3851270 | 3.30 |
ENSRNOT00000014964
|
Plac9
|
placenta-specific 9 |
| chr1_+_81474553 | 3.29 |
ENSRNOT00000083493
|
Phldb3
|
pleckstrin homology-like domain, family B, member 3 |
| chr1_-_212021567 | 3.28 |
ENSRNOT00000029027
|
Cfap46
|
cilia and flagella associated protein 46 |
| chr3_+_56766475 | 3.27 |
ENSRNOT00000078819
|
Sp5
|
Sp5 transcription factor |
| chr8_-_27907911 | 3.26 |
ENSRNOT00000010045
|
Glb1l3
|
galactosidase, beta 1-like 3 |
| chr4_-_39711271 | 3.24 |
ENSRNOT00000029602
|
Vwde
|
von Willebrand factor D and EGF domains |
| chr10_-_87232723 | 3.23 |
ENSRNOT00000015150
|
Krt25
|
keratin 25 |
| chr2_+_154921999 | 3.23 |
ENSRNOT00000057620
|
LOC691044
|
similar to GTPase activating protein testicular GAP1 |
| chr19_-_38120578 | 3.22 |
ENSRNOT00000026873
|
Esrp2
|
epithelial splicing regulatory protein 2 |
| chr10_-_91291774 | 3.19 |
ENSRNOT00000004356
|
LOC100361655
|
rCG33642-like |
| chr10_-_87346062 | 3.17 |
ENSRNOT00000077397
|
Krt20
|
keratin 20 |
| chr9_-_70449796 | 3.15 |
ENSRNOT00000086391
|
Mdh1b
|
malate dehydrogenase 1B |
| chr3_+_80021440 | 3.13 |
ENSRNOT00000018620
|
Acp2
|
acid phosphatase 2, lysosomal |
| chr10_+_97212432 | 3.13 |
ENSRNOT00000088599
|
Axin2
|
axin 2 |
| chr6_-_138536162 | 3.11 |
ENSRNOT00000083031
|
AABR07065643.1
|
|
| chr10_-_37645802 | 3.11 |
ENSRNOT00000008022
|
Tcf7
|
transcription factor 7 (T-cell specific, HMG-box) |
| chr8_+_56451240 | 3.09 |
ENSRNOT00000085278
|
LOC100359687
|
mitochondrial ribosomal protein L1-like |
| chr4_+_82370997 | 3.09 |
ENSRNOT00000072934
|
NEWGENE_1565788
|
even-skipped homeobox 1 |
| chr2_+_222021103 | 3.07 |
ENSRNOT00000086125
|
Dpyd
|
dihydropyrimidine dehydrogenase |
| chr1_-_101210675 | 3.07 |
ENSRNOT00000028082
|
Dkkl1
|
dickkopf like acrosomal protein 1 |
| chr10_-_93679974 | 3.06 |
ENSRNOT00000009316
|
March10
|
membrane associated ring-CH-type finger 10 |
| chr1_-_54854353 | 3.05 |
ENSRNOT00000072895
|
Smok2a
|
sperm motility kinase 2A |
| chr4_+_149908375 | 3.04 |
ENSRNOT00000019504
|
LOC100909657
|
uncharacterized LOC100909657 |
| chr5_+_160095427 | 3.02 |
ENSRNOT00000077609
|
AABR07050298.1
|
|
| chr2_+_237679792 | 3.02 |
ENSRNOT00000064628
|
Gimd1
|
GIMAP family P-loop NTPase domain containing 1 |
| chr7_+_37812831 | 3.01 |
ENSRNOT00000005910
|
Btg1
|
BTG anti-proliferation factor 1 |
| chr7_-_49732764 | 3.00 |
ENSRNOT00000006453
|
Myf5
|
myogenic factor 5 |
| chrX_+_63897664 | 2.99 |
ENSRNOT00000089271
|
LOC103694487
|
protein gar2-like |
| chr1_+_185863043 | 2.94 |
ENSRNOT00000079072
|
Sox6
|
SRY box 6 |
| chr6_+_26546924 | 2.94 |
ENSRNOT00000007763
|
Eif2b4
|
eukaryotic translation initiation factor 2B subunit delta |
| chr8_+_118744229 | 2.93 |
ENSRNOT00000028364
|
Kif9
|
kinesin family member 9 |
| chr6_-_61405195 | 2.90 |
ENSRNOT00000008655
|
Lrrn3
|
leucine rich repeat neuronal 3 |
| chr17_-_43543172 | 2.87 |
ENSRNOT00000080684
ENSRNOT00000029626 ENSRNOT00000082719 |
Slc17a3
|
solute carrier family 17 member 3 |
| chr1_+_252409268 | 2.86 |
ENSRNOT00000026219
|
Lipm
|
lipase, family member M |
| chr1_-_275882444 | 2.84 |
ENSRNOT00000083215
|
Gpam
|
glycerol-3-phosphate acyltransferase, mitochondrial |
| chr2_+_188449718 | 2.80 |
ENSRNOT00000065791
|
Pklr
|
pyruvate kinase, liver and RBC |
| chr2_-_90568486 | 2.80 |
ENSRNOT00000059380
|
LOC100910852
|
uncharacterized LOC100910852 |
| chr1_+_202432366 | 2.80 |
ENSRNOT00000027681
|
Plpp4
|
phospholipid phosphatase 4 |
| chr6_+_1147012 | 2.79 |
ENSRNOT00000006360
|
Vit
|
vitrin |
| chr1_-_31936537 | 2.78 |
ENSRNOT00000060971
|
Zdhhc11
|
zinc finger, DHHC-type containing 11 |
| chr18_+_16616937 | 2.77 |
ENSRNOT00000093641
|
Mocos
|
molybdenum cofactor sulfurase |
| chr9_-_104700609 | 2.76 |
ENSRNOT00000081815
ENSRNOT00000018503 |
Slco6c1
|
solute carrier organic anion transporter family, member 6c1 |
| chr6_-_86223052 | 2.74 |
ENSRNOT00000046828
|
Fscb
|
fibrous sheath CABYR binding protein |
| chr2_+_180936688 | 2.74 |
ENSRNOT00000016039
|
Asic5
|
acid sensing ion channel subunit family member 5 |
| chr6_-_138536321 | 2.71 |
ENSRNOT00000077743
|
AABR07065643.1
|
|
| chrX_+_62282212 | 2.70 |
ENSRNOT00000039568
|
AABR07038837.1
|
|
| chr2_+_187951344 | 2.70 |
ENSRNOT00000027123
|
Ssr2
|
signal sequence receptor, beta |
| chr14_-_18839595 | 2.67 |
ENSRNOT00000078746
|
Cxcl3
|
chemokine (C-X-C motif) ligand 3 |
| chr5_+_153976535 | 2.67 |
ENSRNOT00000030881
|
LOC500567
|
similar to RIKEN cDNA 1700029M20 |
| chr1_+_203509731 | 2.66 |
ENSRNOT00000028007
|
Hmx3
|
H6 family homeobox 3 |
| chr10_+_89286047 | 2.65 |
ENSRNOT00000085831
|
G6pc
|
glucose-6-phosphatase, catalytic subunit |
| chr1_+_80973739 | 2.65 |
ENSRNOT00000026088
ENSRNOT00000081983 |
AC118165.1
|
|
| chr6_-_139973811 | 2.65 |
ENSRNOT00000082875
|
Ighv5-2
|
immunoglobulin heavy variable 5-2 |
| chr16_-_12662336 | 2.64 |
ENSRNOT00000080161
|
RGD1559508
|
similar to hypothetical protein 4930474N05 |
| chr4_-_50200328 | 2.60 |
ENSRNOT00000060530
|
Aass
|
aminoadipate-semialdehyde synthase |
| chr5_+_74766636 | 2.60 |
ENSRNOT00000030913
|
Rn50_5_0791.1
|
|
| chr4_+_149261044 | 2.60 |
ENSRNOT00000066670
|
Cxcl12
|
C-X-C motif chemokine ligand 12 |
| chr6_-_27512287 | 2.60 |
ENSRNOT00000085937
ENSRNOT00000081278 ENSRNOT00000081323 |
Selenoi
|
selenoprotein I |
| chr2_-_243475639 | 2.59 |
ENSRNOT00000089222
|
RGD1309170
|
similar to hypothetical protein DKFZp434G072 |
| chr11_-_61530830 | 2.57 |
ENSRNOT00000059666
ENSRNOT00000068345 |
Naa50
|
N(alpha)-acetyltransferase 50, NatE catalytic subunit |
| chr7_+_143092511 | 2.55 |
ENSRNOT00000084223
|
RGD1305207
|
similar to RIKEN cDNA 1700011A15 |
| chr16_-_7406951 | 2.55 |
ENSRNOT00000066508
|
Dnah1
|
dynein, axonemal, heavy chain 1 |
| chr13_-_90641772 | 2.53 |
ENSRNOT00000064601
|
Atp1a4
|
ATPase Na+/K+ transporting subunit alpha 4 |
| chrX_-_63999622 | 2.52 |
ENSRNOT00000090902
|
LOC103694487
|
protein gar2-like |
| chr9_-_50820290 | 2.49 |
ENSRNOT00000050748
|
LOC102548013
|
uncharacterized LOC102548013 |
| chr14_+_9555264 | 2.49 |
ENSRNOT00000002928
|
Nkx6-1
|
NK6 homeobox 1 |
| chr9_+_100137881 | 2.46 |
ENSRNOT00000036328
|
Gpr35
|
G protein-coupled receptor 35 |
| chr10_+_87774552 | 2.45 |
ENSRNOT00000044342
|
Krtap9-1
|
keratin associated protein 9-1 |
| chr4_+_1470716 | 2.45 |
ENSRNOT00000044223
|
Olr1235
|
olfactory receptor 1235 |
Network of associatons between targets according to the STRING database.

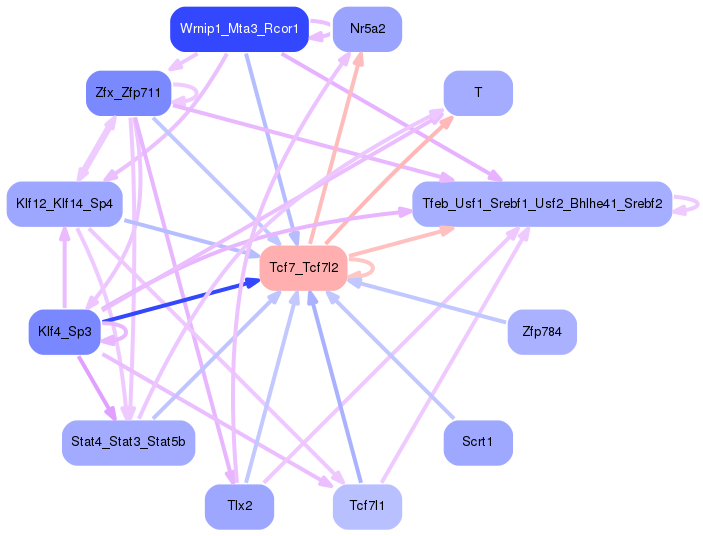
First level regulatory network of Tcf7_Tcf7l2
Gene Ontology Analysis
Gene overrepresentation in biological process category:
| Log-likelihood per target | Total log-likelihood | Term | Description |
|---|---|---|---|
| 7.9 | 23.8 | GO:0051977 | lysophospholipid transport(GO:0051977) |
| 5.7 | 17.1 | GO:0001905 | activation of membrane attack complex(GO:0001905) regulation of activation of membrane attack complex(GO:0001969) |
| 5.1 | 20.3 | GO:0019483 | beta-alanine biosynthetic process(GO:0019483) |
| 3.6 | 10.9 | GO:0032290 | peripheral nervous system myelin formation(GO:0032290) |
| 3.6 | 36.0 | GO:0018298 | protein-chromophore linkage(GO:0018298) |
| 3.6 | 10.8 | GO:0034445 | regulation of plasma lipoprotein particle oxidation(GO:0034444) negative regulation of plasma lipoprotein particle oxidation(GO:0034445) multicellular organism lipid catabolic process(GO:0044240) |
| 3.5 | 17.6 | GO:0006548 | histidine catabolic process(GO:0006548) |
| 3.4 | 10.2 | GO:0002254 | kinin cascade(GO:0002254) plasma kallikrein-kinin cascade(GO:0002353) activation of plasma proteins involved in acute inflammatory response(GO:0002541) |
| 3.3 | 13.2 | GO:0042853 | L-alanine catabolic process(GO:0042853) |
| 2.6 | 10.5 | GO:0014028 | positive regulation of transcription from RNA polymerase II promoter involved in myocardial precursor cell differentiation(GO:0003257) notochord formation(GO:0014028) |
| 2.6 | 13.1 | GO:0006526 | arginine biosynthetic process(GO:0006526) |
| 2.6 | 15.6 | GO:0006572 | tyrosine catabolic process(GO:0006572) |
| 2.5 | 28.0 | GO:0006707 | cholesterol catabolic process(GO:0006707) sterol catabolic process(GO:0016127) |
| 2.3 | 27.3 | GO:0042159 | lipoprotein catabolic process(GO:0042159) |
| 2.2 | 6.5 | GO:0071400 | cellular response to oleic acid(GO:0071400) |
| 1.9 | 7.6 | GO:0002933 | lipid hydroxylation(GO:0002933) alkaloid catabolic process(GO:0009822) |
| 1.7 | 5.2 | GO:0046167 | glycerol-3-phosphate biosynthetic process(GO:0046167) |
| 1.7 | 10.0 | GO:0010760 | negative regulation of macrophage chemotaxis(GO:0010760) |
| 1.7 | 8.3 | GO:0061113 | pancreas morphogenesis(GO:0061113) |
| 1.5 | 12.2 | GO:0006776 | vitamin A metabolic process(GO:0006776) |
| 1.5 | 5.9 | GO:0016098 | monoterpenoid metabolic process(GO:0016098) |
| 1.4 | 4.2 | GO:0090172 | microtubule cytoskeleton organization involved in homologous chromosome segregation(GO:0090172) |
| 1.4 | 5.6 | GO:0006546 | glycine catabolic process(GO:0006546) glycine decarboxylation via glycine cleavage system(GO:0019464) |
| 1.4 | 5.5 | GO:0046351 | disaccharide biosynthetic process(GO:0046351) |
| 1.3 | 11.9 | GO:0052697 | xenobiotic glucuronidation(GO:0052697) |
| 1.2 | 3.6 | GO:0006478 | peptidyl-tyrosine sulfation(GO:0006478) |
| 1.2 | 5.8 | GO:0034287 | detection of carbohydrate stimulus(GO:0009730) detection of hexose stimulus(GO:0009732) detection of monosaccharide stimulus(GO:0034287) detection of glucose(GO:0051594) |
| 1.1 | 7.8 | GO:0007290 | spermatid nucleus elongation(GO:0007290) |
| 1.1 | 4.4 | GO:1903334 | positive regulation of protein folding(GO:1903334) |
| 1.0 | 3.1 | GO:0070602 | regulation of mismatch repair(GO:0032423) regulation of chondrocyte development(GO:0061181) regulation of centromeric sister chromatid cohesion(GO:0070602) negative regulation of Wnt signaling pathway involved in dorsal/ventral axis specification(GO:2000054) |
| 1.0 | 8.3 | GO:0042866 | pyruvate biosynthetic process(GO:0042866) |
| 1.0 | 6.1 | GO:0070601 | centromeric sister chromatid cohesion(GO:0070601) |
| 1.0 | 17.7 | GO:0046415 | urate metabolic process(GO:0046415) |
| 0.9 | 2.6 | GO:0033512 | L-lysine catabolic process to acetyl-CoA via saccharopine(GO:0033512) |
| 0.9 | 3.4 | GO:0036151 | phosphatidylcholine acyl-chain remodeling(GO:0036151) |
| 0.8 | 4.1 | GO:0001757 | somite specification(GO:0001757) |
| 0.8 | 4.7 | GO:0034059 | response to anoxia(GO:0034059) |
| 0.8 | 3.1 | GO:0030538 | embryonic genitalia morphogenesis(GO:0030538) |
| 0.7 | 7.2 | GO:0006348 | chromatin silencing at telomere(GO:0006348) |
| 0.7 | 9.3 | GO:0001778 | plasma membrane repair(GO:0001778) |
| 0.7 | 6.3 | GO:0003062 | regulation of heart rate by chemical signal(GO:0003062) |
| 0.7 | 14.6 | GO:0033327 | Leydig cell differentiation(GO:0033327) |
| 0.7 | 10.3 | GO:0006646 | phosphatidylethanolamine biosynthetic process(GO:0006646) |
| 0.7 | 6.2 | GO:0048208 | vesicle targeting, rough ER to cis-Golgi(GO:0048207) COPII vesicle coating(GO:0048208) |
| 0.7 | 2.0 | GO:0060266 | negative regulation of NAD(P)H oxidase activity(GO:0033861) negative regulation of respiratory burst involved in inflammatory response(GO:0060266) |
| 0.6 | 2.6 | GO:1990478 | response to ultrasound(GO:1990478) |
| 0.6 | 1.8 | GO:0010157 | response to chlorate(GO:0010157) |
| 0.6 | 2.3 | GO:0021633 | optic nerve structural organization(GO:0021633) |
| 0.6 | 6.7 | GO:0006108 | malate metabolic process(GO:0006108) |
| 0.5 | 2.7 | GO:0021778 | oligodendrocyte cell fate specification(GO:0021778) oligodendrocyte cell fate commitment(GO:0021779) glial cell fate specification(GO:0021780) |
| 0.5 | 7.5 | GO:0001867 | complement activation, lectin pathway(GO:0001867) |
| 0.5 | 3.1 | GO:0031120 | snRNA pseudouridine synthesis(GO:0031120) |
| 0.5 | 1.5 | GO:0060974 | cell migration involved in heart formation(GO:0060974) regulation of heart induction by regulation of canonical Wnt signaling pathway(GO:0090081) |
| 0.5 | 2.5 | GO:0021913 | regulation of transcription from RNA polymerase II promoter involved in spinal cord motor neuron fate specification(GO:0021912) regulation of transcription from RNA polymerase II promoter involved in ventral spinal cord interneuron specification(GO:0021913) |
| 0.5 | 2.9 | GO:1905098 | negative regulation of guanyl-nucleotide exchange factor activity(GO:1905098) |
| 0.5 | 1.9 | GO:0010609 | mRNA localization resulting in posttranscriptional regulation of gene expression(GO:0010609) positive regulation of DNA damage response, signal transduction by p53 class mediator resulting in transcription of p21 class mediator(GO:1902164) |
| 0.5 | 12.0 | GO:0045793 | positive regulation of cell size(GO:0045793) |
| 0.5 | 9.9 | GO:0042730 | fibrinolysis(GO:0042730) |
| 0.5 | 1.9 | GO:1902741 | type I interferon secretion(GO:0072641) interferon-alpha secretion(GO:0072642) regulation of interferon-alpha secretion(GO:1902739) positive regulation of interferon-alpha secretion(GO:1902741) |
| 0.5 | 4.5 | GO:2000271 | positive regulation of fibroblast apoptotic process(GO:2000271) |
| 0.4 | 2.2 | GO:0006030 | chitin metabolic process(GO:0006030) chitin catabolic process(GO:0006032) |
| 0.4 | 2.2 | GO:0021650 | vestibulocochlear nerve formation(GO:0021650) |
| 0.4 | 3.4 | GO:0031547 | brain-derived neurotrophic factor receptor signaling pathway(GO:0031547) |
| 0.4 | 8.5 | GO:0035404 | histone-serine phosphorylation(GO:0035404) |
| 0.4 | 3.3 | GO:0090286 | cytoskeletal anchoring at nuclear membrane(GO:0090286) |
| 0.4 | 1.2 | GO:0002780 | antimicrobial peptide biosynthetic process(GO:0002777) antibacterial peptide biosynthetic process(GO:0002780) |
| 0.4 | 26.8 | GO:0003341 | cilium movement(GO:0003341) |
| 0.4 | 1.1 | GO:0016267 | O-glycan processing, core 1(GO:0016267) |
| 0.4 | 1.1 | GO:0033563 | dorsal/ventral axon guidance(GO:0033563) |
| 0.4 | 12.5 | GO:0030212 | hyaluronan metabolic process(GO:0030212) |
| 0.4 | 1.5 | GO:0001834 | trophectodermal cell proliferation(GO:0001834) Cajal body organization(GO:0030576) |
| 0.3 | 13.8 | GO:0018149 | peptide cross-linking(GO:0018149) |
| 0.3 | 1.0 | GO:0070175 | positive regulation of enamel mineralization(GO:0070175) |
| 0.3 | 4.3 | GO:0051546 | keratinocyte migration(GO:0051546) |
| 0.3 | 2.3 | GO:0070562 | regulation of vitamin D receptor signaling pathway(GO:0070562) |
| 0.3 | 22.9 | GO:0070098 | chemokine-mediated signaling pathway(GO:0070098) |
| 0.3 | 2.6 | GO:0001920 | negative regulation of receptor recycling(GO:0001920) |
| 0.3 | 1.0 | GO:0048749 | compound eye development(GO:0048749) |
| 0.3 | 2.8 | GO:0016024 | CDP-diacylglycerol biosynthetic process(GO:0016024) |
| 0.3 | 2.2 | GO:0010587 | miRNA catabolic process(GO:0010587) |
| 0.3 | 3.1 | GO:0048102 | autophagic cell death(GO:0048102) |
| 0.3 | 1.2 | GO:0019072 | viral genome packaging(GO:0019072) viral RNA genome packaging(GO:0019074) |
| 0.3 | 1.2 | GO:0014834 | skeletal muscle satellite cell maintenance involved in skeletal muscle regeneration(GO:0014834) |
| 0.3 | 2.2 | GO:0046116 | queuosine biosynthetic process(GO:0008616) queuosine metabolic process(GO:0046116) |
| 0.3 | 1.6 | GO:1903896 | positive regulation of IRE1-mediated unfolded protein response(GO:1903896) positive regulation of PERK-mediated unfolded protein response(GO:1903899) |
| 0.3 | 1.9 | GO:0030035 | microspike assembly(GO:0030035) |
| 0.3 | 6.4 | GO:0045109 | intermediate filament organization(GO:0045109) |
| 0.3 | 2.1 | GO:0014029 | neural crest formation(GO:0014029) |
| 0.3 | 0.8 | GO:0050968 | detection of chemical stimulus involved in sensory perception of pain(GO:0050968) |
| 0.3 | 2.8 | GO:0006777 | Mo-molybdopterin cofactor biosynthetic process(GO:0006777) Mo-molybdopterin cofactor metabolic process(GO:0019720) |
| 0.3 | 1.5 | GO:0090367 | negative regulation of mRNA modification(GO:0090367) |
| 0.2 | 1.0 | GO:0021526 | medial motor column neuron differentiation(GO:0021526) |
| 0.2 | 3.3 | GO:0019511 | peptidyl-proline hydroxylation(GO:0019511) |
| 0.2 | 28.7 | GO:0031638 | zymogen activation(GO:0031638) |
| 0.2 | 1.4 | GO:0048386 | positive regulation of retinoic acid receptor signaling pathway(GO:0048386) |
| 0.2 | 0.7 | GO:2000872 | positive regulation of progesterone secretion(GO:2000872) |
| 0.2 | 1.5 | GO:0098792 | xenophagy(GO:0098792) |
| 0.2 | 2.0 | GO:0010572 | positive regulation of platelet activation(GO:0010572) |
| 0.2 | 1.9 | GO:1904424 | regulation of GTP binding(GO:1904424) |
| 0.2 | 1.3 | GO:0021902 | commitment of neuronal cell to specific neuron type in forebrain(GO:0021902) |
| 0.2 | 0.6 | GO:0035938 | estrogen secretion(GO:0035937) estradiol secretion(GO:0035938) regulation of estrogen secretion(GO:2000861) regulation of estradiol secretion(GO:2000864) |
| 0.2 | 1.3 | GO:0070417 | cellular response to cold(GO:0070417) |
| 0.2 | 0.6 | GO:1901165 | positive regulation of trophoblast cell migration(GO:1901165) |
| 0.2 | 1.1 | GO:0035331 | negative regulation of hippo signaling(GO:0035331) |
| 0.2 | 2.5 | GO:0010248 | establishment or maintenance of transmembrane electrochemical gradient(GO:0010248) |
| 0.2 | 1.2 | GO:0071000 | response to magnetism(GO:0071000) |
| 0.2 | 43.2 | GO:0010951 | negative regulation of endopeptidase activity(GO:0010951) |
| 0.2 | 2.2 | GO:0090161 | Golgi ribbon formation(GO:0090161) |
| 0.2 | 1.7 | GO:0030259 | lipid glycosylation(GO:0030259) |
| 0.2 | 4.6 | GO:0007340 | acrosome reaction(GO:0007340) |
| 0.2 | 3.2 | GO:0060445 | branching involved in salivary gland morphogenesis(GO:0060445) |
| 0.1 | 0.4 | GO:0038044 | transforming growth factor-beta secretion(GO:0038044) |
| 0.1 | 0.6 | GO:0098989 | NMDA selective glutamate receptor signaling pathway(GO:0098989) |
| 0.1 | 1.4 | GO:0007379 | segment specification(GO:0007379) |
| 0.1 | 6.9 | GO:0010862 | positive regulation of pathway-restricted SMAD protein phosphorylation(GO:0010862) |
| 0.1 | 7.7 | GO:0019369 | arachidonic acid metabolic process(GO:0019369) |
| 0.1 | 2.5 | GO:0050910 | detection of mechanical stimulus involved in sensory perception of sound(GO:0050910) |
| 0.1 | 0.8 | GO:0019695 | choline metabolic process(GO:0019695) |
| 0.1 | 2.2 | GO:0034587 | piRNA metabolic process(GO:0034587) |
| 0.1 | 2.0 | GO:0006613 | cotranslational protein targeting to membrane(GO:0006613) |
| 0.1 | 1.1 | GO:0002002 | regulation of angiotensin levels in blood(GO:0002002) |
| 0.1 | 1.6 | GO:0006544 | glycine metabolic process(GO:0006544) |
| 0.1 | 1.2 | GO:0016188 | synaptic vesicle maturation(GO:0016188) |
| 0.1 | 1.8 | GO:0001675 | acrosome assembly(GO:0001675) |
| 0.1 | 1.6 | GO:1901741 | positive regulation of myoblast fusion(GO:1901741) |
| 0.1 | 0.3 | GO:0044726 | protection of DNA demethylation of female pronucleus(GO:0044726) |
| 0.1 | 1.5 | GO:0035269 | protein O-linked mannosylation(GO:0035269) |
| 0.1 | 0.5 | GO:0033227 | dsRNA transport(GO:0033227) |
| 0.1 | 2.0 | GO:0006692 | prostanoid metabolic process(GO:0006692) prostaglandin metabolic process(GO:0006693) |
| 0.1 | 0.5 | GO:0030263 | apoptotic chromosome condensation(GO:0030263) |
| 0.1 | 6.6 | GO:0032436 | positive regulation of proteasomal ubiquitin-dependent protein catabolic process(GO:0032436) |
| 0.1 | 0.4 | GO:0002091 | negative regulation of receptor internalization(GO:0002091) |
| 0.1 | 1.0 | GO:0016973 | poly(A)+ mRNA export from nucleus(GO:0016973) |
| 0.1 | 1.6 | GO:0031295 | T cell costimulation(GO:0031295) |
| 0.1 | 0.4 | GO:0070827 | chromatin maintenance(GO:0070827) |
| 0.1 | 0.3 | GO:0003219 | cardiac right ventricle formation(GO:0003219) |
| 0.1 | 0.3 | GO:0044313 | protein K6-linked deubiquitination(GO:0044313) |
| 0.1 | 1.7 | GO:0009584 | detection of visible light(GO:0009584) |
| 0.1 | 1.7 | GO:0045746 | negative regulation of Notch signaling pathway(GO:0045746) |
| 0.1 | 3.8 | GO:0015914 | phospholipid transport(GO:0015914) |
| 0.1 | 1.9 | GO:0001569 | patterning of blood vessels(GO:0001569) |
| 0.1 | 1.9 | GO:0045672 | positive regulation of osteoclast differentiation(GO:0045672) |
| 0.1 | 0.9 | GO:0031468 | nuclear envelope reassembly(GO:0031468) |
| 0.1 | 2.3 | GO:0046839 | phospholipid dephosphorylation(GO:0046839) |
| 0.1 | 2.7 | GO:0007566 | embryo implantation(GO:0007566) |
| 0.1 | 1.6 | GO:0031146 | SCF-dependent proteasomal ubiquitin-dependent protein catabolic process(GO:0031146) |
| 0.1 | 1.3 | GO:0045103 | intermediate filament-based process(GO:0045103) |
| 0.1 | 0.8 | GO:0006027 | glycosaminoglycan catabolic process(GO:0006027) |
| 0.1 | 10.0 | GO:0007018 | microtubule-based movement(GO:0007018) |
| 0.0 | 0.3 | GO:0070286 | axonemal dynein complex assembly(GO:0070286) |
| 0.0 | 0.6 | GO:0042407 | cristae formation(GO:0042407) |
| 0.0 | 0.2 | GO:1990928 | response to amino acid starvation(GO:1990928) |
| 0.0 | 0.4 | GO:0038063 | collagen-activated tyrosine kinase receptor signaling pathway(GO:0038063) negative regulation of platelet aggregation(GO:0090331) |
| 0.0 | 0.2 | GO:0090666 | scaRNA localization to Cajal body(GO:0090666) |
| 0.0 | 0.2 | GO:0038110 | interleukin-2-mediated signaling pathway(GO:0038110) |
| 0.0 | 0.1 | GO:0019086 | late viral transcription(GO:0019086) |
| 0.0 | 1.1 | GO:0007413 | axonal fasciculation(GO:0007413) |
| 0.0 | 1.8 | GO:0006368 | transcription elongation from RNA polymerase II promoter(GO:0006368) |
| 0.0 | 0.1 | GO:1903215 | negative regulation of protein targeting to mitochondrion(GO:1903215) |
| 0.0 | 5.4 | GO:0016485 | protein processing(GO:0016485) |
| 0.0 | 1.1 | GO:0060292 | long term synaptic depression(GO:0060292) |
| 0.0 | 1.1 | GO:0046627 | negative regulation of insulin receptor signaling pathway(GO:0046627) |
| 0.0 | 0.3 | GO:0070131 | positive regulation of mitochondrial translation(GO:0070131) |
| 0.0 | 0.4 | GO:0048368 | lateral mesoderm development(GO:0048368) |
| 0.0 | 0.4 | GO:0006388 | tRNA splicing, via endonucleolytic cleavage and ligation(GO:0006388) |
| 0.0 | 0.7 | GO:0030199 | collagen fibril organization(GO:0030199) |
| 0.0 | 2.4 | GO:0060349 | bone morphogenesis(GO:0060349) |
| 0.0 | 0.1 | GO:0016240 | autophagosome docking(GO:0016240) |
| 0.0 | 1.1 | GO:2001222 | regulation of neuron migration(GO:2001222) |
| 0.0 | 1.5 | GO:0072332 | intrinsic apoptotic signaling pathway by p53 class mediator(GO:0072332) |
| 0.0 | 0.6 | GO:0035987 | endodermal cell differentiation(GO:0035987) |
| 0.0 | 0.2 | GO:0032790 | ribosome disassembly(GO:0032790) |
| 0.0 | 0.8 | GO:0050873 | brown fat cell differentiation(GO:0050873) |
| 0.0 | 2.0 | GO:0007218 | neuropeptide signaling pathway(GO:0007218) |
| 0.0 | 0.4 | GO:0070536 | protein K63-linked deubiquitination(GO:0070536) |
| 0.0 | 0.9 | GO:0051057 | positive regulation of small GTPase mediated signal transduction(GO:0051057) |
| 0.0 | 1.3 | GO:0006888 | ER to Golgi vesicle-mediated transport(GO:0006888) |
| 0.0 | 0.6 | GO:0045600 | positive regulation of fat cell differentiation(GO:0045600) |
| 0.0 | 0.4 | GO:0050869 | negative regulation of B cell activation(GO:0050869) |
| 0.0 | 0.9 | GO:0006414 | translational elongation(GO:0006414) |
| 0.0 | 0.4 | GO:0007031 | peroxisome organization(GO:0007031) |
| 0.0 | 14.5 | GO:0050911 | detection of chemical stimulus involved in sensory perception of smell(GO:0050911) |
Gene overrepresentation in cellular component category:
| Log-likelihood per target | Total log-likelihood | Term | Description |
|---|---|---|---|
| 2.8 | 16.6 | GO:0005879 | axonemal microtubule(GO:0005879) |
| 1.5 | 4.6 | GO:0005960 | glycine cleavage complex(GO:0005960) |
| 1.4 | 10.0 | GO:0005579 | membrane attack complex(GO:0005579) |
| 1.4 | 14.0 | GO:0045179 | apical cortex(GO:0045179) |
| 1.2 | 4.9 | GO:0036156 | inner dynein arm(GO:0036156) |
| 1.0 | 9.3 | GO:0005826 | actomyosin contractile ring(GO:0005826) |
| 1.0 | 126.0 | GO:0072562 | blood microparticle(GO:0072562) |
| 0.9 | 4.7 | GO:0072557 | IPAF inflammasome complex(GO:0072557) AIM2 inflammasome complex(GO:0097169) |
| 0.9 | 6.5 | GO:0005858 | axonemal dynein complex(GO:0005858) |
| 0.9 | 6.1 | GO:0031415 | NatA complex(GO:0031415) |
| 0.7 | 17.4 | GO:0001533 | cornified envelope(GO:0001533) |
| 0.6 | 4.2 | GO:0034992 | microtubule organizing center attachment site(GO:0034992) LINC complex(GO:0034993) |
| 0.6 | 4.1 | GO:1990357 | terminal web(GO:1990357) |
| 0.5 | 15.9 | GO:0097228 | sperm principal piece(GO:0097228) |
| 0.5 | 2.0 | GO:0031092 | platelet alpha granule membrane(GO:0031092) |
| 0.5 | 1.5 | GO:1990826 | nucleoplasmic periphery of the nuclear pore complex(GO:1990826) |
| 0.5 | 2.9 | GO:0005851 | eukaryotic translation initiation factor 2B complex(GO:0005851) |
| 0.5 | 8.5 | GO:0031588 | nucleotide-activated protein kinase complex(GO:0031588) |
| 0.4 | 30.0 | GO:0045095 | keratin filament(GO:0045095) |
| 0.4 | 7.2 | GO:0048188 | Set1C/COMPASS complex(GO:0048188) |
| 0.4 | 4.4 | GO:0034663 | endoplasmic reticulum chaperone complex(GO:0034663) |
| 0.4 | 2.2 | GO:0071547 | piP-body(GO:0071547) |
| 0.3 | 3.1 | GO:0031429 | box H/ACA snoRNP complex(GO:0031429) box H/ACA RNP complex(GO:0072588) |
| 0.3 | 8.5 | GO:0012507 | ER to Golgi transport vesicle membrane(GO:0012507) |
| 0.3 | 12.2 | GO:0005771 | multivesicular body(GO:0005771) |
| 0.3 | 0.9 | GO:0005853 | eukaryotic translation elongation factor 1 complex(GO:0005853) |
| 0.3 | 1.4 | GO:0031315 | extrinsic component of mitochondrial outer membrane(GO:0031315) |
| 0.3 | 0.8 | GO:0031372 | UBC13-MMS2 complex(GO:0031372) |
| 0.3 | 1.3 | GO:0070552 | BRISC complex(GO:0070552) |
| 0.3 | 3.1 | GO:0043202 | lysosomal lumen(GO:0043202) |
| 0.3 | 18.7 | GO:0005882 | intermediate filament(GO:0005882) |
| 0.2 | 3.5 | GO:0045180 | basal cortex(GO:0045180) |
| 0.2 | 1.5 | GO:0097504 | Gemini of coiled bodies(GO:0097504) |
| 0.2 | 2.5 | GO:0005890 | sodium:potassium-exchanging ATPase complex(GO:0005890) |
| 0.2 | 3.8 | GO:0005614 | interstitial matrix(GO:0005614) |
| 0.2 | 12.4 | GO:0005778 | peroxisomal membrane(GO:0005778) microbody membrane(GO:0031903) |
| 0.2 | 0.5 | GO:0061574 | ASAP complex(GO:0061574) |
| 0.2 | 3.4 | GO:0097038 | perinuclear endoplasmic reticulum(GO:0097038) |
| 0.2 | 1.5 | GO:0044352 | pinosome(GO:0044352) macropinosome(GO:0044354) |
| 0.1 | 2.3 | GO:0044224 | juxtaparanode region of axon(GO:0044224) |
| 0.1 | 1.1 | GO:0032584 | growth cone membrane(GO:0032584) |
| 0.1 | 0.4 | GO:0071149 | TEAD-2-YAP complex(GO:0071149) |
| 0.1 | 1.5 | GO:0097539 | ciliary transition fiber(GO:0097539) |
| 0.1 | 2.2 | GO:0070971 | endoplasmic reticulum exit site(GO:0070971) |
| 0.1 | 12.6 | GO:0036064 | ciliary basal body(GO:0036064) |
| 0.1 | 2.5 | GO:0005892 | acetylcholine-gated channel complex(GO:0005892) |
| 0.1 | 2.0 | GO:0005732 | small nucleolar ribonucleoprotein complex(GO:0005732) |
| 0.1 | 4.8 | GO:0032391 | photoreceptor connecting cilium(GO:0032391) |
| 0.1 | 0.5 | GO:0035985 | senescence-associated heterochromatin focus(GO:0035985) |
| 0.1 | 3.1 | GO:0005719 | nuclear euchromatin(GO:0005719) |
| 0.1 | 1.3 | GO:0043083 | synaptic cleft(GO:0043083) |
| 0.1 | 0.4 | GO:0005641 | nuclear envelope lumen(GO:0005641) |
| 0.1 | 1.2 | GO:0046581 | intercellular canaliculus(GO:0046581) |
| 0.1 | 0.6 | GO:0061617 | MICOS complex(GO:0061617) |
| 0.1 | 1.8 | GO:0002080 | acrosomal membrane(GO:0002080) |
| 0.1 | 10.4 | GO:0030176 | integral component of endoplasmic reticulum membrane(GO:0030176) |
| 0.1 | 0.3 | GO:0032044 | DSIF complex(GO:0032044) |
| 0.1 | 109.5 | GO:0005615 | extracellular space(GO:0005615) |
| 0.1 | 0.9 | GO:0031616 | spindle pole centrosome(GO:0031616) |
| 0.1 | 3.0 | GO:0005637 | nuclear inner membrane(GO:0005637) |
| 0.1 | 2.2 | GO:0001917 | photoreceptor inner segment(GO:0001917) |
| 0.1 | 1.2 | GO:0035098 | ESC/E(Z) complex(GO:0035098) |
| 0.1 | 5.1 | GO:0001669 | acrosomal vesicle(GO:0001669) |
| 0.1 | 2.0 | GO:0002102 | podosome(GO:0002102) |
| 0.0 | 4.6 | GO:0090575 | RNA polymerase II transcription factor complex(GO:0090575) |
| 0.0 | 0.4 | GO:0072669 | tRNA-splicing ligase complex(GO:0072669) |
| 0.0 | 0.4 | GO:0031597 | proteasome regulatory particle, lid subcomplex(GO:0008541) cytosolic proteasome complex(GO:0031597) |
| 0.0 | 0.7 | GO:0005845 | mRNA cap binding complex(GO:0005845) |
| 0.0 | 1.2 | GO:0001750 | photoreceptor outer segment(GO:0001750) |
| 0.0 | 2.8 | GO:0016605 | PML body(GO:0016605) |
| 0.0 | 0.1 | GO:0008024 | cyclin/CDK positive transcription elongation factor complex(GO:0008024) |
| 0.0 | 2.2 | GO:0019005 | SCF ubiquitin ligase complex(GO:0019005) |
| 0.0 | 0.2 | GO:0002199 | zona pellucida receptor complex(GO:0002199) |
| 0.0 | 0.5 | GO:0031528 | microvillus membrane(GO:0031528) |
| 0.0 | 2.0 | GO:0022627 | cytosolic small ribosomal subunit(GO:0022627) |
| 0.0 | 1.7 | GO:0032580 | Golgi cisterna membrane(GO:0032580) |
| 0.0 | 0.2 | GO:0031931 | TORC1 complex(GO:0031931) |
| 0.0 | 0.4 | GO:0005671 | Ada2/Gcn5/Ada3 transcription activator complex(GO:0005671) |
| 0.0 | 5.4 | GO:0000790 | nuclear chromatin(GO:0000790) |
| 0.0 | 1.0 | GO:0016363 | nuclear matrix(GO:0016363) |
Gene overrepresentation in molecular function category:
| Log-likelihood per target | Total log-likelihood | Term | Description |
|---|---|---|---|
| 9.3 | 28.0 | GO:0047787 | delta4-3-oxosteroid 5beta-reductase activity(GO:0047787) |
| 9.0 | 27.1 | GO:0031714 | C5a anaphylatoxin chemotactic receptor binding(GO:0031714) |
| 7.2 | 36.0 | GO:0019862 | IgA binding(GO:0019862) |
| 5.2 | 15.6 | GO:0080130 | L-phenylalanine:2-oxoglutarate aminotransferase activity(GO:0080130) |
| 4.4 | 13.2 | GO:0047635 | L-alanine:2-oxoglutarate aminotransferase activity(GO:0004021) alanine-oxo-acid transaminase activity(GO:0047635) |
| 3.8 | 11.3 | GO:0004159 | dihydrouracil dehydrogenase (NAD+) activity(GO:0004159) dihydropyrimidine dehydrogenase (NADP+) activity(GO:0017113) |
| 3.3 | 13.1 | GO:0034618 | arginine binding(GO:0034618) |
| 2.3 | 14.0 | GO:0005324 | long-chain fatty acid transporter activity(GO:0005324) |
| 2.2 | 37.9 | GO:0001972 | retinoic acid binding(GO:0001972) |
| 2.1 | 6.3 | GO:0032810 | sterol response element binding(GO:0032810) |
| 2.1 | 8.3 | GO:0004743 | pyruvate kinase activity(GO:0004743) |
| 1.7 | 5.2 | GO:0004370 | glycerol kinase activity(GO:0004370) |
| 1.7 | 5.1 | GO:0031728 | CCR3 chemokine receptor binding(GO:0031728) |
| 1.7 | 6.7 | GO:0030060 | L-malate dehydrogenase activity(GO:0030060) |
| 1.7 | 8.3 | GO:0050309 | glucose-6-phosphatase activity(GO:0004346) sugar-terminal-phosphatase activity(GO:0050309) |
| 1.6 | 9.8 | GO:0015245 | fatty acid transporter activity(GO:0015245) |
| 1.6 | 6.5 | GO:0050252 | retinol O-fatty-acyltransferase activity(GO:0050252) |
| 1.5 | 10.8 | GO:0060228 | phosphatidylcholine-sterol O-acyltransferase activator activity(GO:0060228) |
| 1.4 | 8.7 | GO:0047961 | glycine N-acyltransferase activity(GO:0047961) |
| 1.3 | 6.6 | GO:0004103 | choline kinase activity(GO:0004103) |
| 1.3 | 3.8 | GO:0004307 | ethanolaminephosphotransferase activity(GO:0004307) |
| 1.2 | 3.6 | GO:0008476 | protein-tyrosine sulfotransferase activity(GO:0008476) |
| 1.1 | 3.4 | GO:0030156 | benzodiazepine receptor binding(GO:0030156) |
| 1.0 | 5.8 | GO:0004340 | glucokinase activity(GO:0004340) hexokinase activity(GO:0004396) fructokinase activity(GO:0008865) mannokinase activity(GO:0019158) |
| 1.0 | 4.8 | GO:0032795 | heterotrimeric G-protein binding(GO:0032795) |
| 0.9 | 16.1 | GO:0043295 | glutathione binding(GO:0043295) |
| 0.8 | 11.3 | GO:0045236 | CXCR chemokine receptor binding(GO:0045236) |
| 0.8 | 9.3 | GO:0005436 | sodium:phosphate symporter activity(GO:0005436) |
| 0.7 | 2.2 | GO:0050265 | RNA uridylyltransferase activity(GO:0050265) |
| 0.7 | 2.8 | GO:0008265 | Mo-molybdopterin cofactor sulfurase activity(GO:0008265) |
| 0.7 | 3.4 | GO:0048403 | brain-derived neurotrophic factor binding(GO:0048403) |
| 0.7 | 7.5 | GO:0001846 | opsonin binding(GO:0001846) |
| 0.6 | 8.5 | GO:0004679 | AMP-activated protein kinase activity(GO:0004679) |
| 0.6 | 62.3 | GO:0004867 | serine-type endopeptidase inhibitor activity(GO:0004867) |
| 0.5 | 2.7 | GO:0015252 | hydrogen ion channel activity(GO:0015252) |
| 0.5 | 3.7 | GO:0005432 | calcium:sodium antiporter activity(GO:0005432) |
| 0.5 | 21.1 | GO:0070330 | aromatase activity(GO:0070330) |
| 0.5 | 2.0 | GO:0042806 | fucose binding(GO:0042806) |
| 0.5 | 2.0 | GO:0036132 | 13-prostaglandin reductase activity(GO:0036132) |
| 0.5 | 2.0 | GO:0005006 | epidermal growth factor-activated receptor activity(GO:0005006) |
| 0.5 | 2.8 | GO:0004366 | glycerol-3-phosphate O-acyltransferase activity(GO:0004366) |
| 0.4 | 6.1 | GO:0004596 | peptide alpha-N-acetyltransferase activity(GO:0004596) |
| 0.4 | 13.4 | GO:0015020 | glucuronosyltransferase activity(GO:0015020) |
| 0.4 | 1.7 | GO:0047276 | N-acetyllactosaminide 3-alpha-galactosyltransferase activity(GO:0047276) |
| 0.4 | 3.3 | GO:0031545 | peptidyl-proline 4-dioxygenase activity(GO:0031545) |
| 0.4 | 3.3 | GO:0004565 | beta-galactosidase activity(GO:0004565) |
| 0.4 | 2.0 | GO:0001155 | TFIIIA-class transcription factor binding(GO:0001155) |
| 0.4 | 1.2 | GO:0004736 | pyruvate carboxylase activity(GO:0004736) |
| 0.4 | 1.1 | GO:0016263 | glycoprotein-N-acetylgalactosamine 3-beta-galactosyltransferase activity(GO:0016263) |
| 0.4 | 10.0 | GO:0004950 | chemokine receptor activity(GO:0004950) |
| 0.4 | 2.2 | GO:0004568 | chitinase activity(GO:0004568) |
| 0.4 | 4.7 | GO:0097200 | cysteine-type endopeptidase activity involved in execution phase of apoptosis(GO:0097200) |
| 0.4 | 1.1 | GO:0001588 | dopamine neurotransmitter receptor activity, coupled via Gs(GO:0001588) |
| 0.4 | 9.6 | GO:0048027 | mRNA 5'-UTR binding(GO:0048027) |
| 0.3 | 17.6 | GO:0016836 | hydro-lyase activity(GO:0016836) |
| 0.3 | 3.1 | GO:0034513 | box H/ACA snoRNA binding(GO:0034513) |
| 0.3 | 7.5 | GO:0004364 | glutathione transferase activity(GO:0004364) |
| 0.3 | 2.2 | GO:1901612 | cardiolipin binding(GO:1901612) |
| 0.3 | 68.8 | GO:0004252 | serine-type endopeptidase activity(GO:0004252) |
| 0.3 | 4.0 | GO:0050308 | sugar-phosphatase activity(GO:0050308) |
| 0.3 | 1.5 | GO:0071987 | WD40-repeat domain binding(GO:0071987) |
| 0.3 | 0.9 | GO:0004522 | ribonuclease A activity(GO:0004522) |
| 0.3 | 7.2 | GO:0042800 | histone methyltransferase activity (H3-K4 specific)(GO:0042800) |
| 0.3 | 3.1 | GO:0015037 | peptide disulfide oxidoreductase activity(GO:0015037) |
| 0.3 | 2.2 | GO:0008479 | queuine tRNA-ribosyltransferase activity(GO:0008479) |
| 0.3 | 0.8 | GO:0004144 | diacylglycerol O-acyltransferase activity(GO:0004144) |
| 0.3 | 6.6 | GO:0004198 | calcium-dependent cysteine-type endopeptidase activity(GO:0004198) |
| 0.3 | 0.8 | GO:0004104 | acetylcholinesterase activity(GO:0003990) cholinesterase activity(GO:0004104) |
| 0.3 | 2.3 | GO:0034056 | estrogen response element binding(GO:0034056) |
| 0.3 | 0.8 | GO:0097603 | temperature-gated ion channel activity(GO:0097603) |
| 0.2 | 1.1 | GO:0005042 | netrin receptor activity(GO:0005042) |
| 0.2 | 3.8 | GO:0015248 | sterol transporter activity(GO:0015248) |
| 0.2 | 8.8 | GO:0001102 | RNA polymerase II activating transcription factor binding(GO:0001102) |
| 0.2 | 1.2 | GO:0070878 | primary miRNA binding(GO:0070878) |
| 0.2 | 1.5 | GO:1990247 | N6-methyladenosine-containing RNA binding(GO:1990247) |
| 0.2 | 2.5 | GO:0005391 | sodium:potassium-exchanging ATPase activity(GO:0005391) |
| 0.2 | 2.0 | GO:0004887 | thyroid hormone receptor activity(GO:0004887) |
| 0.2 | 4.2 | GO:0070840 | dynein complex binding(GO:0070840) |
| 0.2 | 9.6 | GO:0005160 | transforming growth factor beta receptor binding(GO:0005160) |
| 0.2 | 1.0 | GO:0070411 | I-SMAD binding(GO:0070411) |
| 0.2 | 9.4 | GO:0019894 | kinesin binding(GO:0019894) |
| 0.2 | 14.8 | GO:0003777 | microtubule motor activity(GO:0003777) |
| 0.2 | 3.1 | GO:0003993 | acid phosphatase activity(GO:0003993) |
| 0.2 | 2.8 | GO:0008195 | phosphatidate phosphatase activity(GO:0008195) |
| 0.2 | 4.6 | GO:0016638 | oxidoreductase activity, acting on the CH-NH2 group of donors(GO:0016638) |
| 0.2 | 10.3 | GO:0004869 | cysteine-type endopeptidase inhibitor activity(GO:0004869) |
| 0.1 | 2.5 | GO:0022848 | acetylcholine-gated cation channel activity(GO:0022848) |
| 0.1 | 0.7 | GO:0009019 | tRNA (guanine-N1-)-methyltransferase activity(GO:0009019) |
| 0.1 | 1.9 | GO:0030215 | semaphorin receptor binding(GO:0030215) |
| 0.1 | 1.2 | GO:0071253 | connexin binding(GO:0071253) |
| 0.1 | 22.5 | GO:0052689 | carboxylic ester hydrolase activity(GO:0052689) |
| 0.1 | 0.6 | GO:0099583 | neurotransmitter receptor activity involved in regulation of postsynaptic cytosolic calcium ion concentration(GO:0099583) |
| 0.1 | 2.6 | GO:0016646 | oxidoreductase activity, acting on the CH-NH group of donors, NAD or NADP as acceptor(GO:0016646) |
| 0.1 | 2.0 | GO:0097371 | MDM2/MDM4 family protein binding(GO:0097371) |
| 0.1 | 5.4 | GO:0004879 | RNA polymerase II transcription factor activity, ligand-activated sequence-specific DNA binding(GO:0004879) transcription factor activity, direct ligand regulated sequence-specific DNA binding(GO:0098531) |
| 0.1 | 4.4 | GO:0031369 | translation initiation factor binding(GO:0031369) |
| 0.1 | 4.0 | GO:0019706 | protein-cysteine S-palmitoyltransferase activity(GO:0019706) protein-cysteine S-acyltransferase activity(GO:0019707) |
| 0.1 | 14.3 | GO:0042626 | ATPase activity, coupled to transmembrane movement of substances(GO:0042626) |
| 0.1 | 3.2 | GO:0003785 | actin monomer binding(GO:0003785) |
| 0.1 | 0.3 | GO:0004911 | interleukin-2 receptor activity(GO:0004911) |
| 0.1 | 0.8 | GO:0003996 | acyl-CoA ligase activity(GO:0003996) |
| 0.1 | 1.6 | GO:0001594 | trace-amine receptor activity(GO:0001594) |
| 0.1 | 0.6 | GO:0034647 | histone demethylase activity (H3-trimethyl-K4 specific)(GO:0034647) |
| 0.1 | 7.0 | GO:0016811 | hydrolase activity, acting on carbon-nitrogen (but not peptide) bonds, in linear amides(GO:0016811) |
| 0.1 | 0.5 | GO:0051033 | nucleic acid transmembrane transporter activity(GO:0051032) RNA transmembrane transporter activity(GO:0051033) |
| 0.1 | 2.0 | GO:0005159 | insulin-like growth factor receptor binding(GO:0005159) |
| 0.1 | 1.5 | GO:0035250 | UDP-galactosyltransferase activity(GO:0035250) |
| 0.1 | 0.7 | GO:0030368 | interleukin-17 receptor activity(GO:0030368) |
| 0.1 | 4.3 | GO:0008235 | metalloexopeptidase activity(GO:0008235) |
| 0.1 | 3.6 | GO:0051018 | protein kinase A binding(GO:0051018) |
| 0.1 | 2.0 | GO:0042923 | neuropeptide binding(GO:0042923) |
| 0.1 | 0.7 | GO:0004415 | hyalurononglucosaminidase activity(GO:0004415) |
| 0.1 | 1.4 | GO:0004435 | phosphatidylinositol phospholipase C activity(GO:0004435) phospholipase C activity(GO:0004629) |
| 0.1 | 1.4 | GO:0003707 | steroid hormone receptor activity(GO:0003707) |
| 0.1 | 0.4 | GO:0061133 | endopeptidase activator activity(GO:0061133) |
| 0.1 | 2.1 | GO:0031624 | ubiquitin conjugating enzyme binding(GO:0031624) |
| 0.1 | 0.9 | GO:0033130 | acetylcholine receptor binding(GO:0033130) |
| 0.0 | 1.3 | GO:0004707 | MAP kinase activity(GO:0004707) |
| 0.0 | 0.9 | GO:0003746 | translation elongation factor activity(GO:0003746) |
| 0.0 | 1.6 | GO:0005154 | epidermal growth factor receptor binding(GO:0005154) |
| 0.0 | 0.4 | GO:0016886 | ligase activity, forming phosphoric ester bonds(GO:0016886) |
| 0.0 | 0.6 | GO:0001223 | transcription coactivator binding(GO:0001223) |
| 0.0 | 5.8 | GO:0003729 | mRNA binding(GO:0003729) poly(A) RNA binding(GO:0044822) |
| 0.0 | 4.2 | GO:0005179 | hormone activity(GO:0005179) |
| 0.0 | 20.2 | GO:0005198 | structural molecule activity(GO:0005198) |
| 0.0 | 5.0 | GO:0001227 | transcriptional repressor activity, RNA polymerase II transcription regulatory region sequence-specific binding(GO:0001227) |
| 0.0 | 1.9 | GO:0005518 | collagen binding(GO:0005518) |
| 0.0 | 0.8 | GO:0061631 | ubiquitin conjugating enzyme activity(GO:0061631) |
| 0.0 | 1.3 | GO:0000979 | RNA polymerase II core promoter sequence-specific DNA binding(GO:0000979) |
| 0.0 | 0.5 | GO:0016814 | hydrolase activity, acting on carbon-nitrogen (but not peptide) bonds, in cyclic amidines(GO:0016814) |
| 0.0 | 0.1 | GO:0004128 | cytochrome-b5 reductase activity, acting on NAD(P)H(GO:0004128) |
| 0.0 | 0.7 | GO:0070063 | RNA polymerase binding(GO:0070063) |
| 0.0 | 1.2 | GO:0004004 | RNA helicase activity(GO:0003724) ATP-dependent RNA helicase activity(GO:0004004) |
| 0.0 | 0.2 | GO:0043024 | ribosomal small subunit binding(GO:0043024) |
| 0.0 | 0.2 | GO:0016712 | oxidoreductase activity, acting on paired donors, with incorporation or reduction of molecular oxygen, reduced flavin or flavoprotein as one donor, and incorporation of one atom of oxygen(GO:0016712) |
| 0.0 | 0.1 | GO:0042834 | peptidoglycan binding(GO:0042834) |
| 0.0 | 0.4 | GO:0001784 | phosphotyrosine binding(GO:0001784) |
| 0.0 | 0.4 | GO:0033613 | activating transcription factor binding(GO:0033613) |
| 0.0 | 14.5 | GO:0004984 | olfactory receptor activity(GO:0004984) |
Gene overrepresentation in curated gene sets: canonical pathways category:
| Log-likelihood per target | Total log-likelihood | Term | Description |
|---|---|---|---|
| 0.9 | 14.7 | PID ERB GENOMIC PATHWAY | Validated nuclear estrogen receptor beta network |
| 0.7 | 37.9 | PID HNF3B PATHWAY | FOXA2 and FOXA3 transcription factor networks |
| 0.5 | 12.2 | PID RHODOPSIN PATHWAY | Visual signal transduction: Rods |
| 0.5 | 109.9 | NABA ECM REGULATORS | Genes encoding enzymes and their regulators involved in the remodeling of the extracellular matrix |
| 0.3 | 6.3 | SA CASPASE CASCADE | Apoptosis is mediated by caspases, cysteine proteases arranged in a proteolytic cascade. |
| 0.3 | 11.3 | PID AMB2 NEUTROPHILS PATHWAY | amb2 Integrin signaling |
| 0.2 | 5.1 | PID BETA CATENIN DEG PATHWAY | Degradation of beta catenin |
| 0.2 | 12.5 | PID DELTA NP63 PATHWAY | Validated transcriptional targets of deltaNp63 isoforms |
| 0.1 | 2.0 | PID ERBB NETWORK PATHWAY | ErbB receptor signaling network |
| 0.1 | 2.6 | PID SYNDECAN 4 PATHWAY | Syndecan-4-mediated signaling events |
| 0.1 | 4.1 | PID IL4 2PATHWAY | IL4-mediated signaling events |
| 0.1 | 8.5 | NABA ECM AFFILIATED | Genes encoding proteins affiliated structurally or functionally to extracellular matrix proteins |
| 0.0 | 1.1 | PID NETRIN PATHWAY | Netrin-mediated signaling events |
| 0.0 | 1.9 | PID AR TF PATHWAY | Regulation of Androgen receptor activity |
| 0.0 | 0.6 | PID ERBB4 PATHWAY | ErbB4 signaling events |
| 0.0 | 2.9 | PID CMYB PATHWAY | C-MYB transcription factor network |
| 0.0 | 1.5 | PID PLK1 PATHWAY | PLK1 signaling events |
| 0.0 | 1.2 | PID ECADHERIN NASCENT AJ PATHWAY | E-cadherin signaling in the nascent adherens junction |
| 0.0 | 0.8 | PID ATF2 PATHWAY | ATF-2 transcription factor network |
| 0.0 | 1.5 | PID TELOMERASE PATHWAY | Regulation of Telomerase |
| 0.0 | 0.3 | PID IL2 PI3K PATHWAY | IL2 signaling events mediated by PI3K |
| 0.0 | 5.1 | NABA SECRETED FACTORS | Genes encoding secreted soluble factors |
| 0.0 | 0.7 | NABA PROTEOGLYCANS | Genes encoding proteoglycans |
Gene overrepresentation in curated gene sets: REACTOME pathways category:
| Log-likelihood per target | Total log-likelihood | Term | Description |
|---|---|---|---|
| 4.2 | 42.2 | REACTOME GAMMA CARBOXYLATION TRANSPORT AND AMINO TERMINAL CLEAVAGE OF PROTEINS | Genes involved in Gamma-carboxylation, transport, and amino-terminal cleavage of proteins |
| 2.3 | 28.0 | REACTOME SYNTHESIS OF BILE ACIDS AND BILE SALTS VIA 24 HYDROXYCHOLESTEROL | Genes involved in Synthesis of bile acids and bile salts via 24-hydroxycholesterol |
| 1.6 | 20.3 | REACTOME PYRIMIDINE CATABOLISM | Genes involved in Pyrimidine catabolism |
| 1.3 | 17.1 | REACTOME REGULATION OF COMPLEMENT CASCADE | Genes involved in Regulation of Complement cascade |
| 1.1 | 11.4 | REACTOME GLYCOPROTEIN HORMONES | Genes involved in Glycoprotein hormones |
| 0.9 | 1.8 | REACTOME PEPTIDE HORMONE BIOSYNTHESIS | Genes involved in Peptide hormone biosynthesis |
| 0.8 | 17.5 | REACTOME COMPLEMENT CASCADE | Genes involved in Complement cascade |
| 0.7 | 13.2 | REACTOME AMINO ACID SYNTHESIS AND INTERCONVERSION TRANSAMINATION | Genes involved in Amino acid synthesis and interconversion (transamination) |
| 0.6 | 24.9 | REACTOME REGULATION OF BETA CELL DEVELOPMENT | Genes involved in Regulation of beta-cell development |
| 0.6 | 11.4 | REACTOME GLUCURONIDATION | Genes involved in Glucuronidation |
| 0.6 | 10.2 | REACTOME INTRINSIC PATHWAY | Genes involved in Intrinsic Pathway |
| 0.5 | 16.1 | REACTOME GLUTATHIONE CONJUGATION | Genes involved in Glutathione conjugation |
| 0.5 | 6.6 | REACTOME SYNTHESIS OF PE | Genes involved in Synthesis of PE |
| 0.3 | 9.6 | REACTOME PHASE II CONJUGATION | Genes involved in Phase II conjugation |
| 0.3 | 10.5 | REACTOME ABC FAMILY PROTEINS MEDIATED TRANSPORT | Genes involved in ABC-family proteins mediated transport |
| 0.2 | 12.3 | REACTOME CHEMOKINE RECEPTORS BIND CHEMOKINES | Genes involved in Chemokine receptors bind chemokines |
| 0.2 | 5.7 | REACTOME RORA ACTIVATES CIRCADIAN EXPRESSION | Genes involved in RORA Activates Circadian Expression |
| 0.2 | 31.5 | REACTOME METABOLISM OF AMINO ACIDS AND DERIVATIVES | Genes involved in Metabolism of amino acids and derivatives |
| 0.2 | 1.3 | REACTOME DEFENSINS | Genes involved in Defensins |
| 0.2 | 2.0 | REACTOME DOWNREGULATION OF ERBB2 ERBB3 SIGNALING | Genes involved in Downregulation of ERBB2:ERBB3 signaling |
| 0.1 | 5.1 | REACTOME GLUCONEOGENESIS | Genes involved in Gluconeogenesis |
| 0.1 | 6.2 | REACTOME GLUCOSE TRANSPORT | Genes involved in Glucose transport |
| 0.1 | 3.3 | REACTOME DEGRADATION OF THE EXTRACELLULAR MATRIX | Genes involved in Degradation of the extracellular matrix |
| 0.1 | 1.9 | REACTOME CTNNB1 PHOSPHORYLATION CASCADE | Genes involved in Beta-catenin phosphorylation cascade |
| 0.1 | 2.1 | REACTOME ANTIGEN PRESENTATION FOLDING ASSEMBLY AND PEPTIDE LOADING OF CLASS I MHC | Genes involved in Antigen Presentation: Folding, assembly and peptide loading of class I MHC |
| 0.1 | 6.4 | REACTOME AMINO ACID AND OLIGOPEPTIDE SLC TRANSPORTERS | Genes involved in Amino acid and oligopeptide SLC transporters |
| 0.1 | 1.9 | REACTOME OTHER SEMAPHORIN INTERACTIONS | Genes involved in Other semaphorin interactions |
| 0.1 | 4.4 | REACTOME ION TRANSPORT BY P TYPE ATPASES | Genes involved in Ion transport by P-type ATPases |
| 0.1 | 1.2 | REACTOME HIGHLY CALCIUM PERMEABLE POSTSYNAPTIC NICOTINIC ACETYLCHOLINE RECEPTORS | Genes involved in Highly calcium permeable postsynaptic nicotinic acetylcholine receptors |
| 0.1 | 1.2 | REACTOME APOPTOTIC CLEAVAGE OF CELL ADHESION PROTEINS | Genes involved in Apoptotic cleavage of cell adhesion proteins |
| 0.1 | 1.1 | REACTOME ROLE OF DCC IN REGULATING APOPTOSIS | Genes involved in Role of DCC in regulating apoptosis |
| 0.1 | 2.3 | REACTOME SIGNALING BY FGFR1 FUSION MUTANTS | Genes involved in Signaling by FGFR1 fusion mutants |
| 0.1 | 2.1 | REACTOME KINESINS | Genes involved in Kinesins |
| 0.1 | 7.3 | REACTOME DIABETES PATHWAYS | Genes involved in Diabetes pathways |
| 0.1 | 2.8 | REACTOME METABOLISM OF VITAMINS AND COFACTORS | Genes involved in Metabolism of vitamins and cofactors |
| 0.0 | 7.5 | REACTOME TRANSLATION | Genes involved in Translation |
| 0.0 | 2.3 | REACTOME VOLTAGE GATED POTASSIUM CHANNELS | Genes involved in Voltage gated Potassium channels |
| 0.0 | 7.0 | REACTOME ANTIGEN PROCESSING UBIQUITINATION PROTEASOME DEGRADATION | Genes involved in Antigen processing: Ubiquitination & Proteasome degradation |
| 0.0 | 1.9 | REACTOME NUCLEAR RECEPTOR TRANSCRIPTION PATHWAY | Genes involved in Nuclear Receptor transcription pathway |
| 0.0 | 1.2 | REACTOME METABOLISM OF STEROID HORMONES AND VITAMINS A AND D | Genes involved in Metabolism of steroid hormones and vitamins A and D |
| 0.0 | 1.1 | REACTOME MYOGENESIS | Genes involved in Myogenesis |
| 0.0 | 0.6 | REACTOME CREB PHOSPHORYLATION THROUGH THE ACTIVATION OF CAMKII | Genes involved in CREB phosphorylation through the activation of CaMKII |
| 0.0 | 2.0 | REACTOME CELL SURFACE INTERACTIONS AT THE VASCULAR WALL | Genes involved in Cell surface interactions at the vascular wall |
| 0.0 | 2.1 | REACTOME PPARA ACTIVATES GENE EXPRESSION | Genes involved in PPARA Activates Gene Expression |
| 0.0 | 0.4 | REACTOME ELONGATION ARREST AND RECOVERY | Genes involved in Elongation arrest and recovery |
| 0.0 | 0.6 | REACTOME ANTIVIRAL MECHANISM BY IFN STIMULATED GENES | Genes involved in Antiviral mechanism by IFN-stimulated genes |
| 0.0 | 0.3 | REACTOME IL RECEPTOR SHC SIGNALING | Genes involved in Interleukin receptor SHC signaling |
| 0.0 | 1.8 | REACTOME PEPTIDE LIGAND BINDING RECEPTORS | Genes involved in Peptide ligand-binding receptors |
| 0.0 | 0.5 | REACTOME APOPTOTIC CLEAVAGE OF CELLULAR PROTEINS | Genes involved in Apoptotic cleavage of cellular proteins |
| 0.0 | 1.4 | REACTOME MRNA SPLICING | Genes involved in mRNA Splicing |