Project
GSE53960: rat RNA-Seq transcriptomic Bodymap
Navigation
Downloads
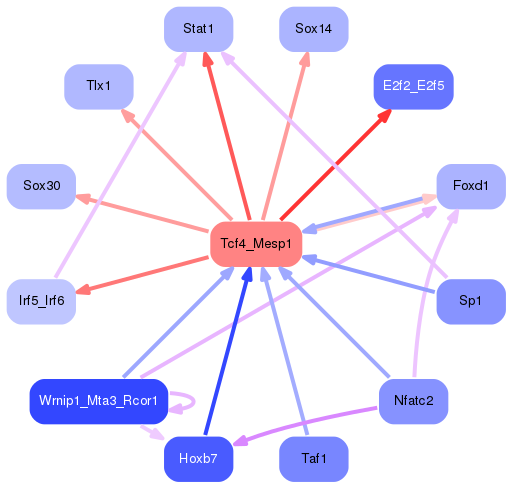
Results for Tcf4_Mesp1
Z-value: 2.15
Motif logo
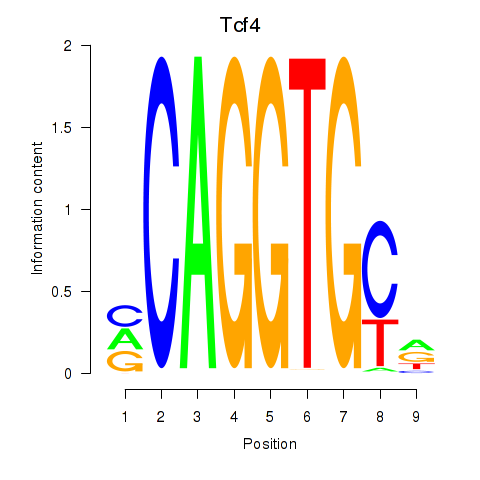
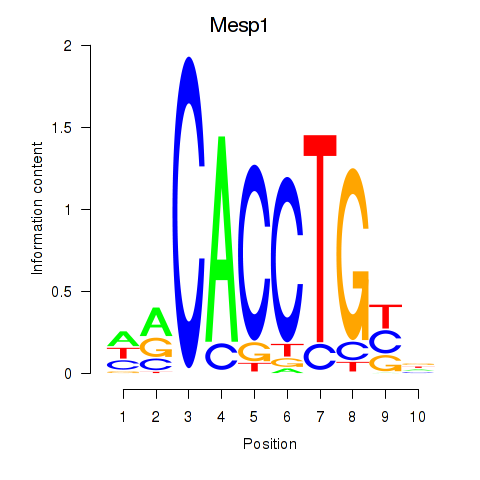
Transcription factors associated with Tcf4_Mesp1
| Gene Symbol | Gene ID | Gene Info |
|---|---|---|
|
Tcf4
|
ENSRNOG00000012405 | transcription factor 4 |
|
Mesp1
|
ENSRNOG00000014951 | mesoderm posterior bHLH transcription factor 1 |
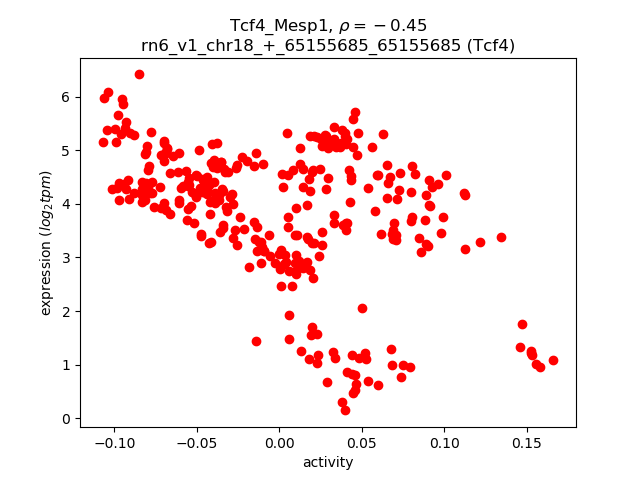
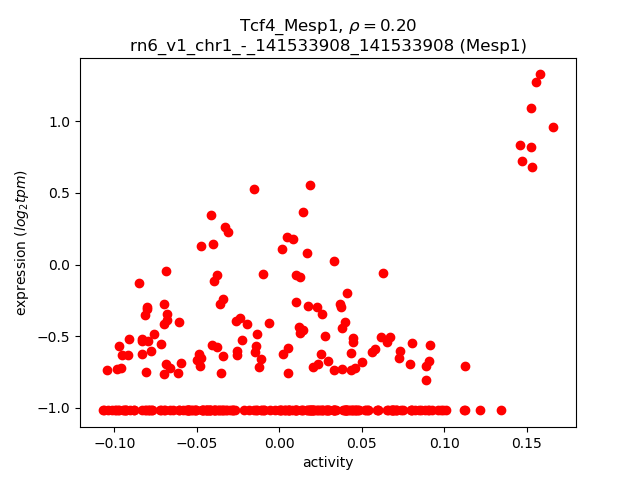
Activity-expression correlation:
| Gene | Promoter | Pearson corr. coef. | P-value | Plot |
|---|---|---|---|---|
| Tcf4 | rn6_v1_chr18_+_65155685_65155685 | -0.45 | 5.2e-17 | Click! |
| Mesp1 | rn6_v1_chr1_-_141533908_141533908 | 0.20 | 3.5e-04 | Click! |
Activity profile of Tcf4_Mesp1 motif
Sorted Z-values of Tcf4_Mesp1 motif
| Promoter | Log-likelihood | Transcript | Gene | Gene Info |
|---|---|---|---|---|
| chr10_-_31359699 | 99.07 |
ENSRNOT00000081280
|
Cyfip2
|
cytoplasmic FMR1 interacting protein 2 |
| chr3_-_7141522 | 67.80 |
ENSRNOT00000014572
|
Cel
|
carboxyl ester lipase |
| chr2_-_105089659 | 65.57 |
ENSRNOT00000043381
|
Cpb1
|
carboxypeptidase B1 |
| chr9_+_82053581 | 60.71 |
ENSRNOT00000086375
|
Wnt10a
|
wingless-type MMTV integration site family, member 10A |
| chr1_-_227441442 | 58.01 |
ENSRNOT00000028433
|
Ms4a1
|
membrane spanning 4-domains A1 |
| chr16_+_54765325 | 55.17 |
ENSRNOT00000065327
ENSRNOT00000086899 |
Mtmr7
|
myotubularin related protein 7 |
| chr19_-_37907714 | 53.03 |
ENSRNOT00000026361
|
Ctrl
|
chymotrypsin-like |
| chr1_+_100199057 | 50.47 |
ENSRNOT00000025831
|
Klk1
|
kallikrein 1 |
| chr10_-_31419235 | 48.43 |
ENSRNOT00000059496
|
Cyfip2
|
cytoplasmic FMR1 interacting protein 2 |
| chr5_+_154522119 | 48.35 |
ENSRNOT00000072618
|
E2f2
|
E2F transcription factor 2 |
| chr3_-_16999720 | 48.24 |
ENSRNOT00000074382
|
RGD1563231
|
similar to immunoglobulin kappa-chain VK-1 |
| chr6_-_140407307 | 45.28 |
ENSRNOT00000079087
|
AABR07065768.3
|
|
| chr6_-_141488290 | 44.71 |
ENSRNOT00000067336
|
AABR07065792.1
|
|
| chr9_-_14668297 | 43.92 |
ENSRNOT00000042404
|
Treml2
|
triggering receptor expressed on myeloid cells-like 2 |
| chr18_+_70427007 | 42.09 |
ENSRNOT00000087959
ENSRNOT00000019512 |
Myo5b
|
myosin Vb |
| chr15_-_37383277 | 42.05 |
ENSRNOT00000011711
|
Gjb2
|
gap junction protein, beta 2 |
| chr4_+_70755795 | 41.20 |
ENSRNOT00000043527
|
LOC683849
|
similar to Anionic trypsin II precursor (Pretrypsinogen II) |
| chr4_+_98370797 | 40.94 |
ENSRNOT00000031991
|
AABR07060872.1
|
|
| chr7_-_107634287 | 40.50 |
ENSRNOT00000093672
ENSRNOT00000087116 |
Sla
|
src-like adaptor |
| chr10_+_87774552 | 40.04 |
ENSRNOT00000044342
|
Krtap9-1
|
keratin associated protein 9-1 |
| chr4_+_70689737 | 40.03 |
ENSRNOT00000018852
|
Prss2
|
protease, serine, 2 |
| chr6_-_138508753 | 38.74 |
ENSRNOT00000006888
|
Ighm
|
immunoglobulin heavy constant mu |
| chr7_-_11330278 | 38.68 |
ENSRNOT00000027730
|
Matk
|
megakaryocyte-associated tyrosine kinase |
| chr17_-_8619737 | 37.87 |
ENSRNOT00000065217
|
RGD1562024
|
RGD1562024 |
| chr9_-_54457753 | 36.64 |
ENSRNOT00000020032
|
Stat1
|
signal transducer and activator of transcription 1 |
| chr6_-_138679665 | 36.55 |
ENSRNOT00000086777
|
AABR07065651.4
|
|
| chr15_-_37410848 | 35.57 |
ENSRNOT00000081757
|
Gjb6
|
gap junction protein, beta 6 |
| chr3_+_16846412 | 35.40 |
ENSRNOT00000074266
|
AABR07051551.1
|
|
| chr6_-_139041812 | 35.26 |
ENSRNOT00000074510
|
AABR07065656.1
|
|
| chr4_+_56981283 | 35.01 |
ENSRNOT00000010989
|
Tspan33
|
tetraspanin 33 |
| chr1_-_214202853 | 34.76 |
ENSRNOT00000022954
|
Lmntd2
|
lamin tail domain containing 2 |
| chr10_+_84309430 | 34.07 |
ENSRNOT00000030159
|
Skap1
|
src kinase associated phosphoprotein 1 |
| chr16_+_74865516 | 33.74 |
ENSRNOT00000058072
|
Atp7b
|
ATPase copper transporting beta |
| chr8_+_55603968 | 33.47 |
ENSRNOT00000066848
|
Pou2af1
|
POU class 2 associating factor 1 |
| chr6_+_139158334 | 33.37 |
ENSRNOT00000089227
|
AABR07065673.1
|
|
| chr10_+_87759769 | 32.75 |
ENSRNOT00000017378
ENSRNOT00000046526 |
Krtap9-1
|
keratin associated protein 9-1 |
| chr6_-_138909105 | 32.61 |
ENSRNOT00000087855
|
AABR07065656.9
|
|
| chr6_-_139041654 | 32.56 |
ENSRNOT00000075664
|
AABR07065656.1
|
|
| chr6_-_138772736 | 32.40 |
ENSRNOT00000071492
|
AABR07065651.1
|
|
| chr6_-_140572023 | 31.70 |
ENSRNOT00000072338
|
AABR07065772.1
|
|
| chr16_-_39970532 | 31.59 |
ENSRNOT00000071331
|
Spata4
|
spermatogenesis associated 4 |
| chr11_+_88424414 | 30.90 |
ENSRNOT00000022328
|
Spag6l
|
sperm associated antigen 6-like |
| chr1_-_197821936 | 30.86 |
ENSRNOT00000055027
|
Cd19
|
CD19 molecule |
| chr1_-_53087474 | 30.81 |
ENSRNOT00000017302
|
Ccr6
|
C-C motif chemokine receptor 6 |
| chr4_-_69268336 | 30.75 |
ENSRNOT00000018042
|
Prss3b
|
protease, serine, 3B |
| chr1_-_165680176 | 30.62 |
ENSRNOT00000025245
ENSRNOT00000082697 |
Plekhb1
|
pleckstrin homology domain containing B1 |
| chr12_-_32740732 | 30.50 |
ENSRNOT00000064526
|
Glt1d1
|
glycosyltransferase 1 domain containing 1 |
| chr6_+_72359791 | 30.46 |
ENSRNOT00000007365
|
Coch
|
cochlin |
| chr3_-_16441030 | 30.45 |
ENSRNOT00000047784
|
AABR07051532.1
|
|
| chr6_-_138536162 | 30.31 |
ENSRNOT00000083031
|
AABR07065643.1
|
|
| chr6_-_138093643 | 30.13 |
ENSRNOT00000045874
|
Igh-6
|
immunoglobulin heavy chain 6 |
| chr6_+_139551751 | 29.98 |
ENSRNOT00000081684
|
AABR07065699.2
|
|
| chr10_-_70220558 | 29.29 |
ENSRNOT00000041389
ENSRNOT00000076398 ENSRNOT00000076596 |
Rffl
|
ring finger and FYVE-like domain containing E3 ubiquitin protein ligase |
| chr2_+_174013288 | 29.20 |
ENSRNOT00000013904
|
Serpini1
|
serpin family I member 1 |
| chr19_-_43596801 | 28.79 |
ENSRNOT00000025625
|
Fa2h
|
fatty acid 2-hydroxylase |
| chr1_+_279798187 | 28.69 |
ENSRNOT00000024065
|
Pnlip
|
pancreatic lipase |
| chr6_-_142635763 | 28.66 |
ENSRNOT00000048908
|
AABR07065815.2
|
|
| chr6_-_138565404 | 28.31 |
ENSRNOT00000079420
|
AABR07065645.2
|
|
| chr17_-_417480 | 28.12 |
ENSRNOT00000023685
|
Fbp1
|
fructose-bisphosphatase 1 |
| chr3_+_141927400 | 27.97 |
ENSRNOT00000066588
|
AABR07054117.1
|
|
| chr4_-_70628470 | 27.69 |
ENSRNOT00000029319
|
Try5
|
trypsin 5 |
| chr1_+_154377447 | 27.46 |
ENSRNOT00000084268
ENSRNOT00000092086 ENSRNOT00000091470 ENSRNOT00000025415 |
Picalm
|
phosphatidylinositol binding clathrin assembly protein |
| chr3_-_16537433 | 26.79 |
ENSRNOT00000048523
|
AABR07051533.2
|
|
| chr13_+_111870121 | 26.78 |
ENSRNOT00000007333
|
Irf6
|
interferon regulatory factor 6 |
| chr4_-_67206426 | 26.70 |
ENSRNOT00000013124
|
Mkrn1
|
makorin ring finger protein 1 |
| chr6_-_138948583 | 26.50 |
ENSRNOT00000084614
|
AABR07065656.2
|
|
| chr6_-_141291347 | 26.43 |
ENSRNOT00000008333
|
AABR07065789.1
|
|
| chr10_+_11912543 | 26.34 |
ENSRNOT00000045192
|
Zfp597
|
zinc finger protein 597 |
| chr16_+_6078122 | 26.21 |
ENSRNOT00000021407
|
Chdh
|
choline dehydrogenase |
| chr2_-_164684985 | 26.13 |
ENSRNOT00000057504
|
Rarres1
|
retinoic acid receptor responder 1 |
| chr3_+_16610086 | 26.09 |
ENSRNOT00000046231
|
LOC100361009
|
rCG64257-like |
| chr10_+_14122878 | 26.08 |
ENSRNOT00000052008
|
Hs3st6
|
heparan sulfate-glucosamine 3-sulfotransferase 6 |
| chr1_-_87155118 | 25.89 |
ENSRNOT00000072441
|
AABR07002854.1
|
|
| chr6_-_138536321 | 25.48 |
ENSRNOT00000077743
|
AABR07065643.1
|
|
| chr6_+_139523495 | 25.38 |
ENSRNOT00000075467
|
AABR07065699.4
|
|
| chr6_-_138948424 | 25.23 |
ENSRNOT00000072566
|
AABR07065656.2
|
|
| chr6_-_102196138 | 25.04 |
ENSRNOT00000014132
|
Tmem229b
|
transmembrane protein 229B |
| chr8_-_62616828 | 24.85 |
ENSRNOT00000068340
|
Arid3b
|
AT-rich interaction domain 3B |
| chr6_-_139719323 | 24.81 |
ENSRNOT00000090133
|
AABR07065705.4
|
|
| chr13_-_42263024 | 24.79 |
ENSRNOT00000004741
|
Lypd1
|
Ly6/Plaur domain containing 1 |
| chr1_-_20155960 | 24.60 |
ENSRNOT00000061389
|
Samd3
|
sterile alpha motif domain containing 3 |
| chr9_-_85445939 | 24.56 |
ENSRNOT00000072160
|
Ap1s3
|
adaptor-related protein complex 1, sigma 3 subunit |
| chr4_+_57952982 | 24.51 |
ENSRNOT00000014465
|
Cpa1
|
carboxypeptidase A1 |
| chr6_-_139747737 | 24.47 |
ENSRNOT00000090626
|
AABR07065705.3
|
|
| chr6_-_139997537 | 24.36 |
ENSRNOT00000073207
|
AABR07065740.1
|
|
| chr6_-_138679506 | 24.24 |
ENSRNOT00000075376
|
AABR07065651.4
|
|
| chr3_+_16413080 | 24.22 |
ENSRNOT00000040386
|
LOC100912707
|
Ig kappa chain V19-17-like |
| chrX_+_157150655 | 24.03 |
ENSRNOT00000090795
|
Pnck
|
pregnancy up-regulated nonubiquitous CaM kinase |
| chr9_+_40972089 | 23.95 |
ENSRNOT00000067928
|
Ptpn18
|
protein tyrosine phosphatase, non-receptor type 18 |
| chr6_-_140418831 | 23.93 |
ENSRNOT00000086301
|
AABR07065768.2
|
|
| chr4_+_127164453 | 23.61 |
ENSRNOT00000017889
|
Kbtbd8
|
kelch repeat and BTB domain containing 8 |
| chr10_+_87782376 | 23.16 |
ENSRNOT00000017415
|
LOC680396
|
hypothetical protein LOC680396 |
| chr1_+_207654487 | 22.92 |
ENSRNOT00000025569
|
Foxi2
|
forkhead box I2 |
| chr5_-_153924896 | 22.86 |
ENSRNOT00000065247
|
Grhl3
|
grainyhead-like transcription factor 3 |
| chr6_+_139209936 | 22.60 |
ENSRNOT00000087620
|
AABR07065680.1
|
|
| chr6_-_138744480 | 22.56 |
ENSRNOT00000089387
|
AABR07065651.5
|
|
| chr4_+_33638709 | 22.53 |
ENSRNOT00000009888
ENSRNOT00000034719 ENSRNOT00000052333 |
Tac1
|
tachykinin, precursor 1 |
| chr3_+_111545007 | 22.49 |
ENSRNOT00000007247
|
Itpka
|
inositol-trisphosphate 3-kinase A |
| chr1_-_98501249 | 22.45 |
ENSRNOT00000023858
|
Lim2
|
lens intrinsic membrane protein 2 |
| chr6_-_139654508 | 22.08 |
ENSRNOT00000082576
|
AABR07065705.5
|
|
| chr19_-_462559 | 22.01 |
ENSRNOT00000046676
|
AABR07042633.1
|
|
| chr9_-_9985358 | 21.97 |
ENSRNOT00000080856
|
Crb3
|
crumbs 3, cell polarity complex component |
| chr7_-_122963299 | 21.91 |
ENSRNOT00000090208
|
Rangap1
|
RAN GTPase activating protein 1 |
| chr13_-_44345735 | 21.90 |
ENSRNOT00000005006
|
Tmem163
|
transmembrane protein 163 |
| chr8_-_49280901 | 21.77 |
ENSRNOT00000021390
|
Cd3g
|
CD3g molecule |
| chr2_-_30577218 | 21.73 |
ENSRNOT00000024674
|
Ocln
|
occludin |
| chr16_-_15798974 | 21.69 |
ENSRNOT00000046842
ENSRNOT00000065946 |
Nrg3
|
neuregulin 3 |
| chr5_+_114940053 | 21.28 |
ENSRNOT00000012396
|
Hook1
|
hook microtubule-tethering protein 1 |
| chr6_-_99783047 | 21.25 |
ENSRNOT00000009028
|
Sptb
|
spectrin, beta, erythrocytic |
| chr6_-_138852571 | 21.20 |
ENSRNOT00000081803
|
AABR07065656.8
|
|
| chr2_-_30576591 | 20.59 |
ENSRNOT00000084667
|
Ocln
|
occludin |
| chr6_+_139523337 | 20.42 |
ENSRNOT00000090711
|
AABR07065699.4
|
|
| chr6_-_125027553 | 20.41 |
ENSRNOT00000005908
|
Ccdc88c
|
coiled-coil domain containing 88C |
| chr20_+_40618128 | 20.34 |
ENSRNOT00000001075
ENSRNOT00000057364 |
Pkib
|
cAMP-dependent protein kinase inhibitor beta |
| chr4_-_122237754 | 20.27 |
ENSRNOT00000029915
|
Chst13
|
carbohydrate sulfotransferase 13 |
| chr19_+_24545318 | 20.15 |
ENSRNOT00000005071
|
Clgn
|
calmegin |
| chr8_-_13513337 | 20.14 |
ENSRNOT00000071532
|
LOC108348070
|
lysine-specific demethylase 4D |
| chr1_-_280233929 | 20.11 |
ENSRNOT00000085778
|
Shtn1
|
shootin 1 |
| chr13_-_51076165 | 20.03 |
ENSRNOT00000004602
|
Adora1
|
adenosine A1 receptor |
| chr10_+_91254058 | 19.92 |
ENSRNOT00000087218
ENSRNOT00000065373 |
Fmnl1
|
formin-like 1 |
| chr7_-_143317674 | 19.87 |
ENSRNOT00000080010
|
Krt5
|
keratin 5 |
| chr6_-_140715174 | 19.75 |
ENSRNOT00000085345
|
AABR07065773.1
|
|
| chr19_+_38768467 | 19.71 |
ENSRNOT00000027346
|
Cdh1
|
cadherin 1 |
| chr14_-_18853315 | 19.67 |
ENSRNOT00000003794
|
Ppbp
|
pro-platelet basic protein |
| chr6_+_139412169 | 19.65 |
ENSRNOT00000080187
|
AABR07065693.1
|
|
| chr4_-_70747226 | 19.60 |
ENSRNOT00000044960
|
LOC102554637
|
anionic trypsin-2-like |
| chr3_-_168033457 | 19.51 |
ENSRNOT00000055111
|
Bcas1
|
breast carcinoma amplified sequence 1 |
| chr1_-_37726151 | 19.50 |
ENSRNOT00000071842
|
RGD1308544
|
LOC361192 |
| chr8_-_50539331 | 19.48 |
ENSRNOT00000088997
|
AABR07073400.1
|
|
| chr5_-_58987760 | 19.45 |
ENSRNOT00000035040
|
Sit1
|
signaling threshold regulating transmembrane adaptor 1 |
| chr15_-_80713153 | 19.17 |
ENSRNOT00000063800
|
Klhl1
|
kelch-like family member 1 |
| chr1_-_222118459 | 19.08 |
ENSRNOT00000067217
|
Ccdc88b
|
coiled-coil domain containing 88B |
| chr4_+_99185885 | 19.03 |
ENSRNOT00000009392
|
Cd8b
|
CD8b molecule |
| chr15_-_42947656 | 19.03 |
ENSRNOT00000030007
|
Ptk2b
|
protein tyrosine kinase 2 beta |
| chr2_-_202816562 | 18.98 |
ENSRNOT00000020401
|
Fam46c
|
family with sequence similarity 46, member C |
| chr4_+_98481520 | 18.94 |
ENSRNOT00000078381
ENSRNOT00000048493 |
AABR07060886.1
|
|
| chr4_-_95970666 | 18.93 |
ENSRNOT00000008826
|
Hpgds
|
hematopoietic prostaglandin D synthase |
| chr4_-_68597586 | 18.89 |
ENSRNOT00000015921
|
RGD1563986
|
similar to RIKEN cDNA E330009J07 gene |
| chr9_+_10172832 | 18.89 |
ENSRNOT00000074555
|
Acsbg2
|
acyl-CoA synthetase bubblegum family member 2 |
| chr18_+_60392376 | 18.88 |
ENSRNOT00000023890
|
Nedd4l
|
neural precursor cell expressed, developmentally down-regulated 4-like, E3 ubiquitin protein ligase |
| chr18_+_25962855 | 18.79 |
ENSRNOT00000078822
|
Camk4
|
calcium/calmodulin-dependent protein kinase IV |
| chr5_+_48274477 | 18.74 |
ENSRNOT00000075992
ENSRNOT00000041271 |
Ube2j1
|
ubiquitin-conjugating enzyme E2, J1 |
| chr1_+_255040426 | 18.71 |
ENSRNOT00000092151
|
Pcgf5
|
polycomb group ring finger 5 |
| chr6_-_138565245 | 18.70 |
ENSRNOT00000070980
|
AABR07065645.2
|
|
| chr6_+_139177200 | 18.68 |
ENSRNOT00000084131
|
AABR07065676.1
|
|
| chr17_+_44556039 | 18.68 |
ENSRNOT00000086540
|
Prss16
|
protease, serine 16 |
| chr1_-_197770669 | 18.65 |
ENSRNOT00000023563
|
Lat
|
linker for activation of T cells |
| chr10_-_90312386 | 18.61 |
ENSRNOT00000028445
|
Slc4a1
|
solute carrier family 4 member 1 |
| chr16_+_20027348 | 18.57 |
ENSRNOT00000034589
|
Fam129c
|
family with sequence similarity 129, member C |
| chr1_-_142020525 | 18.53 |
ENSRNOT00000042558
|
Cib1
|
calcium and integrin binding 1 |
| chr3_-_12415073 | 18.49 |
ENSRNOT00000022755
|
Ralgps1
|
Ral GEF with PH domain and SH3 binding motif 1 |
| chr2_-_139528162 | 18.23 |
ENSRNOT00000014317
|
Slc7a11
|
solute carrier family 7 member 11 |
| chr17_+_85382116 | 18.15 |
ENSRNOT00000002513
|
Spag6
|
sperm associated antigen 6 |
| chr6_-_138640187 | 18.13 |
ENSRNOT00000087983
|
AABR07065651.6
|
|
| chr3_+_92640752 | 17.87 |
ENSRNOT00000007604
|
Slc1a2
|
solute carrier family 1 member 2 |
| chr19_-_58735173 | 17.79 |
ENSRNOT00000030077
|
Pcnx2
|
pecanex homolog 2 (Drosophila) |
| chr5_-_127273656 | 17.77 |
ENSRNOT00000057341
|
Dmrtb1
|
DMRT-like family B with proline-rich C-terminal, 1 |
| chr4_-_69163881 | 17.74 |
ENSRNOT00000048779
|
Tryx5
|
trypsin X5 |
| chr6_-_138772894 | 17.68 |
ENSRNOT00000080779
|
AABR07065651.1
|
|
| chr18_+_31094965 | 17.59 |
ENSRNOT00000026526
|
Rell2
|
RELT-like 2 |
| chr10_-_70735742 | 17.44 |
ENSRNOT00000077035
|
Heatr9
|
HEAT repeat containing 9 |
| chr1_+_193424812 | 17.36 |
ENSRNOT00000019939
|
Aqp8
|
aquaporin 8 |
| chr4_-_122741110 | 17.32 |
ENSRNOT00000008888
|
Nup210
|
nucleoporin 210 |
| chr7_-_119768082 | 17.29 |
ENSRNOT00000009612
|
Sstr3
|
somatostatin receptor 3 |
| chr6_+_139486775 | 17.29 |
ENSRNOT00000077771
|
AABR07065699.3
|
|
| chr19_-_26053762 | 17.23 |
ENSRNOT00000004646
|
MAST1
|
microtubule associated serine/threonine kinase 1 |
| chr13_-_76049363 | 17.21 |
ENSRNOT00000075865
ENSRNOT00000007455 |
Brinp2
|
BMP/retinoic acid inducible neural specific 2 |
| chr6_-_131914028 | 17.14 |
ENSRNOT00000007602
|
Bcl11b
|
B-cell CLL/lymphoma 11B |
| chr11_+_66878658 | 17.04 |
ENSRNOT00000003208
|
Eaf2
|
ELL associated factor 2 |
| chr20_-_50564987 | 16.96 |
ENSRNOT00000034485
ENSRNOT00000064466 |
Lin28b
|
lin-28 homolog B |
| chr10_-_87564327 | 16.90 |
ENSRNOT00000064760
ENSRNOT00000068237 |
LOC680160
|
similar to keratin associated protein 4-7 |
| chr4_+_176994129 | 16.88 |
ENSRNOT00000018734
|
Cmas
|
cytidine monophosphate N-acetylneuraminic acid synthetase |
| chr20_-_4863011 | 16.83 |
ENSRNOT00000079503
|
Ltb
|
lymphotoxin beta |
| chr1_-_101741441 | 16.81 |
ENSRNOT00000028570
|
Sult2b1
|
sulfotransferase family 2B member 1 |
| chr1_-_88920291 | 16.81 |
ENSRNOT00000028306
|
Kirrel2
|
kin of IRRE like 2 (Drosophila) |
| chr6_-_138632159 | 16.77 |
ENSRNOT00000082921
ENSRNOT00000040702 |
Ighm
|
immunoglobulin heavy constant mu |
| chr10_+_66942398 | 16.75 |
ENSRNOT00000018986
|
Rab11fip4
|
RAB11 family interacting protein 4 |
| chr12_+_2134022 | 16.74 |
ENSRNOT00000001305
|
Camsap3
|
calmodulin regulated spectrin-associated protein family, member 3 |
| chr19_+_3325893 | 16.65 |
ENSRNOT00000048879
|
RGD1565617
|
similar to Ig variable region, light chain |
| chr5_-_160405050 | 16.58 |
ENSRNOT00000081899
|
Ctrc
|
chymotrypsin C |
| chr10_-_91291774 | 16.48 |
ENSRNOT00000004356
|
LOC100361655
|
rCG33642-like |
| chr3_-_148312420 | 16.37 |
ENSRNOT00000047416
ENSRNOT00000081272 |
Bcl2l1
|
Bcl2-like 1 |
| chr4_-_132171153 | 16.37 |
ENSRNOT00000015058
ENSRNOT00000015075 |
Prok2
|
prokineticin 2 |
| chr1_-_169344306 | 16.32 |
ENSRNOT00000022852
|
Ubqlnl
|
ubiquilin-like |
| chr6_+_139405966 | 16.19 |
ENSRNOT00000088974
|
AABR07065693.3
|
|
| chr2_-_88113029 | 16.16 |
ENSRNOT00000013354
|
Car2
|
carbonic anhydrase 2 |
| chr1_+_15093599 | 16.16 |
ENSRNOT00000016354
|
Il22ra2
|
interleukin 22 receptor subunit alpha 2 |
| chr2_+_252263386 | 16.15 |
ENSRNOT00000092913
ENSRNOT00000084034 ENSRNOT00000041186 ENSRNOT00000092931 |
Ssx2ip
|
SSX family member 2 interacting protein |
| chrX_-_156155014 | 16.09 |
ENSRNOT00000088637
|
LOC102552182
|
L antigen family member 3-like |
| chr4_+_109497962 | 15.97 |
ENSRNOT00000057869
|
Reg1a
|
regenerating family member 1 alpha |
| chr3_+_119015412 | 15.96 |
ENSRNOT00000013605
|
Slc27a2
|
solute carrier family 27 member 2 |
| chr7_+_38945836 | 15.91 |
ENSRNOT00000006455
|
Ccer1
|
coiled-coil glutamate-rich protein 1 |
| chr8_-_49308806 | 15.81 |
ENSRNOT00000047291
|
Cd3e
|
CD3e molecule |
| chr7_+_130296897 | 15.74 |
ENSRNOT00000044854
|
Adm2
|
adrenomedullin 2 |
| chr7_-_102298522 | 15.69 |
ENSRNOT00000006273
|
A1bg
|
alpha-1-B glycoprotein |
| chr2_-_112831476 | 15.67 |
ENSRNOT00000018055
|
Ect2
|
epithelial cell transforming 2 |
| chrX_+_78196300 | 15.66 |
ENSRNOT00000048695
|
P2ry10
|
purinergic receptor P2Y10 |
| chr6_-_138736203 | 15.61 |
ENSRNOT00000052021
|
LOC100360169
|
rCG21044-like |
| chr3_-_2853272 | 15.60 |
ENSRNOT00000023022
|
Fcna
|
ficolin A |
| chr2_+_116416507 | 15.57 |
ENSRNOT00000030700
|
Actrt3
|
actin-related protein T3 |
Network of associatons between targets according to the STRING database.

First level regulatory network of Tcf4_Mesp1
Gene Ontology Analysis
Gene overrepresentation in biological process category:
| Log-likelihood per target | Total log-likelihood | Term | Description |
|---|---|---|---|
| 18.4 | 147.4 | GO:0051388 | positive regulation of neurotrophin TRK receptor signaling pathway(GO:0051388) |
| 15.5 | 15.5 | GO:1990379 | lipid transport across blood brain barrier(GO:1990379) |
| 11.2 | 33.7 | GO:0015680 | intracellular copper ion transport(GO:0015680) |
| 10.8 | 32.3 | GO:1905245 | regulation of aspartic-type endopeptidase activity involved in amyloid precursor protein catabolic process(GO:1902959) positive regulation of aspartic-type endopeptidase activity involved in amyloid precursor protein catabolic process(GO:1902961) regulation of metalloendopeptidase activity involved in amyloid precursor protein catabolic process(GO:1902962) negative regulation of metalloendopeptidase activity involved in amyloid precursor protein catabolic process(GO:1902963) regulation of aspartic-type peptidase activity(GO:1905245) positive regulation of aspartic-type peptidase activity(GO:1905247) |
| 9.2 | 36.6 | GO:0034240 | negative regulation of macrophage fusion(GO:0034240) |
| 8.3 | 33.0 | GO:0002752 | cell surface pattern recognition receptor signaling pathway(GO:0002752) |
| 8.2 | 32.9 | GO:2000852 | regulation of corticosterone secretion(GO:2000852) |
| 7.7 | 30.8 | GO:0060474 | positive regulation of sperm motility involved in capacitation(GO:0060474) |
| 7.4 | 36.8 | GO:0032849 | positive regulation of cellular pH reduction(GO:0032849) |
| 7.2 | 43.1 | GO:0032439 | endosome localization(GO:0032439) |
| 7.1 | 21.2 | GO:0097089 | methyl-branched fatty acid metabolic process(GO:0097089) |
| 7.0 | 28.1 | GO:0046351 | disaccharide biosynthetic process(GO:0046351) |
| 6.7 | 20.0 | GO:0032242 | regulation of nucleoside transport(GO:0032242) negative regulation of circadian sleep/wake cycle, non-REM sleep(GO:0042323) negative regulation of mucus secretion(GO:0070256) negative regulation of long term synaptic depression(GO:1900453) |
| 6.6 | 13.3 | GO:0071661 | granzyme B production(GO:0071613) regulation of granzyme B production(GO:0071661) positive regulation of granzyme B production(GO:0071663) |
| 6.6 | 39.5 | GO:2001271 | negative regulation of cysteine-type endopeptidase activity involved in execution phase of apoptosis(GO:2001271) |
| 6.3 | 19.0 | GO:0010752 | regulation of cGMP-mediated signaling(GO:0010752) regulation of B cell chemotaxis(GO:2000537) positive regulation of B cell chemotaxis(GO:2000538) |
| 6.2 | 18.5 | GO:0038163 | thrombopoietin-mediated signaling pathway(GO:0038163) |
| 6.0 | 24.0 | GO:0060066 | oviduct development(GO:0060066) |
| 5.9 | 23.7 | GO:0035625 | receptor transactivation(GO:0035624) epidermal growth factor-activated receptor transactivation by G-protein coupled receptor signaling pathway(GO:0035625) activation of MAPK activity by adrenergic receptor signaling pathway(GO:0071883) |
| 5.9 | 88.8 | GO:0048733 | sebaceous gland development(GO:0048733) |
| 5.9 | 29.4 | GO:0060327 | cytoplasmic actin-based contraction involved in cell motility(GO:0060327) |
| 5.8 | 34.7 | GO:1990086 | lens fiber cell apoptotic process(GO:1990086) |
| 5.5 | 22.2 | GO:0021842 | directional guidance of interneurons involved in migration from the subpallium to the cortex(GO:0021840) chemorepulsion involved in interneuron migration from the subpallium to the cortex(GO:0021842) |
| 5.5 | 16.4 | GO:1905218 | cellular response to astaxanthin(GO:1905218) |
| 5.4 | 10.8 | GO:0042977 | regulation of activation of JAK2 kinase activity(GO:0010534) activation of JAK2 kinase activity(GO:0042977) negative regulation of activation of JAK2 kinase activity(GO:1902569) |
| 5.3 | 16.0 | GO:1990868 | response to chemokine(GO:1990868) cellular response to chemokine(GO:1990869) |
| 5.2 | 73.0 | GO:0016127 | cholesterol catabolic process(GO:0006707) sterol catabolic process(GO:0016127) |
| 5.0 | 15.1 | GO:0035408 | histone H3-T6 phosphorylation(GO:0035408) |
| 4.9 | 14.7 | GO:0045065 | cytotoxic T cell differentiation(GO:0045065) |
| 4.7 | 42.3 | GO:0070673 | response to interleukin-18(GO:0070673) |
| 4.7 | 18.7 | GO:0070495 | regulation of thrombin receptor signaling pathway(GO:0070494) negative regulation of thrombin receptor signaling pathway(GO:0070495) |
| 4.6 | 23.1 | GO:2000664 | positive regulation of interleukin-5 secretion(GO:2000664) |
| 4.6 | 13.8 | GO:0044240 | multicellular organism lipid catabolic process(GO:0044240) |
| 4.5 | 22.7 | GO:0030070 | insulin processing(GO:0030070) |
| 4.5 | 17.9 | GO:0070779 | D-aspartate transport(GO:0070777) D-aspartate import(GO:0070779) |
| 4.4 | 13.3 | GO:0030719 | oocyte construction(GO:0007308) oocyte axis specification(GO:0007309) oocyte anterior/posterior axis specification(GO:0007314) pole plasm assembly(GO:0007315) maternal determination of anterior/posterior axis, embryo(GO:0008358) P granule organization(GO:0030719) |
| 4.4 | 61.2 | GO:0044752 | response to human chorionic gonadotropin(GO:0044752) |
| 4.4 | 34.8 | GO:0006578 | amino-acid betaine biosynthetic process(GO:0006578) |
| 4.3 | 13.0 | GO:0060743 | epithelial cell maturation involved in prostate gland development(GO:0060743) |
| 4.2 | 16.9 | GO:0051311 | meiotic metaphase plate congression(GO:0051311) |
| 4.2 | 12.6 | GO:0007066 | female meiosis sister chromatid cohesion(GO:0007066) |
| 4.2 | 20.9 | GO:0045218 | zonula adherens maintenance(GO:0045218) |
| 4.1 | 12.2 | GO:0002380 | immunoglobulin secretion involved in immune response(GO:0002380) |
| 4.1 | 8.1 | GO:0071930 | negative regulation of transcription involved in G1/S transition of mitotic cell cycle(GO:0071930) |
| 3.9 | 3.9 | GO:0010716 | negative regulation of extracellular matrix disassembly(GO:0010716) |
| 3.9 | 19.3 | GO:0009449 | gamma-aminobutyric acid biosynthetic process(GO:0009449) |
| 3.8 | 7.6 | GO:0032423 | regulation of mismatch repair(GO:0032423) |
| 3.8 | 18.9 | GO:0033563 | dorsal/ventral axon guidance(GO:0033563) |
| 3.7 | 18.6 | GO:0010037 | response to carbon dioxide(GO:0010037) |
| 3.7 | 11.0 | GO:0010034 | response to acetate(GO:0010034) |
| 3.6 | 10.9 | GO:1990743 | protein sialylation(GO:1990743) |
| 3.6 | 14.5 | GO:0070543 | response to linoleic acid(GO:0070543) |
| 3.6 | 10.9 | GO:1902226 | regulation of macrophage colony-stimulating factor signaling pathway(GO:1902226) regulation of response to macrophage colony-stimulating factor(GO:1903969) regulation of cellular response to macrophage colony-stimulating factor stimulus(GO:1903972) |
| 3.5 | 14.2 | GO:0001992 | regulation of systemic arterial blood pressure by vasopressin(GO:0001992) |
| 3.5 | 35.2 | GO:0032782 | bile acid secretion(GO:0032782) |
| 3.5 | 17.5 | GO:0040038 | polar body extrusion after meiotic divisions(GO:0040038) |
| 3.4 | 10.3 | GO:1900220 | semaphorin-plexin signaling pathway involved in bone trabecula morphogenesis(GO:1900220) |
| 3.3 | 33.3 | GO:0061365 | positive regulation of triglyceride lipase activity(GO:0061365) |
| 3.3 | 13.3 | GO:0032485 | regulation of Ral protein signal transduction(GO:0032485) |
| 3.3 | 16.5 | GO:0090274 | positive regulation of somatostatin secretion(GO:0090274) |
| 3.3 | 19.6 | GO:0010587 | miRNA catabolic process(GO:0010587) |
| 3.2 | 12.7 | GO:0035986 | senescence-associated heterochromatin focus assembly(GO:0035986) |
| 3.2 | 12.7 | GO:0071226 | cellular response to molecule of fungal origin(GO:0071226) |
| 3.1 | 9.4 | GO:0042509 | regulation of tyrosine phosphorylation of STAT protein(GO:0042509) positive regulation of tyrosine phosphorylation of STAT protein(GO:0042531) |
| 3.1 | 21.8 | GO:0010529 | regulation of transposition(GO:0010528) negative regulation of transposition(GO:0010529) |
| 3.1 | 3.1 | GO:0021730 | trigeminal sensory nucleus development(GO:0021730) principal sensory nucleus of trigeminal nerve development(GO:0021740) |
| 3.0 | 33.5 | GO:0070862 | negative regulation of protein exit from endoplasmic reticulum(GO:0070862) negative regulation of retrograde protein transport, ER to cytosol(GO:1904153) |
| 3.0 | 9.1 | GO:0002232 | leukocyte chemotaxis involved in inflammatory response(GO:0002232) myeloid dendritic cell activation involved in immune response(GO:0002277) |
| 3.0 | 12.1 | GO:0070839 | divalent metal ion export(GO:0070839) |
| 3.0 | 21.0 | GO:0035879 | plasma membrane lactate transport(GO:0035879) |
| 2.9 | 8.8 | GO:1900368 | regulation of RNA interference(GO:1900368) |
| 2.9 | 2.9 | GO:0044725 | chromatin reprogramming in the zygote(GO:0044725) |
| 2.9 | 14.6 | GO:0061727 | methylglyoxal catabolic process to D-lactate via S-lactoyl-glutathione(GO:0019243) methylglyoxal catabolic process(GO:0051596) methylglyoxal catabolic process to lactate(GO:0061727) |
| 2.9 | 11.6 | GO:1904616 | regulation of actin filament binding(GO:1904529) regulation of actin binding(GO:1904616) |
| 2.9 | 17.5 | GO:0021633 | optic nerve structural organization(GO:0021633) |
| 2.9 | 8.7 | GO:0006667 | sphinganine metabolic process(GO:0006667) |
| 2.9 | 23.2 | GO:0050859 | negative regulation of B cell receptor signaling pathway(GO:0050859) |
| 2.9 | 8.6 | GO:0019375 | galactosylceramide biosynthetic process(GO:0006682) galactolipid biosynthetic process(GO:0019375) |
| 2.9 | 42.8 | GO:0046855 | inositol phosphate dephosphorylation(GO:0046855) |
| 2.9 | 11.4 | GO:0018992 | germ-line sex determination(GO:0018992) |
| 2.8 | 11.2 | GO:0034436 | glycoprotein transport(GO:0034436) |
| 2.8 | 2.8 | GO:0006649 | phospholipid transfer to membrane(GO:0006649) |
| 2.7 | 2.7 | GO:0010899 | regulation of phosphatidylcholine catabolic process(GO:0010899) |
| 2.7 | 41.0 | GO:0007288 | sperm axoneme assembly(GO:0007288) |
| 2.7 | 13.7 | GO:0051594 | detection of carbohydrate stimulus(GO:0009730) detection of hexose stimulus(GO:0009732) detection of monosaccharide stimulus(GO:0034287) detection of glucose(GO:0051594) |
| 2.7 | 5.5 | GO:0045819 | positive regulation of glycogen catabolic process(GO:0045819) |
| 2.7 | 21.6 | GO:0045348 | positive regulation of MHC class II biosynthetic process(GO:0045348) |
| 2.7 | 16.2 | GO:0035735 | intraciliary transport involved in cilium morphogenesis(GO:0035735) |
| 2.7 | 13.4 | GO:0016191 | synaptic vesicle uncoating(GO:0016191) |
| 2.7 | 10.6 | GO:0035616 | histone H2B conserved C-terminal lysine deubiquitination(GO:0035616) |
| 2.6 | 10.6 | GO:0006546 | glycine catabolic process(GO:0006546) glycine decarboxylation via glycine cleavage system(GO:0019464) |
| 2.6 | 15.9 | GO:0007198 | adenylate cyclase-inhibiting serotonin receptor signaling pathway(GO:0007198) |
| 2.6 | 15.8 | GO:0002669 | positive regulation of T cell anergy(GO:0002669) positive regulation of lymphocyte anergy(GO:0002913) |
| 2.6 | 7.9 | GO:0034769 | basement membrane disassembly(GO:0034769) |
| 2.6 | 7.9 | GO:0000738 | DNA catabolic process, exonucleolytic(GO:0000738) |
| 2.6 | 18.2 | GO:1904117 | cellular response to vasopressin(GO:1904117) |
| 2.6 | 7.8 | GO:0043606 | histidine catabolic process to glutamate and formamide(GO:0019556) formamide metabolic process(GO:0043606) |
| 2.6 | 18.1 | GO:0010216 | maintenance of DNA methylation(GO:0010216) |
| 2.6 | 7.8 | GO:0034486 | vacuolar transmembrane transport(GO:0034486) chaperone-mediated protein transport involved in chaperone-mediated autophagy(GO:0061741) |
| 2.6 | 10.3 | GO:0030886 | negative regulation of myeloid dendritic cell activation(GO:0030886) |
| 2.6 | 12.9 | GO:0090168 | Golgi reassembly(GO:0090168) |
| 2.6 | 30.9 | GO:0006968 | cellular defense response(GO:0006968) |
| 2.5 | 20.4 | GO:0006054 | N-acetylneuraminate metabolic process(GO:0006054) |
| 2.5 | 5.1 | GO:1903977 | positive regulation of glial cell migration(GO:1903977) |
| 2.5 | 12.7 | GO:0034154 | toll-like receptor 7 signaling pathway(GO:0034154) |
| 2.5 | 7.5 | GO:0045079 | negative regulation of chemokine biosynthetic process(GO:0045079) |
| 2.5 | 10.0 | GO:0071802 | negative regulation of podosome assembly(GO:0071802) |
| 2.5 | 7.5 | GO:0014707 | branchiomeric skeletal muscle development(GO:0014707) |
| 2.5 | 2.5 | GO:0046544 | development of secondary male sexual characteristics(GO:0046544) |
| 2.4 | 17.0 | GO:0019482 | beta-alanine metabolic process(GO:0019482) |
| 2.4 | 14.5 | GO:0002568 | somatic diversification of T cell receptor genes(GO:0002568) somatic recombination of T cell receptor gene segments(GO:0002681) T cell receptor V(D)J recombination(GO:0033153) |
| 2.4 | 7.1 | GO:0030824 | negative regulation of cGMP metabolic process(GO:0030824) |
| 2.4 | 16.6 | GO:0033572 | transferrin transport(GO:0033572) |
| 2.4 | 7.1 | GO:0045082 | positive regulation of interleukin-10 biosynthetic process(GO:0045082) |
| 2.3 | 20.9 | GO:0010572 | positive regulation of platelet activation(GO:0010572) |
| 2.3 | 2.3 | GO:0097212 | lysosomal membrane organization(GO:0097212) |
| 2.3 | 9.2 | GO:0014028 | positive regulation of transcription from RNA polymerase II promoter involved in myocardial precursor cell differentiation(GO:0003257) notochord formation(GO:0014028) |
| 2.3 | 4.5 | GO:0002581 | negative regulation of antigen processing and presentation of peptide or polysaccharide antigen via MHC class II(GO:0002581) |
| 2.3 | 11.4 | GO:0021914 | negative regulation of smoothened signaling pathway involved in ventral spinal cord patterning(GO:0021914) |
| 2.3 | 6.8 | GO:2000620 | positive regulation of histone H4-K16 acetylation(GO:2000620) |
| 2.2 | 6.7 | GO:0071395 | response to jasmonic acid(GO:0009753) cellular response to jasmonic acid stimulus(GO:0071395) |
| 2.2 | 13.4 | GO:0038026 | reelin-mediated signaling pathway(GO:0038026) |
| 2.2 | 15.5 | GO:0070562 | regulation of vitamin D receptor signaling pathway(GO:0070562) |
| 2.2 | 4.4 | GO:0033206 | meiotic cytokinesis(GO:0033206) |
| 2.2 | 8.8 | GO:0060431 | primary lung bud formation(GO:0060431) |
| 2.1 | 8.6 | GO:0097026 | dendritic cell dendrite assembly(GO:0097026) |
| 2.1 | 2.1 | GO:1902995 | regulation of phospholipid efflux(GO:1902994) positive regulation of phospholipid efflux(GO:1902995) |
| 2.1 | 16.6 | GO:0006751 | glutathione catabolic process(GO:0006751) |
| 2.1 | 10.3 | GO:0002036 | regulation of L-glutamate transport(GO:0002036) |
| 2.0 | 8.2 | GO:0006564 | L-serine biosynthetic process(GO:0006564) |
| 2.0 | 12.2 | GO:0046874 | quinolinate metabolic process(GO:0046874) |
| 2.0 | 46.5 | GO:0030574 | collagen catabolic process(GO:0030574) |
| 2.0 | 8.1 | GO:1904781 | positive regulation of protein localization to centrosome(GO:1904781) |
| 2.0 | 8.1 | GO:0040009 | regulation of growth rate(GO:0040009) |
| 2.0 | 14.1 | GO:0000103 | sulfate assimilation(GO:0000103) |
| 2.0 | 10.0 | GO:0060662 | tube lumen cavitation(GO:0060605) salivary gland cavitation(GO:0060662) |
| 2.0 | 8.0 | GO:0032701 | negative regulation of interleukin-18 production(GO:0032701) |
| 2.0 | 13.9 | GO:0051126 | negative regulation of actin nucleation(GO:0051126) |
| 2.0 | 11.8 | GO:0071386 | cellular response to corticosterone stimulus(GO:0071386) |
| 2.0 | 7.9 | GO:0050893 | sensory processing(GO:0050893) |
| 2.0 | 5.9 | GO:0016539 | intein-mediated protein splicing(GO:0016539) protein splicing(GO:0030908) |
| 1.9 | 15.5 | GO:0051152 | positive regulation of smooth muscle cell differentiation(GO:0051152) |
| 1.9 | 5.8 | GO:0007089 | traversing start control point of mitotic cell cycle(GO:0007089) |
| 1.9 | 3.9 | GO:0060545 | positive regulation of necroptotic process(GO:0060545) |
| 1.9 | 36.2 | GO:0048026 | positive regulation of mRNA splicing, via spliceosome(GO:0048026) |
| 1.9 | 7.6 | GO:0061083 | regulation of protein refolding(GO:0061083) negative regulation of protein refolding(GO:0061084) |
| 1.9 | 17.0 | GO:0060770 | negative regulation of epithelial cell proliferation involved in prostate gland development(GO:0060770) |
| 1.9 | 3.8 | GO:1902809 | regulation of skeletal muscle fiber differentiation(GO:1902809) |
| 1.9 | 1.9 | GO:0038183 | bile acid signaling pathway(GO:0038183) |
| 1.9 | 16.8 | GO:0042159 | lipoprotein catabolic process(GO:0042159) |
| 1.9 | 5.6 | GO:0060086 | circadian temperature homeostasis(GO:0060086) |
| 1.9 | 16.8 | GO:0070314 | G1 to G0 transition(GO:0070314) |
| 1.9 | 16.7 | GO:0070091 | glucagon secretion(GO:0070091) regulation of glucagon secretion(GO:0070092) |
| 1.8 | 9.2 | GO:0033234 | negative regulation of protein sumoylation(GO:0033234) |
| 1.8 | 7.3 | GO:0042997 | negative regulation of Golgi to plasma membrane protein transport(GO:0042997) |
| 1.8 | 10.9 | GO:0033031 | positive regulation of neutrophil apoptotic process(GO:0033031) |
| 1.8 | 5.5 | GO:0046061 | dATP catabolic process(GO:0046061) |
| 1.8 | 7.3 | GO:0015888 | thiamine transport(GO:0015888) |
| 1.8 | 10.9 | GO:0032071 | regulation of endodeoxyribonuclease activity(GO:0032071) |
| 1.8 | 7.1 | GO:1901837 | negative regulation of transcription of nuclear large rRNA transcript from RNA polymerase I promoter(GO:1901837) |
| 1.8 | 7.1 | GO:0097401 | synaptic vesicle lumen acidification(GO:0097401) |
| 1.8 | 8.8 | GO:0019323 | pentose catabolic process(GO:0019323) |
| 1.8 | 12.3 | GO:0035469 | determination of pancreatic left/right asymmetry(GO:0035469) |
| 1.8 | 22.9 | GO:0034587 | piRNA metabolic process(GO:0034587) |
| 1.8 | 5.3 | GO:0018094 | protein polyglycylation(GO:0018094) |
| 1.7 | 3.5 | GO:0014045 | establishment of endothelial blood-brain barrier(GO:0014045) central nervous system vasculogenesis(GO:0022009) renal outer medulla development(GO:0072054) |
| 1.7 | 22.5 | GO:1904667 | negative regulation of ubiquitin protein ligase activity(GO:1904667) |
| 1.7 | 5.2 | GO:1990108 | protein linear deubiquitination(GO:1990108) |
| 1.7 | 5.2 | GO:0060369 | positive regulation of Fc receptor mediated stimulatory signaling pathway(GO:0060369) |
| 1.7 | 3.4 | GO:0097477 | lateral motor column neuron migration(GO:0097477) |
| 1.7 | 8.5 | GO:0071500 | cellular response to nitrosative stress(GO:0071500) |
| 1.7 | 33.5 | GO:0006910 | phagocytosis, recognition(GO:0006910) |
| 1.6 | 24.7 | GO:0006020 | inositol metabolic process(GO:0006020) |
| 1.6 | 19.7 | GO:2000650 | negative regulation of sodium ion transmembrane transporter activity(GO:2000650) |
| 1.6 | 13.1 | GO:0000395 | mRNA 5'-splice site recognition(GO:0000395) |
| 1.6 | 8.2 | GO:0006563 | L-serine metabolic process(GO:0006563) |
| 1.6 | 22.9 | GO:0061029 | eyelid development in camera-type eye(GO:0061029) |
| 1.6 | 45.4 | GO:1905144 | acetylcholine receptor signaling pathway(GO:0095500) signal transduction involved in cellular response to ammonium ion(GO:1903831) response to acetylcholine(GO:1905144) cellular response to acetylcholine(GO:1905145) |
| 1.6 | 11.3 | GO:0035745 | T-helper 2 cell cytokine production(GO:0035745) |
| 1.6 | 6.4 | GO:0070368 | positive regulation of hepatocyte differentiation(GO:0070368) |
| 1.6 | 4.8 | GO:1903760 | regulation of voltage-gated potassium channel activity involved in ventricular cardiac muscle cell action potential repolarization(GO:1903760) |
| 1.6 | 3.2 | GO:0045959 | negative regulation of complement activation, classical pathway(GO:0045959) |
| 1.6 | 4.7 | GO:0090467 | L-arginine import(GO:0043091) arginine import(GO:0090467) L-arginine transport(GO:1902023) |
| 1.5 | 23.2 | GO:0043312 | neutrophil degranulation(GO:0043312) |
| 1.5 | 16.9 | GO:0035589 | G-protein coupled purinergic nucleotide receptor signaling pathway(GO:0035589) |
| 1.5 | 12.3 | GO:0030644 | cellular chloride ion homeostasis(GO:0030644) |
| 1.5 | 19.8 | GO:1990118 | sodium ion import across plasma membrane(GO:0098719) sodium ion import into cell(GO:1990118) |
| 1.5 | 18.2 | GO:0089711 | L-glutamate transmembrane transport(GO:0089711) |
| 1.5 | 13.4 | GO:0035520 | monoubiquitinated protein deubiquitination(GO:0035520) |
| 1.5 | 4.4 | GO:0098971 | anterograde dendritic transport of neurotransmitter receptor complex(GO:0098971) |
| 1.5 | 11.8 | GO:0014054 | positive regulation of gamma-aminobutyric acid secretion(GO:0014054) |
| 1.5 | 5.9 | GO:0080154 | regulation of fertilization(GO:0080154) |
| 1.5 | 2.9 | GO:0031587 | positive regulation of inositol 1,4,5-trisphosphate-sensitive calcium-release channel activity(GO:0031587) |
| 1.5 | 7.3 | GO:0061086 | negative regulation of histone H3-K27 methylation(GO:0061086) |
| 1.5 | 2.9 | GO:0071454 | cellular response to anoxia(GO:0071454) |
| 1.4 | 8.7 | GO:0006297 | nucleotide-excision repair, DNA gap filling(GO:0006297) |
| 1.4 | 4.3 | GO:1902269 | positive regulation of polyamine transmembrane transport(GO:1902269) |
| 1.4 | 4.3 | GO:1904444 | regulation of establishment of Sertoli cell barrier(GO:1904444) |
| 1.4 | 4.3 | GO:0015891 | iron chelate transport(GO:0015688) siderophore transport(GO:0015891) |
| 1.4 | 4.3 | GO:1904373 | response to kainic acid(GO:1904373) |
| 1.4 | 12.8 | GO:0021796 | cerebral cortex regionalization(GO:0021796) |
| 1.4 | 21.3 | GO:0051988 | regulation of attachment of spindle microtubules to kinetochore(GO:0051988) |
| 1.4 | 5.7 | GO:0001923 | B-1 B cell differentiation(GO:0001923) |
| 1.4 | 41.0 | GO:0002675 | positive regulation of acute inflammatory response(GO:0002675) |
| 1.4 | 4.2 | GO:0016267 | O-glycan processing, core 1(GO:0016267) |
| 1.4 | 4.2 | GO:0003051 | angiotensin-mediated drinking behavior(GO:0003051) |
| 1.4 | 7.0 | GO:2000601 | positive regulation of Arp2/3 complex-mediated actin nucleation(GO:2000601) |
| 1.4 | 27.5 | GO:0043011 | myeloid dendritic cell differentiation(GO:0043011) |
| 1.4 | 85.0 | GO:0038083 | peptidyl-tyrosine autophosphorylation(GO:0038083) |
| 1.4 | 4.1 | GO:0032383 | regulation of intracellular lipid transport(GO:0032377) regulation of intracellular sterol transport(GO:0032380) regulation of intracellular cholesterol transport(GO:0032383) |
| 1.3 | 10.8 | GO:0045617 | negative regulation of keratinocyte differentiation(GO:0045617) |
| 1.3 | 5.4 | GO:0090521 | glomerular visceral epithelial cell migration(GO:0090521) |
| 1.3 | 9.2 | GO:0006384 | transcription initiation from RNA polymerase III promoter(GO:0006384) |
| 1.3 | 15.7 | GO:0030206 | chondroitin sulfate biosynthetic process(GO:0030206) |
| 1.3 | 6.5 | GO:0045590 | negative regulation of regulatory T cell differentiation(GO:0045590) |
| 1.3 | 3.9 | GO:1904685 | regulation of chemokine (C-C motif) ligand 2 secretion(GO:1904207) positive regulation of chemokine (C-C motif) ligand 2 secretion(GO:1904209) positive regulation of metalloendopeptidase activity(GO:1904685) |
| 1.3 | 3.9 | GO:0042489 | negative regulation of odontogenesis of dentin-containing tooth(GO:0042489) |
| 1.3 | 2.6 | GO:0090427 | activation of meiosis(GO:0090427) |
| 1.3 | 5.1 | GO:0034653 | diterpenoid catabolic process(GO:0016103) retinoic acid catabolic process(GO:0034653) |
| 1.3 | 1.3 | GO:2000195 | negative regulation of female gonad development(GO:2000195) |
| 1.3 | 13.9 | GO:2000271 | positive regulation of fibroblast apoptotic process(GO:2000271) |
| 1.2 | 3.7 | GO:0021997 | neural plate axis specification(GO:0021997) |
| 1.2 | 41.7 | GO:0007339 | binding of sperm to zona pellucida(GO:0007339) |
| 1.2 | 13.4 | GO:2000480 | negative regulation of cAMP-dependent protein kinase activity(GO:2000480) |
| 1.2 | 24.4 | GO:0048240 | sperm capacitation(GO:0048240) |
| 1.2 | 3.6 | GO:0051343 | positive regulation of cyclic-nucleotide phosphodiesterase activity(GO:0051343) |
| 1.2 | 14.4 | GO:0003376 | sphingosine-1-phosphate signaling pathway(GO:0003376) |
| 1.2 | 21.5 | GO:0043496 | regulation of protein homodimerization activity(GO:0043496) |
| 1.2 | 13.1 | GO:2000018 | regulation of male gonad development(GO:2000018) |
| 1.2 | 5.9 | GO:0015755 | carbohydrate utilization(GO:0009758) fructose transport(GO:0015755) |
| 1.2 | 4.7 | GO:1903576 | response to L-arginine(GO:1903576) |
| 1.2 | 10.7 | GO:0050957 | equilibrioception(GO:0050957) |
| 1.2 | 9.4 | GO:0016056 | rhodopsin mediated signaling pathway(GO:0016056) |
| 1.2 | 9.4 | GO:0002361 | CD4-positive, CD25-positive, alpha-beta regulatory T cell differentiation(GO:0002361) |
| 1.2 | 16.4 | GO:0015693 | magnesium ion transport(GO:0015693) magnesium ion transmembrane transport(GO:1903830) |
| 1.2 | 5.9 | GO:0033313 | meiotic cell cycle checkpoint(GO:0033313) |
| 1.2 | 3.5 | GO:1904152 | regulation of retrograde protein transport, ER to cytosol(GO:1904152) |
| 1.2 | 11.7 | GO:0006655 | phosphatidylglycerol biosynthetic process(GO:0006655) |
| 1.2 | 5.8 | GO:0051754 | male meiosis chromosome segregation(GO:0007060) meiotic sister chromatid cohesion, centromeric(GO:0051754) |
| 1.2 | 7.0 | GO:0038169 | somatostatin receptor signaling pathway(GO:0038169) somatostatin signaling pathway(GO:0038170) |
| 1.2 | 10.4 | GO:0006735 | NADH regeneration(GO:0006735) canonical glycolysis(GO:0061621) glucose catabolic process to pyruvate(GO:0061718) |
| 1.2 | 4.6 | GO:0044339 | canonical Wnt signaling pathway involved in osteoblast differentiation(GO:0044339) |
| 1.1 | 3.4 | GO:1903347 | negative regulation of bicellular tight junction assembly(GO:1903347) |
| 1.1 | 16.0 | GO:0043653 | mitochondrial fragmentation involved in apoptotic process(GO:0043653) |
| 1.1 | 14.6 | GO:0042832 | defense response to protozoan(GO:0042832) |
| 1.1 | 17.9 | GO:0045653 | negative regulation of megakaryocyte differentiation(GO:0045653) |
| 1.1 | 11.1 | GO:0030225 | macrophage differentiation(GO:0030225) |
| 1.1 | 3.3 | GO:0018364 | peptidyl-glutamine methylation(GO:0018364) |
| 1.1 | 10.0 | GO:0030223 | neutrophil differentiation(GO:0030223) |
| 1.1 | 2.2 | GO:0031394 | positive regulation of prostaglandin biosynthetic process(GO:0031394) positive regulation of unsaturated fatty acid biosynthetic process(GO:2001280) |
| 1.1 | 3.3 | GO:0021586 | pons maturation(GO:0021586) olefin metabolic process(GO:1900673) |
| 1.1 | 6.5 | GO:0045113 | regulation of integrin biosynthetic process(GO:0045113) |
| 1.1 | 3.2 | GO:0048936 | neurofilament bundle assembly(GO:0033693) peripheral nervous system neuron axonogenesis(GO:0048936) |
| 1.1 | 8.5 | GO:0070244 | negative regulation of thymocyte apoptotic process(GO:0070244) |
| 1.1 | 18.9 | GO:0001516 | prostaglandin biosynthetic process(GO:0001516) prostanoid biosynthetic process(GO:0046457) |
| 1.0 | 4.2 | GO:0043046 | DNA methylation involved in gamete generation(GO:0043046) |
| 1.0 | 2.1 | GO:0060672 | epithelial cell differentiation involved in embryonic placenta development(GO:0060671) epithelial cell morphogenesis involved in placental branching(GO:0060672) |
| 1.0 | 10.4 | GO:0070327 | thyroid hormone transport(GO:0070327) |
| 1.0 | 3.1 | GO:0033387 | putrescine biosynthetic process from ornithine(GO:0033387) |
| 1.0 | 9.3 | GO:0042487 | regulation of odontogenesis of dentin-containing tooth(GO:0042487) |
| 1.0 | 14.4 | GO:0045581 | negative regulation of T cell differentiation(GO:0045581) |
| 1.0 | 3.0 | GO:1904211 | membrane protein proteolysis involved in retrograde protein transport, ER to cytosol(GO:1904211) |
| 1.0 | 52.6 | GO:0002260 | lymphocyte homeostasis(GO:0002260) |
| 1.0 | 3.0 | GO:2000851 | positive regulation of cortisol secretion(GO:0051464) positive regulation of glucocorticoid secretion(GO:2000851) |
| 1.0 | 7.0 | GO:0046600 | negative regulation of centriole replication(GO:0046600) |
| 1.0 | 7.0 | GO:0046655 | folic acid metabolic process(GO:0046655) |
| 1.0 | 9.9 | GO:0042270 | protection from natural killer cell mediated cytotoxicity(GO:0042270) |
| 1.0 | 2.9 | GO:2000211 | negative regulation of cellular amino acid metabolic process(GO:0045763) regulation of glutamate metabolic process(GO:2000211) |
| 1.0 | 3.8 | GO:0051958 | methotrexate transport(GO:0051958) |
| 1.0 | 1.9 | GO:0045919 | positive regulation of cytolysis(GO:0045919) |
| 0.9 | 3.8 | GO:0030321 | transepithelial chloride transport(GO:0030321) |
| 0.9 | 3.8 | GO:0043985 | histone H4-R3 methylation(GO:0043985) |
| 0.9 | 8.4 | GO:0015732 | prostaglandin transport(GO:0015732) |
| 0.9 | 3.6 | GO:0006369 | termination of RNA polymerase II transcription(GO:0006369) |
| 0.9 | 2.7 | GO:0071469 | cellular response to alkaline pH(GO:0071469) |
| 0.9 | 5.3 | GO:2000402 | negative regulation of lymphocyte migration(GO:2000402) |
| 0.9 | 5.3 | GO:0034242 | negative regulation of syncytium formation by plasma membrane fusion(GO:0034242) |
| 0.9 | 2.6 | GO:2001034 | positive regulation of double-strand break repair via nonhomologous end joining(GO:2001034) |
| 0.9 | 3.5 | GO:0021871 | forebrain regionalization(GO:0021871) |
| 0.9 | 6.1 | GO:0042996 | regulation of Golgi to plasma membrane protein transport(GO:0042996) |
| 0.9 | 7.0 | GO:0043102 | amino acid salvage(GO:0043102) L-methionine salvage(GO:0071267) |
| 0.9 | 8.7 | GO:0070995 | NADPH oxidation(GO:0070995) |
| 0.9 | 4.3 | GO:0050925 | negative regulation of negative chemotaxis(GO:0050925) |
| 0.9 | 5.2 | GO:0090286 | cytoskeletal anchoring at nuclear membrane(GO:0090286) |
| 0.9 | 3.4 | GO:0006104 | succinyl-CoA metabolic process(GO:0006104) |
| 0.9 | 6.9 | GO:2000653 | regulation of genetic imprinting(GO:2000653) |
| 0.8 | 6.8 | GO:2000766 | negative regulation of cytoplasmic translation(GO:2000766) |
| 0.8 | 1.7 | GO:0007406 | negative regulation of neuroblast proliferation(GO:0007406) |
| 0.8 | 22.7 | GO:0019373 | epoxygenase P450 pathway(GO:0019373) |
| 0.8 | 7.6 | GO:0033314 | mitotic DNA replication checkpoint(GO:0033314) |
| 0.8 | 1.7 | GO:0031448 | regulation of fast-twitch skeletal muscle fiber contraction(GO:0031446) positive regulation of fast-twitch skeletal muscle fiber contraction(GO:0031448) |
| 0.8 | 6.7 | GO:0019372 | lipoxygenase pathway(GO:0019372) |
| 0.8 | 3.3 | GO:1903553 | positive regulation of extracellular exosome assembly(GO:1903553) |
| 0.8 | 9.7 | GO:0061158 | 3'-UTR-mediated mRNA destabilization(GO:0061158) |
| 0.8 | 4.8 | GO:0070493 | thrombin receptor signaling pathway(GO:0070493) |
| 0.8 | 4.8 | GO:0097116 | gephyrin clustering involved in postsynaptic density assembly(GO:0097116) |
| 0.8 | 8.7 | GO:0007196 | adenylate cyclase-inhibiting G-protein coupled glutamate receptor signaling pathway(GO:0007196) |
| 0.8 | 21.4 | GO:0046839 | phospholipid dephosphorylation(GO:0046839) |
| 0.8 | 3.2 | GO:0070318 | positive regulation of G0 to G1 transition(GO:0070318) |
| 0.8 | 43.1 | GO:0050852 | T cell receptor signaling pathway(GO:0050852) |
| 0.8 | 7.0 | GO:0034058 | endosomal vesicle fusion(GO:0034058) |
| 0.8 | 5.5 | GO:0046826 | negative regulation of protein export from nucleus(GO:0046826) |
| 0.8 | 22.5 | GO:0070228 | regulation of lymphocyte apoptotic process(GO:0070228) |
| 0.8 | 4.6 | GO:0035331 | negative regulation of hippo signaling(GO:0035331) |
| 0.8 | 3.1 | GO:2000189 | positive regulation of cholesterol homeostasis(GO:2000189) |
| 0.8 | 3.8 | GO:0043152 | induction of bacterial agglutination(GO:0043152) |
| 0.8 | 8.4 | GO:0006228 | UTP biosynthetic process(GO:0006228) |
| 0.8 | 2.3 | GO:0021530 | spinal cord oligodendrocyte cell differentiation(GO:0021529) spinal cord oligodendrocyte cell fate specification(GO:0021530) |
| 0.8 | 9.0 | GO:0060628 | regulation of ER to Golgi vesicle-mediated transport(GO:0060628) |
| 0.8 | 15.0 | GO:0010447 | response to acidic pH(GO:0010447) |
| 0.7 | 5.2 | GO:0006268 | DNA unwinding involved in DNA replication(GO:0006268) |
| 0.7 | 4.4 | GO:1990416 | cellular response to brain-derived neurotrophic factor stimulus(GO:1990416) |
| 0.7 | 4.4 | GO:0006398 | mRNA 3'-end processing by stem-loop binding and cleavage(GO:0006398) |
| 0.7 | 3.6 | GO:0018242 | protein O-linked glycosylation via serine(GO:0018242) protein O-linked glycosylation via threonine(GO:0018243) |
| 0.7 | 0.7 | GO:0002904 | positive regulation of B cell apoptotic process(GO:0002904) |
| 0.7 | 10.8 | GO:0046337 | phosphatidylethanolamine metabolic process(GO:0046337) |
| 0.7 | 3.6 | GO:0003157 | endocardium development(GO:0003157) |
| 0.7 | 2.9 | GO:0043137 | DNA replication, removal of RNA primer(GO:0043137) |
| 0.7 | 2.9 | GO:0018211 | protein C-linked glycosylation(GO:0018103) peptidyl-tryptophan modification(GO:0018211) protein C-linked glycosylation via tryptophan(GO:0018317) protein C-linked glycosylation via 2'-alpha-mannosyl-L-tryptophan(GO:0018406) |
| 0.7 | 9.1 | GO:0051014 | actin filament severing(GO:0051014) |
| 0.7 | 3.5 | GO:2000773 | negative regulation of cellular senescence(GO:2000773) |
| 0.7 | 3.4 | GO:1901678 | iron coordination entity transport(GO:1901678) |
| 0.7 | 12.3 | GO:0015812 | gamma-aminobutyric acid transport(GO:0015812) |
| 0.7 | 2.0 | GO:0021798 | forebrain dorsal/ventral pattern formation(GO:0021798) telencephalon regionalization(GO:0021978) |
| 0.7 | 2.7 | GO:0035494 | SNARE complex disassembly(GO:0035494) |
| 0.7 | 20.7 | GO:0006779 | porphyrin-containing compound biosynthetic process(GO:0006779) |
| 0.7 | 2.7 | GO:0044107 | cellular alcohol metabolic process(GO:0044107) cellular alcohol biosynthetic process(GO:0044108) |
| 0.7 | 2.6 | GO:2000124 | regulation of endocannabinoid signaling pathway(GO:2000124) |
| 0.7 | 6.6 | GO:0000733 | DNA strand renaturation(GO:0000733) |
| 0.7 | 13.1 | GO:0060037 | pharyngeal system development(GO:0060037) |
| 0.7 | 6.5 | GO:0071377 | cellular response to glucagon stimulus(GO:0071377) |
| 0.6 | 2.6 | GO:0008627 | intrinsic apoptotic signaling pathway in response to osmotic stress(GO:0008627) |
| 0.6 | 0.6 | GO:2000777 | positive regulation of proteasomal ubiquitin-dependent protein catabolic process involved in cellular response to hypoxia(GO:2000777) |
| 0.6 | 1.9 | GO:0042350 | GDP-L-fucose biosynthetic process(GO:0042350) |
| 0.6 | 1.3 | GO:0044268 | multicellular organismal protein metabolic process(GO:0044268) |
| 0.6 | 2.6 | GO:1904816 | positive regulation of protein localization to chromosome, telomeric region(GO:1904816) |
| 0.6 | 1.3 | GO:0071718 | sodium-independent icosanoid transport(GO:0071718) |
| 0.6 | 7.6 | GO:1902018 | negative regulation of cilium assembly(GO:1902018) |
| 0.6 | 3.8 | GO:1903715 | regulation of aerobic respiration(GO:1903715) |
| 0.6 | 1.9 | GO:0001561 | fatty acid alpha-oxidation(GO:0001561) |
| 0.6 | 8.7 | GO:0016578 | histone deubiquitination(GO:0016578) |
| 0.6 | 1.2 | GO:1904354 | negative regulation of telomere capping(GO:1904354) |
| 0.6 | 1.8 | GO:0055005 | ventricular cardiac myofibril assembly(GO:0055005) |
| 0.6 | 1.8 | GO:0018916 | nitrobenzene metabolic process(GO:0018916) |
| 0.6 | 10.4 | GO:0006895 | Golgi to endosome transport(GO:0006895) |
| 0.6 | 9.2 | GO:0044364 | killing of cells of other organism(GO:0031640) disruption of cells of other organism(GO:0044364) |
| 0.6 | 0.6 | GO:1904000 | positive regulation of eating behavior(GO:1904000) |
| 0.6 | 4.2 | GO:0034497 | protein localization to pre-autophagosomal structure(GO:0034497) |
| 0.6 | 3.0 | GO:0090110 | cargo loading into COPII-coated vesicle(GO:0090110) |
| 0.6 | 9.6 | GO:0045671 | negative regulation of osteoclast differentiation(GO:0045671) |
| 0.6 | 12.0 | GO:0044818 | mitotic G2/M transition checkpoint(GO:0044818) |
| 0.6 | 5.9 | GO:0035524 | proline transmembrane transport(GO:0035524) |
| 0.6 | 2.3 | GO:0003419 | growth plate cartilage chondrocyte proliferation(GO:0003419) |
| 0.6 | 1.7 | GO:1901994 | negative regulation of meiotic cell cycle phase transition(GO:1901994) |
| 0.6 | 15.7 | GO:0030261 | chromosome condensation(GO:0030261) |
| 0.6 | 6.8 | GO:0070935 | 3'-UTR-mediated mRNA stabilization(GO:0070935) |
| 0.6 | 5.7 | GO:0009312 | oligosaccharide biosynthetic process(GO:0009312) |
| 0.6 | 5.6 | GO:0021684 | cerebellar granular layer formation(GO:0021684) cerebellar granule cell differentiation(GO:0021707) |
| 0.6 | 1.7 | GO:0051005 | regulation of lipoprotein lipase activity(GO:0051004) negative regulation of lipoprotein lipase activity(GO:0051005) |
| 0.6 | 15.1 | GO:0048536 | spleen development(GO:0048536) |
| 0.6 | 11.2 | GO:0050482 | arachidonic acid secretion(GO:0050482) arachidonate transport(GO:1903963) |
| 0.6 | 4.5 | GO:0046710 | GDP metabolic process(GO:0046710) |
| 0.6 | 4.4 | GO:0097264 | self proteolysis(GO:0097264) |
| 0.6 | 3.9 | GO:0098789 | pre-mRNA cleavage required for polyadenylation(GO:0098789) |
| 0.6 | 5.0 | GO:0006488 | dolichol-linked oligosaccharide biosynthetic process(GO:0006488) |
| 0.5 | 1.1 | GO:0060157 | urinary bladder development(GO:0060157) |
| 0.5 | 1.6 | GO:0033026 | mast cell homeostasis(GO:0033023) mast cell apoptotic process(GO:0033024) regulation of mast cell apoptotic process(GO:0033025) negative regulation of mast cell apoptotic process(GO:0033026) mast cell proliferation(GO:0070662) regulation of mast cell proliferation(GO:0070666) positive regulation of mast cell proliferation(GO:0070668) |
| 0.5 | 3.8 | GO:0042699 | follicle-stimulating hormone signaling pathway(GO:0042699) |
| 0.5 | 4.8 | GO:0010457 | centriole-centriole cohesion(GO:0010457) |
| 0.5 | 16.9 | GO:0031648 | protein destabilization(GO:0031648) |
| 0.5 | 3.7 | GO:2001275 | positive regulation of glucose import in response to insulin stimulus(GO:2001275) |
| 0.5 | 2.6 | GO:0048664 | neuron fate determination(GO:0048664) |
| 0.5 | 3.1 | GO:0061737 | leukotriene signaling pathway(GO:0061737) |
| 0.5 | 2.1 | GO:0030311 | poly-N-acetyllactosamine metabolic process(GO:0030309) poly-N-acetyllactosamine biosynthetic process(GO:0030311) |
| 0.5 | 4.1 | GO:0014022 | neural plate elongation(GO:0014022) convergent extension involved in neural plate elongation(GO:0022007) |
| 0.5 | 5.7 | GO:0046548 | retinal rod cell development(GO:0046548) |
| 0.5 | 7.7 | GO:0050853 | B cell receptor signaling pathway(GO:0050853) |
| 0.5 | 4.6 | GO:0030432 | peristalsis(GO:0030432) |
| 0.5 | 6.1 | GO:0046784 | viral mRNA export from host cell nucleus(GO:0046784) |
| 0.5 | 3.0 | GO:0033089 | positive regulation of T cell differentiation in thymus(GO:0033089) positive regulation of thymocyte aggregation(GO:2000400) |
| 0.5 | 8.5 | GO:0007602 | phototransduction(GO:0007602) |
| 0.5 | 11.9 | GO:0007130 | synaptonemal complex assembly(GO:0007130) |
| 0.5 | 1.5 | GO:0007181 | transforming growth factor beta receptor complex assembly(GO:0007181) |
| 0.5 | 3.4 | GO:0016559 | peroxisome fission(GO:0016559) |
| 0.5 | 5.4 | GO:0044821 | meiotic telomere tethering at nuclear periphery(GO:0044821) meiotic attachment of telomere to nuclear envelope(GO:0070197) chromosome attachment to the nuclear envelope(GO:0097240) |
| 0.5 | 2.9 | GO:0046836 | glycolipid transport(GO:0046836) |
| 0.5 | 3.4 | GO:0018095 | protein polyglutamylation(GO:0018095) |
| 0.5 | 44.4 | GO:0007586 | digestion(GO:0007586) |
| 0.5 | 1.4 | GO:0006296 | nucleotide-excision repair, DNA incision, 5'-to lesion(GO:0006296) |
| 0.5 | 1.4 | GO:0071038 | nuclear mRNA surveillance of mRNA 3'-end processing(GO:0071031) nuclear polyadenylation-dependent tRNA catabolic process(GO:0071038) nuclear retention of pre-mRNA with aberrant 3'-ends at the site of transcription(GO:0071049) |
| 0.5 | 1.9 | GO:1902474 | positive regulation of protein localization to synapse(GO:1902474) |
| 0.5 | 2.4 | GO:0010273 | detoxification of copper ion(GO:0010273) response to chromate(GO:0046687) stress response to copper ion(GO:1990169) |
| 0.5 | 2.4 | GO:0045636 | positive regulation of melanocyte differentiation(GO:0045636) positive regulation of neuroepithelial cell differentiation(GO:1902913) |
| 0.5 | 1.8 | GO:0010571 | positive regulation of nuclear cell cycle DNA replication(GO:0010571) |
| 0.5 | 2.3 | GO:0043615 | astrocyte cell migration(GO:0043615) |
| 0.5 | 0.5 | GO:0008078 | mesodermal cell migration(GO:0008078) |
| 0.5 | 6.4 | GO:0009263 | deoxyribonucleotide biosynthetic process(GO:0009263) |
| 0.5 | 12.7 | GO:0045022 | early endosome to late endosome transport(GO:0045022) |
| 0.4 | 2.7 | GO:0018230 | peptidyl-L-cysteine S-palmitoylation(GO:0018230) peptidyl-S-diacylglycerol-L-cysteine biosynthetic process from peptidyl-cysteine(GO:0018231) |
| 0.4 | 4.5 | GO:0060081 | membrane hyperpolarization(GO:0060081) |
| 0.4 | 0.4 | GO:0002525 | acute inflammatory response to non-antigenic stimulus(GO:0002525) |
| 0.4 | 1.7 | GO:0031133 | regulation of axon diameter(GO:0031133) |
| 0.4 | 1.3 | GO:0090344 | negative regulation of cell aging(GO:0090344) |
| 0.4 | 1.3 | GO:0052047 | interaction with other organism via secreted substance involved in symbiotic interaction(GO:0052047) |
| 0.4 | 2.1 | GO:0060075 | regulation of resting membrane potential(GO:0060075) |
| 0.4 | 4.7 | GO:0002347 | response to tumor cell(GO:0002347) |
| 0.4 | 15.3 | GO:0043666 | regulation of phosphoprotein phosphatase activity(GO:0043666) |
| 0.4 | 11.2 | GO:0009649 | entrainment of circadian clock(GO:0009649) |
| 0.4 | 1.6 | GO:0035948 | positive regulation of gluconeogenesis by positive regulation of transcription from RNA polymerase II promoter(GO:0035948) |
| 0.4 | 15.1 | GO:0007628 | adult walking behavior(GO:0007628) |
| 0.4 | 7.9 | GO:0009214 | cyclic nucleotide catabolic process(GO:0009214) |
| 0.4 | 2.0 | GO:0003374 | dynamin polymerization involved in membrane fission(GO:0003373) dynamin polymerization involved in mitochondrial fission(GO:0003374) |
| 0.4 | 7.3 | GO:0042403 | thyroid hormone metabolic process(GO:0042403) |
| 0.4 | 1.9 | GO:0042276 | error-prone translesion synthesis(GO:0042276) |
| 0.4 | 1.9 | GO:0071394 | cellular response to testosterone stimulus(GO:0071394) |
| 0.4 | 1.9 | GO:0043951 | negative regulation of cAMP-mediated signaling(GO:0043951) |
| 0.4 | 1.8 | GO:0060405 | regulation of penile erection(GO:0060405) positive regulation of penile erection(GO:0060406) |
| 0.4 | 2.6 | GO:0051661 | maintenance of centrosome location(GO:0051661) |
| 0.4 | 2.9 | GO:0097119 | postsynaptic density protein 95 clustering(GO:0097119) |
| 0.4 | 1.1 | GO:0035694 | mitochondrial protein catabolic process(GO:0035694) |
| 0.4 | 1.4 | GO:0000414 | regulation of histone H3-K36 methylation(GO:0000414) |
| 0.4 | 0.7 | GO:0016078 | tRNA catabolic process(GO:0016078) |
| 0.4 | 1.8 | GO:0046015 | regulation of transcription by glucose(GO:0046015) |
| 0.4 | 7.1 | GO:0055069 | zinc ion homeostasis(GO:0055069) |
| 0.4 | 4.2 | GO:0031115 | negative regulation of microtubule polymerization(GO:0031115) |
| 0.3 | 1.0 | GO:0042357 | thiamine diphosphate metabolic process(GO:0042357) |
| 0.3 | 1.4 | GO:0001771 | immunological synapse formation(GO:0001771) |
| 0.3 | 7.6 | GO:0019432 | triglyceride biosynthetic process(GO:0019432) |
| 0.3 | 3.1 | GO:0051013 | microtubule severing(GO:0051013) |
| 0.3 | 0.7 | GO:0000350 | generation of catalytic spliceosome for second transesterification step(GO:0000350) spliceosomal conformational changes to generate catalytic conformation(GO:0000393) |
| 0.3 | 0.3 | GO:0072076 | nephrogenic mesenchyme development(GO:0072076) |
| 0.3 | 8.1 | GO:0072678 | T cell migration(GO:0072678) |
| 0.3 | 1.6 | GO:0060613 | fat pad development(GO:0060613) |
| 0.3 | 4.2 | GO:0051292 | nuclear pore complex assembly(GO:0051292) |
| 0.3 | 6.2 | GO:0034508 | centromere complex assembly(GO:0034508) |
| 0.3 | 2.6 | GO:0098703 | calcium ion import across plasma membrane(GO:0098703) calcium ion import into cell(GO:1990035) |
| 0.3 | 1.6 | GO:0097012 | cellular response to granulocyte macrophage colony-stimulating factor stimulus(GO:0097011) response to granulocyte macrophage colony-stimulating factor(GO:0097012) |
| 0.3 | 3.8 | GO:0043252 | sodium-independent organic anion transport(GO:0043252) |
| 0.3 | 2.2 | GO:0043686 | co-translational protein modification(GO:0043686) |
| 0.3 | 18.9 | GO:0051028 | mRNA transport(GO:0051028) |
| 0.3 | 3.7 | GO:0036065 | fucosylation(GO:0036065) |
| 0.3 | 7.0 | GO:0010458 | exit from mitosis(GO:0010458) |
| 0.3 | 5.1 | GO:0006107 | oxaloacetate metabolic process(GO:0006107) |
| 0.3 | 3.3 | GO:0010800 | positive regulation of peptidyl-threonine phosphorylation(GO:0010800) |
| 0.3 | 2.1 | GO:0045647 | negative regulation of erythrocyte differentiation(GO:0045647) |
| 0.3 | 3.3 | GO:0048671 | negative regulation of collateral sprouting(GO:0048671) |
| 0.3 | 2.9 | GO:0061436 | establishment of skin barrier(GO:0061436) |
| 0.3 | 1.1 | GO:0036015 | response to interleukin-3(GO:0036015) cellular response to interleukin-3(GO:0036016) |
| 0.3 | 1.4 | GO:0035063 | nuclear speck organization(GO:0035063) |
| 0.3 | 1.4 | GO:0032957 | inositol trisphosphate metabolic process(GO:0032957) |
| 0.3 | 2.5 | GO:1900016 | negative regulation of cytokine production involved in inflammatory response(GO:1900016) |
| 0.3 | 10.9 | GO:0006611 | protein export from nucleus(GO:0006611) |
| 0.3 | 1.9 | GO:0007175 | negative regulation of epidermal growth factor-activated receptor activity(GO:0007175) |
| 0.3 | 11.8 | GO:0003382 | epithelial cell morphogenesis(GO:0003382) |
| 0.3 | 0.5 | GO:0060594 | mammary gland specification(GO:0060594) |
| 0.3 | 0.8 | GO:0098953 | receptor diffusion trapping(GO:0098953) postsynaptic neurotransmitter receptor diffusion trapping(GO:0098970) neurotransmitter receptor diffusion trapping(GO:0099628) |
| 0.3 | 2.7 | GO:0090070 | positive regulation of ribosome biogenesis(GO:0090070) positive regulation of rRNA processing(GO:2000234) |
| 0.3 | 3.2 | GO:0034063 | stress granule assembly(GO:0034063) |
| 0.3 | 3.3 | GO:0019511 | peptidyl-proline hydroxylation(GO:0019511) |
| 0.3 | 2.5 | GO:0050718 | regulation of interleukin-1 beta secretion(GO:0050706) positive regulation of interleukin-1 secretion(GO:0050716) positive regulation of interleukin-1 beta secretion(GO:0050718) |
| 0.3 | 1.3 | GO:0071630 | nucleus-associated proteasomal ubiquitin-dependent protein catabolic process(GO:0071630) |
| 0.2 | 2.7 | GO:2000291 | regulation of myoblast proliferation(GO:2000291) |
| 0.2 | 4.4 | GO:0033962 | cytoplasmic mRNA processing body assembly(GO:0033962) |
| 0.2 | 2.2 | GO:0007638 | mechanosensory behavior(GO:0007638) |
| 0.2 | 2.2 | GO:0048745 | smooth muscle tissue development(GO:0048745) |
| 0.2 | 4.4 | GO:0019835 | cytolysis(GO:0019835) |
| 0.2 | 3.9 | GO:0051482 | positive regulation of cytosolic calcium ion concentration involved in phospholipase C-activating G-protein coupled signaling pathway(GO:0051482) |
| 0.2 | 2.7 | GO:0000338 | protein deneddylation(GO:0000338) |
| 0.2 | 0.5 | GO:0061535 | glutamate secretion, neurotransmission(GO:0061535) |
| 0.2 | 0.5 | GO:0003430 | growth plate cartilage chondrocyte growth(GO:0003430) |
| 0.2 | 3.1 | GO:0048268 | clathrin coat assembly(GO:0048268) |
| 0.2 | 7.5 | GO:0043616 | keratinocyte proliferation(GO:0043616) |
| 0.2 | 0.7 | GO:1902626 | assembly of large subunit precursor of preribosome(GO:1902626) |
| 0.2 | 4.8 | GO:0045839 | negative regulation of mitotic nuclear division(GO:0045839) |
| 0.2 | 1.6 | GO:0010972 | negative regulation of G2/M transition of mitotic cell cycle(GO:0010972) |
| 0.2 | 1.8 | GO:2001241 | positive regulation of extrinsic apoptotic signaling pathway in absence of ligand(GO:2001241) |
| 0.2 | 1.8 | GO:0006269 | DNA replication, synthesis of RNA primer(GO:0006269) |
| 0.2 | 0.4 | GO:0070268 | cornification(GO:0070268) |
| 0.2 | 4.6 | GO:0046835 | carbohydrate phosphorylation(GO:0046835) |
| 0.2 | 6.2 | GO:1903959 | regulation of anion transmembrane transport(GO:1903959) |
| 0.2 | 2.8 | GO:0007140 | male meiosis(GO:0007140) |
| 0.2 | 0.6 | GO:0060023 | soft palate development(GO:0060023) |
| 0.2 | 1.0 | GO:0035188 | blastocyst hatching(GO:0001835) hatching(GO:0035188) organism emergence from protective structure(GO:0071684) |
| 0.2 | 2.2 | GO:0035067 | negative regulation of histone acetylation(GO:0035067) |
| 0.2 | 6.9 | GO:0007214 | gamma-aminobutyric acid signaling pathway(GO:0007214) |
| 0.2 | 3.5 | GO:0043981 | histone H4-K5 acetylation(GO:0043981) histone H4-K8 acetylation(GO:0043982) |
| 0.2 | 10.8 | GO:0018107 | peptidyl-threonine phosphorylation(GO:0018107) peptidyl-threonine modification(GO:0018210) |
| 0.2 | 3.0 | GO:0007035 | vacuolar acidification(GO:0007035) |
| 0.2 | 0.8 | GO:0045901 | positive regulation of translational elongation(GO:0045901) |
| 0.2 | 4.5 | GO:0045070 | positive regulation of viral genome replication(GO:0045070) |
| 0.2 | 0.8 | GO:0097384 | cellular lipid biosynthetic process(GO:0097384) |
| 0.2 | 1.1 | GO:0070914 | UV-damage excision repair(GO:0070914) |
| 0.2 | 4.6 | GO:0035428 | hexose transmembrane transport(GO:0035428) glucose transmembrane transport(GO:1904659) |
| 0.2 | 2.1 | GO:0034720 | histone H3-K4 demethylation(GO:0034720) |
| 0.2 | 63.4 | GO:0007283 | spermatogenesis(GO:0007283) |
| 0.2 | 1.7 | GO:0000083 | regulation of transcription involved in G1/S transition of mitotic cell cycle(GO:0000083) |
| 0.2 | 0.3 | GO:1900108 | negative regulation of nodal signaling pathway(GO:1900108) |
| 0.2 | 1.9 | GO:0045475 | locomotor rhythm(GO:0045475) |
| 0.2 | 1.0 | GO:1901725 | regulation of histone deacetylase activity(GO:1901725) positive regulation of histone deacetylase activity(GO:1901727) |
| 0.2 | 3.8 | GO:0000184 | nuclear-transcribed mRNA catabolic process, nonsense-mediated decay(GO:0000184) |
| 0.2 | 0.5 | GO:0033578 | protein glycosylation in Golgi(GO:0033578) regulation of protein glycosylation in Golgi(GO:0090283) |
| 0.2 | 4.2 | GO:0002548 | monocyte chemotaxis(GO:0002548) |
| 0.2 | 0.5 | GO:1901533 | negative regulation of hematopoietic progenitor cell differentiation(GO:1901533) |
| 0.2 | 3.4 | GO:0030318 | melanocyte differentiation(GO:0030318) |
| 0.2 | 0.3 | GO:1902044 | regulation of Fas signaling pathway(GO:1902044) |
| 0.2 | 3.6 | GO:0016925 | protein sumoylation(GO:0016925) |
| 0.2 | 2.7 | GO:0043968 | histone H2A acetylation(GO:0043968) |
| 0.2 | 2.1 | GO:0030262 | apoptotic nuclear changes(GO:0030262) |
| 0.2 | 1.8 | GO:0006336 | DNA replication-independent nucleosome assembly(GO:0006336) |
| 0.1 | 2.9 | GO:2000171 | negative regulation of dendrite development(GO:2000171) |
| 0.1 | 0.3 | GO:0032074 | negative regulation of nuclease activity(GO:0032074) |
| 0.1 | 0.5 | GO:1902993 | positive regulation of beta-amyloid formation(GO:1902004) positive regulation of amyloid precursor protein catabolic process(GO:1902993) |
| 0.1 | 1.8 | GO:0045947 | negative regulation of translational initiation(GO:0045947) |
| 0.1 | 1.6 | GO:0036159 | inner dynein arm assembly(GO:0036159) |
| 0.1 | 1.0 | GO:0051294 | establishment of spindle orientation(GO:0051294) |
| 0.1 | 1.5 | GO:0006264 | mitochondrial DNA replication(GO:0006264) |
| 0.1 | 3.3 | GO:0097502 | mannosylation(GO:0097502) |
| 0.1 | 0.2 | GO:0014908 | myotube differentiation involved in skeletal muscle regeneration(GO:0014908) |
| 0.1 | 0.8 | GO:0044030 | regulation of DNA methylation(GO:0044030) |
| 0.1 | 1.4 | GO:0010592 | positive regulation of lamellipodium assembly(GO:0010592) |
| 0.1 | 0.6 | GO:0060213 | regulation of nuclear-transcribed mRNA poly(A) tail shortening(GO:0060211) positive regulation of nuclear-transcribed mRNA poly(A) tail shortening(GO:0060213) |
| 0.1 | 0.8 | GO:0002175 | protein localization to paranode region of axon(GO:0002175) |
| 0.1 | 1.1 | GO:0030970 | retrograde protein transport, ER to cytosol(GO:0030970) |
| 0.1 | 1.3 | GO:0002717 | positive regulation of natural killer cell mediated immunity(GO:0002717) |
| 0.1 | 2.5 | GO:0070979 | protein K11-linked ubiquitination(GO:0070979) |
| 0.1 | 14.4 | GO:0007059 | chromosome segregation(GO:0007059) |
| 0.1 | 1.6 | GO:0071157 | negative regulation of cell cycle arrest(GO:0071157) |
| 0.1 | 0.7 | GO:0032596 | protein transport into membrane raft(GO:0032596) |
| 0.1 | 1.3 | GO:0019433 | triglyceride catabolic process(GO:0019433) |
| 0.1 | 0.4 | GO:0042256 | mature ribosome assembly(GO:0042256) |
| 0.1 | 0.6 | GO:0035881 | amacrine cell differentiation(GO:0035881) |
| 0.1 | 2.1 | GO:0042491 | auditory receptor cell differentiation(GO:0042491) |
| 0.1 | 0.4 | GO:0009405 | pathogenesis(GO:0009405) |
| 0.1 | 0.9 | GO:1901341 | activation of store-operated calcium channel activity(GO:0032237) positive regulation of store-operated calcium channel activity(GO:1901341) |
| 0.1 | 9.0 | GO:0042787 | protein ubiquitination involved in ubiquitin-dependent protein catabolic process(GO:0042787) |
| 0.1 | 2.3 | GO:0030166 | proteoglycan biosynthetic process(GO:0030166) |
| 0.1 | 1.4 | GO:0070816 | phosphorylation of RNA polymerase II C-terminal domain(GO:0070816) |
| 0.1 | 1.3 | GO:0006491 | N-glycan processing(GO:0006491) |
| 0.1 | 0.3 | GO:0048341 | paraxial mesoderm formation(GO:0048341) |
| 0.1 | 3.2 | GO:0000380 | alternative mRNA splicing, via spliceosome(GO:0000380) |
| 0.1 | 6.9 | GO:0006413 | translational initiation(GO:0006413) |
| 0.1 | 0.4 | GO:0017182 | peptidyl-diphthamide metabolic process(GO:0017182) peptidyl-diphthamide biosynthetic process from peptidyl-histidine(GO:0017183) |
| 0.1 | 2.6 | GO:0002474 | antigen processing and presentation of peptide antigen via MHC class I(GO:0002474) |
| 0.1 | 0.3 | GO:0006556 | S-adenosylmethionine biosynthetic process(GO:0006556) |
| 0.1 | 3.5 | GO:0006414 | translational elongation(GO:0006414) |
| 0.1 | 0.2 | GO:0038172 | negative regulation of T-helper 1 type immune response(GO:0002826) interleukin-33-mediated signaling pathway(GO:0038172) |
| 0.1 | 0.2 | GO:0080120 | CAAX-box protein processing(GO:0071586) CAAX-box protein maturation(GO:0080120) |
| 0.1 | 0.8 | GO:0007616 | long-term memory(GO:0007616) |
| 0.1 | 0.1 | GO:0035315 | hair cell differentiation(GO:0035315) |
| 0.1 | 0.6 | GO:0006388 | tRNA splicing, via endonucleolytic cleavage and ligation(GO:0006388) |
| 0.1 | 0.5 | GO:0070129 | regulation of mitochondrial translation(GO:0070129) |
| 0.1 | 0.3 | GO:0002446 | neutrophil mediated immunity(GO:0002446) |
| 0.1 | 1.9 | GO:0032092 | positive regulation of protein binding(GO:0032092) |
| 0.1 | 2.0 | GO:0043966 | histone H3 acetylation(GO:0043966) |
| 0.0 | 1.0 | GO:0060669 | embryonic placenta morphogenesis(GO:0060669) labyrinthine layer morphogenesis(GO:0060713) |
| 0.0 | 1.7 | GO:0000462 | maturation of SSU-rRNA from tricistronic rRNA transcript (SSU-rRNA, 5.8S rRNA, LSU-rRNA)(GO:0000462) |
| 0.0 | 0.1 | GO:1990253 | positive regulation of TORC1 signaling(GO:1904263) cellular response to leucine starvation(GO:1990253) |
| 0.0 | 0.3 | GO:0000244 | spliceosomal tri-snRNP complex assembly(GO:0000244) |
| 0.0 | 0.9 | GO:0000387 | spliceosomal snRNP assembly(GO:0000387) |
| 0.0 | 0.7 | GO:0016226 | iron-sulfur cluster assembly(GO:0016226) metallo-sulfur cluster assembly(GO:0031163) |
| 0.0 | 1.1 | GO:0042073 | intraciliary transport(GO:0042073) |
| 0.0 | 1.0 | GO:0071361 | cellular response to ethanol(GO:0071361) |
| 0.0 | 0.2 | GO:0050917 | sensory perception of umami taste(GO:0050917) |
| 0.0 | 0.5 | GO:0048821 | erythrocyte development(GO:0048821) |
| 0.0 | 0.2 | GO:0006586 | tryptophan metabolic process(GO:0006568) indolalkylamine metabolic process(GO:0006586) |
| 0.0 | 3.3 | GO:0002244 | hematopoietic progenitor cell differentiation(GO:0002244) |
| 0.0 | 0.5 | GO:0045116 | protein neddylation(GO:0045116) |
| 0.0 | 0.1 | GO:0036451 | cap mRNA methylation(GO:0036451) |
| 0.0 | 0.4 | GO:1903432 | regulation of TORC1 signaling(GO:1903432) |
| 0.0 | 0.5 | GO:0006855 | drug transmembrane transport(GO:0006855) |
| 0.0 | 0.9 | GO:0051568 | histone H3-K4 methylation(GO:0051568) |
| 0.0 | 0.1 | GO:0072383 | plus-end-directed vesicle transport along microtubule(GO:0072383) plus-end-directed organelle transport along microtubule(GO:0072386) |
| 0.0 | 0.8 | GO:0016575 | histone deacetylation(GO:0016575) |
| 0.0 | 0.2 | GO:0045793 | positive regulation of cell size(GO:0045793) |
| 0.0 | 0.1 | GO:0035338 | long-chain fatty-acyl-CoA biosynthetic process(GO:0035338) |
| 0.0 | 0.6 | GO:0006338 | chromatin remodeling(GO:0006338) |
| 0.0 | 0.2 | GO:0045682 | regulation of epidermis development(GO:0045682) |
| 0.0 | 0.2 | GO:0045047 | protein targeting to ER(GO:0045047) |
| 0.0 | 0.1 | GO:0031119 | tRNA pseudouridine synthesis(GO:0031119) |
| 0.0 | 0.7 | GO:0042273 | ribosomal large subunit biogenesis(GO:0042273) |
Gene overrepresentation in cellular component category:
| Log-likelihood per target | Total log-likelihood | Term | Description |
|---|---|---|---|
| 9.9 | 39.5 | GO:0002947 | tumor necrosis factor receptor superfamily complex(GO:0002947) |
| 7.5 | 30.1 | GO:0042571 | immunoglobulin complex, circulating(GO:0042571) |
| 7.3 | 21.9 | GO:1990723 | cytoplasmic periphery of the nuclear pore complex(GO:1990723) |
| 6.9 | 55.3 | GO:0042105 | alpha-beta T cell receptor complex(GO:0042105) |
| 6.2 | 30.9 | GO:1990716 | axonemal central apparatus(GO:1990716) |
| 5.8 | 17.4 | GO:0046691 | intracellular canaliculus(GO:0046691) |
| 5.6 | 16.7 | GO:0032173 | septin collar(GO:0032173) |
| 5.3 | 21.3 | GO:0097149 | centralspindlin complex(GO:0097149) |
| 4.9 | 34.3 | GO:0097524 | sperm plasma membrane(GO:0097524) |
| 4.9 | 48.8 | GO:0045179 | apical cortex(GO:0045179) |
| 4.1 | 41.3 | GO:0042101 | T cell receptor complex(GO:0042101) |
| 3.8 | 18.8 | GO:0070695 | FHF complex(GO:0070695) |
| 3.7 | 33.3 | GO:0071546 | pi-body(GO:0071546) |
| 3.3 | 9.9 | GO:0035355 | Toll-like receptor 2-Toll-like receptor 6 protein complex(GO:0035355) |
| 3.3 | 69.3 | GO:0005922 | connexon complex(GO:0005922) |
| 3.0 | 29.7 | GO:0014731 | spectrin-associated cytoskeleton(GO:0014731) |
| 3.0 | 8.9 | GO:0005853 | eukaryotic translation elongation factor 1 complex(GO:0005853) |
| 2.7 | 19.1 | GO:0036128 | CatSper complex(GO:0036128) |
| 2.7 | 29.8 | GO:0097418 | neurofibrillary tangle(GO:0097418) |
| 2.7 | 13.4 | GO:0030868 | smooth endoplasmic reticulum membrane(GO:0030868) smooth endoplasmic reticulum part(GO:0097425) |
| 2.6 | 15.9 | GO:0036449 | microtubule minus-end(GO:0036449) |
| 2.6 | 7.8 | GO:0005760 | gamma DNA polymerase complex(GO:0005760) |
| 2.6 | 15.5 | GO:0005726 | perichromatin fibrils(GO:0005726) |
| 2.5 | 12.7 | GO:0035985 | senescence-associated heterochromatin focus(GO:0035985) |
| 2.5 | 24.5 | GO:0043219 | lateral loop(GO:0043219) |
| 2.4 | 33.2 | GO:0072687 | meiotic spindle(GO:0072687) |
| 2.4 | 30.8 | GO:0033391 | chromatoid body(GO:0033391) |
| 2.4 | 9.4 | GO:0032777 | Piccolo NuA4 histone acetyltransferase complex(GO:0032777) |
| 2.3 | 16.4 | GO:0097136 | Bcl-2 family protein complex(GO:0097136) |
| 2.3 | 9.0 | GO:0033269 | internode region of axon(GO:0033269) |
| 2.2 | 6.6 | GO:0033165 | interphotoreceptor matrix(GO:0033165) |
| 2.1 | 65.4 | GO:0042588 | zymogen granule(GO:0042588) |
| 2.1 | 10.3 | GO:0071256 | Sec61 translocon complex(GO:0005784) translocon complex(GO:0071256) |
| 2.0 | 29.4 | GO:0017146 | NMDA selective glutamate receptor complex(GO:0017146) |
| 2.0 | 5.9 | GO:0044307 | dendritic branch(GO:0044307) |
| 1.9 | 26.4 | GO:0044224 | juxtaparanode region of axon(GO:0044224) |
| 1.7 | 10.4 | GO:0032983 | kainate selective glutamate receptor complex(GO:0032983) |
| 1.7 | 8.5 | GO:0000942 | condensed nuclear chromosome outer kinetochore(GO:0000942) |
| 1.7 | 6.8 | GO:0031436 | BRCA1-BARD1 complex(GO:0031436) |
| 1.7 | 9.9 | GO:0043203 | axon hillock(GO:0043203) |
| 1.5 | 4.4 | GO:0005944 | phosphatidylinositol 3-kinase complex, class IB(GO:0005944) |
| 1.5 | 5.8 | GO:0031092 | platelet alpha granule membrane(GO:0031092) |
| 1.4 | 7.2 | GO:0035749 | myelin sheath adaxonal region(GO:0035749) |
| 1.4 | 2.8 | GO:1990923 | PET complex(GO:1990923) |
| 1.4 | 46.8 | GO:0001772 | immunological synapse(GO:0001772) |
| 1.4 | 4.2 | GO:0044611 | nuclear pore inner ring(GO:0044611) |
| 1.3 | 6.5 | GO:0043625 | delta DNA polymerase complex(GO:0043625) |
| 1.3 | 7.8 | GO:0002081 | outer acrosomal membrane(GO:0002081) |
| 1.3 | 7.5 | GO:0005785 | signal recognition particle receptor complex(GO:0005785) |
| 1.2 | 3.7 | GO:0070821 | tertiary granule membrane(GO:0070821) |
| 1.2 | 20.8 | GO:0031011 | Ino80 complex(GO:0031011) DNA helicase complex(GO:0033202) |
| 1.2 | 88.3 | GO:0045095 | keratin filament(GO:0045095) |
| 1.2 | 7.1 | GO:0097598 | outer dynein arm(GO:0036157) sperm cytoplasmic droplet(GO:0097598) |
| 1.2 | 10.6 | GO:0098576 | lumenal side of membrane(GO:0098576) |
| 1.1 | 6.6 | GO:0044322 | endoplasmic reticulum quality control compartment(GO:0044322) |
| 1.0 | 30.4 | GO:0034451 | centriolar satellite(GO:0034451) |
| 1.0 | 3.0 | GO:0032389 | MutLalpha complex(GO:0032389) |
| 1.0 | 21.7 | GO:0001673 | male germ cell nucleus(GO:0001673) |
| 1.0 | 9.8 | GO:0002177 | manchette(GO:0002177) |
| 1.0 | 9.8 | GO:0036513 | Derlin-1 retrotranslocation complex(GO:0036513) |
| 1.0 | 3.9 | GO:0044194 | cytolytic granule(GO:0044194) |
| 1.0 | 22.1 | GO:0098563 | integral component of synaptic vesicle membrane(GO:0030285) intrinsic component of synaptic vesicle membrane(GO:0098563) |
| 1.0 | 11.5 | GO:0000801 | central element(GO:0000801) |
| 0.9 | 8.5 | GO:0005921 | gap junction(GO:0005921) |
| 0.9 | 34.1 | GO:0044295 | axonal growth cone(GO:0044295) |
| 0.9 | 17.1 | GO:0031231 | integral component of peroxisomal membrane(GO:0005779) intrinsic component of peroxisomal membrane(GO:0031231) |
| 0.9 | 2.7 | GO:0070044 | synaptobrevin 2-SNAP-25-syntaxin-1a complex(GO:0070044) |
| 0.9 | 10.6 | GO:0035253 | ciliary rootlet(GO:0035253) |
| 0.8 | 3.3 | GO:0016222 | procollagen-proline 4-dioxygenase complex(GO:0016222) |
| 0.8 | 15.3 | GO:0032279 | asymmetric synapse(GO:0032279) |
| 0.8 | 11.2 | GO:0032433 | filopodium tip(GO:0032433) |
| 0.8 | 3.2 | GO:0034751 | aryl hydrocarbon receptor complex(GO:0034751) |
| 0.8 | 94.1 | GO:0072562 | blood microparticle(GO:0072562) |
| 0.8 | 21.6 | GO:0000788 | nuclear nucleosome(GO:0000788) |
| 0.8 | 9.2 | GO:0042575 | DNA polymerase complex(GO:0042575) |
| 0.7 | 8.9 | GO:0032426 | stereocilium tip(GO:0032426) |
| 0.7 | 3.7 | GO:0000221 | vacuolar proton-transporting V-type ATPase, V1 domain(GO:0000221) |
| 0.7 | 5.0 | GO:0097197 | tetraspanin-enriched microdomain(GO:0097197) |
| 0.7 | 2.1 | GO:0009328 | phenylalanine-tRNA ligase complex(GO:0009328) |
| 0.7 | 3.4 | GO:0031085 | BLOC-3 complex(GO:0031085) |
| 0.7 | 5.4 | GO:0005826 | actomyosin contractile ring(GO:0005826) |
| 0.7 | 2.7 | GO:0030478 | actin cap(GO:0030478) |
| 0.7 | 3.3 | GO:0001652 | granular component(GO:0001652) |
| 0.6 | 7.1 | GO:0031010 | ISWI-type complex(GO:0031010) |
| 0.6 | 7.4 | GO:0042581 | specific granule(GO:0042581) |
| 0.6 | 5.0 | GO:0000242 | pericentriolar material(GO:0000242) |
| 0.6 | 5.6 | GO:0001940 | male pronucleus(GO:0001940) |
| 0.6 | 6.7 | GO:0042555 | MCM complex(GO:0042555) |
| 0.6 | 9.6 | GO:0001520 | outer dense fiber(GO:0001520) |
| 0.6 | 3.6 | GO:0097539 | ciliary transition fiber(GO:0097539) |
| 0.6 | 7.0 | GO:0097431 | mitotic spindle pole(GO:0097431) |
| 0.6 | 8.7 | GO:0032154 | cleavage furrow(GO:0032154) cell surface furrow(GO:0097610) |
| 0.6 | 10.9 | GO:0005942 | phosphatidylinositol 3-kinase complex(GO:0005942) |
| 0.6 | 2.3 | GO:0000322 | storage vacuole(GO:0000322) |
| 0.6 | 2.8 | GO:0061689 | tricellular tight junction(GO:0061689) |
| 0.6 | 11.8 | GO:0000152 | nuclear ubiquitin ligase complex(GO:0000152) |
| 0.6 | 3.3 | GO:0034993 | microtubule organizing center attachment site(GO:0034992) LINC complex(GO:0034993) |
| 0.6 | 3.3 | GO:0005787 | signal peptidase complex(GO:0005787) |
| 0.5 | 9.9 | GO:0045277 | respiratory chain complex IV(GO:0045277) |
| 0.5 | 7.1 | GO:0046581 | intercellular canaliculus(GO:0046581) |
| 0.5 | 5.5 | GO:0000445 | THO complex(GO:0000347) THO complex part of transcription export complex(GO:0000445) |
| 0.5 | 18.5 | GO:0055038 | recycling endosome membrane(GO:0055038) |
| 0.5 | 2.1 | GO:0031592 | centrosomal corona(GO:0031592) |
| 0.5 | 7.5 | GO:0000164 | protein phosphatase type 1 complex(GO:0000164) |
| 0.5 | 2.7 | GO:0070195 | growth hormone receptor complex(GO:0070195) |
| 0.5 | 14.2 | GO:0032281 | AMPA glutamate receptor complex(GO:0032281) |
| 0.5 | 5.2 | GO:0070652 | HAUS complex(GO:0070652) |
| 0.5 | 33.0 | GO:0031901 | early endosome membrane(GO:0031901) |
| 0.5 | 13.8 | GO:0032588 | trans-Golgi network membrane(GO:0032588) |
| 0.5 | 2.5 | GO:1990726 | Lsm1-7-Pat1 complex(GO:1990726) |
| 0.5 | 10.7 | GO:0046658 | anchored component of plasma membrane(GO:0046658) |
| 0.5 | 56.6 | GO:0030139 | endocytic vesicle(GO:0030139) |
| 0.5 | 1.5 | GO:0032398 | MHC class Ib protein complex(GO:0032398) |
| 0.5 | 4.4 | GO:0071204 | histone pre-mRNA 3'end processing complex(GO:0071204) |
| 0.5 | 57.4 | GO:0001669 | acrosomal vesicle(GO:0001669) |
| 0.5 | 1.4 | GO:0000110 | nucleotide-excision repair factor 1 complex(GO:0000110) |
| 0.5 | 8.1 | GO:0034364 | high-density lipoprotein particle(GO:0034364) |
| 0.5 | 23.5 | GO:0030672 | synaptic vesicle membrane(GO:0030672) exocytic vesicle membrane(GO:0099501) |
| 0.5 | 1.9 | GO:0097451 | glial limiting end-foot(GO:0097451) |
| 0.5 | 3.3 | GO:0033263 | CORVET complex(GO:0033263) |
| 0.5 | 3.3 | GO:0030130 | clathrin coat of trans-Golgi network vesicle(GO:0030130) |
| 0.5 | 4.7 | GO:0000800 | lateral element(GO:0000800) |
| 0.5 | 28.8 | GO:0000786 | nucleosome(GO:0000786) |
| 0.5 | 32.4 | GO:0043198 | dendritic shaft(GO:0043198) |
| 0.5 | 3.6 | GO:0070776 | H3 histone acetyltransferase complex(GO:0070775) MOZ/MORF histone acetyltransferase complex(GO:0070776) |
| 0.5 | 135.9 | GO:0009897 | external side of plasma membrane(GO:0009897) |
| 0.5 | 23.6 | GO:0031519 | PcG protein complex(GO:0031519) |
| 0.4 | 1.8 | GO:0033553 | rDNA heterochromatin(GO:0033553) |
| 0.4 | 3.9 | GO:0000439 | core TFIIH complex(GO:0000439) |
| 0.4 | 4.7 | GO:0043189 | NuA4 histone acetyltransferase complex(GO:0035267) H4/H2A histone acetyltransferase complex(GO:0043189) H4 histone acetyltransferase complex(GO:1902562) |
| 0.4 | 5.2 | GO:0097542 | ciliary tip(GO:0097542) |
| 0.4 | 4.3 | GO:0000346 | transcription export complex(GO:0000346) |
| 0.4 | 41.1 | GO:0016605 | PML body(GO:0016605) |
| 0.4 | 4.5 | GO:0042613 | MHC class II protein complex(GO:0042613) |
| 0.4 | 2.9 | GO:0071598 | neuronal ribonucleoprotein granule(GO:0071598) |
| 0.4 | 7.7 | GO:0090545 | NuRD complex(GO:0016581) CHD-type complex(GO:0090545) |
| 0.4 | 1.6 | GO:0072487 | MSL complex(GO:0072487) |
| 0.4 | 0.8 | GO:0099522 | region of cytosol(GO:0099522) postsynaptic cytosol(GO:0099524) |
| 0.4 | 18.7 | GO:0005637 | nuclear inner membrane(GO:0005637) |
| 0.4 | 2.7 | GO:0043202 | lysosomal lumen(GO:0043202) |
| 0.4 | 3.5 | GO:0043020 | NADPH oxidase complex(GO:0043020) |
| 0.4 | 9.5 | GO:0005689 | U12-type spliceosomal complex(GO:0005689) |
| 0.4 | 22.4 | GO:0005643 | nuclear pore(GO:0005643) |
| 0.4 | 2.6 | GO:0005915 | zonula adherens(GO:0005915) |
| 0.4 | 2.5 | GO:0072559 | NLRP3 inflammasome complex(GO:0072559) |
| 0.4 | 1.8 | GO:0070461 | SAGA-type complex(GO:0070461) |
| 0.4 | 14.1 | GO:0036064 | ciliary basal body(GO:0036064) |
| 0.4 | 29.3 | GO:0005814 | centriole(GO:0005814) |
| 0.4 | 16.0 | GO:0030286 | dynein complex(GO:0030286) |
| 0.4 | 1.1 | GO:0005668 | RNA polymerase transcription factor SL1 complex(GO:0005668) |
| 0.4 | 4.9 | GO:0000780 | condensed nuclear chromosome, centromeric region(GO:0000780) |
| 0.4 | 6.4 | GO:0005849 | mRNA cleavage factor complex(GO:0005849) |
| 0.4 | 23.2 | GO:0005875 | microtubule associated complex(GO:0005875) |
| 0.3 | 1.6 | GO:0044530 | supraspliceosomal complex(GO:0044530) |
| 0.3 | 1.2 | GO:0043541 | UDP-N-acetylglucosamine transferase complex(GO:0043541) |
| 0.3 | 15.2 | GO:0034707 | chloride channel complex(GO:0034707) |
| 0.3 | 16.4 | GO:0016234 | inclusion body(GO:0016234) |
| 0.3 | 5.1 | GO:0035145 | exon-exon junction complex(GO:0035145) |
| 0.3 | 1.5 | GO:0048179 | activin receptor complex(GO:0048179) |
| 0.3 | 3.8 | GO:0030914 | STAGA complex(GO:0030914) |
| 0.3 | 14.9 | GO:0008023 | transcription elongation factor complex(GO:0008023) |
| 0.3 | 4.3 | GO:0031528 | microvillus membrane(GO:0031528) |
| 0.3 | 1.1 | GO:0070436 | Grb2-EGFR complex(GO:0070436) |
| 0.3 | 0.5 | GO:1990590 | ATF1-ATF4 transcription factor complex(GO:1990590) |
| 0.3 | 1.6 | GO:0090568 | nuclear transcriptional repressor complex(GO:0090568) |
| 0.3 | 1.6 | GO:0000124 | SAGA complex(GO:0000124) |
| 0.3 | 2.6 | GO:0033270 | paranode region of axon(GO:0033270) |
| 0.3 | 5.2 | GO:0042629 | mast cell granule(GO:0042629) |
| 0.3 | 21.9 | GO:0000932 | cytoplasmic mRNA processing body(GO:0000932) |
| 0.3 | 3.3 | GO:0044666 | MLL3/4 complex(GO:0044666) |
| 0.2 | 0.7 | GO:0000172 | ribonuclease MRP complex(GO:0000172) |
| 0.2 | 0.7 | GO:0071012 | catalytic step 1 spliceosome(GO:0071012) |
| 0.2 | 2.7 | GO:0005736 | DNA-directed RNA polymerase I complex(GO:0005736) |
| 0.2 | 5.9 | GO:0000159 | protein phosphatase type 2A complex(GO:0000159) |
| 0.2 | 1.8 | GO:0005658 | alpha DNA polymerase:primase complex(GO:0005658) |
| 0.2 | 1.1 | GO:0030891 | VCB complex(GO:0030891) |
| 0.2 | 3.7 | GO:0030904 | retromer complex(GO:0030904) |
| 0.2 | 0.6 | GO:0005592 | collagen type XI trimer(GO:0005592) |
| 0.2 | 13.0 | GO:0000776 | kinetochore(GO:0000776) |
| 0.2 | 25.6 | GO:0044798 | nuclear transcription factor complex(GO:0044798) |
| 0.2 | 13.9 | GO:0016363 | nuclear matrix(GO:0016363) |
| 0.2 | 8.7 | GO:0005657 | replication fork(GO:0005657) |
| 0.2 | 9.4 | GO:0000118 | histone deacetylase complex(GO:0000118) |
| 0.2 | 4.6 | GO:0008287 | protein serine/threonine phosphatase complex(GO:0008287) |
| 0.2 | 2.6 | GO:0051233 | spindle midzone(GO:0051233) |
| 0.2 | 4.7 | GO:0060077 | inhibitory synapse(GO:0060077) |
| 0.2 | 2.5 | GO:0031235 | intrinsic component of the cytoplasmic side of the plasma membrane(GO:0031235) |
| 0.2 | 9.0 | GO:0030173 | integral component of Golgi membrane(GO:0030173) |
| 0.2 | 3.8 | GO:0080008 | Cul4-RING E3 ubiquitin ligase complex(GO:0080008) |
| 0.2 | 3.0 | GO:0032839 | dendrite cytoplasm(GO:0032839) |
| 0.2 | 49.9 | GO:0005813 | centrosome(GO:0005813) |
| 0.2 | 1.7 | GO:0005845 | mRNA cap binding complex(GO:0005845) RNA cap binding complex(GO:0034518) |
| 0.2 | 1.4 | GO:0031209 | SCAR complex(GO:0031209) |
| 0.2 | 0.7 | GO:0005652 | lamin filament(GO:0005638) nuclear lamina(GO:0005652) |
| 0.2 | 0.3 | GO:0031313 | extrinsic component of endosome membrane(GO:0031313) |
| 0.2 | 29.2 | GO:0000790 | nuclear chromatin(GO:0000790) |
| 0.2 | 2.1 | GO:0001891 | phagocytic cup(GO:0001891) |
| 0.1 | 8.9 | GO:0030496 | midbody(GO:0030496) |
| 0.1 | 1.4 | GO:0000177 | cytoplasmic exosome (RNase complex)(GO:0000177) |
| 0.1 | 1.1 | GO:0071541 | eukaryotic translation initiation factor 3 complex, eIF3m(GO:0071541) |
| 0.1 | 2.3 | GO:0005782 | peroxisomal matrix(GO:0005782) microbody lumen(GO:0031907) |
| 0.1 | 0.8 | GO:0031083 | BLOC-1 complex(GO:0031083) |
| 0.1 | 0.7 | GO:0005666 | DNA-directed RNA polymerase III complex(GO:0005666) |
| 0.1 | 0.4 | GO:0002199 | zona pellucida receptor complex(GO:0002199) |
| 0.1 | 12.5 | GO:0031234 | extrinsic component of cytoplasmic side of plasma membrane(GO:0031234) |
| 0.1 | 13.2 | GO:0005802 | trans-Golgi network(GO:0005802) |
| 0.1 | 3.6 | GO:0030136 | clathrin-coated vesicle(GO:0030136) |
| 0.1 | 1.0 | GO:0035631 | CD40 receptor complex(GO:0035631) |
| 0.1 | 0.3 | GO:0097427 | microtubule bundle(GO:0097427) |
| 0.1 | 3.5 | GO:0097014 | axoneme(GO:0005930) ciliary plasm(GO:0097014) |
| 0.1 | 0.6 | GO:0033256 | I-kappaB/NF-kappaB complex(GO:0033256) |
| 0.1 | 0.7 | GO:0016272 | prefoldin complex(GO:0016272) |
| 0.1 | 3.4 | GO:0005776 | autophagosome(GO:0005776) |
| 0.1 | 0.9 | GO:0032541 | cortical endoplasmic reticulum(GO:0032541) |
| 0.1 | 0.4 | GO:0071817 | MMXD complex(GO:0071817) CIA complex(GO:0097361) |
| 0.1 | 0.5 | GO:0034098 | VCP-NPL4-UFD1 AAA ATPase complex(GO:0034098) |
| 0.1 | 0.2 | GO:0005594 | collagen type IX trimer(GO:0005594) |
| 0.1 | 3.7 | GO:0031514 | motile cilium(GO:0031514) |
| 0.1 | 2.5 | GO:0034708 | methyltransferase complex(GO:0034708) |
| 0.1 | 0.6 | GO:0008385 | IkappaB kinase complex(GO:0008385) |
| 0.1 | 1.1 | GO:0000145 | exocyst(GO:0000145) |
| 0.1 | 0.8 | GO:0008250 | oligosaccharyltransferase complex(GO:0008250) |
| 0.0 | 1.0 | GO:0008074 | guanylate cyclase complex, soluble(GO:0008074) |
| 0.0 | 3.0 | GO:0071013 | catalytic step 2 spliceosome(GO:0071013) |
| 0.0 | 0.5 | GO:0071782 | endoplasmic reticulum tubular network(GO:0071782) |
| 0.0 | 0.1 | GO:0031254 | uropod(GO:0001931) cell trailing edge(GO:0031254) |
| 0.0 | 0.4 | GO:0019028 | viral capsid(GO:0019028) |
| 0.0 | 0.8 | GO:0022627 | cytosolic small ribosomal subunit(GO:0022627) |
Gene overrepresentation in molecular function category:
| Log-likelihood per target | Total log-likelihood | Term | Description |
|---|---|---|---|
| 22.3 | 66.8 | GO:0050253 | retinyl-palmitate esterase activity(GO:0050253) |
| 7.9 | 23.7 | GO:0004938 | alpha2-adrenergic receptor activity(GO:0004938) |
| 6.7 | 33.7 | GO:0004008 | copper-exporting ATPase activity(GO:0004008) copper-transporting ATPase activity(GO:0043682) |
| 6.4 | 32.0 | GO:0043120 | tumor necrosis factor binding(GO:0043120) |
| 5.6 | 16.8 | GO:0050294 | steroid sulfotransferase activity(GO:0050294) |
| 5.3 | 21.0 | GO:0047756 | chondroitin 4-sulfotransferase activity(GO:0047756) |
| 5.0 | 15.1 | GO:0035403 | histone kinase activity (H3-T6 specific)(GO:0035403) |
| 5.0 | 20.0 | GO:0032795 | heterotrimeric G-protein binding(GO:0032795) |
| 4.8 | 14.5 | GO:0004040 | amidase activity(GO:0004040) |
| 4.8 | 48.0 | GO:0051959 | dynein light intermediate chain binding(GO:0051959) |
| 4.4 | 26.2 | GO:0008467 | [heparan sulfate]-glucosamine 3-sulfotransferase 1 activity(GO:0008467) |
| 4.3 | 17.2 | GO:0044729 | hemi-methylated DNA-binding(GO:0044729) |
| 4.1 | 49.2 | GO:0015245 | fatty acid transporter activity(GO:0015245) |
| 4.0 | 16.1 | GO:0030229 | very-low-density lipoprotein particle receptor activity(GO:0030229) |
| 3.9 | 11.8 | GO:0072320 | volume-sensitive chloride channel activity(GO:0072320) |
| 3.9 | 23.5 | GO:0005332 | gamma-aminobutyric acid:sodium symporter activity(GO:0005332) |
| 3.9 | 11.7 | GO:0004605 | phosphatidate cytidylyltransferase activity(GO:0004605) |
| 3.9 | 11.6 | GO:0031893 | vasopressin receptor binding(GO:0031893) |
| 3.8 | 7.6 | GO:0004698 | calcium-dependent protein kinase C activity(GO:0004698) |
| 3.8 | 15.1 | GO:0061665 | SUMO ligase activity(GO:0061665) |
| 3.7 | 11.2 | GO:0034040 | lipid-transporting ATPase activity(GO:0034040) sterol-transporting ATPase activity(GO:0034041) glycoprotein transporter activity(GO:0034437) |
| 3.7 | 18.5 | GO:0008321 | Ral guanyl-nucleotide exchange factor activity(GO:0008321) |
| 3.6 | 32.6 | GO:0032050 | clathrin heavy chain binding(GO:0032050) |
| 3.6 | 14.5 | GO:0045159 | myosin II binding(GO:0045159) |
| 3.6 | 17.9 | GO:0005314 | high-affinity glutamate transmembrane transporter activity(GO:0005314) |
| 3.3 | 36.6 | GO:0031730 | CCR5 chemokine receptor binding(GO:0031730) |
| 3.3 | 13.3 | GO:0070996 | type 1 melanocortin receptor binding(GO:0070996) |
| 3.3 | 9.9 | GO:0042498 | diacyl lipopeptide binding(GO:0042498) |
| 3.2 | 44.9 | GO:0005243 | gap junction channel activity(GO:0005243) |
| 3.2 | 18.9 | GO:0004726 | non-membrane spanning protein tyrosine phosphatase activity(GO:0004726) |
| 3.0 | 8.9 | GO:0005157 | macrophage colony-stimulating factor receptor binding(GO:0005157) |
| 2.9 | 29.3 | GO:0019957 | C-C chemokine binding(GO:0019957) |
| 2.9 | 11.7 | GO:0008427 | calcium-dependent protein kinase inhibitor activity(GO:0008427) |
| 2.9 | 14.6 | GO:0004416 | hydroxyacylglutathione hydrolase activity(GO:0004416) |
| 2.9 | 8.7 | GO:0070401 | NADP+ binding(GO:0070401) |
| 2.9 | 8.6 | GO:0031735 | CCR10 chemokine receptor binding(GO:0031735) |
| 2.8 | 8.5 | GO:0098603 | selenol Se-methyltransferase activity(GO:0098603) |
| 2.8 | 16.9 | GO:0070567 | cytidylyltransferase activity(GO:0070567) |
| 2.7 | 16.4 | GO:0051434 | BH3 domain binding(GO:0051434) |
| 2.7 | 8.2 | GO:0003941 | L-serine ammonia-lyase activity(GO:0003941) |
| 2.7 | 19.0 | GO:0043423 | 3-phosphoinositide-dependent protein kinase binding(GO:0043423) |
| 2.7 | 56.5 | GO:0023026 | MHC class II protein complex binding(GO:0023026) |
| 2.7 | 18.6 | GO:1903136 | cuprous ion binding(GO:1903136) |
| 2.6 | 31.5 | GO:0005451 | monovalent cation:proton antiporter activity(GO:0005451) |
| 2.6 | 18.2 | GO:0000099 | sulfur amino acid transmembrane transporter activity(GO:0000099) |
| 2.6 | 70.2 | GO:0004181 | metallocarboxypeptidase activity(GO:0004181) |
| 2.5 | 7.4 | GO:0003828 | alpha-N-acetylneuraminate alpha-2,8-sialyltransferase activity(GO:0003828) |
| 2.5 | 9.9 | GO:0003986 | acetyl-CoA hydrolase activity(GO:0003986) |
| 2.4 | 7.2 | GO:0001716 | L-amino-acid oxidase activity(GO:0001716) |
| 2.4 | 16.7 | GO:0004064 | arylesterase activity(GO:0004064) |
| 2.4 | 18.9 | GO:0019871 | sodium channel inhibitor activity(GO:0019871) |
| 2.3 | 16.2 | GO:0016812 | hydrolase activity, acting on carbon-nitrogen (but not peptide) bonds, in cyclic amides(GO:0016812) |
| 2.3 | 9.2 | GO:0001635 | calcitonin gene-related peptide receptor activity(GO:0001635) |
| 2.3 | 31.6 | GO:0030550 | acetylcholine receptor inhibitor activity(GO:0030550) |
| 2.2 | 71.7 | GO:0004683 | calmodulin-dependent protein kinase activity(GO:0004683) |
| 2.2 | 10.9 | GO:0046934 | phosphatidylinositol-4,5-bisphosphate 3-kinase activity(GO:0046934) phosphatidylinositol bisphosphate kinase activity(GO:0052813) |
| 2.2 | 8.7 | GO:0001642 | group III metabotropic glutamate receptor activity(GO:0001642) |
| 2.2 | 26.0 | GO:0034987 | immunoglobulin receptor binding(GO:0034987) |
| 2.1 | 32.2 | GO:0045295 | gamma-catenin binding(GO:0045295) |
| 2.1 | 8.5 | GO:0010997 | anaphase-promoting complex binding(GO:0010997) |
| 2.0 | 16.3 | GO:0004966 | galanin receptor activity(GO:0004966) |
| 2.0 | 27.7 | GO:0016208 | AMP binding(GO:0016208) |
| 2.0 | 4.0 | GO:0009378 | four-way junction helicase activity(GO:0009378) |
| 2.0 | 41.2 | GO:0047617 | acyl-CoA hydrolase activity(GO:0047617) |
| 2.0 | 9.8 | GO:0004920 | interleukin-10 receptor activity(GO:0004920) |
| 1.9 | 105.2 | GO:0004715 | non-membrane spanning protein tyrosine kinase activity(GO:0004715) |
| 1.9 | 9.6 | GO:0005550 | pheromone binding(GO:0005550) |
| 1.9 | 11.3 | GO:0004126 | cytidine deaminase activity(GO:0004126) |
| 1.9 | 54.7 | GO:0052866 | phosphatidylinositol phosphate phosphatase activity(GO:0052866) |
| 1.9 | 3.8 | GO:0070012 | oligopeptidase activity(GO:0070012) |
| 1.8 | 14.6 | GO:0046870 | cadmium ion binding(GO:0046870) |
| 1.8 | 30.7 | GO:0008195 | phosphatidate phosphatase activity(GO:0008195) |
| 1.8 | 10.8 | GO:0003840 | gamma-glutamyltransferase activity(GO:0003840) glutathione hydrolase activity(GO:0036374) |
| 1.8 | 14.2 | GO:0005000 | vasopressin receptor activity(GO:0005000) |
| 1.8 | 8.8 | GO:0004351 | glutamate decarboxylase activity(GO:0004351) |
| 1.8 | 5.3 | GO:0070735 | protein-glycine ligase activity(GO:0070735) |
| 1.8 | 8.8 | GO:0052650 | NADP-retinol dehydrogenase activity(GO:0052650) |
| 1.7 | 387.4 | GO:0004252 | serine-type endopeptidase activity(GO:0004252) |
| 1.7 | 10.4 | GO:0070051 | fibrinogen binding(GO:0070051) |
| 1.7 | 17.3 | GO:0030306 | ADP-ribosylation factor binding(GO:0030306) |
| 1.7 | 5.1 | GO:0008401 | retinoic acid 4-hydroxylase activity(GO:0008401) |
| 1.7 | 5.1 | GO:0001537 | N-acetylgalactosamine 4-O-sulfotransferase activity(GO:0001537) |
| 1.7 | 6.7 | GO:0004052 | arachidonate 12-lipoxygenase activity(GO:0004052) |
| 1.6 | 6.5 | GO:0004967 | glucagon receptor activity(GO:0004967) |
| 1.6 | 4.9 | GO:0015234 | thiamine transmembrane transporter activity(GO:0015234) uptake transmembrane transporter activity(GO:0015563) |
| 1.6 | 8.1 | GO:0008310 | single-stranded DNA 3'-5' exodeoxyribonuclease activity(GO:0008310) |
| 1.6 | 22.2 | GO:0045499 | chemorepellent activity(GO:0045499) |
| 1.6 | 7.8 | GO:0046912 | transferase activity, transferring acyl groups, acyl groups converted into alkyl on transfer(GO:0046912) |
| 1.6 | 4.7 | GO:0010484 | H3 histone acetyltransferase activity(GO:0010484) |
| 1.6 | 4.7 | GO:0060230 | lipoprotein lipase activator activity(GO:0060230) |
| 1.5 | 12.1 | GO:0016308 | 1-phosphatidylinositol-4-phosphate 5-kinase activity(GO:0016308) |
| 1.5 | 16.4 | GO:0046703 | natural killer cell lectin-like receptor binding(GO:0046703) |
| 1.5 | 10.4 | GO:0015277 | kainate selective glutamate receptor activity(GO:0015277) |
| 1.5 | 14.8 | GO:0003680 | AT DNA binding(GO:0003680) |
| 1.5 | 13.2 | GO:0030235 | nitric-oxide synthase regulator activity(GO:0030235) |
| 1.5 | 5.9 | GO:0016428 | tRNA (cytosine-5-)-methyltransferase activity(GO:0016428) |
| 1.4 | 4.3 | GO:0042978 | ornithine decarboxylase activator activity(GO:0042978) |
| 1.4 | 13.0 | GO:0047498 | calcium-dependent phospholipase A2 activity(GO:0047498) |
| 1.4 | 8.6 | GO:0004748 | ribonucleoside-diphosphate reductase activity, thioredoxin disulfide as acceptor(GO:0004748) oxidoreductase activity, acting on CH or CH2 groups, disulfide as acceptor(GO:0016728) ribonucleoside-diphosphate reductase activity(GO:0061731) |
| 1.4 | 14.4 | GO:0038036 | sphingosine-1-phosphate receptor activity(GO:0038036) |
| 1.4 | 5.7 | GO:0003839 | gamma-glutamylcyclotransferase activity(GO:0003839) |
| 1.4 | 18.5 | GO:0047372 | acylglycerol lipase activity(GO:0047372) |
| 1.4 | 7.1 | GO:0050833 | pyruvate transmembrane transporter activity(GO:0050833) |
| 1.4 | 7.1 | GO:0016907 | G-protein coupled acetylcholine receptor activity(GO:0016907) |
| 1.4 | 4.2 | GO:0016263 | glycoprotein-N-acetylgalactosamine 3-beta-galactosyltransferase activity(GO:0016263) |
| 1.4 | 16.9 | GO:0001608 | G-protein coupled nucleotide receptor activity(GO:0001608) G-protein coupled purinergic nucleotide receptor activity(GO:0045028) |
| 1.4 | 5.6 | GO:0016492 | G-protein coupled neurotensin receptor activity(GO:0016492) |
| 1.4 | 8.2 | GO:0034647 | histone demethylase activity (H3-trimethyl-K4 specific)(GO:0034647) |
| 1.3 | 5.4 | GO:0034584 | piRNA binding(GO:0034584) |
| 1.3 | 14.7 | GO:0005381 | iron ion transmembrane transporter activity(GO:0005381) |
| 1.3 | 2.7 | GO:0005131 | growth hormone receptor binding(GO:0005131) |
| 1.3 | 47.1 | GO:0042169 | SH2 domain binding(GO:0042169) |
| 1.3 | 14.4 | GO:0051011 | microtubule minus-end binding(GO:0051011) |
| 1.3 | 10.4 | GO:0015349 | thyroid hormone transmembrane transporter activity(GO:0015349) |
| 1.3 | 52.5 | GO:0005109 | frizzled binding(GO:0005109) |
| 1.2 | 2.5 | GO:0004963 | follicle-stimulating hormone receptor activity(GO:0004963) |
| 1.2 | 16.2 | GO:0045236 | CXCR chemokine receptor binding(GO:0045236) |
| 1.2 | 13.4 | GO:0004862 | cAMP-dependent protein kinase inhibitor activity(GO:0004862) |
| 1.2 | 16.9 | GO:0043274 | phospholipase binding(GO:0043274) |
| 1.2 | 8.5 | GO:0003964 | telomerase activity(GO:0003720) RNA-directed DNA polymerase activity(GO:0003964) |
| 1.2 | 4.8 | GO:0034739 | histone deacetylase activity (H4-K16 specific)(GO:0034739) |
| 1.2 | 3.5 | GO:0004307 | ethanolaminephosphotransferase activity(GO:0004307) |
| 1.2 | 16.4 | GO:0015095 | magnesium ion transmembrane transporter activity(GO:0015095) |
| 1.2 | 7.0 | GO:0004994 | somatostatin receptor activity(GO:0004994) |
| 1.2 | 11.6 | GO:0036310 | annealing helicase activity(GO:0036310) |
| 1.2 | 8.1 | GO:0004859 | phospholipase inhibitor activity(GO:0004859) |
| 1.2 | 3.5 | GO:0009384 | N-acylmannosamine kinase activity(GO:0009384) |
| 1.2 | 5.8 | GO:0008503 | benzodiazepine receptor activity(GO:0008503) |
| 1.1 | 21.6 | GO:0017056 | structural constituent of nuclear pore(GO:0017056) |
| 1.1 | 15.9 | GO:0051378 | serotonin binding(GO:0051378) |
| 1.1 | 7.9 | GO:0071532 | ankyrin repeat binding(GO:0071532) |
| 1.1 | 68.2 | GO:0019894 | kinesin binding(GO:0019894) |
| 1.1 | 8.9 | GO:0016936 | galactoside binding(GO:0016936) |
| 1.1 | 5.6 | GO:0032554 | purine deoxyribonucleotide binding(GO:0032554) |
| 1.1 | 4.4 | GO:0005087 | Ran guanyl-nucleotide exchange factor activity(GO:0005087) |
| 1.1 | 6.5 | GO:0035662 | Toll-like receptor 4 binding(GO:0035662) |
| 1.1 | 6.5 | GO:0032051 | clathrin light chain binding(GO:0032051) |
| 1.1 | 22.6 | GO:0005212 | structural constituent of eye lens(GO:0005212) |
| 1.1 | 3.2 | GO:0004874 | aryl hydrocarbon receptor activity(GO:0004874) |
| 1.1 | 14.7 | GO:0015250 | water channel activity(GO:0015250) |
| 1.1 | 2.1 | GO:0008525 | phosphatidylcholine transporter activity(GO:0008525) |
| 1.0 | 3.1 | GO:0004586 | ornithine decarboxylase activity(GO:0004586) |
| 1.0 | 6.2 | GO:0008865 | glucokinase activity(GO:0004340) hexokinase activity(GO:0004396) fructokinase activity(GO:0008865) mannokinase activity(GO:0019158) |
| 1.0 | 12.4 | GO:0019911 | structural constituent of myelin sheath(GO:0019911) |
| 1.0 | 3.1 | GO:0016230 | sphingomyelin phosphodiesterase activator activity(GO:0016230) |
| 1.0 | 5.9 | GO:0055056 | D-glucose transmembrane transporter activity(GO:0055056) |
| 1.0 | 17.4 | GO:0005522 | profilin binding(GO:0005522) |
| 1.0 | 3.8 | GO:0015350 | methotrexate transporter activity(GO:0015350) |
| 0.9 | 5.5 | GO:0033142 | progesterone receptor binding(GO:0033142) |
| 0.9 | 35.0 | GO:0004364 | glutathione transferase activity(GO:0004364) |
| 0.9 | 2.7 | GO:0005483 | soluble NSF attachment protein activity(GO:0005483) |
| 0.9 | 8.8 | GO:0016857 | racemase and epimerase activity, acting on carbohydrates and derivatives(GO:0016857) |
| 0.9 | 4.4 | GO:0046935 | 1-phosphatidylinositol-3-kinase regulator activity(GO:0046935) |
| 0.9 | 7.0 | GO:0008172 | S-methyltransferase activity(GO:0008172) |
| 0.9 | 5.2 | GO:0061578 | Lys63-specific deubiquitinase activity(GO:0061578) |
| 0.8 | 6.8 | GO:0030368 | interleukin-17 receptor activity(GO:0030368) |
| 0.8 | 1.7 | GO:0097677 | STAT family protein binding(GO:0097677) |
| 0.8 | 3.3 | GO:0004656 | procollagen-proline 4-dioxygenase activity(GO:0004656) |
| 0.8 | 27.2 | GO:0071855 | neuropeptide receptor binding(GO:0071855) |
| 0.8 | 32.7 | GO:0001205 | transcriptional activator activity, RNA polymerase II distal enhancer sequence-specific binding(GO:0001205) |
| 0.8 | 3.3 | GO:0001733 | galactosylceramide sulfotransferase activity(GO:0001733) |
| 0.8 | 16.3 | GO:0008236 | serine-type peptidase activity(GO:0008236) |
| 0.8 | 22.5 | GO:0008536 | Ran GTPase binding(GO:0008536) |
| 0.8 | 17.5 | GO:0004623 | phospholipase A2 activity(GO:0004623) |
| 0.8 | 11.8 | GO:0004806 | triglyceride lipase activity(GO:0004806) |
| 0.8 | 7.0 | GO:0042285 | xylosyltransferase activity(GO:0042285) |
| 0.8 | 22.7 | GO:0008392 | arachidonic acid epoxygenase activity(GO:0008392) |
| 0.7 | 11.7 | GO:0015278 | calcium-release channel activity(GO:0015278) ligand-gated calcium channel activity(GO:0099604) |
| 0.7 | 2.9 | GO:0017089 | glycolipid transporter activity(GO:0017089) |
| 0.7 | 2.9 | GO:0048403 | brain-derived neurotrophic factor binding(GO:0048403) |
| 0.7 | 2.9 | GO:0070579 | methylcytosine dioxygenase activity(GO:0070579) |
| 0.7 | 2.2 | GO:0004809 | tRNA (guanine-N2-)-methyltransferase activity(GO:0004809) |
| 0.7 | 2.9 | GO:1990254 | keratin filament binding(GO:1990254) |
| 0.7 | 13.7 | GO:0016864 | protein disulfide isomerase activity(GO:0003756) intramolecular oxidoreductase activity, transposing S-S bonds(GO:0016864) |
| 0.7 | 2.2 | GO:0003953 | NAD+ nucleosidase activity(GO:0003953) |
| 0.7 | 10.7 | GO:0043522 | leucine zipper domain binding(GO:0043522) |
| 0.7 | 14.7 | GO:0042288 | MHC class I protein binding(GO:0042288) |
| 0.7 | 3.5 | GO:0005111 | type 1 fibroblast growth factor receptor binding(GO:0005105) type 2 fibroblast growth factor receptor binding(GO:0005111) |
| 0.7 | 2.1 | GO:1990460 | leptin receptor binding(GO:1990460) |
| 0.7 | 7.5 | GO:0016832 | aldehyde-lyase activity(GO:0016832) |
| 0.7 | 2.1 | GO:0004995 | tachykinin receptor activity(GO:0004995) |
| 0.7 | 2.7 | GO:0052794 | exo-alpha-(2->3)-sialidase activity(GO:0052794) exo-alpha-(2->6)-sialidase activity(GO:0052795) exo-alpha-(2->8)-sialidase activity(GO:0052796) |
| 0.7 | 4.1 | GO:0005384 | manganese ion transmembrane transporter activity(GO:0005384) |
| 0.7 | 7.4 | GO:0001206 | transcriptional repressor activity, RNA polymerase II distal enhancer sequence-specific binding(GO:0001206) |
| 0.7 | 4.0 | GO:0031821 | G-protein coupled serotonin receptor binding(GO:0031821) |
| 0.7 | 13.9 | GO:0031210 | phosphatidylcholine binding(GO:0031210) |
| 0.7 | 5.9 | GO:0015193 | L-proline transmembrane transporter activity(GO:0015193) |
| 0.7 | 7.2 | GO:0008046 | axon guidance receptor activity(GO:0008046) |
| 0.7 | 5.9 | GO:0005113 | patched binding(GO:0005113) |
| 0.6 | 11.0 | GO:0005247 | voltage-gated chloride channel activity(GO:0005247) |
| 0.6 | 7.6 | GO:0008190 | eukaryotic initiation factor 4E binding(GO:0008190) |
| 0.6 | 3.8 | GO:0008494 | translation activator activity(GO:0008494) |
| 0.6 | 3.1 | GO:0004974 | leukotriene receptor activity(GO:0004974) |
| 0.6 | 2.5 | GO:0003835 | beta-galactoside alpha-2,6-sialyltransferase activity(GO:0003835) |
| 0.6 | 1.8 | GO:0038100 | nodal binding(GO:0038100) |
| 0.6 | 3.7 | GO:0046920 | alpha-(1->3)-fucosyltransferase activity(GO:0046920) |
| 0.6 | 4.3 | GO:0004385 | guanylate kinase activity(GO:0004385) |
| 0.6 | 4.2 | GO:0004118 | cGMP-stimulated cyclic-nucleotide phosphodiesterase activity(GO:0004118) |
| 0.6 | 2.4 | GO:0043533 | inositol 1,3,4,5 tetrakisphosphate binding(GO:0043533) |
| 0.6 | 5.3 | GO:0001727 | lipid kinase activity(GO:0001727) |
| 0.6 | 2.3 | GO:0060229 | phospholipase activator activity(GO:0016004) lipase activator activity(GO:0060229) |
| 0.6 | 4.6 | GO:0001094 | TFIID-class transcription factor binding(GO:0001094) |
| 0.6 | 5.2 | GO:0034056 | estrogen response element binding(GO:0034056) |
| 0.6 | 2.9 | GO:0004523 | RNA-DNA hybrid ribonuclease activity(GO:0004523) |
| 0.6 | 2.8 | GO:0090555 | phosphatidylethanolamine-translocating ATPase activity(GO:0090555) |
| 0.6 | 1.7 | GO:0004687 | myosin light chain kinase activity(GO:0004687) |
| 0.5 | 4.9 | GO:0001730 | 2'-5'-oligoadenylate synthetase activity(GO:0001730) |
| 0.5 | 13.1 | GO:0070840 | dynein complex binding(GO:0070840) |
| 0.5 | 1.6 | GO:0005135 | interleukin-3 receptor binding(GO:0005135) |
| 0.5 | 2.2 | GO:0005136 | interleukin-4 receptor binding(GO:0005136) |
| 0.5 | 2.2 | GO:0000829 | inositol heptakisphosphate kinase activity(GO:0000829) |
| 0.5 | 40.2 | GO:0004843 | thiol-dependent ubiquitin-specific protease activity(GO:0004843) |
| 0.5 | 11.2 | GO:0030676 | Rac guanyl-nucleotide exchange factor activity(GO:0030676) |
| 0.5 | 5.0 | GO:0070628 | proteasome binding(GO:0070628) |
| 0.5 | 3.0 | GO:0042954 | lipoprotein transporter activity(GO:0042954) |
| 0.5 | 13.5 | GO:0008483 | transaminase activity(GO:0008483) |
| 0.5 | 1.9 | GO:0004706 | JUN kinase kinase kinase activity(GO:0004706) |
| 0.5 | 1.9 | GO:0003865 | 3-oxo-5-alpha-steroid 4-dehydrogenase activity(GO:0003865) cholestenone 5-alpha-reductase activity(GO:0047751) |
| 0.5 | 4.7 | GO:0016505 | cysteine-type endopeptidase activator activity involved in apoptotic process(GO:0008656) peptidase activator activity involved in apoptotic process(GO:0016505) |
| 0.5 | 12.7 | GO:0004407 | histone deacetylase activity(GO:0004407) |
| 0.5 | 8.4 | GO:0004550 | nucleoside diphosphate kinase activity(GO:0004550) |
| 0.5 | 8.8 | GO:0005031 | tumor necrosis factor-activated receptor activity(GO:0005031) death receptor activity(GO:0005035) |
| 0.5 | 52.7 | GO:0002020 | protease binding(GO:0002020) |
| 0.5 | 9.6 | GO:0004003 | ATP-dependent DNA helicase activity(GO:0004003) |
| 0.5 | 1.4 | GO:0031493 | nucleosomal histone binding(GO:0031493) |
| 0.5 | 13.8 | GO:0032266 | phosphatidylinositol-3-phosphate binding(GO:0032266) |
| 0.5 | 2.7 | GO:0019788 | NEDD8 transferase activity(GO:0019788) |
| 0.4 | 15.6 | GO:0016417 | S-acyltransferase activity(GO:0016417) |
| 0.4 | 14.7 | GO:0061631 | ubiquitin conjugating enzyme activity(GO:0061631) |
| 0.4 | 12.3 | GO:0008376 | acetylgalactosaminyltransferase activity(GO:0008376) |
| 0.4 | 4.8 | GO:0004571 | mannosyl-oligosaccharide 1,2-alpha-mannosidase activity(GO:0004571) |
| 0.4 | 0.9 | GO:0047179 | platelet-activating factor acetyltransferase activity(GO:0047179) |
| 0.4 | 3.0 | GO:0004957 | prostaglandin E receptor activity(GO:0004957) |
| 0.4 | 4.3 | GO:0035925 | mRNA 3'-UTR AU-rich region binding(GO:0035925) |
| 0.4 | 2.1 | GO:0051864 | histone demethylase activity (H3-K36 specific)(GO:0051864) |
| 0.4 | 4.2 | GO:0005412 | glucose:sodium symporter activity(GO:0005412) |
| 0.4 | 4.6 | GO:0003873 | 6-phosphofructo-2-kinase activity(GO:0003873) |
| 0.4 | 3.3 | GO:0003996 | acyl-CoA ligase activity(GO:0003996) |
| 0.4 | 3.3 | GO:0004972 | NMDA glutamate receptor activity(GO:0004972) |
| 0.4 | 2.8 | GO:0005432 | calcium:sodium antiporter activity(GO:0005432) |
| 0.4 | 5.5 | GO:0008329 | signaling pattern recognition receptor activity(GO:0008329) pattern recognition receptor activity(GO:0038187) |
| 0.4 | 3.5 | GO:0043995 | histone acetyltransferase activity (H4-K5 specific)(GO:0043995) histone acetyltransferase activity (H4-K8 specific)(GO:0043996) histone acetyltransferase activity (H4-K16 specific)(GO:0046972) |
| 0.4 | 4.7 | GO:0015379 | potassium:chloride symporter activity(GO:0015379) potassium ion symporter activity(GO:0022820) |
| 0.4 | 28.8 | GO:0003777 | microtubule motor activity(GO:0003777) |
| 0.4 | 1.1 | GO:0070506 | high-density lipoprotein particle receptor activity(GO:0070506) |
| 0.4 | 1.9 | GO:0004977 | melanocortin receptor activity(GO:0004977) |
| 0.4 | 2.6 | GO:0002151 | G-quadruplex RNA binding(GO:0002151) |
| 0.4 | 1.1 | GO:0030626 | U12 snRNA binding(GO:0030626) |
| 0.4 | 5.1 | GO:0015347 | sodium-independent organic anion transmembrane transporter activity(GO:0015347) |
| 0.4 | 10.0 | GO:0043548 | phosphatidylinositol 3-kinase binding(GO:0043548) |
| 0.4 | 2.8 | GO:0008139 | nuclear localization sequence binding(GO:0008139) |
| 0.4 | 1.1 | GO:0030977 | taurine binding(GO:0030977) |
| 0.3 | 1.0 | GO:0001069 | regulatory region RNA binding(GO:0001069) |
| 0.3 | 8.2 | GO:0000030 | mannosyltransferase activity(GO:0000030) |
| 0.3 | 9.9 | GO:0015002 | cytochrome-c oxidase activity(GO:0004129) heme-copper terminal oxidase activity(GO:0015002) oxidoreductase activity, acting on a heme group of donors, oxygen as acceptor(GO:0016676) |
| 0.3 | 0.6 | GO:0035325 | Toll-like receptor binding(GO:0035325) |
| 0.3 | 8.1 | GO:0070330 | aromatase activity(GO:0070330) |
| 0.3 | 1.0 | GO:0042284 | sphingolipid delta-4 desaturase activity(GO:0042284) |
| 0.3 | 6.9 | GO:0003746 | translation elongation factor activity(GO:0003746) |
| 0.3 | 1.9 | GO:0030976 | thiamine pyrophosphate binding(GO:0030976) |
| 0.3 | 4.0 | GO:0019213 | deacetylase activity(GO:0019213) |
| 0.3 | 17.5 | GO:0051213 | dioxygenase activity(GO:0051213) |
| 0.3 | 4.6 | GO:0004033 | aldo-keto reductase (NADP) activity(GO:0004033) |
| 0.3 | 3.4 | GO:0008097 | 5S rRNA binding(GO:0008097) |
| 0.3 | 13.4 | GO:0001105 | RNA polymerase II transcription coactivator activity(GO:0001105) |
| 0.3 | 1.7 | GO:0008294 | calcium- and calmodulin-responsive adenylate cyclase activity(GO:0008294) |
| 0.3 | 1.7 | GO:0001162 | RNA polymerase II intronic transcription regulatory region sequence-specific DNA binding(GO:0001162) |
| 0.3 | 1.9 | GO:0008308 | voltage-gated anion channel activity(GO:0008308) |
| 0.3 | 2.5 | GO:0070492 | oligosaccharide binding(GO:0070492) |
| 0.3 | 11.3 | GO:0008146 | sulfotransferase activity(GO:0008146) |
| 0.3 | 1.9 | GO:0004630 | phospholipase D activity(GO:0004630) |
| 0.3 | 5.4 | GO:0008327 | methyl-CpG binding(GO:0008327) |
| 0.3 | 4.6 | GO:0008353 | RNA polymerase II carboxy-terminal domain kinase activity(GO:0008353) |
| 0.3 | 2.1 | GO:0043515 | kinetochore binding(GO:0043515) |
| 0.3 | 9.3 | GO:0030544 | Hsp70 protein binding(GO:0030544) |
| 0.3 | 14.0 | GO:0033613 | activating transcription factor binding(GO:0033613) |
| 0.3 | 1.3 | GO:0019770 | IgG receptor activity(GO:0019770) |
| 0.3 | 0.8 | GO:0032810 | sterol response element binding(GO:0032810) |
| 0.3 | 24.7 | GO:0004867 | serine-type endopeptidase inhibitor activity(GO:0004867) |
| 0.3 | 1.8 | GO:0003896 | DNA primase activity(GO:0003896) |
| 0.2 | 4.2 | GO:0035255 | ionotropic glutamate receptor binding(GO:0035255) |
| 0.2 | 3.2 | GO:0008568 | microtubule-severing ATPase activity(GO:0008568) |
| 0.2 | 2.7 | GO:0004089 | carbonate dehydratase activity(GO:0004089) |
| 0.2 | 4.4 | GO:0001848 | complement binding(GO:0001848) |
| 0.2 | 11.1 | GO:0004402 | histone acetyltransferase activity(GO:0004402) |
| 0.2 | 11.8 | GO:0004869 | cysteine-type endopeptidase inhibitor activity(GO:0004869) |
| 0.2 | 0.7 | GO:0000171 | ribonuclease MRP activity(GO:0000171) |
| 0.2 | 2.4 | GO:0005436 | sodium:phosphate symporter activity(GO:0005436) |
| 0.2 | 2.1 | GO:0004622 | lysophospholipase activity(GO:0004622) |
| 0.2 | 3.0 | GO:0003796 | lysozyme activity(GO:0003796) |
| 0.2 | 6.0 | GO:0015269 | calcium-activated potassium channel activity(GO:0015269) |
| 0.2 | 1.4 | GO:0047961 | glycine N-acyltransferase activity(GO:0047961) |
| 0.2 | 3.6 | GO:0015643 | toxic substance binding(GO:0015643) |
| 0.2 | 1.7 | GO:0017034 | Rap guanyl-nucleotide exchange factor activity(GO:0017034) |
| 0.2 | 8.6 | GO:0017112 | Rab guanyl-nucleotide exchange factor activity(GO:0017112) |
| 0.2 | 0.4 | GO:0042015 | interleukin-20 binding(GO:0042015) |
| 0.2 | 2.2 | GO:0004579 | oligosaccharyl transferase activity(GO:0004576) dolichyl-diphosphooligosaccharide-protein glycotransferase activity(GO:0004579) |
| 0.2 | 15.3 | GO:0008565 | protein transporter activity(GO:0008565) |
| 0.2 | 1.0 | GO:0048495 | Roundabout binding(GO:0048495) |
| 0.2 | 0.6 | GO:0005146 | leukemia inhibitory factor receptor binding(GO:0005146) |
| 0.2 | 4.2 | GO:0004890 | GABA-A receptor activity(GO:0004890) |
| 0.2 | 0.7 | GO:0003691 | double-stranded telomeric DNA binding(GO:0003691) |
| 0.2 | 8.3 | GO:0043621 | protein self-association(GO:0043621) |
| 0.2 | 4.3 | GO:0042162 | telomeric DNA binding(GO:0042162) |
| 0.2 | 1.6 | GO:0017151 | DEAD/H-box RNA helicase binding(GO:0017151) |
| 0.2 | 8.9 | GO:0035064 | methylated histone binding(GO:0035064) |
| 0.2 | 2.9 | GO:0016628 | oxidoreductase activity, acting on the CH-CH group of donors, NAD or NADP as acceptor(GO:0016628) |
| 0.2 | 2.9 | GO:0004535 | poly(A)-specific ribonuclease activity(GO:0004535) |
| 0.2 | 1.6 | GO:0019808 | polyamine binding(GO:0019808) |
| 0.2 | 1.0 | GO:0098634 | protein binding involved in cell-matrix adhesion(GO:0098634) |
| 0.2 | 16.9 | GO:0017124 | SH3 domain binding(GO:0017124) |
| 0.2 | 0.3 | GO:0003726 | double-stranded RNA adenosine deaminase activity(GO:0003726) |
| 0.2 | 1.9 | GO:0017091 | AU-rich element binding(GO:0017091) |
| 0.2 | 0.9 | GO:0008140 | cAMP response element binding protein binding(GO:0008140) |
| 0.2 | 0.3 | GO:0061733 | peptide-lysine-N-acetyltransferase activity(GO:0061733) |
| 0.1 | 0.4 | GO:0046790 | virion binding(GO:0046790) |
| 0.1 | 8.7 | GO:0003743 | translation initiation factor activity(GO:0003743) |
| 0.1 | 3.8 | GO:0008188 | neuropeptide receptor activity(GO:0008188) |
| 0.1 | 0.9 | GO:0097200 | cysteine-type endopeptidase activity involved in apoptotic process(GO:0097153) cysteine-type endopeptidase activity involved in execution phase of apoptosis(GO:0097200) |
| 0.1 | 0.7 | GO:0008502 | melatonin receptor activity(GO:0008502) |
| 0.1 | 0.5 | GO:0036435 | K48-linked polyubiquitin binding(GO:0036435) |
| 0.1 | 0.5 | GO:0015056 | corticotrophin-releasing factor receptor activity(GO:0015056) corticotropin-releasing hormone receptor activity(GO:0043404) |
| 0.1 | 0.9 | GO:1990405 | protein antigen binding(GO:1990405) |
| 0.1 | 0.9 | GO:0004311 | farnesyltranstransferase activity(GO:0004311) |
| 0.1 | 0.8 | GO:0070180 | large ribosomal subunit rRNA binding(GO:0070180) |
| 0.1 | 2.7 | GO:0000062 | fatty-acyl-CoA binding(GO:0000062) |
| 0.1 | 0.4 | GO:0031531 | thyrotropin-releasing hormone receptor binding(GO:0031531) |
| 0.1 | 0.8 | GO:0031748 | D1 dopamine receptor binding(GO:0031748) |
| 0.1 | 3.9 | GO:0005164 | tumor necrosis factor receptor binding(GO:0005164) |
| 0.1 | 0.3 | GO:0004478 | methionine adenosyltransferase activity(GO:0004478) |
| 0.1 | 2.6 | GO:0048027 | mRNA 5'-UTR binding(GO:0048027) |
| 0.1 | 0.9 | GO:1990446 | U1 snRNP binding(GO:1990446) |
| 0.1 | 0.7 | GO:0008420 | CTD phosphatase activity(GO:0008420) |
| 0.1 | 1.6 | GO:0005149 | interleukin-1 receptor binding(GO:0005149) |
| 0.1 | 0.7 | GO:0042030 | ATPase inhibitor activity(GO:0042030) |
| 0.1 | 17.4 | GO:0044822 | mRNA binding(GO:0003729) poly(A) RNA binding(GO:0044822) |
| 0.1 | 0.9 | GO:0003909 | DNA ligase activity(GO:0003909) DNA ligase (ATP) activity(GO:0003910) |
| 0.1 | 3.6 | GO:0030551 | cyclic nucleotide binding(GO:0030551) |
| 0.1 | 5.7 | GO:0008026 | ATP-dependent helicase activity(GO:0008026) purine NTP-dependent helicase activity(GO:0070035) |
| 0.1 | 5.2 | GO:0003725 | double-stranded RNA binding(GO:0003725) |
| 0.1 | 4.6 | GO:0003684 | damaged DNA binding(GO:0003684) |
| 0.1 | 0.2 | GO:0002114 | interleukin-33 receptor activity(GO:0002114) |
| 0.1 | 1.2 | GO:0005355 | glucose transmembrane transporter activity(GO:0005355) |
| 0.1 | 1.0 | GO:0019789 | SUMO transferase activity(GO:0019789) |
| 0.1 | 1.2 | GO:0001056 | RNA polymerase III activity(GO:0001056) |
| 0.1 | 1.4 | GO:0004532 | exoribonuclease activity(GO:0004532) |
| 0.1 | 1.8 | GO:0042800 | histone methyltransferase activity (H3-K4 specific)(GO:0042800) |
| 0.1 | 0.4 | GO:0008889 | glycerophosphodiester phosphodiesterase activity(GO:0008889) |
| 0.1 | 3.3 | GO:0004540 | ribonuclease activity(GO:0004540) |
| 0.1 | 3.8 | GO:0008170 | N-methyltransferase activity(GO:0008170) |
| 0.1 | 0.8 | GO:0031369 | translation initiation factor binding(GO:0031369) |
| 0.1 | 2.0 | GO:0042605 | peptide antigen binding(GO:0042605) |
| 0.1 | 0.3 | GO:0030280 | structural constituent of epidermis(GO:0030280) |
| 0.1 | 1.5 | GO:0070001 | aspartic-type peptidase activity(GO:0070001) |
| 0.0 | 3.4 | GO:0051082 | unfolded protein binding(GO:0051082) |
| 0.0 | 0.3 | GO:0051998 | carboxyl-O-methyltransferase activity(GO:0010340) protein carboxyl O-methyltransferase activity(GO:0051998) |
| 0.0 | 0.7 | GO:0016881 | acid-amino acid ligase activity(GO:0016881) |
| 0.0 | 0.2 | GO:0016721 | superoxide dismutase activity(GO:0004784) oxidoreductase activity, acting on superoxide radicals as acceptor(GO:0016721) |
| 0.0 | 0.5 | GO:0008301 | DNA binding, bending(GO:0008301) |
| 0.0 | 0.5 | GO:0005537 | mannose binding(GO:0005537) |
| 0.0 | 0.1 | GO:0004483 | mRNA (nucleoside-2'-O-)-methyltransferase activity(GO:0004483) mRNA methyltransferase activity(GO:0008174) |
| 0.0 | 0.2 | GO:0016714 | oxidoreductase activity, acting on paired donors, with incorporation or reduction of molecular oxygen, reduced pteridine as one donor, and incorporation of one atom of oxygen(GO:0016714) |
| 0.0 | 0.5 | GO:0005086 | ARF guanyl-nucleotide exchange factor activity(GO:0005086) |
| 0.0 | 0.1 | GO:0004128 | cytochrome-b5 reductase activity, acting on NAD(P)H(GO:0004128) |
| 0.0 | 0.2 | GO:0003708 | retinoic acid receptor activity(GO:0003708) |
| 0.0 | 0.3 | GO:0017049 | GTP-Rho binding(GO:0017049) |
| 0.0 | 0.2 | GO:0043325 | phosphatidylinositol-3,4-bisphosphate binding(GO:0043325) |
| 0.0 | 1.7 | GO:0005125 | cytokine activity(GO:0005125) |
| 0.0 | 0.1 | GO:0102338 | fatty acid elongase activity(GO:0009922) 3-oxo-arachidoyl-CoA synthase activity(GO:0102336) 3-oxo-cerotoyl-CoA synthase activity(GO:0102337) 3-oxo-lignoceronyl-CoA synthase activity(GO:0102338) |
Gene overrepresentation in curated gene sets: canonical pathways category:
| Log-likelihood per target | Total log-likelihood | Term | Description |
|---|---|---|---|
| 3.8 | 52.6 | ST TYPE I INTERFERON PATHWAY | Type I Interferon (alpha/beta IFN) Pathway |
| 3.6 | 188.3 | PID ECADHERIN STABILIZATION PATHWAY | Stabilization and expansion of the E-cadherin adherens junction |
| 3.1 | 39.7 | PID RANBP2 PATHWAY | Sumoylation by RanBP2 regulates transcriptional repression |
| 2.9 | 50.1 | SA REG CASCADE OF CYCLIN EXPR | Expression of cyclins regulates progression through the cell cycle by activating cyclin-dependent kinases. |
| 2.2 | 146.4 | PID CD8 TCR PATHWAY | TCR signaling in naïve CD8+ T cells |
| 1.9 | 3.8 | PID ERBB4 PATHWAY | ErbB4 signaling events |
| 1.5 | 12.3 | SA PTEN PATHWAY | PTEN is a tumor suppressor that dephosphorylates the lipid messenger phosphatidylinositol triphosphate. |
| 1.5 | 22.8 | SA PROGRAMMED CELL DEATH | Programmed cell death, or apoptosis, eliminates damaged or unneeded cells. |
| 1.4 | 28.8 | PID PDGFRB PATHWAY | PDGFR-beta signaling pathway |
| 1.4 | 55.3 | ST B CELL ANTIGEN RECEPTOR | B Cell Antigen Receptor |
| 1.4 | 14.9 | PID S1P S1P4 PATHWAY | S1P4 pathway |
| 1.1 | 11.0 | PID TCR PATHWAY | TCR signaling in naïve CD4+ T cells |
| 1.1 | 13.1 | SA MMP CYTOKINE CONNECTION | Cytokines can induce activation of matrix metalloproteinases, which degrade extracellular matrix. |
| 0.9 | 55.8 | PID TGFBR PATHWAY | TGF-beta receptor signaling |
| 0.9 | 17.7 | PID AURORA A PATHWAY | Aurora A signaling |
| 0.9 | 13.9 | PID ERBB NETWORK PATHWAY | ErbB receptor signaling network |
| 0.9 | 21.6 | ST PHOSPHOINOSITIDE 3 KINASE PATHWAY | PI3K Pathway |
| 0.8 | 17.5 | ST WNT CA2 CYCLIC GMP PATHWAY | Wnt/Ca2+/cyclic GMP signaling. |
| 0.8 | 29.6 | PID FCER1 PATHWAY | Fc-epsilon receptor I signaling in mast cells |
| 0.8 | 19.7 | PID PI3K PLC TRK PATHWAY | Trk receptor signaling mediated by PI3K and PLC-gamma |
| 0.8 | 13.0 | PID P38 MKK3 6PATHWAY | p38 MAPK signaling pathway |
| 0.8 | 44.9 | PID TNF PATHWAY | TNF receptor signaling pathway |
| 0.8 | 5.6 | PID EPHA2 FWD PATHWAY | EPHA2 forward signaling |
| 0.8 | 40.2 | PID NFAT TFPATHWAY | Calcineurin-regulated NFAT-dependent transcription in lymphocytes |
| 0.7 | 33.6 | PID PLK1 PATHWAY | PLK1 signaling events |
| 0.7 | 5.4 | ST GAQ PATHWAY | G alpha q Pathway |
| 0.7 | 16.4 | PID ALPHA SYNUCLEIN PATHWAY | Alpha-synuclein signaling |
| 0.6 | 7.6 | PID EPO PATHWAY | EPO signaling pathway |
| 0.6 | 17.7 | PID LIS1 PATHWAY | Lissencephaly gene (LIS1) in neuronal migration and development |
| 0.6 | 27.7 | PID AURORA B PATHWAY | Aurora B signaling |
| 0.6 | 14.5 | PID BCR 5PATHWAY | BCR signaling pathway |
| 0.6 | 14.2 | PID SYNDECAN 2 PATHWAY | Syndecan-2-mediated signaling events |
| 0.6 | 11.5 | PID PI3KCI PATHWAY | Class I PI3K signaling events |
| 0.6 | 47.7 | PID MYC ACTIV PATHWAY | Validated targets of C-MYC transcriptional activation |
| 0.5 | 8.3 | PID SYNDECAN 3 PATHWAY | Syndecan-3-mediated signaling events |
| 0.5 | 14.5 | PID HDAC CLASSI PATHWAY | Signaling events mediated by HDAC Class I |
| 0.5 | 4.5 | PID INTEGRIN CS PATHWAY | Integrin family cell surface interactions |
| 0.5 | 4.4 | PID FOXM1 PATHWAY | FOXM1 transcription factor network |
| 0.5 | 17.2 | PID ARF6 TRAFFICKING PATHWAY | Arf6 trafficking events |
| 0.5 | 10.6 | PID P73PATHWAY | p73 transcription factor network |
| 0.5 | 6.1 | PID RET PATHWAY | Signaling events regulated by Ret tyrosine kinase |
| 0.5 | 13.3 | PID PS1 PATHWAY | Presenilin action in Notch and Wnt signaling |
| 0.4 | 5.8 | PID ATR PATHWAY | ATR signaling pathway |
| 0.4 | 6.3 | PID EPHA FWDPATHWAY | EPHA forward signaling |
| 0.4 | 13.4 | PID UPA UPAR PATHWAY | Urokinase-type plasminogen activator (uPA) and uPAR-mediated signaling |
| 0.4 | 4.4 | PID REELIN PATHWAY | Reelin signaling pathway |
| 0.4 | 15.9 | PID CDC42 PATHWAY | CDC42 signaling events |
| 0.4 | 7.7 | PID TOLL ENDOGENOUS PATHWAY | Endogenous TLR signaling |
| 0.4 | 7.1 | PID INTEGRIN5 PATHWAY | Beta5 beta6 beta7 and beta8 integrin cell surface interactions |
| 0.4 | 18.0 | PID FANCONI PATHWAY | Fanconi anemia pathway |
| 0.4 | 8.1 | PID ILK PATHWAY | Integrin-linked kinase signaling |
| 0.4 | 11.4 | PID MET PATHWAY | Signaling events mediated by Hepatocyte Growth Factor Receptor (c-Met) |
| 0.4 | 9.7 | PID RETINOIC ACID PATHWAY | Retinoic acid receptors-mediated signaling |
| 0.4 | 5.9 | PID HEDGEHOG 2PATHWAY | Signaling events mediated by the Hedgehog family |
| 0.3 | 4.9 | PID IL1 PATHWAY | IL1-mediated signaling events |
| 0.3 | 1.6 | PID ECADHERIN KERATINOCYTE PATHWAY | E-cadherin signaling in keratinocytes |
| 0.3 | 9.5 | PID IL12 2PATHWAY | IL12-mediated signaling events |
| 0.2 | 5.4 | ST JNK MAPK PATHWAY | JNK MAPK Pathway |
| 0.2 | 4.0 | PID ERBB1 INTERNALIZATION PATHWAY | Internalization of ErbB1 |
| 0.2 | 3.2 | PID FAK PATHWAY | Signaling events mediated by focal adhesion kinase |
| 0.2 | 3.2 | PID LPA4 PATHWAY | LPA4-mediated signaling events |
| 0.2 | 4.6 | PID MTOR 4PATHWAY | mTOR signaling pathway |
| 0.2 | 2.6 | PID ARF6 PATHWAY | Arf6 signaling events |
| 0.1 | 5.1 | PID P53 REGULATION PATHWAY | p53 pathway |
| 0.1 | 3.7 | PID IL4 2PATHWAY | IL4-mediated signaling events |
| 0.1 | 1.3 | PID ALK2 PATHWAY | ALK2 signaling events |
| 0.1 | 0.7 | PID NEPHRIN NEPH1 PATHWAY | Nephrin/Neph1 signaling in the kidney podocyte |
| 0.1 | 4.2 | PID HNF3B PATHWAY | FOXA2 and FOXA3 transcription factor networks |
| 0.1 | 1.7 | ST INTEGRIN SIGNALING PATHWAY | Integrin Signaling Pathway |
| 0.1 | 1.5 | PID RAC1 PATHWAY | RAC1 signaling pathway |
| 0.1 | 3.4 | PID E2F PATHWAY | E2F transcription factor network |
| 0.1 | 1.3 | PID KIT PATHWAY | Signaling events mediated by Stem cell factor receptor (c-Kit) |
| 0.1 | 20.6 | NABA SECRETED FACTORS | Genes encoding secreted soluble factors |
| 0.1 | 2.3 | PID REG GR PATHWAY | Glucocorticoid receptor regulatory network |
| 0.1 | 0.5 | PID RB 1PATHWAY | Regulation of retinoblastoma protein |
| 0.0 | 0.2 | ST GA13 PATHWAY | G alpha 13 Pathway |
| 0.0 | 0.5 | ST ERK1 ERK2 MAPK PATHWAY | ERK1/ERK2 MAPK Pathway |
| 0.0 | 0.6 | PID HDAC CLASSIII PATHWAY | Signaling events mediated by HDAC Class III |
Gene overrepresentation in curated gene sets: REACTOME pathways category:
| Log-likelihood per target | Total log-likelihood | Term | Description |
|---|---|---|---|
| 10.2 | 91.9 | REACTOME DEFENSINS | Genes involved in Defensins |
| 6.8 | 47.4 | REACTOME TRANSLOCATION OF ZAP 70 TO IMMUNOLOGICAL SYNAPSE | Genes involved in Translocation of ZAP-70 to Immunological synapse |
| 4.8 | 53.2 | REACTOME SYNTHESIS OF PIPS AT THE LATE ENDOSOME MEMBRANE | Genes involved in Synthesis of PIPs at the late endosome membrane |
| 4.3 | 8.5 | REACTOME DSCAM INTERACTIONS | Genes involved in DSCAM interactions |
| 3.8 | 69.3 | REACTOME GAP JUNCTION ASSEMBLY | Genes involved in Gap junction assembly |
| 3.3 | 59.9 | REACTOME REGULATION OF IFNG SIGNALING | Genes involved in Regulation of IFNG signaling |
| 2.8 | 48.4 | REACTOME CDC6 ASSOCIATION WITH THE ORC ORIGIN COMPLEX | Genes involved in CDC6 association with the ORC:origin complex |
| 2.6 | 25.9 | REACTOME TRANSPORT OF ORGANIC ANIONS | Genes involved in Transport of organic anions |
| 2.5 | 17.5 | REACTOME CA DEPENDENT EVENTS | Genes involved in Ca-dependent events |
| 2.4 | 108.4 | REACTOME IMMUNOREGULATORY INTERACTIONS BETWEEN A LYMPHOID AND A NON LYMPHOID CELL | Genes involved in Immunoregulatory interactions between a Lymphoid and a non-Lymphoid cell |
| 2.2 | 26.8 | REACTOME SYNTHESIS OF BILE ACIDS AND BILE SALTS VIA 24 HYDROXYCHOLESTEROL | Genes involved in Synthesis of bile acids and bile salts via 24-hydroxycholesterol |
| 2.2 | 6.5 | REACTOME GLUCAGON SIGNALING IN METABOLIC REGULATION | Genes involved in Glucagon signaling in metabolic regulation |
| 1.9 | 32.3 | REACTOME NUCLEOTIDE LIKE PURINERGIC RECEPTORS | Genes involved in Nucleotide-like (purinergic) receptors |
| 1.9 | 22.5 | REACTOME ANDROGEN BIOSYNTHESIS | Genes involved in Androgen biosynthesis |
| 1.8 | 7.3 | REACTOME PHOSPHORYLATION OF CD3 AND TCR ZETA CHAINS | Genes involved in Phosphorylation of CD3 and TCR zeta chains |
| 1.8 | 23.5 | REACTOME TANDEM PORE DOMAIN POTASSIUM CHANNELS | Genes involved in Tandem pore domain potassium channels |
| 1.8 | 21.2 | REACTOME SIGNAL REGULATORY PROTEIN SIRP FAMILY INTERACTIONS | Genes involved in Signal regulatory protein (SIRP) family interactions |
| 1.5 | 54.4 | REACTOME INTERFERON GAMMA SIGNALING | Genes involved in Interferon gamma signaling |
| 1.4 | 23.2 | REACTOME ACYL CHAIN REMODELLING OF PS | Genes involved in Acyl chain remodelling of PS |
| 1.4 | 23.0 | REACTOME IONOTROPIC ACTIVITY OF KAINATE RECEPTORS | Genes involved in Ionotropic activity of Kainate Receptors |
| 1.4 | 38.3 | REACTOME REGULATION OF GENE EXPRESSION IN BETA CELLS | Genes involved in Regulation of gene expression in beta cells |
| 1.4 | 50.3 | REACTOME PLATELET AGGREGATION PLUG FORMATION | Genes involved in Platelet Aggregation (Plug Formation) |
| 1.4 | 24.7 | REACTOME GENERATION OF SECOND MESSENGER MOLECULES | Genes involved in Generation of second messenger molecules |
| 1.4 | 17.8 | REACTOME CYTOSOLIC SULFONATION OF SMALL MOLECULES | Genes involved in Cytosolic sulfonation of small molecules |
| 1.3 | 13.4 | REACTOME REGULATION OF THE FANCONI ANEMIA PATHWAY | Genes involved in Regulation of the Fanconi anemia pathway |
| 1.3 | 6.7 | REACTOME APOBEC3G MEDIATED RESISTANCE TO HIV1 INFECTION | Genes involved in APOBEC3G mediated resistance to HIV-1 infection |
| 1.3 | 7.9 | REACTOME OLFACTORY SIGNALING PATHWAY | Genes involved in Olfactory Signaling Pathway |
| 1.2 | 14.7 | REACTOME PASSIVE TRANSPORT BY AQUAPORINS | Genes involved in Passive Transport by Aquaporins |
| 1.1 | 21.7 | REACTOME TRAFFICKING OF GLUR2 CONTAINING AMPA RECEPTORS | Genes involved in Trafficking of GluR2-containing AMPA receptors |
| 1.1 | 15.9 | REACTOME SEROTONIN RECEPTORS | Genes involved in Serotonin receptors |
| 1.1 | 7.9 | REACTOME CTLA4 INHIBITORY SIGNALING | Genes involved in CTLA4 inhibitory signaling |
| 1.1 | 29.7 | REACTOME REGULATION OF GLUCOKINASE BY GLUCOKINASE REGULATORY PROTEIN | Genes involved in Regulation of Glucokinase by Glucokinase Regulatory Protein |
| 1.0 | 19.9 | REACTOME FORMATION OF TUBULIN FOLDING INTERMEDIATES BY CCT TRIC | Genes involved in Formation of tubulin folding intermediates by CCT/TriC |
| 1.0 | 9.3 | REACTOME TRYPTOPHAN CATABOLISM | Genes involved in Tryptophan catabolism |
| 1.0 | 48.5 | REACTOME AQUAPORIN MEDIATED TRANSPORT | Genes involved in Aquaporin-mediated transport |
| 1.0 | 48.4 | REACTOME LIPID DIGESTION MOBILIZATION AND TRANSPORT | Genes involved in Lipid digestion, mobilization, and transport |
| 1.0 | 23.0 | REACTOME ANTIGEN ACTIVATES B CELL RECEPTOR LEADING TO GENERATION OF SECOND MESSENGERS | Genes involved in Antigen Activates B Cell Receptor Leading to Generation of Second Messengers |
| 1.0 | 17.9 | REACTOME CRMPS IN SEMA3A SIGNALING | Genes involved in CRMPs in Sema3A signaling |
| 0.9 | 13.2 | REACTOME BILE SALT AND ORGANIC ANION SLC TRANSPORTERS | Genes involved in Bile salt and organic anion SLC transporters |
| 0.9 | 4.3 | REACTOME REGULATION OF ORNITHINE DECARBOXYLASE ODC | Genes involved in Regulation of ornithine decarboxylase (ODC) |
| 0.9 | 9.4 | REACTOME REMOVAL OF THE FLAP INTERMEDIATE FROM THE C STRAND | Genes involved in Removal of the Flap Intermediate from the C-strand |
| 0.8 | 6.7 | REACTOME ASSEMBLY OF THE PRE REPLICATIVE COMPLEX | Genes involved in Assembly of the pre-replicative complex |
| 0.8 | 13.5 | REACTOME GABA A RECEPTOR ACTIVATION | Genes involved in GABA A receptor activation |
| 0.8 | 17.7 | REACTOME CHOLESTEROL BIOSYNTHESIS | Genes involved in Cholesterol biosynthesis |
| 0.8 | 23.6 | REACTOME KINESINS | Genes involved in Kinesins |
| 0.7 | 5.9 | REACTOME RAP1 SIGNALLING | Genes involved in Rap1 signalling |
| 0.7 | 5.1 | REACTOME PRE NOTCH PROCESSING IN GOLGI | Genes involved in Pre-NOTCH Processing in Golgi |
| 0.7 | 9.9 | REACTOME SIGNALING BY FGFR1 FUSION MUTANTS | Genes involved in Signaling by FGFR1 fusion mutants |
| 0.7 | 51.9 | REACTOME CLASS B 2 SECRETIN FAMILY RECEPTORS | Genes involved in Class B/2 (Secretin family receptors) |
| 0.7 | 15.9 | REACTOME GPVI MEDIATED ACTIVATION CASCADE | Genes involved in GPVI-mediated activation cascade |
| 0.7 | 11.4 | REACTOME FANCONI ANEMIA PATHWAY | Genes involved in Fanconi Anemia pathway |
| 0.7 | 10.0 | REACTOME PLATELET SENSITIZATION BY LDL | Genes involved in Platelet sensitization by LDL |
| 0.7 | 7.2 | REACTOME SYNTHESIS SECRETION AND INACTIVATION OF GIP | Genes involved in Synthesis, Secretion, and Inactivation of Glucose-dependent Insulinotropic Polypeptide (GIP) |
| 0.6 | 23.2 | REACTOME INTRINSIC PATHWAY FOR APOPTOSIS | Genes involved in Intrinsic Pathway for Apoptosis |
| 0.6 | 15.3 | REACTOME INSULIN SYNTHESIS AND PROCESSING | Genes involved in Insulin Synthesis and Processing |
| 0.6 | 38.0 | REACTOME LOSS OF NLP FROM MITOTIC CENTROSOMES | Genes involved in Loss of Nlp from mitotic centrosomes |
| 0.6 | 12.6 | REACTOME GABA SYNTHESIS RELEASE REUPTAKE AND DEGRADATION | Genes involved in GABA synthesis, release, reuptake and degradation |
| 0.6 | 40.4 | REACTOME MITOTIC PROMETAPHASE | Genes involved in Mitotic Prometaphase |
| 0.6 | 8.4 | REACTOME SYNTHESIS OF PE | Genes involved in Synthesis of PE |
| 0.6 | 32.2 | REACTOME GOLGI ASSOCIATED VESICLE BIOGENESIS | Genes involved in Golgi Associated Vesicle Biogenesis |
| 0.6 | 3.4 | REACTOME SYNTHESIS OF BILE ACIDS AND BILE SALTS VIA 7ALPHA HYDROXYCHOLESTEROL | Genes involved in Synthesis of bile acids and bile salts via 7alpha-hydroxycholesterol |
| 0.5 | 2.7 | REACTOME TRANSCRIPTIONAL ACTIVITY OF SMAD2 SMAD3 SMAD4 HETEROTRIMER | Genes involved in Transcriptional activity of SMAD2/SMAD3:SMAD4 heterotrimer |
| 0.5 | 3.7 | REACTOME ACTIVATION OF NF KAPPAB IN B CELLS | Genes involved in Activation of NF-kappaB in B Cells |
| 0.5 | 6.4 | REACTOME NEPHRIN INTERACTIONS | Genes involved in Nephrin interactions |
| 0.5 | 6.2 | REACTOME PYRIMIDINE CATABOLISM | Genes involved in Pyrimidine catabolism |
| 0.5 | 22.4 | REACTOME CHEMOKINE RECEPTORS BIND CHEMOKINES | Genes involved in Chemokine receptors bind chemokines |
| 0.5 | 10.1 | REACTOME EXTENSION OF TELOMERES | Genes involved in Extension of Telomeres |
| 0.5 | 13.2 | REACTOME SULFUR AMINO ACID METABOLISM | Genes involved in Sulfur amino acid metabolism |
| 0.5 | 8.6 | REACTOME COSTIMULATION BY THE CD28 FAMILY | Genes involved in Costimulation by the CD28 family |
| 0.5 | 10.8 | REACTOME IL 3 5 AND GM CSF SIGNALING | Genes involved in Interleukin-3, 5 and GM-CSF signaling |
| 0.4 | 12.1 | REACTOME METAL ION SLC TRANSPORTERS | Genes involved in Metal ion SLC transporters |
| 0.4 | 6.2 | REACTOME ABCA TRANSPORTERS IN LIPID HOMEOSTASIS | Genes involved in ABCA transporters in lipid homeostasis |
| 0.4 | 9.6 | REACTOME BASIGIN INTERACTIONS | Genes involved in Basigin interactions |
| 0.4 | 3.3 | REACTOME UNBLOCKING OF NMDA RECEPTOR GLUTAMATE BINDING AND ACTIVATION | Genes involved in Unblocking of NMDA receptor, glutamate binding and activation |
| 0.4 | 4.4 | REACTOME SLBP DEPENDENT PROCESSING OF REPLICATION DEPENDENT HISTONE PRE MRNAS | Genes involved in SLBP Dependent Processing of Replication-Dependent Histone Pre-mRNAs |
| 0.4 | 2.2 | REACTOME JNK C JUN KINASES PHOSPHORYLATION AND ACTIVATION MEDIATED BY ACTIVATED HUMAN TAK1 | Genes involved in JNK (c-Jun kinases) phosphorylation and activation mediated by activated human TAK1 |
| 0.4 | 5.8 | REACTOME HOST INTERACTIONS OF HIV FACTORS | Genes involved in Host Interactions of HIV factors |
| 0.3 | 3.8 | REACTOME ORGANIC CATION ANION ZWITTERION TRANSPORT | Genes involved in Organic cation/anion/zwitterion transport |
| 0.3 | 4.0 | REACTOME PLC BETA MEDIATED EVENTS | Genes involved in PLC beta mediated events |
| 0.3 | 5.6 | REACTOME AMINO ACID SYNTHESIS AND INTERCONVERSION TRANSAMINATION | Genes involved in Amino acid synthesis and interconversion (transamination) |
| 0.3 | 7.6 | REACTOME CGMP EFFECTS | Genes involved in cGMP effects |
| 0.3 | 7.2 | REACTOME N GLYCAN ANTENNAE ELONGATION IN THE MEDIAL TRANS GOLGI | Genes involved in N-glycan antennae elongation in the medial/trans-Golgi |
| 0.3 | 39.5 | REACTOME PEPTIDE LIGAND BINDING RECEPTORS | Genes involved in Peptide ligand-binding receptors |
| 0.3 | 10.7 | REACTOME INTERACTION BETWEEN L1 AND ANKYRINS | Genes involved in Interaction between L1 and Ankyrins |
| 0.3 | 5.7 | REACTOME PROCESSING OF INTRONLESS PRE MRNAS | Genes involved in Processing of Intronless Pre-mRNAs |
| 0.3 | 3.8 | REACTOME EICOSANOID LIGAND BINDING RECEPTORS | Genes involved in Eicosanoid ligand-binding receptors |
| 0.3 | 10.2 | REACTOME INTERFERON ALPHA BETA SIGNALING | Genes involved in Interferon alpha/beta signaling |
| 0.3 | 16.3 | REACTOME G ALPHA I SIGNALLING EVENTS | Genes involved in G alpha (i) signalling events |
| 0.3 | 3.0 | REACTOME CALNEXIN CALRETICULIN CYCLE | Genes involved in Calnexin/calreticulin cycle |
| 0.3 | 12.8 | REACTOME ION TRANSPORT BY P TYPE ATPASES | Genes involved in Ion transport by P-type ATPases |
| 0.3 | 14.1 | REACTOME SIGNALING BY ERBB2 | Genes involved in Signaling by ERBB2 |
| 0.3 | 3.1 | REACTOME METABOLISM OF POLYAMINES | Genes involved in Metabolism of polyamines |
| 0.3 | 5.3 | REACTOME GLOBAL GENOMIC NER GG NER | Genes involved in Global Genomic NER (GG-NER) |
| 0.3 | 5.4 | REACTOME ANTIGEN PROCESSING CROSS PRESENTATION | Genes involved in Antigen processing-Cross presentation |
| 0.3 | 4.3 | REACTOME CLASS C 3 METABOTROPIC GLUTAMATE PHEROMONE RECEPTORS | Genes involved in Class C/3 (Metabotropic glutamate/pheromone receptors) |
| 0.3 | 2.6 | REACTOME PLATELET CALCIUM HOMEOSTASIS | Genes involved in Platelet calcium homeostasis |
| 0.3 | 12.9 | REACTOME NRAGE SIGNALS DEATH THROUGH JNK | Genes involved in NRAGE signals death through JNK |
| 0.2 | 3.6 | REACTOME SYNTHESIS OF PC | Genes involved in Synthesis of PC |
| 0.2 | 2.7 | REACTOME HIGHLY CALCIUM PERMEABLE POSTSYNAPTIC NICOTINIC ACETYLCHOLINE RECEPTORS | Genes involved in Highly calcium permeable postsynaptic nicotinic acetylcholine receptors |
| 0.2 | 0.8 | REACTOME SEMA3A PLEXIN REPULSION SIGNALING BY INHIBITING INTEGRIN ADHESION | Genes involved in SEMA3A-Plexin repulsion signaling by inhibiting Integrin adhesion |
| 0.2 | 3.4 | REACTOME METABOLISM OF PORPHYRINS | Genes involved in Metabolism of porphyrins |
| 0.2 | 5.8 | REACTOME P75 NTR RECEPTOR MEDIATED SIGNALLING | Genes involved in p75 NTR receptor-mediated signalling |
| 0.2 | 2.6 | REACTOME PEROXISOMAL LIPID METABOLISM | Genes involved in Peroxisomal lipid metabolism |
| 0.2 | 2.2 | REACTOME RESOLUTION OF AP SITES VIA THE MULTIPLE NUCLEOTIDE PATCH REPLACEMENT PATHWAY | Genes involved in Resolution of AP sites via the multiple-nucleotide patch replacement pathway |
| 0.2 | 1.1 | REACTOME PEPTIDE HORMONE BIOSYNTHESIS | Genes involved in Peptide hormone biosynthesis |
| 0.2 | 5.8 | REACTOME AMYLOIDS | Genes involved in Amyloids |
| 0.2 | 1.7 | REACTOME GLYCOLYSIS | Genes involved in Glycolysis |
| 0.1 | 3.4 | REACTOME DEADENYLATION OF MRNA | Genes involved in Deadenylation of mRNA |
| 0.1 | 1.5 | REACTOME RNA POL I TRANSCRIPTION TERMINATION | Genes involved in RNA Polymerase I Transcription Termination |
| 0.1 | 1.0 | REACTOME RECRUITMENT OF NUMA TO MITOTIC CENTROSOMES | Genes involved in Recruitment of NuMA to mitotic centrosomes |
| 0.1 | 2.5 | REACTOME SYNTHESIS OF PIPS AT THE PLASMA MEMBRANE | Genes involved in Synthesis of PIPs at the plasma membrane |
| 0.1 | 1.4 | REACTOME MRNA DECAY BY 3 TO 5 EXORIBONUCLEASE | Genes involved in mRNA Decay by 3' to 5' Exoribonuclease |
| 0.1 | 2.5 | REACTOME FATTY ACYL COA BIOSYNTHESIS | Genes involved in Fatty Acyl-CoA Biosynthesis |
| 0.1 | 0.6 | REACTOME REGULATION OF KIT SIGNALING | Genes involved in Regulation of KIT signaling |
| 0.1 | 1.5 | REACTOME DEADENYLATION DEPENDENT MRNA DECAY | Genes involved in Deadenylation-dependent mRNA decay |
| 0.1 | 22.5 | REACTOME ANTIGEN PROCESSING UBIQUITINATION PROTEASOME DEGRADATION | Genes involved in Antigen processing: Ubiquitination & Proteasome degradation |
| 0.1 | 1.7 | REACTOME G0 AND EARLY G1 | Genes involved in G0 and Early G1 |
| 0.1 | 1.2 | REACTOME FACILITATIVE NA INDEPENDENT GLUCOSE TRANSPORTERS | Genes involved in Facilitative Na+-independent glucose transporters |
| 0.1 | 0.7 | REACTOME PREFOLDIN MEDIATED TRANSFER OF SUBSTRATE TO CCT TRIC | Genes involved in Prefoldin mediated transfer of substrate to CCT/TriC |
| 0.1 | 0.6 | REACTOME REGULATORY RNA PATHWAYS | Genes involved in Regulatory RNA pathways |
| 0.1 | 1.9 | REACTOME BIOSYNTHESIS OF THE N GLYCAN PRECURSOR DOLICHOL LIPID LINKED OLIGOSACCHARIDE LLO AND TRANSFER TO A NASCENT PROTEIN | Genes involved in Biosynthesis of the N-glycan precursor (dolichol lipid-linked oligosaccharide, LLO) and transfer to a nascent protein |
| 0.1 | 1.3 | REACTOME SIGNALING BY ROBO RECEPTOR | Genes involved in Signaling by Robo receptor |
| 0.1 | 2.2 | REACTOME SIGNALING BY ILS | Genes involved in Signaling by Interleukins |
| 0.0 | 2.4 | REACTOME VOLTAGE GATED POTASSIUM CHANNELS | Genes involved in Voltage gated Potassium channels |
| 0.0 | 0.5 | REACTOME NONSENSE MEDIATED DECAY ENHANCED BY THE EXON JUNCTION COMPLEX | Genes involved in Nonsense Mediated Decay Enhanced by the Exon Junction Complex |
| 0.0 | 0.4 | REACTOME TRAFFICKING AND PROCESSING OF ENDOSOMAL TLR | Genes involved in Trafficking and processing of endosomal TLR |
| 0.0 | 3.1 | REACTOME MRNA SPLICING | Genes involved in mRNA Splicing |
| 0.0 | 0.4 | REACTOME MEIOTIC RECOMBINATION | Genes involved in Meiotic Recombination |
| 0.0 | 0.1 | REACTOME HORMONE LIGAND BINDING RECEPTORS | Genes involved in Hormone ligand-binding receptors |