Project
GSE53960: rat RNA-Seq transcriptomic Bodymap
Navigation
Downloads
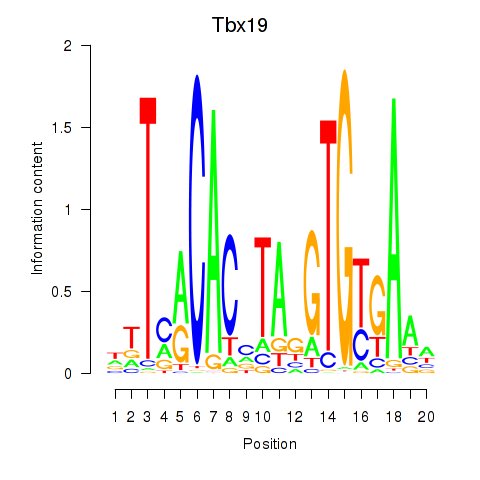
Results for Tbx19
Z-value: 0.94
Motif logo
Transcription factors associated with Tbx19
| Gene Symbol | Gene ID | Gene Info |
|---|---|---|
|
Tbx19
|
ENSRNOG00000002979 | T-box 19 |
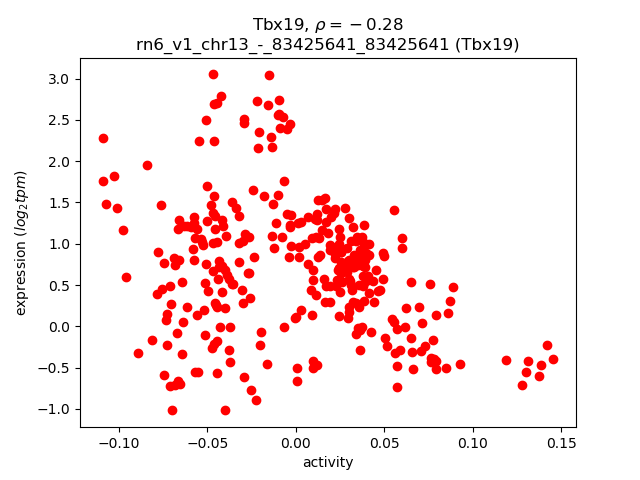
Activity-expression correlation:
| Gene | Promoter | Pearson corr. coef. | P-value | Plot |
|---|---|---|---|---|
| Tbx19 | rn6_v1_chr13_-_83425641_83425641 | -0.28 | 3.5e-07 | Click! |
Activity profile of Tbx19 motif
Sorted Z-values of Tbx19 motif
| Promoter | Log-likelihood | Transcript | Gene | Gene Info |
|---|---|---|---|---|
| chr4_-_108717309 | 53.12 |
ENSRNOT00000085062
|
AABR07061178.1
|
|
| chr16_+_68633720 | 33.05 |
ENSRNOT00000081838
|
LOC100911229
|
sperm motility kinase-like |
| chr2_-_21437193 | 21.76 |
ENSRNOT00000084002
|
Ckmt2
|
creatine kinase, mitochondrial 2 |
| chr2_-_19808937 | 20.05 |
ENSRNOT00000044237
|
Atp6ap1l
|
ATPase H+ transporting accessory protein 1 like |
| chr1_+_105349069 | 19.82 |
ENSRNOT00000056030
|
Nell1
|
neural EGFL like 1 |
| chr9_-_65879521 | 19.57 |
ENSRNOT00000017517
|
Als2cr11
|
amyotrophic lateral sclerosis 2 chromosome region, candidate 11 |
| chr7_+_27620458 | 19.29 |
ENSRNOT00000059532
|
RGD1560034
|
similar to FLJ25323 protein |
| chr19_-_56633633 | 19.10 |
ENSRNOT00000023911
|
Ccsap
|
centriole, cilia and spindle-associated protein |
| chr6_+_48452369 | 18.22 |
ENSRNOT00000044310
|
Myt1l
|
myelin transcription factor 1-like |
| chr19_+_49016891 | 18.01 |
ENSRNOT00000016713
|
Dynlrb2
|
dynein light chain roadblock-type 2 |
| chr18_-_786674 | 17.99 |
ENSRNOT00000021955
|
Cetn1
|
centrin 1 |
| chr3_-_176644951 | 17.15 |
ENSRNOT00000049961
|
Kcnq2
|
potassium voltage-gated channel subfamily Q member 2 |
| chr8_+_29453643 | 16.33 |
ENSRNOT00000090643
|
Opcml
|
opioid binding protein/cell adhesion molecule-like |
| chr2_+_207262934 | 15.88 |
ENSRNOT00000016833
|
Ppm1j
|
protein phosphatase, Mg2+/Mn2+ dependent, 1J |
| chr1_-_81881549 | 15.86 |
ENSRNOT00000027497
|
Atp1a3
|
ATPase Na+/K+ transporting subunit alpha 3 |
| chr4_+_21317695 | 15.77 |
ENSRNOT00000007572
|
Grm3
|
glutamate metabotropic receptor 3 |
| chr1_-_195096694 | 15.54 |
ENSRNOT00000088874
|
Snurf
|
SNRPN upstream reading frame |
| chr3_-_44086006 | 15.53 |
ENSRNOT00000034449
ENSRNOT00000082604 |
Ermn
|
ermin |
| chr10_-_107539658 | 15.24 |
ENSRNOT00000089346
|
Rbfox3
|
RNA binding protein, fox-1 homolog 3 |
| chr16_-_54628458 | 15.18 |
ENSRNOT00000042587
|
Adam24
|
ADAM metallopeptidase domain 24 |
| chr7_-_82687130 | 15.07 |
ENSRNOT00000006791
|
Tmem74
|
transmembrane protein 74 |
| chr5_+_8459660 | 14.83 |
ENSRNOT00000007491
|
Cpa6
|
carboxypeptidase A6 |
| chrX_+_118197217 | 14.16 |
ENSRNOT00000090922
|
Htr2c
|
5-hydroxytryptamine receptor 2C |
| chr9_-_46401911 | 13.75 |
ENSRNOT00000046557
|
Creg2
|
cellular repressor of E1A-stimulated genes 2 |
| chr16_+_34795971 | 13.33 |
ENSRNOT00000043510
|
LOC100912321
|
myeloid-associated differentiation marker-like |
| chr3_+_143151739 | 13.27 |
ENSRNOT00000006850
|
Cst13
|
cystatin 13 |
| chr1_-_260341723 | 13.23 |
ENSRNOT00000030656
|
Opalin
|
oligodendrocytic myelin paranodal and inner loop protein |
| chr10_+_110631494 | 13.20 |
ENSRNOT00000054915
|
Fn3k
|
fructosamine 3 kinase |
| chr7_-_107223047 | 12.45 |
ENSRNOT00000007250
ENSRNOT00000084875 |
Lrrc6
|
leucine rich repeat containing 6 |
| chr1_-_91526570 | 12.04 |
ENSRNOT00000056583
|
Wdr88
|
WD repeat domain 88 |
| chr1_-_227457629 | 11.55 |
ENSRNOT00000035910
ENSRNOT00000073770 |
Ms4a5
|
membrane spanning 4-domains A5 |
| chr13_-_47154292 | 11.55 |
ENSRNOT00000005284
|
Cd55
|
CD55 molecule, decay accelerating factor for complement |
| chr2_-_123407496 | 11.29 |
ENSRNOT00000080207
|
Trpc3
|
transient receptor potential cation channel, subfamily C, member 3 |
| chr10_-_107539465 | 11.24 |
ENSRNOT00000004524
|
Rbfox3
|
RNA binding protein, fox-1 homolog 3 |
| chr20_+_20259254 | 11.11 |
ENSRNOT00000085985
ENSRNOT00000077620 ENSRNOT00000090273 |
Ank3
|
ankyrin 3 |
| chr10_+_11240138 | 10.91 |
ENSRNOT00000048687
|
Srl
|
sarcalumenin |
| chrX_+_125314613 | 10.83 |
ENSRNOT00000029193
|
LOC691215
|
hypothetical protein LOC691215 |
| chr16_-_20939545 | 10.79 |
ENSRNOT00000027457
|
Sugp2
|
SURP and G patch domain containing 2 |
| chr6_+_29518416 | 10.39 |
ENSRNOT00000078660
|
AABR07063346.1
|
|
| chr3_+_86621205 | 10.34 |
ENSRNOT00000044595
|
Lrrc4c
|
leucine rich repeat containing 4C |
| chr10_+_72486152 | 10.29 |
ENSRNOT00000004193
|
RGD1310166
|
similar to Chromodomain-helicase-DNA-binding protein 1 (CHD-1) |
| chr16_+_81204766 | 9.78 |
ENSRNOT00000042465
|
Tmem255b
|
transmembrane protein 255B |
| chr9_+_6966908 | 9.71 |
ENSRNOT00000072796
|
St6gal2
|
ST6 beta-galactoside alpha-2,6-sialyltransferase 2 |
| chr14_-_28536260 | 9.26 |
ENSRNOT00000059942
|
Adgrl3
|
adhesion G protein-coupled receptor L3 |
| chrX_-_121066855 | 9.24 |
ENSRNOT00000044165
|
Tesl
|
testis derived transcript-like |
| chr16_-_12662336 | 9.00 |
ENSRNOT00000080161
|
RGD1559508
|
similar to hypothetical protein 4930474N05 |
| chr2_-_250805445 | 8.89 |
ENSRNOT00000055362
|
Clca4l
|
chloride channel calcium activated 4-like |
| chr3_+_122928964 | 8.83 |
ENSRNOT00000074724
|
LOC100365450
|
rCG26795-like |
| chr5_-_135472116 | 8.79 |
ENSRNOT00000022170
|
Nasp
|
nuclear autoantigenic sperm protein |
| chr1_+_42170281 | 8.73 |
ENSRNOT00000092879
|
Vip
|
vasoactive intestinal peptide |
| chr13_-_6712734 | 8.66 |
ENSRNOT00000061683
|
AABR07019903.1
|
|
| chr9_+_8399632 | 8.53 |
ENSRNOT00000092165
|
LOC100360856
|
hypothetical protein LOC100360856 |
| chr10_+_10555337 | 8.32 |
ENSRNOT00000032495
|
RGD1565166
|
similar to MGC45438 protein |
| chrX_+_110342718 | 8.24 |
ENSRNOT00000043861
|
AABR07040792.1
|
|
| chr3_+_113818872 | 8.20 |
ENSRNOT00000044158
|
Casc4
|
cancer susceptibility candidate 4 |
| chr3_+_176985900 | 8.00 |
ENSRNOT00000020210
|
Abhd16b
|
abhydrolase domain containing 16B |
| chr1_-_67284864 | 7.96 |
ENSRNOT00000082908
|
LOC691661
|
similar to zinc finger and SCAN domain containing 4 |
| chr1_+_222907159 | 7.93 |
ENSRNOT00000032123
|
Hrasls5
|
HRAS-like suppressor family, member 5 |
| chrX_+_97074710 | 7.88 |
ENSRNOT00000044379
|
RGD1561230
|
similar to RIKEN cDNA 4921511C20 gene |
| chr1_+_67025240 | 7.69 |
ENSRNOT00000051024
|
Vom1r47
|
vomeronasal 1 receptor 47 |
| chr9_+_42871950 | 7.67 |
ENSRNOT00000089673
|
Arid5a
|
AT-rich interaction domain 5A |
| chr20_-_48503898 | 7.57 |
ENSRNOT00000073091
|
Wasf1
|
WAS protein family, member 1 |
| chr16_+_9074033 | 7.54 |
ENSRNOT00000027193
|
Fam170b
|
family with sequence similarity 170, member B |
| chr1_+_42170583 | 7.53 |
ENSRNOT00000093104
|
Vip
|
vasoactive intestinal peptide |
| chr1_-_81412251 | 7.43 |
ENSRNOT00000026946
|
Pinlyp
|
phospholipase A2 inhibitor and LY6/PLAUR domain containing |
| chr1_-_67065797 | 7.28 |
ENSRNOT00000048152
|
Vom1r46
|
vomeronasal 1 receptor 46 |
| chrX_-_17708388 | 7.26 |
ENSRNOT00000048887
|
LOC302576
|
similar to mgclh |
| chr9_-_115382445 | 7.24 |
ENSRNOT00000091316
|
Ptprm
|
protein tyrosine phosphatase, receptor type, M |
| chr2_-_212852870 | 7.20 |
ENSRNOT00000066218
|
Ntng1
|
netrin G1 |
| chr5_+_154077944 | 7.05 |
ENSRNOT00000031512
|
Il22ra1
|
interleukin 22 receptor subunit alpha 1 |
| chr2_+_41157823 | 6.97 |
ENSRNOT00000066384
|
Pde4d
|
phosphodiesterase 4D |
| chr2_+_116970344 | 6.93 |
ENSRNOT00000039603
|
Egfem1
|
EGF-like and EMI domain containing 1 |
| chr1_-_7322424 | 6.88 |
ENSRNOT00000066725
ENSRNOT00000081112 |
Zc2hc1b
|
zinc finger, C2HC-type containing 1B |
| chr8_-_55491152 | 6.74 |
ENSRNOT00000014965
|
LOC100359479
|
rCG58364-like |
| chr1_-_260460791 | 6.67 |
ENSRNOT00000018179
|
Tll2
|
tolloid-like 2 |
| chr6_+_28382962 | 6.63 |
ENSRNOT00000016976
|
Pomc
|
proopiomelanocortin |
| chr8_-_48619592 | 6.61 |
ENSRNOT00000012534
|
Abcg4
|
ATP binding cassette subfamily G member 4 |
| chr8_-_85712647 | 6.52 |
ENSRNOT00000000215
|
Dppa5
|
developmental pluripotency associated 5 |
| chr17_-_66667853 | 6.50 |
ENSRNOT00000058749
|
A26c2
|
ANKRD26-like family C, member 2 |
| chr10_+_62981297 | 6.46 |
ENSRNOT00000031618
|
Efcab5
|
EF-hand calcium binding domain 5 |
| chr13_+_77602249 | 6.44 |
ENSRNOT00000003407
ENSRNOT00000076589 |
Tnr
|
tenascin R |
| chr13_+_50873605 | 6.40 |
ENSRNOT00000004382
|
Fmod
|
fibromodulin |
| chr17_+_5342829 | 6.38 |
ENSRNOT00000079938
|
Spata31d3
|
SPATA31 subfamily D, member 3 |
| chr1_+_63734135 | 6.35 |
ENSRNOT00000084439
|
Nilr1
|
neutrophil immunoglobulin-like receptor-1 |
| chr13_-_85695421 | 6.14 |
ENSRNOT00000005768
|
Lrrc52
|
leucine rich repeat containing 52 |
| chr1_-_82918444 | 6.08 |
ENSRNOT00000072555
|
LOC102553892
|
CD177 antigen-like |
| chr2_+_198231291 | 6.04 |
ENSRNOT00000078288
ENSRNOT00000046739 |
Otud7b
|
OTU deubiquitinase 7B |
| chr3_+_104899682 | 5.94 |
ENSRNOT00000041910
|
Fmn1
|
formin 1 |
| chr7_+_60087429 | 5.80 |
ENSRNOT00000073117
|
Lrrc10
|
leucine-rich repeat-containing 10 |
| chr15_-_2648294 | 5.78 |
ENSRNOT00000018462
|
Vdac2
|
voltage-dependent anion channel 2 |
| chr9_+_66058047 | 5.76 |
ENSRNOT00000071819
|
Cdk15
|
cyclin-dependent kinase 15 |
| chr1_-_260992291 | 5.73 |
ENSRNOT00000035415
ENSRNOT00000034758 |
Slit1
|
slit guidance ligand 1 |
| chr1_-_167165265 | 5.62 |
ENSRNOT00000027321
|
Rnf121
|
ring finger protein 121 |
| chr14_-_77321783 | 5.45 |
ENSRNOT00000007154
|
Lyar
|
Ly1 antibody reactive |
| chr14_-_86146744 | 5.45 |
ENSRNOT00000019335
|
Myl7
|
myosin light chain 7 |
| chr4_+_9882904 | 5.31 |
ENSRNOT00000016909
|
Dnajc2
|
DnaJ heat shock protein family (Hsp40) member C2 |
| chrX_-_106085878 | 5.27 |
ENSRNOT00000049735
|
Prame
|
preferentially expressed antigen in melanoma |
| chr11_-_1437732 | 5.24 |
ENSRNOT00000037345
|
Csnka2ip
|
casein kinase 2, alpha prime interacting protein |
| chr7_-_122926336 | 4.93 |
ENSRNOT00000000205
|
Chadl
|
chondroadherin-like |
| chr14_-_77321977 | 4.88 |
ENSRNOT00000084093
|
Lyar
|
Ly1 antibody reactive |
| chr1_-_82902975 | 4.86 |
ENSRNOT00000087563
|
LOC102553892
|
CD177 antigen-like |
| chr1_+_89215266 | 4.69 |
ENSRNOT00000093612
ENSRNOT00000084799 |
Dmkn
|
dermokine |
| chrX_-_157848842 | 4.65 |
ENSRNOT00000035398
|
Fam122c
|
family with sequence similarity 122C |
| chr10_-_34990943 | 4.53 |
ENSRNOT00000075555
|
Rmnd5b
|
required for meiotic nuclear division 5 homolog B |
| chr2_-_183128932 | 4.44 |
ENSRNOT00000031179
|
Mnd1
|
meiotic nuclear divisions 1 |
| chrX_+_90588124 | 4.44 |
ENSRNOT00000045685
|
Tgif2lx2
|
TGFB-induced factor homeobox 2-like, X-linked 2 |
| chr17_-_71897972 | 4.39 |
ENSRNOT00000065942
|
Sfmbt2
|
Scm-like with four mbt domains 2 |
| chr18_+_30869628 | 4.33 |
ENSRNOT00000060470
|
Pcdhgb4
|
protocadherin gamma subfamily B, 4 |
| chr4_+_86275717 | 4.25 |
ENSRNOT00000016414
|
Ppp1r17
|
protein phosphatase 1, regulatory subunit 17 |
| chr16_-_81434363 | 4.24 |
ENSRNOT00000080963
|
Rasa3
|
RAS p21 protein activator 3 |
| chr7_+_27248115 | 4.23 |
ENSRNOT00000031946
ENSRNOT00000059545 |
LOC362863
|
first gene upstream of Nt5dc3 |
| chr13_+_74456487 | 4.22 |
ENSRNOT00000065801
|
Angptl1
|
angiopoietin-like 1 |
| chr17_+_60059949 | 4.16 |
ENSRNOT00000025458
|
Mpp7
|
membrane palmitoylated protein 7 |
| chr7_+_126096793 | 4.10 |
ENSRNOT00000047234
ENSRNOT00000088042 |
Fbln1
|
fibulin 1 |
| chr2_+_127770676 | 4.01 |
ENSRNOT00000068405
|
Abhd18
|
abhydrolase domain containing 18 |
| chr9_-_30321323 | 3.85 |
ENSRNOT00000018234
|
Fam135a
|
family with sequence similarity 135, member A |
| chr19_+_37229120 | 3.81 |
ENSRNOT00000076335
|
Hsf4
|
heat shock transcription factor 4 |
| chr1_+_63964155 | 3.74 |
ENSRNOT00000078512
|
AABR07002001.1
|
|
| chr17_+_18059382 | 3.72 |
ENSRNOT00000031656
|
Nhlrc1
|
NHL repeat containing E3 ubiquitin protein ligase 1 |
| chr18_-_74198369 | 3.71 |
ENSRNOT00000073597
|
LOC108348136
|
HAUS augmin-like complex subunit 1 |
| chr15_-_46593653 | 3.60 |
ENSRNOT00000015021
|
Blk
|
BLK proto-oncogene, Src family tyrosine kinase |
| chr7_-_16068823 | 3.58 |
ENSRNOT00000073630
|
Olr922
|
olfactory receptor 922 |
| chr10_+_63677396 | 3.49 |
ENSRNOT00000005100
|
Slc43a2
|
solute carrier family 43 member 2 |
| chr3_+_133232432 | 3.48 |
ENSRNOT00000006412
|
Ndufaf5
|
NADH:ubiquinone oxidoreductase complex assembly factor 5 |
| chr6_-_140587251 | 3.40 |
ENSRNOT00000090704
|
AABR07065772.4
|
|
| chrX_+_106360393 | 3.33 |
ENSRNOT00000004260
|
Gprasp2
|
G protein-coupled receptor associated sorting protein 2 |
| chr10_+_89166890 | 3.33 |
ENSRNOT00000088331
|
Ramp2
|
receptor activity modifying protein 2 |
| chr10_+_89167146 | 3.32 |
ENSRNOT00000043953
|
Ramp2
|
receptor activity modifying protein 2 |
| chr10_+_63776378 | 3.29 |
ENSRNOT00000084496
|
Inpp5k
|
inositol polyphosphate-5-phosphatase K |
| chr15_+_51034620 | 3.25 |
ENSRNOT00000032826
|
Nkx2-6
|
NK2 homeobox 6 |
| chr8_-_111101416 | 3.23 |
ENSRNOT00000084413
|
Cep63
|
centrosomal protein 63 |
| chr7_-_15301382 | 3.22 |
ENSRNOT00000081512
|
Zfp763
|
zinc finger protein 763 |
| chr9_-_52401660 | 3.21 |
ENSRNOT00000049387
|
Vom1r50
|
vomeronasal 1 receptor 50 |
| chr16_-_74408030 | 3.19 |
ENSRNOT00000026418
|
Slc20a2
|
solute carrier family 20 member 2 |
| chr3_+_77414999 | 3.15 |
ENSRNOT00000047910
|
Olr659
|
olfactory receptor 659 |
| chr4_-_164691405 | 3.14 |
ENSRNOT00000090979
ENSRNOT00000091932 ENSRNOT00000078219 |
Ly49s4
Ly49i2
|
Ly49 stimulatory receptor 4 Ly49 inhibitory receptor 2 |
| chr20_+_3351303 | 3.08 |
ENSRNOT00000080419
ENSRNOT00000001065 ENSRNOT00000086503 |
Atat1
|
alpha tubulin acetyltransferase 1 |
| chr16_+_20939655 | 3.00 |
ENSRNOT00000027550
|
Armc6
|
armadillo repeat containing 6 |
| chrX_+_156552528 | 2.96 |
ENSRNOT00000086429
|
Tex28
|
testis expressed 28 |
| chr1_+_69853553 | 2.86 |
ENSRNOT00000042086
|
Zfp954
|
zinc finger protein 954 |
| chr7_-_114380613 | 2.85 |
ENSRNOT00000011898
|
Ago2
|
argonaute 2, RISC catalytic component |
| chrX_+_128882366 | 2.80 |
ENSRNOT00000091479
|
Tex13c2
|
TEX13 family member C2 |
| chr16_+_73584521 | 2.78 |
ENSRNOT00000024301
|
Gins4
|
GINS complex subunit 4 |
| chr10_+_67427066 | 2.77 |
ENSRNOT00000035642
|
Atad5
|
ATPase family, AAA domain containing 5 |
| chr4_+_66090681 | 2.76 |
ENSRNOT00000078066
|
Ttc26
|
tetratricopeptide repeat domain 26 |
| chr12_+_52630551 | 2.64 |
ENSRNOT00000072562
|
AABR07036648.1
|
|
| chrX_+_83926513 | 2.63 |
ENSRNOT00000035274
|
RGD1561958
|
similar to RIKEN cDNA 2010106E10 |
| chr12_+_40895515 | 2.59 |
ENSRNOT00000046323
|
Ptpn11
|
protein tyrosine phosphatase, non-receptor type 11 |
| chr18_+_3565166 | 2.55 |
ENSRNOT00000039377
|
Riok3
|
RIO kinase 3 |
| chr6_+_144071914 | 2.42 |
ENSRNOT00000056743
|
LOC102547216
|
uncharacterized LOC102547216 |
| chr11_-_23063414 | 2.42 |
ENSRNOT00000043396
|
LOC103690036
|
olfactory receptor 6C6-like |
| chr7_+_5324469 | 2.41 |
ENSRNOT00000071164
|
Olr901
|
olfactory receptor 901 |
| chr6_+_137924568 | 2.40 |
ENSRNOT00000046456
|
Mta1
|
metastasis associated 1 |
| chr11_-_74793673 | 2.39 |
ENSRNOT00000002338
ENSRNOT00000002343 |
Opa1
|
OPA1, mitochondrial dynamin like GTPase |
| chr16_+_53998560 | 2.38 |
ENSRNOT00000077188
ENSRNOT00000013463 |
Asah1
|
N-acylsphingosine amidohydrolase 1 |
| chr17_+_8558827 | 2.29 |
ENSRNOT00000016187
|
Il9
|
interleukin 9 |
| chr14_+_48726045 | 2.25 |
ENSRNOT00000086646
|
Arap2
|
ArfGAP with RhoGAP domain, ankyrin repeat and PH domain 2 |
| chr9_-_117467198 | 2.18 |
ENSRNOT00000048323
|
RGD1563667
|
similar to TDPOZ3 |
| chr14_+_62309299 | 2.16 |
ENSRNOT00000048309
|
Vom1r26
|
vomeronasal 1 receptor 26 |
| chr4_-_55740627 | 2.13 |
ENSRNOT00000010658
|
Pax4
|
paired box 4 |
| chr2_+_4858907 | 2.12 |
ENSRNOT00000067201
ENSRNOT00000093305 |
Olr204
|
olfactory receptor 204 |
| chrX_-_35431164 | 2.04 |
ENSRNOT00000004968
|
Scml2
|
sex comb on midleg-like 2 (Drosophila) |
| chr1_-_63457134 | 1.99 |
ENSRNOT00000083436
|
AABR07071874.1
|
|
| chr4_+_2055615 | 1.98 |
ENSRNOT00000007646
|
Rnf32
|
ring finger protein 32 |
| chr4_-_119399130 | 1.97 |
ENSRNOT00000042796
|
Vom1r101
|
vomeronasal 1 receptor 101 |
| chr15_+_32060750 | 1.95 |
ENSRNOT00000084376
|
AABR07017870.2
|
|
| chr5_-_28131133 | 1.91 |
ENSRNOT00000067331
|
Slc26a7
|
solute carrier family 26 member 7 |
| chr14_+_85142279 | 1.86 |
ENSRNOT00000011281
|
Thoc5
|
THO complex 5 |
| chr20_+_6356423 | 1.84 |
ENSRNOT00000000628
|
Cdkn1a
|
cyclin-dependent kinase inhibitor 1A |
| chr11_-_23058456 | 1.82 |
ENSRNOT00000073285
|
LOC103693533
|
olfactory receptor 6C6-like |
| chr19_-_43391828 | 1.81 |
ENSRNOT00000023927
|
Cog4
|
component of oligomeric golgi complex 4 |
| chr1_-_227047290 | 1.81 |
ENSRNOT00000037226
|
Ms4a15
|
membrane spanning 4-domains A15 |
| chr8_+_20728817 | 1.77 |
ENSRNOT00000050101
|
Olr1179
|
olfactory receptor 1179 |
| chr1_+_170242846 | 1.76 |
ENSRNOT00000023751
|
Cnga4
|
cyclic nucleotide gated channel alpha 4 |
| chr1_+_71844368 | 1.75 |
ENSRNOT00000044754
|
Vom1r32
|
vomeronasal 1 receptor 32 |
| chr3_-_105214989 | 1.74 |
ENSRNOT00000037895
|
Grem1
|
gremlin 1, DAN family BMP antagonist |
| chr3_+_73010786 | 1.69 |
ENSRNOT00000051010
|
Olr447
|
olfactory receptor 447 |
| chr1_+_73837944 | 1.65 |
ENSRNOT00000036413
|
Lair1
|
leukocyte-associated immunoglobulin-like receptor 1 |
| chr1_-_103631235 | 1.63 |
ENSRNOT00000072393
|
Mrgprb13
|
MAS-related GPR, member B13 |
| chr1_+_248402980 | 1.62 |
ENSRNOT00000043517
|
Chchd4
|
coiled-coil-helix-coiled-coil-helix domain containing 4 |
| chr2_+_88217188 | 1.59 |
ENSRNOT00000014267
|
Car1
|
carbonic anhydrase I |
| chr5_+_156615886 | 1.58 |
ENSRNOT00000076439
|
Sh2d5
|
SH2 domain containing 5 |
| chr17_+_76410585 | 1.55 |
ENSRNOT00000024016
|
Cdc123
|
cell division cycle 123 |
| chr4_-_32087600 | 1.54 |
ENSRNOT00000013841
|
Sem1
|
SEM1, 26S proteasome complex subunit |
| chr3_+_137154086 | 1.53 |
ENSRNOT00000034252
|
Otor
|
otoraplin |
| chr11_-_33760100 | 1.50 |
ENSRNOT00000065810
|
RGD1562683
|
RGD1562683 |
| chr8_-_17776361 | 1.50 |
ENSRNOT00000041855
|
Olr1115
|
olfactory receptor 1115 |
| chr1_-_88657845 | 1.46 |
ENSRNOT00000074211
|
LOC100912380
|
calpain small subunit 1-like |
| chr10_+_1214731 | 1.45 |
ENSRNOT00000080445
|
AABR07028970.2
|
|
| chr1_+_63842277 | 1.42 |
ENSRNOT00000087957
ENSRNOT00000080820 |
Lilrb3a
|
leukocyte immunoglobulin-like receptor, subfamily B (with TM and ITIM domains), member 3A |
| chr11_+_34865532 | 1.42 |
ENSRNOT00000050342
|
Dyrk1a
|
dual specificity tyrosine phosphorylation regulated kinase 1A |
| chr15_-_60743064 | 1.35 |
ENSRNOT00000013333
|
Akap11
|
A-kinase anchoring protein 11 |
| chr2_+_194557986 | 1.34 |
ENSRNOT00000070843
|
LOC100911679
|
TD and POZ domain-containing protein 2-like |
| chr15_-_100348760 | 1.34 |
ENSRNOT00000085607
|
AABR07019341.1
|
|
| chr2_+_192463203 | 1.30 |
ENSRNOT00000081253
|
LOC102552651
|
small proline-rich protein 2H-like |
| chr10_-_103873246 | 1.28 |
ENSRNOT00000039387
|
Ush1g
|
Usher syndrome 1G |
| chr1_+_65292386 | 1.25 |
ENSRNOT00000029893
|
AABR07002044.1
|
|
| chr12_+_2213705 | 1.23 |
ENSRNOT00000031653
|
Mcemp1
|
mast cell-expressed membrane protein 1 |
| chr8_+_61615650 | 1.22 |
ENSRNOT00000007261
|
Snupn
|
snurportin 1 |
| chr14_+_1318157 | 1.21 |
ENSRNOT00000061889
|
Vom2r67
|
vomeronasal 2 receptor, 67 |
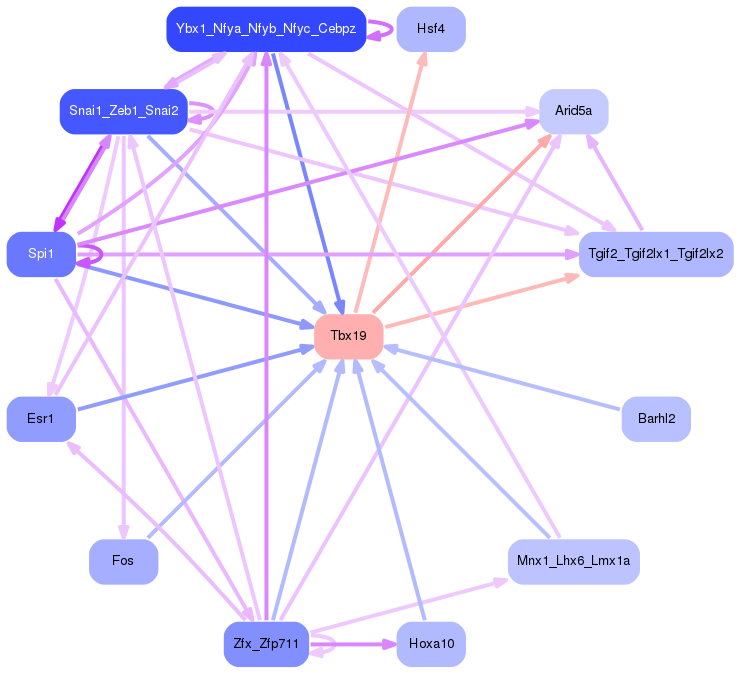
Network of associatons between targets according to the STRING database.

First level regulatory network of Tbx19
Gene Ontology Analysis
Gene overrepresentation in biological process category:
| Log-likelihood per target | Total log-likelihood | Term | Description |
|---|---|---|---|
| 4.7 | 14.2 | GO:0007208 | phospholipase C-activating serotonin receptor signaling pathway(GO:0007208) phospholipase D-activating G-protein coupled receptor signaling pathway(GO:0031583) |
| 3.8 | 15.2 | GO:0060468 | prevention of polyspermy(GO:0060468) |
| 2.9 | 11.5 | GO:0030450 | regulation of complement activation, classical pathway(GO:0030450) |
| 2.8 | 11.3 | GO:1903244 | positive regulation of cardiac muscle adaptation(GO:0010615) positive regulation of cardiac muscle hypertrophy in response to stress(GO:1903244) |
| 2.8 | 11.1 | GO:0010650 | positive regulation of cell communication by electrical coupling(GO:0010650) positive regulation of membrane depolarization during cardiac muscle cell action potential(GO:1900827) |
| 2.7 | 10.9 | GO:0014873 | response to muscle activity involved in regulation of muscle adaptation(GO:0014873) |
| 2.3 | 7.0 | GO:0086024 | adrenergic receptor signaling pathway involved in positive regulation of heart rate(GO:0086024) |
| 2.0 | 6.0 | GO:0071947 | protein deubiquitination involved in ubiquitin-dependent protein catabolic process(GO:0071947) |
| 1.8 | 16.3 | GO:0070459 | prolactin secretion(GO:0070459) |
| 1.7 | 21.6 | GO:0033689 | negative regulation of osteoblast proliferation(GO:0033689) |
| 1.7 | 33.1 | GO:0035404 | histone-serine phosphorylation(GO:0035404) |
| 1.6 | 15.9 | GO:0036376 | sodium ion export from cell(GO:0036376) |
| 1.5 | 5.9 | GO:0072092 | ureteric bud invasion(GO:0072092) |
| 1.4 | 15.8 | GO:0007196 | adenylate cyclase-inhibiting G-protein coupled glutamate receptor signaling pathway(GO:0007196) |
| 1.4 | 5.7 | GO:0021834 | chemorepulsion involved in embryonic olfactory bulb interneuron precursor migration(GO:0021834) |
| 1.4 | 12.5 | GO:0060287 | epithelial cilium movement involved in determination of left/right asymmetry(GO:0060287) |
| 1.4 | 4.1 | GO:2001201 | regulation of transforming growth factor-beta secretion(GO:2001201) |
| 1.2 | 19.1 | GO:1901673 | regulation of mitotic spindle assembly(GO:1901673) |
| 1.2 | 4.7 | GO:1903575 | cornified envelope assembly(GO:1903575) |
| 1.1 | 7.6 | GO:2000601 | positive regulation of Arp2/3 complex-mediated actin nucleation(GO:2000601) |
| 1.1 | 6.4 | GO:0048686 | regulation of sprouting of injured axon(GO:0048686) regulation of axon extension involved in regeneration(GO:0048690) |
| 1.0 | 4.2 | GO:0071896 | protein localization to adherens junction(GO:0071896) |
| 1.0 | 3.1 | GO:0071929 | alpha-tubulin acetylation(GO:0071929) |
| 0.9 | 6.6 | GO:2000852 | regulation of corticosterone secretion(GO:2000852) |
| 0.9 | 17.2 | GO:0060081 | membrane hyperpolarization(GO:0060081) |
| 0.9 | 2.6 | GO:2000847 | negative regulation of corticosteroid hormone secretion(GO:2000847) negative regulation of glucocorticoid secretion(GO:2000850) |
| 0.8 | 3.3 | GO:0045869 | negative regulation of single stranded viral RNA replication via double stranded DNA intermediate(GO:0045869) |
| 0.8 | 2.4 | GO:1902499 | positive regulation of protein autoubiquitination(GO:1902499) |
| 0.7 | 2.9 | GO:0035087 | siRNA loading onto RISC involved in RNA interference(GO:0035087) mRNA cleavage involved in gene silencing by siRNA(GO:0090625) |
| 0.7 | 6.7 | GO:0048631 | regulation of skeletal muscle tissue growth(GO:0048631) |
| 0.7 | 6.7 | GO:0097084 | vascular smooth muscle cell development(GO:0097084) |
| 0.6 | 2.5 | GO:0039534 | negative regulation of MDA-5 signaling pathway(GO:0039534) |
| 0.6 | 20.0 | GO:0015991 | ATP hydrolysis coupled proton transport(GO:0015991) |
| 0.6 | 1.2 | GO:1990164 | histone H2A phosphorylation(GO:1990164) |
| 0.6 | 4.9 | GO:1903054 | negative regulation of extracellular matrix organization(GO:1903054) |
| 0.6 | 5.3 | GO:0048387 | negative regulation of retinoic acid receptor signaling pathway(GO:0048387) |
| 0.6 | 2.9 | GO:0080154 | regulation of fertilization(GO:0080154) |
| 0.6 | 2.8 | GO:0000727 | double-strand break repair via break-induced replication(GO:0000727) |
| 0.5 | 1.6 | GO:0045041 | protein import into mitochondrial intermembrane space(GO:0045041) |
| 0.5 | 27.9 | GO:0000381 | regulation of alternative mRNA splicing, via spliceosome(GO:0000381) |
| 0.5 | 2.0 | GO:0036353 | histone H2A-K119 monoubiquitination(GO:0036353) |
| 0.5 | 9.3 | GO:0031987 | locomotion involved in locomotory behavior(GO:0031987) |
| 0.5 | 8.8 | GO:0043486 | histone exchange(GO:0043486) |
| 0.5 | 3.2 | GO:0098535 | de novo centriole assembly(GO:0098535) |
| 0.4 | 9.7 | GO:0097503 | sialylation(GO:0097503) |
| 0.4 | 24.1 | GO:0034605 | cellular response to heat(GO:0034605) |
| 0.4 | 7.9 | GO:0046337 | phosphatidylethanolamine metabolic process(GO:0046337) |
| 0.3 | 13.2 | GO:0006040 | amino sugar metabolic process(GO:0006040) |
| 0.3 | 1.9 | GO:0045650 | negative regulation of macrophage differentiation(GO:0045650) |
| 0.3 | 1.2 | GO:0051030 | snRNA transport(GO:0051030) |
| 0.3 | 2.4 | GO:0014042 | regulation of mitochondrial fusion(GO:0010635) positive regulation of neuron maturation(GO:0014042) |
| 0.3 | 0.9 | GO:0006649 | phospholipid transfer to membrane(GO:0006649) |
| 0.3 | 7.2 | GO:0031290 | retinal ganglion cell axon guidance(GO:0031290) |
| 0.3 | 0.8 | GO:0042489 | negative regulation of odontogenesis of dentin-containing tooth(GO:0042489) |
| 0.3 | 0.8 | GO:0001539 | cilium or flagellum-dependent cell motility(GO:0001539) cilium-dependent cell motility(GO:0060285) |
| 0.2 | 7.7 | GO:0035066 | positive regulation of histone acetylation(GO:0035066) |
| 0.2 | 2.8 | GO:0048304 | positive regulation of isotype switching to IgG isotypes(GO:0048304) |
| 0.2 | 0.7 | GO:0007468 | regulation of rhodopsin gene expression(GO:0007468) |
| 0.2 | 10.3 | GO:0046426 | negative regulation of JAK-STAT cascade(GO:0046426) negative regulation of STAT cascade(GO:1904893) |
| 0.2 | 2.3 | GO:0032754 | positive regulation of interleukin-5 production(GO:0032754) |
| 0.2 | 6.7 | GO:0048741 | skeletal muscle fiber development(GO:0048741) |
| 0.2 | 3.3 | GO:0055015 | ventricular cardiac muscle cell development(GO:0055015) |
| 0.2 | 3.5 | GO:0097031 | NADH dehydrogenase complex assembly(GO:0010257) mitochondrial respiratory chain complex I assembly(GO:0032981) mitochondrial respiratory chain complex I biogenesis(GO:0097031) |
| 0.2 | 1.2 | GO:0032674 | regulation of interleukin-5 production(GO:0032674) |
| 0.2 | 2.6 | GO:0019236 | response to pheromone(GO:0019236) |
| 0.2 | 0.3 | GO:0051081 | membrane disassembly(GO:0030397) nuclear envelope disassembly(GO:0051081) |
| 0.2 | 2.6 | GO:0043248 | proteasome assembly(GO:0043248) |
| 0.1 | 1.3 | GO:0050957 | equilibrioception(GO:0050957) |
| 0.1 | 6.6 | GO:0033344 | cholesterol efflux(GO:0033344) |
| 0.1 | 5.3 | GO:2000279 | negative regulation of DNA biosynthetic process(GO:2000279) |
| 0.1 | 7.1 | GO:0050829 | defense response to Gram-negative bacterium(GO:0050829) |
| 0.1 | 0.7 | GO:0007097 | nuclear migration(GO:0007097) |
| 0.1 | 1.9 | GO:0019532 | oxalate transport(GO:0019532) |
| 0.1 | 0.6 | GO:1902990 | mitotic telomere maintenance via semi-conservative replication(GO:1902990) |
| 0.1 | 3.8 | GO:0070207 | protein homotrimerization(GO:0070207) |
| 0.1 | 1.8 | GO:0000301 | retrograde transport, vesicle recycling within Golgi(GO:0000301) |
| 0.1 | 4.4 | GO:0007131 | reciprocal meiotic recombination(GO:0007131) reciprocal DNA recombination(GO:0035825) |
| 0.1 | 1.1 | GO:1902083 | negative regulation of peptidyl-cysteine S-nitrosylation(GO:1902083) |
| 0.1 | 8.9 | GO:1902476 | chloride transmembrane transport(GO:1902476) |
| 0.1 | 3.5 | GO:1902475 | L-alpha-amino acid transmembrane transport(GO:1902475) |
| 0.1 | 1.5 | GO:0001502 | cartilage condensation(GO:0001502) |
| 0.1 | 5.8 | GO:2001243 | negative regulation of intrinsic apoptotic signaling pathway(GO:2001243) |
| 0.1 | 5.6 | GO:0030968 | endoplasmic reticulum unfolded protein response(GO:0030968) |
| 0.1 | 0.9 | GO:0097240 | meiotic telomere tethering at nuclear periphery(GO:0044821) meiotic attachment of telomere to nuclear envelope(GO:0070197) chromosome attachment to the nuclear envelope(GO:0097240) |
| 0.1 | 0.6 | GO:0035542 | regulation of SNARE complex assembly(GO:0035542) |
| 0.1 | 12.1 | GO:0007519 | skeletal muscle tissue development(GO:0007519) |
| 0.1 | 15.1 | GO:0016236 | macroautophagy(GO:0016236) |
| 0.1 | 0.5 | GO:0046512 | sphingosine biosynthetic process(GO:0046512) |
| 0.1 | 1.0 | GO:0043968 | histone H2A acetylation(GO:0043968) |
| 0.1 | 18.7 | GO:0007018 | microtubule-based movement(GO:0007018) |
| 0.1 | 10.6 | GO:0008360 | regulation of cell shape(GO:0008360) |
| 0.1 | 3.6 | GO:0038083 | peptidyl-tyrosine autophosphorylation(GO:0038083) |
| 0.1 | 2.3 | GO:0018149 | peptide cross-linking(GO:0018149) |
| 0.1 | 6.7 | GO:0042787 | protein ubiquitination involved in ubiquitin-dependent protein catabolic process(GO:0042787) |
| 0.1 | 3.7 | GO:0051225 | spindle assembly(GO:0051225) |
| 0.1 | 1.3 | GO:0010738 | regulation of protein kinase A signaling(GO:0010738) |
| 0.1 | 0.4 | GO:0016259 | selenocysteine metabolic process(GO:0016259) |
| 0.1 | 3.7 | GO:0031398 | positive regulation of protein ubiquitination(GO:0031398) |
| 0.1 | 18.7 | GO:0006470 | protein dephosphorylation(GO:0006470) |
| 0.1 | 13.3 | GO:0010951 | negative regulation of endopeptidase activity(GO:0010951) |
| 0.0 | 6.4 | GO:0042476 | odontogenesis(GO:0042476) |
| 0.0 | 5.3 | GO:0007156 | homophilic cell adhesion via plasma membrane adhesion molecules(GO:0007156) |
| 0.0 | 0.7 | GO:0060218 | hematopoietic stem cell differentiation(GO:0060218) |
| 0.0 | 0.5 | GO:0006415 | translational termination(GO:0006415) |
| 0.0 | 1.4 | GO:0031016 | pancreas development(GO:0031016) |
| 0.0 | 7.2 | GO:0007409 | axonogenesis(GO:0007409) |
| 0.0 | 4.1 | GO:0071805 | cellular potassium ion transport(GO:0071804) potassium ion transmembrane transport(GO:0071805) |
| 0.0 | 3.2 | GO:0006814 | sodium ion transport(GO:0006814) |
| 0.0 | 0.4 | GO:0015986 | energy coupled proton transport, down electrochemical gradient(GO:0015985) ATP synthesis coupled proton transport(GO:0015986) |
| 0.0 | 2.4 | GO:0030324 | lung development(GO:0030324) |
| 0.0 | 1.1 | GO:0007050 | cell cycle arrest(GO:0007050) |
| 0.0 | 0.1 | GO:0002430 | complement receptor mediated signaling pathway(GO:0002430) |
Gene overrepresentation in cellular component category:
| Log-likelihood per target | Total log-likelihood | Term | Description |
|---|---|---|---|
| 6.4 | 19.1 | GO:0061673 | mitotic spindle astral microtubule(GO:0061673) |
| 2.6 | 15.9 | GO:0044326 | dendritic spine neck(GO:0044326) |
| 2.6 | 15.5 | GO:0033269 | internode region of axon(GO:0033269) |
| 1.8 | 33.1 | GO:0031588 | nucleotide-activated protein kinase complex(GO:0031588) |
| 1.7 | 20.0 | GO:0033180 | proton-transporting V-type ATPase, V1 domain(GO:0033180) |
| 1.3 | 6.4 | GO:0072534 | perineuronal net(GO:0072534) |
| 1.3 | 7.5 | GO:0002081 | outer acrosomal membrane(GO:0002081) |
| 1.1 | 4.5 | GO:0034657 | GID complex(GO:0034657) |
| 1.1 | 11.1 | GO:0014731 | spectrin-associated cytoskeleton(GO:0014731) |
| 1.0 | 4.2 | GO:0097025 | MPP7-DLG1-LIN7 complex(GO:0097025) |
| 0.9 | 2.8 | GO:0000811 | GINS complex(GO:0000811) |
| 0.9 | 17.2 | GO:0033268 | node of Ranvier(GO:0033268) |
| 0.8 | 7.6 | GO:0031209 | SCAR complex(GO:0031209) |
| 0.8 | 4.1 | GO:0071953 | elastic fiber(GO:0071953) |
| 0.8 | 2.4 | GO:0070557 | PCNA-p21 complex(GO:0070557) |
| 0.8 | 3.1 | GO:0097427 | microtubule bundle(GO:0097427) |
| 0.8 | 15.8 | GO:0097449 | astrocyte projection(GO:0097449) |
| 0.7 | 5.9 | GO:0031314 | extrinsic component of mitochondrial inner membrane(GO:0031314) |
| 0.7 | 18.0 | GO:0005868 | cytoplasmic dynein complex(GO:0005868) |
| 0.5 | 19.3 | GO:0032391 | photoreceptor connecting cilium(GO:0032391) |
| 0.4 | 2.9 | GO:0035068 | micro-ribonucleoprotein complex(GO:0035068) |
| 0.4 | 3.7 | GO:0070652 | HAUS complex(GO:0070652) |
| 0.3 | 1.2 | GO:0005846 | nuclear cap binding complex(GO:0005846) |
| 0.3 | 1.0 | GO:0032777 | Piccolo NuA4 histone acetyltransferase complex(GO:0032777) |
| 0.2 | 4.2 | GO:0031235 | intrinsic component of the cytoplasmic side of the plasma membrane(GO:0031235) |
| 0.2 | 2.5 | GO:0030688 | preribosome, small subunit precursor(GO:0030688) |
| 0.2 | 1.9 | GO:0000347 | THO complex(GO:0000347) THO complex part of transcription export complex(GO:0000445) |
| 0.2 | 1.5 | GO:0008541 | proteasome regulatory particle, lid subcomplex(GO:0008541) |
| 0.2 | 5.8 | GO:0046930 | pore complex(GO:0046930) |
| 0.2 | 7.2 | GO:0046658 | anchored component of plasma membrane(GO:0046658) |
| 0.2 | 7.0 | GO:0005891 | voltage-gated calcium channel complex(GO:0005891) |
| 0.2 | 1.8 | GO:0017119 | Golgi transport complex(GO:0017119) |
| 0.1 | 9.7 | GO:0032580 | Golgi cisterna membrane(GO:0032580) |
| 0.1 | 28.2 | GO:0043204 | perikaryon(GO:0043204) |
| 0.1 | 6.4 | GO:0016235 | aggresome(GO:0016235) |
| 0.1 | 5.4 | GO:0031672 | A band(GO:0031672) |
| 0.1 | 9.9 | GO:0044291 | cell-cell contact zone(GO:0044291) |
| 0.1 | 1.1 | GO:0008540 | proteasome regulatory particle, base subcomplex(GO:0008540) |
| 0.1 | 2.4 | GO:0016581 | NuRD complex(GO:0016581) CHD-type complex(GO:0090545) |
| 0.1 | 2.0 | GO:0001741 | XY body(GO:0001741) |
| 0.1 | 7.2 | GO:0005913 | cell-cell adherens junction(GO:0005913) |
| 0.1 | 0.5 | GO:0043034 | costamere(GO:0043034) |
| 0.1 | 0.6 | GO:0033263 | CORVET complex(GO:0033263) |
| 0.0 | 0.9 | GO:0031229 | integral component of nuclear inner membrane(GO:0005639) intrinsic component of nuclear inner membrane(GO:0031229) |
| 0.0 | 0.4 | GO:0030057 | desmosome(GO:0030057) |
| 0.0 | 3.3 | GO:0032587 | ruffle membrane(GO:0032587) |
| 0.0 | 5.8 | GO:0030017 | sarcomere(GO:0030017) |
| 0.0 | 1.2 | GO:0008180 | COP9 signalosome(GO:0008180) |
| 0.0 | 15.5 | GO:0043025 | neuronal cell body(GO:0043025) |
| 0.0 | 10.0 | GO:0005911 | cell-cell junction(GO:0005911) |
| 0.0 | 0.4 | GO:0071339 | MLL1/2 complex(GO:0044665) MLL1 complex(GO:0071339) |
| 0.0 | 2.2 | GO:0019005 | SCF ubiquitin ligase complex(GO:0019005) |
| 0.0 | 3.2 | GO:0005814 | centriole(GO:0005814) |
| 0.0 | 20.0 | GO:0048471 | perinuclear region of cytoplasm(GO:0048471) |
| 0.0 | 0.7 | GO:0030992 | intraciliary transport particle B(GO:0030992) |
| 0.0 | 7.7 | GO:0005667 | transcription factor complex(GO:0005667) |
| 0.0 | 6.8 | GO:0000151 | ubiquitin ligase complex(GO:0000151) |
| 0.0 | 1.6 | GO:0005758 | mitochondrial intermembrane space(GO:0005758) |
| 0.0 | 7.5 | GO:0030141 | secretory granule(GO:0030141) |
| 0.0 | 18.0 | GO:0016604 | nuclear body(GO:0016604) |
| 0.0 | 0.4 | GO:0000276 | mitochondrial proton-transporting ATP synthase complex, coupling factor F(o)(GO:0000276) |
| 0.0 | 5.6 | GO:0000790 | nuclear chromatin(GO:0000790) |
| 0.0 | 0.4 | GO:0001533 | cornified envelope(GO:0001533) |
| 0.0 | 1.6 | GO:0099572 | postsynaptic density(GO:0014069) postsynaptic specialization(GO:0099572) |
Gene overrepresentation in molecular function category:
| Log-likelihood per target | Total log-likelihood | Term | Description |
|---|---|---|---|
| 5.3 | 15.8 | GO:0001641 | group II metabotropic glutamate receptor activity(GO:0001641) |
| 4.7 | 14.2 | GO:0071886 | 1-(4-iodo-2,5-dimethoxyphenyl)propan-2-amine binding(GO:0071886) |
| 3.6 | 18.0 | GO:0032795 | heterotrimeric G-protein binding(GO:0032795) |
| 3.2 | 22.4 | GO:1901612 | cardiolipin binding(GO:1901612) |
| 2.4 | 9.7 | GO:0003835 | beta-galactoside alpha-2,6-sialyltransferase activity(GO:0003835) |
| 2.4 | 7.1 | GO:0042015 | interleukin-20 binding(GO:0042015) |
| 2.3 | 18.2 | GO:0044323 | retinoic acid-responsive element binding(GO:0044323) |
| 2.2 | 6.6 | GO:0034041 | sterol-transporting ATPase activity(GO:0034041) |
| 2.2 | 33.1 | GO:0004679 | AMP-activated protein kinase activity(GO:0004679) |
| 1.8 | 18.0 | GO:0045505 | dynein intermediate chain binding(GO:0045505) |
| 1.7 | 6.6 | GO:0070996 | type 1 melanocortin receptor binding(GO:0070996) |
| 1.1 | 15.9 | GO:0005391 | sodium:potassium-exchanging ATPase activity(GO:0005391) |
| 1.1 | 3.3 | GO:0034485 | phosphatidylinositol-3,4,5-trisphosphate 5-phosphatase activity(GO:0034485) |
| 1.0 | 20.0 | GO:0046933 | proton-transporting ATP synthase activity, rotational mechanism(GO:0046933) |
| 0.8 | 7.4 | GO:0004859 | phospholipase inhibitor activity(GO:0004859) |
| 0.8 | 5.7 | GO:0048495 | Roundabout binding(GO:0048495) |
| 0.8 | 11.3 | GO:0070679 | inositol 1,4,5 trisphosphate binding(GO:0070679) |
| 0.8 | 7.2 | GO:0019198 | transmembrane receptor protein tyrosine phosphatase activity(GO:0005001) transmembrane receptor protein phosphatase activity(GO:0019198) |
| 0.7 | 4.1 | GO:0070051 | fibrinogen binding(GO:0070051) |
| 0.6 | 3.2 | GO:0005315 | inorganic phosphate transmembrane transporter activity(GO:0005315) |
| 0.6 | 7.0 | GO:0031698 | beta-2 adrenergic receptor binding(GO:0031698) |
| 0.6 | 1.8 | GO:0019912 | cyclin-dependent protein kinase activating kinase activity(GO:0019912) |
| 0.6 | 6.0 | GO:1990380 | Lys48-specific deubiquitinase activity(GO:1990380) |
| 0.6 | 11.5 | GO:0001618 | virus receptor activity(GO:0001618) |
| 0.5 | 13.3 | GO:0004181 | metallocarboxypeptidase activity(GO:0004181) |
| 0.5 | 2.5 | GO:0089720 | caspase binding(GO:0089720) |
| 0.5 | 2.9 | GO:0017040 | ceramidase activity(GO:0017040) |
| 0.5 | 17.2 | GO:0030506 | ankyrin binding(GO:0030506) |
| 0.4 | 8.9 | GO:0005229 | intracellular calcium activated chloride channel activity(GO:0005229) |
| 0.4 | 3.1 | GO:0004468 | lysine N-acetyltransferase activity, acting on acetyl phosphate as donor(GO:0004468) |
| 0.4 | 2.6 | GO:0004726 | non-membrane spanning protein tyrosine phosphatase activity(GO:0004726) |
| 0.4 | 2.9 | GO:0035197 | siRNA binding(GO:0035197) |
| 0.4 | 2.8 | GO:0004865 | protein serine/threonine phosphatase inhibitor activity(GO:0004865) |
| 0.3 | 1.7 | GO:0030297 | transmembrane receptor protein tyrosine kinase activator activity(GO:0030297) |
| 0.3 | 6.7 | GO:0015026 | coreceptor activity(GO:0015026) |
| 0.3 | 19.8 | GO:0005080 | protein kinase C binding(GO:0005080) |
| 0.3 | 5.8 | GO:0008308 | voltage-gated anion channel activity(GO:0008308) |
| 0.3 | 12.4 | GO:0030507 | spectrin binding(GO:0030507) |
| 0.2 | 1.2 | GO:0035184 | histone threonine kinase activity(GO:0035184) |
| 0.2 | 1.2 | GO:0000339 | RNA cap binding(GO:0000339) |
| 0.2 | 15.9 | GO:0004722 | protein serine/threonine phosphatase activity(GO:0004722) |
| 0.2 | 8.8 | GO:0051879 | Hsp90 protein binding(GO:0051879) |
| 0.2 | 1.6 | GO:0004064 | arylesterase activity(GO:0004064) |
| 0.2 | 4.2 | GO:0099604 | calcium-release channel activity(GO:0015278) ligand-gated calcium channel activity(GO:0099604) |
| 0.2 | 0.6 | GO:0000700 | mismatch base pair DNA N-glycosylase activity(GO:0000700) DNA polymerase processivity factor activity(GO:0030337) dinucleotide insertion or deletion binding(GO:0032139) |
| 0.2 | 2.8 | GO:0043138 | 3'-5' DNA helicase activity(GO:0043138) |
| 0.2 | 12.7 | GO:0004869 | cysteine-type endopeptidase inhibitor activity(GO:0004869) |
| 0.2 | 0.9 | GO:0090555 | phosphatidylethanolamine-translocating ATPase activity(GO:0090555) |
| 0.2 | 21.8 | GO:0004222 | metalloendopeptidase activity(GO:0004222) |
| 0.2 | 17.3 | GO:0016503 | pheromone receptor activity(GO:0016503) |
| 0.2 | 15.5 | GO:0051117 | ATPase binding(GO:0051117) |
| 0.2 | 5.8 | GO:0051393 | alpha-actinin binding(GO:0051393) |
| 0.2 | 5.3 | GO:0030544 | Hsp70 protein binding(GO:0030544) |
| 0.2 | 7.6 | GO:0048365 | Rac GTPase binding(GO:0048365) |
| 0.2 | 2.1 | GO:0001206 | transcriptional repressor activity, RNA polymerase II distal enhancer sequence-specific binding(GO:0001206) |
| 0.1 | 34.9 | GO:0003729 | mRNA binding(GO:0003729) poly(A) RNA binding(GO:0044822) |
| 0.1 | 1.9 | GO:0019531 | oxalate transmembrane transporter activity(GO:0019531) |
| 0.1 | 5.3 | GO:0042974 | retinoic acid receptor binding(GO:0042974) |
| 0.1 | 1.4 | GO:0048156 | tau protein binding(GO:0048156) |
| 0.1 | 3.3 | GO:0001540 | beta-amyloid binding(GO:0001540) |
| 0.1 | 16.0 | GO:0051015 | actin filament binding(GO:0051015) |
| 0.1 | 26.4 | GO:0008017 | microtubule binding(GO:0008017) |
| 0.1 | 14.5 | GO:0005179 | hormone activity(GO:0005179) |
| 0.1 | 5.5 | GO:0032947 | protein complex scaffold(GO:0032947) |
| 0.1 | 3.5 | GO:0015175 | neutral amino acid transmembrane transporter activity(GO:0015175) |
| 0.1 | 8.9 | GO:0016410 | N-acyltransferase activity(GO:0016410) |
| 0.1 | 1.0 | GO:0017151 | DEAD/H-box RNA helicase binding(GO:0017151) |
| 0.1 | 1.6 | GO:0015035 | protein disulfide oxidoreductase activity(GO:0015035) |
| 0.1 | 4.9 | GO:0005518 | collagen binding(GO:0005518) |
| 0.1 | 6.3 | GO:0004860 | protein kinase inhibitor activity(GO:0004860) |
| 0.1 | 2.3 | GO:0005547 | phosphatidylinositol-3,4,5-trisphosphate binding(GO:0005547) |
| 0.1 | 1.8 | GO:0030552 | cAMP binding(GO:0030552) |
| 0.0 | 4.3 | GO:0005178 | integrin binding(GO:0005178) |
| 0.0 | 0.4 | GO:0045295 | gamma-catenin binding(GO:0045295) |
| 0.0 | 0.5 | GO:0008079 | translation release factor activity(GO:0003747) translation termination factor activity(GO:0008079) |
| 0.0 | 1.2 | GO:0070273 | phosphatidylinositol-4-phosphate binding(GO:0070273) |
| 0.0 | 4.4 | GO:0042393 | histone binding(GO:0042393) |
| 0.0 | 1.1 | GO:0031593 | polyubiquitin binding(GO:0031593) |
| 0.0 | 0.1 | GO:0004982 | N-formyl peptide receptor activity(GO:0004982) |
| 0.0 | 3.8 | GO:0001227 | transcriptional repressor activity, RNA polymerase II transcription regulatory region sequence-specific binding(GO:0001227) |
| 0.0 | 2.3 | GO:0008083 | growth factor activity(GO:0008083) |
| 0.0 | 3.4 | GO:0008168 | methyltransferase activity(GO:0008168) |
| 0.0 | 5.6 | GO:0030246 | carbohydrate binding(GO:0030246) |
| 0.0 | 2.3 | GO:0005267 | potassium channel activity(GO:0005267) |
| 0.0 | 7.2 | GO:0004842 | ubiquitin-protein transferase activity(GO:0004842) |
| 0.0 | 0.9 | GO:0101005 | thiol-dependent ubiquitinyl hydrolase activity(GO:0036459) ubiquitinyl hydrolase activity(GO:0101005) |
Gene overrepresentation in curated gene sets: canonical pathways category:
| Log-likelihood per target | Total log-likelihood | Term | Description |
|---|---|---|---|
| 0.3 | 2.4 | ST PAC1 RECEPTOR PATHWAY | PAC1 Receptor Pathway |
| 0.3 | 7.2 | PID NECTIN PATHWAY | Nectin adhesion pathway |
| 0.3 | 6.6 | PID SYNDECAN 3 PATHWAY | Syndecan-3-mediated signaling events |
| 0.3 | 1.2 | PID IL5 PATHWAY | IL5-mediated signaling events |
| 0.3 | 5.9 | PID ECADHERIN KERATINOCYTE PATHWAY | E-cadherin signaling in keratinocytes |
| 0.3 | 11.3 | NABA PROTEOGLYCANS | Genes encoding proteoglycans |
| 0.2 | 11.3 | PID PI3K PLC TRK PATHWAY | Trk receptor signaling mediated by PI3K and PLC-gamma |
| 0.2 | 4.4 | ST PHOSPHOINOSITIDE 3 KINASE PATHWAY | PI3K Pathway |
| 0.2 | 42.1 | NABA ECM GLYCOPROTEINS | Genes encoding structural ECM glycoproteins |
| 0.2 | 1.8 | SA G2 AND M PHASES | Cdc25 activates the cdc2/cyclin B complex to induce the G2/M transition. |
| 0.2 | 12.7 | PID AR PATHWAY | Coregulation of Androgen receptor activity |
| 0.2 | 2.6 | PID IGF1 PATHWAY | IGF1 pathway |
| 0.1 | 7.6 | PID RAC1 PATHWAY | RAC1 signaling pathway |
| 0.1 | 14.9 | PID P53 DOWNSTREAM PATHWAY | Direct p53 effectors |
| 0.1 | 2.3 | PID ARF6 PATHWAY | Arf6 signaling events |
| 0.0 | 1.7 | PID BMP PATHWAY | BMP receptor signaling |
| 0.0 | 2.4 | PID MYC ACTIV PATHWAY | Validated targets of C-MYC transcriptional activation |
| 0.0 | 0.7 | PID CONE PATHWAY | Visual signal transduction: Cones |
| 0.0 | 0.7 | PID CDC42 PATHWAY | CDC42 signaling events |
| 0.0 | 2.6 | NABA ECM REGULATORS | Genes encoding enzymes and their regulators involved in the remodeling of the extracellular matrix |
Gene overrepresentation in curated gene sets: REACTOME pathways category:
| Log-likelihood per target | Total log-likelihood | Term | Description |
|---|---|---|---|
| 1.0 | 14.2 | REACTOME SEROTONIN RECEPTORS | Genes involved in Serotonin receptors |
| 0.9 | 11.3 | REACTOME ELEVATION OF CYTOSOLIC CA2 LEVELS | Genes involved in Elevation of cytosolic Ca2+ levels |
| 0.8 | 11.5 | REACTOME REGULATION OF COMPLEMENT CASCADE | Genes involved in Regulation of Complement cascade |
| 0.8 | 28.3 | REACTOME INTERACTION BETWEEN L1 AND ANKYRINS | Genes involved in Interaction between L1 and Ankyrins |
| 0.7 | 15.8 | REACTOME CLASS C 3 METABOTROPIC GLUTAMATE PHEROMONE RECEPTORS | Genes involved in Class C/3 (Metabotropic glutamate/pheromone receptors) |
| 0.6 | 6.6 | REACTOME ANDROGEN BIOSYNTHESIS | Genes involved in Androgen biosynthesis |
| 0.5 | 6.4 | REACTOME KERATAN SULFATE DEGRADATION | Genes involved in Keratan sulfate degradation |
| 0.4 | 15.5 | REACTOME GLUCAGON TYPE LIGAND RECEPTORS | Genes involved in Glucagon-type ligand receptors |
| 0.3 | 6.6 | REACTOME ABCA TRANSPORTERS IN LIPID HOMEOSTASIS | Genes involved in ABCA transporters in lipid homeostasis |
| 0.3 | 15.9 | REACTOME ION TRANSPORT BY P TYPE ATPASES | Genes involved in Ion transport by P-type ATPases |
| 0.3 | 2.8 | REACTOME UNWINDING OF DNA | Genes involved in Unwinding of DNA |
| 0.2 | 7.0 | REACTOME DARPP 32 EVENTS | Genes involved in DARPP-32 events |
| 0.1 | 5.7 | REACTOME NETRIN1 SIGNALING | Genes involved in Netrin-1 signaling |
| 0.1 | 3.6 | REACTOME ANTIGEN ACTIVATES B CELL RECEPTOR LEADING TO GENERATION OF SECOND MESSENGERS | Genes involved in Antigen Activates B Cell Receptor Leading to Generation of Second Messengers |
| 0.1 | 6.7 | REACTOME CLASS B 2 SECRETIN FAMILY RECEPTORS | Genes involved in Class B/2 (Secretin family receptors) |
| 0.1 | 1.8 | REACTOME AKT PHOSPHORYLATES TARGETS IN THE CYTOSOL | Genes involved in AKT phosphorylates targets in the cytosol |
| 0.1 | 1.1 | REACTOME IRAK2 MEDIATED ACTIVATION OF TAK1 COMPLEX UPON TLR7 8 OR 9 STIMULATION | Genes involved in IRAK2 mediated activation of TAK1 complex upon TLR7/8 or 9 stimulation |
| 0.1 | 3.3 | REACTOME SYNTHESIS OF PIPS AT THE PLASMA MEMBRANE | Genes involved in Synthesis of PIPs at the plasma membrane |
| 0.1 | 3.5 | REACTOME AMINO ACID TRANSPORT ACROSS THE PLASMA MEMBRANE | Genes involved in Amino acid transport across the plasma membrane |
| 0.1 | 0.6 | REACTOME REMOVAL OF THE FLAP INTERMEDIATE FROM THE C STRAND | Genes involved in Removal of the Flap Intermediate from the C-strand |
| 0.1 | 5.1 | REACTOME TRANSPORT OF INORGANIC CATIONS ANIONS AND AMINO ACIDS OLIGOPEPTIDES | Genes involved in Transport of inorganic cations/anions and amino acids/oligopeptides |
| 0.1 | 4.4 | REACTOME MEIOTIC RECOMBINATION | Genes involved in Meiotic Recombination |
| 0.1 | 0.9 | REACTOME APOPTOTIC CLEAVAGE OF CELL ADHESION PROTEINS | Genes involved in Apoptotic cleavage of cell adhesion proteins |
| 0.1 | 1.4 | REACTOME G0 AND EARLY G1 | Genes involved in G0 and Early G1 |
| 0.1 | 3.2 | REACTOME LOSS OF NLP FROM MITOTIC CENTROSOMES | Genes involved in Loss of Nlp from mitotic centrosomes |
| 0.0 | 1.2 | REACTOME IL RECEPTOR SHC SIGNALING | Genes involved in Interleukin receptor SHC signaling |
| 0.0 | 0.9 | REACTOME ABC FAMILY PROTEINS MEDIATED TRANSPORT | Genes involved in ABC-family proteins mediated transport |
| 0.0 | 1.6 | REACTOME MITOCHONDRIAL PROTEIN IMPORT | Genes involved in Mitochondrial Protein Import |
| 0.0 | 0.4 | REACTOME FORMATION OF ATP BY CHEMIOSMOTIC COUPLING | Genes involved in Formation of ATP by chemiosmotic coupling |
| 0.0 | 1.2 | REACTOME METABOLISM OF NON CODING RNA | Genes involved in Metabolism of non-coding RNA |
| 0.0 | 1.1 | REACTOME CDK MEDIATED PHOSPHORYLATION AND REMOVAL OF CDC6 | Genes involved in CDK-mediated phosphorylation and removal of Cdc6 |
| 0.0 | 0.5 | REACTOME SPHINGOLIPID DE NOVO BIOSYNTHESIS | Genes involved in Sphingolipid de novo biosynthesis |