Project
GSE53960: rat RNA-Seq transcriptomic Bodymap
Navigation
Downloads
Results for Stat4_Stat3_Stat5b
Z-value: 1.24
Motif logo
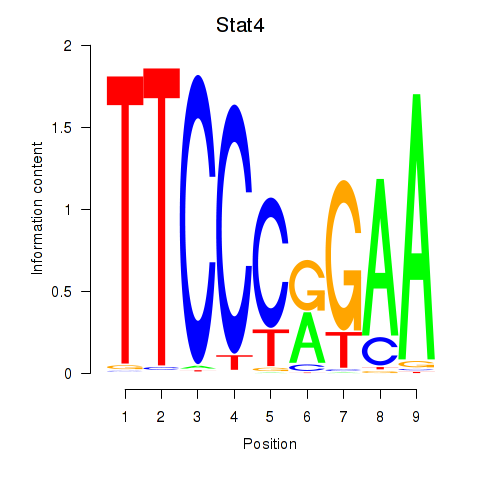
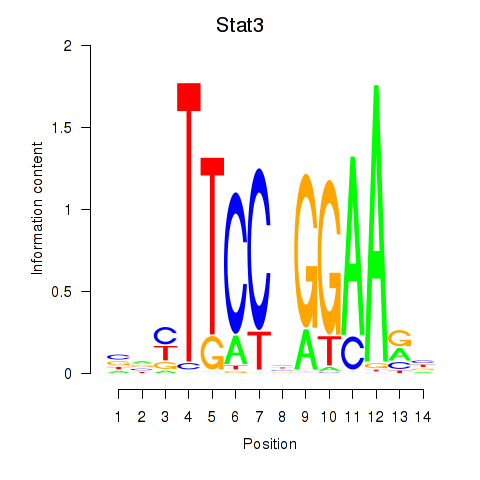
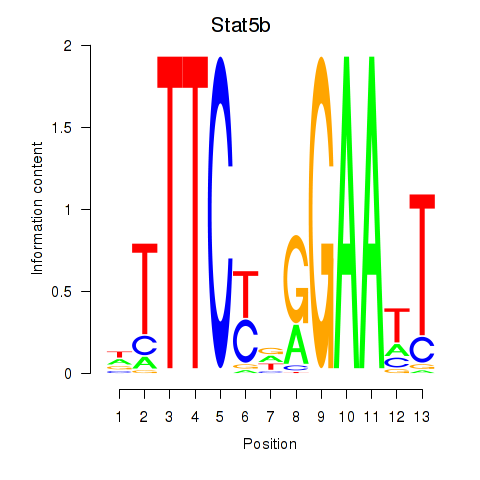
Transcription factors associated with Stat4_Stat3_Stat5b
| Gene Symbol | Gene ID | Gene Info |
|---|---|---|
|
Stat3
|
ENSRNOG00000019742 | signal transducer and activator of transcription 3 |
|
Stat5b
|
ENSRNOG00000019075 | signal transducer and activator of transcription 5B |
Activity-expression correlation:
| Gene | Promoter | Pearson corr. coef. | P-value | Plot |
|---|---|---|---|---|
| Stat3 | rn6_v1_chr10_-_88842233_88842233 | 0.41 | 3.1e-14 | Click! |
| Stat5b | rn6_v1_chr10_-_88754829_88754829 | 0.19 | 6.7e-04 | Click! |
Activity profile of Stat4_Stat3_Stat5b motif
Sorted Z-values of Stat4_Stat3_Stat5b motif
| Promoter | Log-likelihood | Transcript | Gene | Gene Info |
|---|---|---|---|---|
| chr16_+_6970342 | 111.11 |
ENSRNOT00000061294
ENSRNOT00000048344 |
Itih4
|
inter-alpha-trypsin inhibitor heavy chain family, member 4 |
| chr19_-_57333433 | 70.23 |
ENSRNOT00000024917
|
Agt
|
angiotensinogen |
| chr2_+_181987217 | 46.40 |
ENSRNOT00000034521
|
Fgg
|
fibrinogen gamma chain |
| chr10_+_65767930 | 44.52 |
ENSRNOT00000039954
|
Vtn
|
vitronectin |
| chr7_+_1206648 | 41.16 |
ENSRNOT00000073689
|
Pros1
|
protein S (alpha) |
| chr6_-_127656603 | 39.94 |
ENSRNOT00000015516
|
Serpina11
|
serpin family A member 11 |
| chr2_+_182006242 | 39.45 |
ENSRNOT00000064091
|
Fga
|
fibrinogen alpha chain |
| chrX_+_143097525 | 39.00 |
ENSRNOT00000004559
|
F9
|
coagulation factor IX |
| chrX_-_143453612 | 33.63 |
ENSRNOT00000051319
|
Atp11c
|
ATPase phospholipid transporting 11C |
| chr4_-_17594598 | 32.61 |
ENSRNOT00000008936
|
Sema3e
|
semaphorin 3E |
| chr8_+_22035256 | 31.84 |
ENSRNOT00000028066
|
Icam1
|
intercellular adhesion molecule 1 |
| chr2_+_104744461 | 29.74 |
ENSRNOT00000016083
ENSRNOT00000082627 |
Cp
|
ceruloplasmin |
| chr1_-_170431073 | 29.72 |
ENSRNOT00000024710
|
Hpx
|
hemopexin |
| chr7_-_102298522 | 29.17 |
ENSRNOT00000006273
|
A1bg
|
alpha-1-B glycoprotein |
| chr4_+_70776046 | 28.85 |
ENSRNOT00000040403
|
Prss1
|
protease, serine 1 |
| chr15_-_34392066 | 27.73 |
ENSRNOT00000027315
|
Tgm1
|
transglutaminase 1 |
| chr8_+_21890319 | 25.44 |
ENSRNOT00000027949
|
LOC500956
|
hypothetical protein LOC500956 |
| chr5_+_165415136 | 24.91 |
ENSRNOT00000016317
ENSRNOT00000079407 |
Masp2
|
mannan-binding lectin serine peptidase 2 |
| chr19_+_15294248 | 22.69 |
ENSRNOT00000024622
|
Ces1f
|
carboxylesterase 1F |
| chr1_-_176079125 | 21.59 |
ENSRNOT00000047044
|
RGD1566189
|
similar to ferritin light chain |
| chr10_+_34277993 | 21.51 |
ENSRNOT00000055872
ENSRNOT00000003343 |
Ifi47
|
interferon gamma inducible protein 47 |
| chr7_-_70355619 | 21.21 |
ENSRNOT00000031272
|
Tspan31
|
tetraspanin 31 |
| chr2_-_182035032 | 20.53 |
ENSRNOT00000009813
|
Fgb
|
fibrinogen beta chain |
| chr1_-_89369960 | 20.20 |
ENSRNOT00000028545
|
Hamp
|
hepcidin antimicrobial peptide |
| chr1_-_80617057 | 19.93 |
ENSRNOT00000080453
|
Apoe
|
apolipoprotein E |
| chr1_-_78180216 | 19.65 |
ENSRNOT00000071576
|
C5ar2
|
complement component 5a receptor 2 |
| chr11_+_84396033 | 19.41 |
ENSRNOT00000002316
|
Abcc5
|
ATP binding cassette subfamily C member 5 |
| chr3_-_72171078 | 19.37 |
ENSRNOT00000009817
|
Serping1
|
serpin family G member 1 |
| chr4_+_163162211 | 19.03 |
ENSRNOT00000082537
|
Clec1b
|
C-type lectin domain family 1, member B |
| chr11_+_68105369 | 18.80 |
ENSRNOT00000046888
|
Parp14
|
poly (ADP-ribose) polymerase family, member 14 |
| chr11_+_74057361 | 17.97 |
ENSRNOT00000048746
|
Cpn2
|
carboxypeptidase N subunit 2 |
| chr15_-_35417273 | 17.81 |
ENSRNOT00000083961
ENSRNOT00000041430 |
Gzmb
|
granzyme B |
| chr10_+_90085559 | 16.77 |
ENSRNOT00000028332
|
Nags
|
N-acetylglutamate synthase |
| chr15_-_36472327 | 16.09 |
ENSRNOT00000032601
ENSRNOT00000059660 |
LOC102553861
|
granzyme-like protein 1-like |
| chr1_+_154131926 | 16.09 |
ENSRNOT00000035257
|
LOC102549852
|
ferritin light chain 1-like |
| chr14_-_80973456 | 15.96 |
ENSRNOT00000013257
|
Hgfac
|
HGF activator |
| chr7_-_94563001 | 15.74 |
ENSRNOT00000051139
ENSRNOT00000005561 |
Enpp2
|
ectonucleotide pyrophosphatase/phosphodiesterase 2 |
| chr17_+_57075218 | 15.34 |
ENSRNOT00000089536
|
Crem
|
cAMP responsive element modulator |
| chr4_+_61850348 | 15.26 |
ENSRNOT00000013423
|
Akr1b7
|
aldo-keto reductase family 1, member B7 |
| chr6_-_127508452 | 15.13 |
ENSRNOT00000073709
|
LOC100909524
|
protein Z-dependent protease inhibitor-like |
| chr2_+_235264219 | 14.69 |
ENSRNOT00000086245
|
Cfi
|
complement factor I |
| chr1_+_84044551 | 14.65 |
ENSRNOT00000028290
|
Coq8b
|
coenzyme Q8B |
| chrX_+_9436707 | 14.65 |
ENSRNOT00000004187
|
Cask
|
calcium/calmodulin dependent serine protein kinase |
| chr7_+_54980120 | 14.39 |
ENSRNOT00000005690
ENSRNOT00000005773 |
Kcnc2
|
potassium voltage-gated channel subfamily C member 2 |
| chr20_-_35449280 | 14.13 |
ENSRNOT00000057422
|
Man1a1
|
mannosidase, alpha, class 1A, member 1 |
| chr20_-_29029905 | 14.07 |
ENSRNOT00000075682
|
Oit3
|
oncoprotein induced transcript 3 |
| chr20_-_4542073 | 13.97 |
ENSRNOT00000000477
|
Cfb
|
complement factor B |
| chr7_-_76294663 | 13.49 |
ENSRNOT00000064513
|
Ncald
|
neurocalcin delta |
| chr1_-_80594136 | 13.41 |
ENSRNOT00000024800
|
Apoc2
|
apolipoprotein C2 |
| chr9_-_19880346 | 13.28 |
ENSRNOT00000014051
|
Cyp39a1
|
cytochrome P450, family 39, subfamily a, polypeptide 1 |
| chr8_+_116857684 | 13.12 |
ENSRNOT00000026711
|
Mst1
|
macrophage stimulating 1 |
| chr1_-_98493978 | 13.00 |
ENSRNOT00000023942
|
Nkg7
|
natural killer cell granule protein 7 |
| chr13_+_47739526 | 12.95 |
ENSRNOT00000006246
|
Il10
|
interleukin 10 |
| chr18_-_29562153 | 12.29 |
ENSRNOT00000023977
|
Cd14
|
CD14 molecule |
| chr19_+_37282018 | 12.23 |
ENSRNOT00000021723
|
Tmem208
|
transmembrane protein 208 |
| chr4_+_100166863 | 11.82 |
ENSRNOT00000014505
|
Sftpb
|
surfactant protein B |
| chr9_-_27452902 | 11.52 |
ENSRNOT00000018325
|
Gsta1
|
glutathione S-transferase alpha 1 |
| chr1_+_170383682 | 11.49 |
ENSRNOT00000024224
|
Smpd1
|
sphingomyelin phosphodiesterase 1 |
| chr10_+_39109522 | 11.48 |
ENSRNOT00000010968
|
Irf1
|
interferon regulatory factor 1 |
| chr5_-_134871775 | 11.45 |
ENSRNOT00000015667
|
LOC100911581
|
fatty-acid amide hydrolase 1-like |
| chr5_-_134348995 | 11.35 |
ENSRNOT00000015961
|
Faah
|
fatty acid amide hydrolase |
| chr7_-_116161708 | 11.32 |
ENSRNOT00000068707
|
Cyp11b2
|
cytochrome P450, family 11, subfamily b, polypeptide 2 |
| chr13_+_89386023 | 11.07 |
ENSRNOT00000086223
|
Fcgr3a
|
Fc fragment of IgG receptor IIIa |
| chr13_-_47397890 | 11.06 |
ENSRNOT00000005505
|
C4bpb
|
complement component 4 binding protein, beta |
| chr11_-_11585765 | 11.01 |
ENSRNOT00000066439
|
Robo2
|
roundabout guidance receptor 2 |
| chr3_-_107760550 | 10.82 |
ENSRNOT00000077091
ENSRNOT00000051638 |
Meis2
|
Meis homeobox 2 |
| chr16_+_74886719 | 10.71 |
ENSRNOT00000089265
|
Atp7b
|
ATPase copper transporting beta |
| chr13_+_51022681 | 10.66 |
ENSRNOT00000078599
|
Chi3l1
|
chitinase 3 like 1 |
| chr9_+_10952374 | 10.57 |
ENSRNOT00000074993
|
Lrg1
|
leucine-rich alpha-2-glycoprotein 1 |
| chr4_-_78458179 | 10.45 |
ENSRNOT00000078473
ENSRNOT00000011327 |
Tmem176b
|
transmembrane protein 176B |
| chrX_+_15049462 | 10.20 |
ENSRNOT00000007015
|
Ebp
|
emopamil binding protein (sterol isomerase) |
| chr4_+_78458625 | 10.09 |
ENSRNOT00000049891
|
Tmem176a
|
transmembrane protein 176A |
| chr19_+_54314865 | 10.09 |
ENSRNOT00000024069
|
Irf8
|
interferon regulatory factor 8 |
| chr9_-_85243001 | 9.54 |
ENSRNOT00000020219
|
Scg2
|
secretogranin II |
| chr1_-_225283326 | 9.48 |
ENSRNOT00000027342
|
Scgb1a1
|
secretoglobin family 1A member 1 |
| chr6_-_61405195 | 9.35 |
ENSRNOT00000008655
|
Lrrn3
|
leucine rich repeat neuronal 3 |
| chr6_-_1583417 | 9.35 |
ENSRNOT00000084528
|
Prkd3
|
protein kinase D3 |
| chr8_+_127735258 | 9.33 |
ENSRNOT00000015888
|
Vill
|
villin-like |
| chr2_+_30685840 | 9.28 |
ENSRNOT00000031385
|
Ccdc125
|
coiled-coil domain containing 125 |
| chr17_+_31441630 | 9.17 |
ENSRNOT00000083705
ENSRNOT00000023582 |
Tubb2b
|
tubulin, beta 2B class IIb |
| chr6_+_64808238 | 9.08 |
ENSRNOT00000093195
|
Nrcam
|
neuronal cell adhesion molecule |
| chr3_+_119015412 | 9.08 |
ENSRNOT00000013605
|
Slc27a2
|
solute carrier family 27 member 2 |
| chr10_+_45893018 | 8.93 |
ENSRNOT00000004280
ENSRNOT00000086710 |
Nlrp3
|
NLR family, pyrin domain containing 3 |
| chr4_+_70689737 | 8.86 |
ENSRNOT00000018852
|
Prss2
|
protease, serine, 2 |
| chr8_-_23148396 | 8.86 |
ENSRNOT00000075237
|
Acp5
|
acid phosphatase 5, tartrate resistant |
| chr4_-_29092753 | 8.80 |
ENSRNOT00000014810
|
Bet1
|
Bet1 golgi vesicular membrane trafficking protein |
| chr1_-_82279145 | 8.75 |
ENSRNOT00000057433
|
Cxcl17
|
C-X-C motif chemokine ligand 17 |
| chr11_-_82938357 | 8.74 |
ENSRNOT00000035945
|
Map3k13
|
mitogen-activated protein kinase kinase kinase 13 |
| chr8_-_52937972 | 8.66 |
ENSRNOT00000007789
|
Nnmt
|
nicotinamide N-methyltransferase |
| chr11_+_50781127 | 8.59 |
ENSRNOT00000002738
|
Alcam
|
activated leukocyte cell adhesion molecule |
| chr7_+_11724962 | 8.57 |
ENSRNOT00000026551
|
Lsm7
|
LSM7 homolog, U6 small nuclear RNA and mRNA degradation associated |
| chr4_+_57855416 | 8.56 |
ENSRNOT00000029608
|
Cpa2
|
carboxypeptidase A2 |
| chr10_-_90999506 | 8.54 |
ENSRNOT00000034401
|
Gfap
|
glial fibrillary acidic protein |
| chr20_+_3979035 | 8.40 |
ENSRNOT00000000529
|
Tap1
|
transporter 1, ATP binding cassette subfamily B member |
| chr4_-_89695928 | 8.37 |
ENSRNOT00000039316
|
Gprin3
|
GPRIN family member 3 |
| chr18_-_41389510 | 8.28 |
ENSRNOT00000005476
ENSRNOT00000005446 |
Sema6a
|
semaphorin 6A |
| chr7_+_143707237 | 8.04 |
ENSRNOT00000074212
|
Tns2
|
tensin 2 |
| chr2_-_89310946 | 8.02 |
ENSRNOT00000015195
|
Ralyl
|
RALY RNA binding protein-like |
| chr20_+_4363508 | 7.97 |
ENSRNOT00000077205
|
Ager
|
advanced glycosylation end product-specific receptor |
| chr7_-_50638798 | 7.80 |
ENSRNOT00000048880
|
Syt1
|
synaptotagmin 1 |
| chr10_-_70744315 | 7.79 |
ENSRNOT00000014865
|
Ccl5
|
C-C motif chemokine ligand 5 |
| chr18_+_30017918 | 7.73 |
ENSRNOT00000079794
|
Pcdha4
|
protocadherin alpha 4 |
| chrX_-_70461553 | 7.66 |
ENSRNOT00000076110
ENSRNOT00000003872 ENSRNOT00000076812 |
Pdzd11
|
PDZ domain containing 11 |
| chr1_-_8751198 | 7.62 |
ENSRNOT00000030511
|
Adgrg6
|
adhesion G protein-coupled receptor G6 |
| chr18_-_55992885 | 7.55 |
ENSRNOT00000025881
|
Ndst1
|
N-deacetylase and N-sulfotransferase 1 |
| chr16_-_19942343 | 7.53 |
ENSRNOT00000087162
ENSRNOT00000091906 |
Bst2
|
bone marrow stromal cell antigen 2 |
| chr17_-_10818835 | 7.49 |
ENSRNOT00000091046
|
Cplx2
|
complexin 2 |
| chr4_+_173732248 | 7.47 |
ENSRNOT00000041499
|
Pik3c2g
|
phosphatidylinositol-4-phosphate 3-kinase, catalytic subunit type 2 gamma |
| chr1_-_167093560 | 7.37 |
ENSRNOT00000027301
|
Il18bp
|
interleukin 18 binding protein |
| chr13_-_26811904 | 7.30 |
ENSRNOT00000090097
|
Kdsr
|
3-ketodihydrosphingosine reductase |
| chr3_-_52998650 | 7.11 |
ENSRNOT00000009988
|
RGD1560831
|
similar to 40S ribosomal protein S3 |
| chr2_-_258997138 | 7.05 |
ENSRNOT00000045020
ENSRNOT00000042256 |
Adgrl2
|
adhesion G protein-coupled receptor L2 |
| chr7_-_3074359 | 7.04 |
ENSRNOT00000019738
|
Ikzf4
|
IKAROS family zinc finger 4 |
| chr8_-_128026841 | 7.00 |
ENSRNOT00000018341
|
Myd88
|
myeloid differentiation primary response 88 |
| chr2_+_263212051 | 6.93 |
ENSRNOT00000089396
|
Negr1
|
neuronal growth regulator 1 |
| chr3_-_36660758 | 6.89 |
ENSRNOT00000006111
|
Rnd3
|
Rho family GTPase 3 |
| chr1_+_276659542 | 6.89 |
ENSRNOT00000019681
|
Tcf7l2
|
transcription factor 7 like 2 |
| chr3_-_83048289 | 6.87 |
ENSRNOT00000047571
ENSRNOT00000012806 |
Hsd17b12
|
hydroxysteroid (17-beta) dehydrogenase 12 |
| chr10_-_34221928 | 6.85 |
ENSRNOT00000045545
|
Irgm
|
immunity-related GTPase M |
| chr9_+_82632230 | 6.82 |
ENSRNOT00000085165
|
Gmppa
|
GDP-mannose pyrophosphorylase A |
| chr18_-_35780519 | 6.78 |
ENSRNOT00000079667
|
Mcc
|
mutated in colorectal cancers |
| chr20_+_4363152 | 6.56 |
ENSRNOT00000000508
ENSRNOT00000084841 ENSRNOT00000072848 ENSRNOT00000077561 |
Ager
|
advanced glycosylation end product-specific receptor |
| chr10_-_110274768 | 6.46 |
ENSRNOT00000054931
|
Sectm1a
|
secreted and transmembrane 1A |
| chr4_+_100465170 | 6.45 |
ENSRNOT00000019571
|
Retsat
|
retinol saturase |
| chr13_+_89253617 | 6.45 |
ENSRNOT00000044575
|
LOC100362384
|
ferritin light chain 1-like |
| chr1_+_203160323 | 6.45 |
ENSRNOT00000027919
|
AABR07005844.1
|
|
| chr5_-_147784311 | 6.36 |
ENSRNOT00000074172
|
Fam167b
|
family with sequence similarity 167, member B |
| chr10_+_14240219 | 6.35 |
ENSRNOT00000020233
|
Igfals
|
insulin-like growth factor binding protein, acid labile subunit |
| chr20_-_3793985 | 6.31 |
ENSRNOT00000049540
ENSRNOT00000086293 |
RT1-CE16
|
RT1 class I, locus CE16 |
| chr4_-_15505362 | 6.30 |
ENSRNOT00000009763
|
Hgf
|
hepatocyte growth factor |
| chr9_+_9704346 | 6.21 |
ENSRNOT00000075403
|
Gpr108
|
G protein-coupled receptor 108 |
| chr3_+_100768637 | 6.18 |
ENSRNOT00000083542
|
Bdnf
|
brain-derived neurotrophic factor |
| chr2_-_113616766 | 6.17 |
ENSRNOT00000016858
ENSRNOT00000074723 |
Tmem212
|
transmembrane protein 212 |
| chr8_+_64531594 | 6.08 |
ENSRNOT00000036798
|
Gramd2
|
GRAM domain containing 2 |
| chr7_+_116889572 | 5.94 |
ENSRNOT00000075917
|
Gsdmd
|
gasdermin D |
| chr19_-_15431274 | 5.85 |
ENSRNOT00000022285
ENSRNOT00000048470 |
Slc6a2
|
solute carrier family 6 member 2 |
| chr12_+_41155497 | 5.84 |
ENSRNOT00000041741
|
Oas1g
|
2'-5' oligoadenylate synthetase 1G |
| chr13_-_73460912 | 5.83 |
ENSRNOT00000005052
ENSRNOT00000068044 |
Qsox1
|
quiescin sulfhydryl oxidase 1 |
| chr2_+_189609800 | 5.82 |
ENSRNOT00000089016
|
Slc39a1
|
solute carrier family 39 member 1 |
| chr1_+_105284753 | 5.80 |
ENSRNOT00000041950
|
Slc6a5
|
solute carrier family 6 member 5 |
| chr13_+_92103123 | 5.77 |
ENSRNOT00000004643
|
Olr1584
|
olfactory receptor 1584 |
| chr7_-_134722215 | 5.75 |
ENSRNOT00000036750
|
Prickle1
|
prickle planar cell polarity protein 1 |
| chr4_+_147037179 | 5.74 |
ENSRNOT00000011292
|
Syn2
|
synapsin II |
| chr4_+_163174487 | 5.64 |
ENSRNOT00000088108
|
Clec9a
|
C-type lectin domain family 9, member A |
| chr20_-_3978845 | 5.62 |
ENSRNOT00000000532
|
Psmb9
|
proteasome subunit beta 9 |
| chrX_+_28072826 | 5.57 |
ENSRNOT00000039796
|
Frmpd4
|
FERM and PDZ domain containing 4 |
| chr7_-_140437467 | 5.56 |
ENSRNOT00000087181
|
Fkbp11
|
FK506 binding protein 11 |
| chr17_-_76410294 | 5.55 |
ENSRNOT00000023892
|
Nudt5
|
nudix hydrolase 5 |
| chr4_+_167754525 | 5.55 |
ENSRNOT00000007889
|
Etv6
|
ets variant 6 |
| chr4_+_71621729 | 5.53 |
ENSRNOT00000022275
|
Gstk1
|
glutathione S-transferase kappa 1 |
| chr2_+_187697523 | 5.52 |
ENSRNOT00000026153
|
Glmp
|
glycosylated lysosomal membrane protein |
| chr1_+_72784966 | 5.51 |
ENSRNOT00000090065
ENSRNOT00000041527 |
Tmem86b
|
transmembrane protein 86B |
| chr16_-_71125316 | 5.43 |
ENSRNOT00000020900
|
Plpp5
|
phospholipid phosphatase 5 |
| chr14_+_81488008 | 5.42 |
ENSRNOT00000018477
|
Tnip2
|
TNFAIP3 interacting protein 2 |
| chr2_-_167607919 | 5.40 |
ENSRNOT00000089083
|
AABR07011733.1
|
|
| chr9_+_82632384 | 5.36 |
ENSRNOT00000027064
|
Gmppa
|
GDP-mannose pyrophosphorylase A |
| chrX_-_105417323 | 5.33 |
ENSRNOT00000015494
|
Gla
|
galactosidase, alpha |
| chr7_-_130350570 | 5.31 |
ENSRNOT00000055805
|
Odf3b
|
outer dense fiber of sperm tails 3B |
| chr19_+_14508616 | 5.30 |
ENSRNOT00000019192
|
Hmox1
|
heme oxygenase 1 |
| chr12_+_49419582 | 5.28 |
ENSRNOT00000082998
|
RGD1306556
|
similar to hypothetical protein A530094D01 |
| chr2_+_201172312 | 5.24 |
ENSRNOT00000026458
|
Wars2
|
tryptophanyl tRNA synthetase 2 (mitochondrial) |
| chr16_+_23317953 | 5.20 |
ENSRNOT00000075287
|
AABR07024972.1
|
|
| chr5_-_147846095 | 5.18 |
ENSRNOT00000072165
|
Txlna
|
taxilin alpha |
| chr6_-_55001464 | 5.15 |
ENSRNOT00000006618
|
Ahr
|
aryl hydrocarbon receptor |
| chr2_-_179704629 | 5.15 |
ENSRNOT00000083361
ENSRNOT00000077941 |
Gria2
|
glutamate ionotropic receptor AMPA type subunit 2 |
| chr3_-_134696654 | 5.14 |
ENSRNOT00000006454
|
Flrt3
|
fibronectin leucine rich transmembrane protein 3 |
| chr17_+_9596957 | 5.12 |
ENSRNOT00000017349
|
Fam193b
|
family with sequence similarity 193, member B |
| chr12_-_36555694 | 5.11 |
ENSRNOT00000001292
|
Aacs
|
acetoacetyl-CoA synthetase |
| chr14_-_14390699 | 5.05 |
ENSRNOT00000046639
|
Anxa3
|
annexin A3 |
| chr7_-_50278842 | 5.00 |
ENSRNOT00000088950
|
Syt1
|
synaptotagmin 1 |
| chr1_-_275876329 | 4.99 |
ENSRNOT00000047903
|
Gpam
|
glycerol-3-phosphate acyltransferase, mitochondrial |
| chr10_-_106976040 | 4.93 |
ENSRNOT00000003940
|
Socs3
|
suppressor of cytokine signaling 3 |
| chr8_-_62248013 | 4.89 |
ENSRNOT00000080012
ENSRNOT00000089602 |
Scamp5
|
secretory carrier membrane protein 5 |
| chr13_-_55173692 | 4.89 |
ENSRNOT00000064785
ENSRNOT00000029878 ENSRNOT00000029865 ENSRNOT00000060292 ENSRNOT00000000814 |
Ptprc
|
protein tyrosine phosphatase, receptor type, C |
| chr13_+_88265331 | 4.86 |
ENSRNOT00000031190
|
Ccdc190
|
coiled-coil domain containing 190 |
| chr6_+_73553210 | 4.74 |
ENSRNOT00000006562
|
Akap6
|
A-kinase anchoring protein 6 |
| chrX_+_43626480 | 4.72 |
ENSRNOT00000068078
|
Sat1
|
spermidine/spermine N1-acetyl transferase 1 |
| chrX_-_15620841 | 4.71 |
ENSRNOT00000085397
|
Praf2
|
PRA1 domain family, member 2 |
| chr5_+_151436464 | 4.70 |
ENSRNOT00000012463
|
Map3k6
|
mitogen-activated protein kinase kinase kinase 6 |
| chrX_+_111122552 | 4.66 |
ENSRNOT00000083566
ENSRNOT00000085078 ENSRNOT00000090928 |
Cldn2
|
claudin 2 |
| chr1_+_87790104 | 4.65 |
ENSRNOT00000074580
|
LOC103690114
|
zinc finger protein 383-like |
| chr6_-_1454480 | 4.64 |
ENSRNOT00000072810
|
Eif2ak2
|
eukaryotic translation initiation factor 2-alpha kinase 2 |
| chrX_-_74968405 | 4.63 |
ENSRNOT00000035653
|
RGD1561931
|
similar to KIAA2022 protein |
| chr10_+_65805860 | 4.54 |
ENSRNOT00000011795
|
Ift20
|
intraflagellar transport 20 |
| chr5_+_74766636 | 4.48 |
ENSRNOT00000030913
|
Rn50_5_0791.1
|
|
| chr2_+_53109684 | 4.45 |
ENSRNOT00000086590
|
Selenop
|
selenoprotein P |
| chr11_-_64421248 | 4.43 |
ENSRNOT00000066997
|
Igsf11
|
immunoglobulin superfamily, member 11 |
| chr4_+_100277391 | 4.40 |
ENSRNOT00000086820
ENSRNOT00000084281 ENSRNOT00000017927 |
Ggcx
|
gamma-glutamyl carboxylase |
| chr1_+_15799853 | 4.35 |
ENSRNOT00000078589
|
Bclaf1
|
BCL2-associated transcription factor 1 |
| chr5_-_155258392 | 4.34 |
ENSRNOT00000017065
|
C1qc
|
complement C1q C chain |
| chr12_+_21678580 | 4.31 |
ENSRNOT00000039797
|
LOC100910669
|
paired immunoglobulin-like type 2 receptor alpha-like |
| chr10_-_65805693 | 4.30 |
ENSRNOT00000012245
|
Tnfaip1
|
TNF alpha induced protein 1 |
| chr7_+_16404755 | 4.29 |
ENSRNOT00000044977
|
LOC108349290
|
olfactory receptor 6C70-like |
| chr20_+_3156170 | 4.25 |
ENSRNOT00000082880
|
RT1-S2
|
RT1 class Ib, locus S2 |
| chr12_+_42343123 | 4.25 |
ENSRNOT00000043279
|
Oas1i
|
2 ' -5 ' oligoadenylate synthetase 1I |
| chr2_-_61414038 | 4.24 |
ENSRNOT00000051910
ENSRNOT00000088202 |
Tars
|
threonyl-tRNA synthetase |
| chr18_+_35489274 | 4.15 |
ENSRNOT00000073952
ENSRNOT00000076060 |
Dcp2
|
decapping mRNA 2 |
| chr7_-_117151694 | 4.13 |
ENSRNOT00000051294
|
Nrbp2
|
nuclear receptor binding protein 2 |
| chr14_+_84465515 | 4.13 |
ENSRNOT00000035591
|
Osm
|
oncostatin M |
| chr7_-_117151256 | 4.13 |
ENSRNOT00000078846
|
Nrbp2
|
nuclear receptor binding protein 2 |
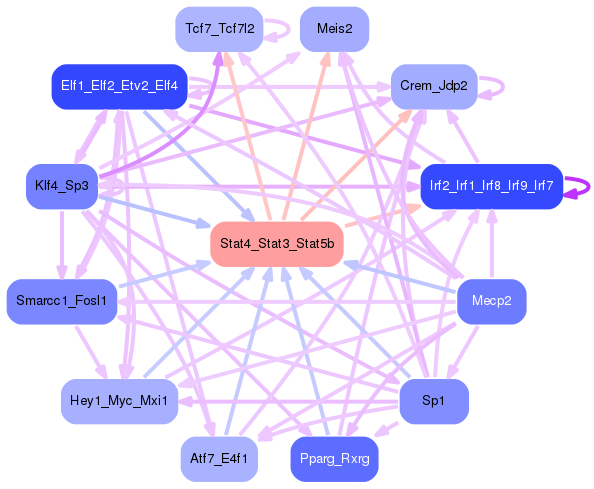
Network of associatons between targets according to the STRING database.

First level regulatory network of Stat4_Stat3_Stat5b
Gene Ontology Analysis
Gene overrepresentation in biological process category:
| Log-likelihood per target | Total log-likelihood | Term | Description |
|---|---|---|---|
| 23.4 | 70.2 | GO:0003051 | ovarian follicle rupture(GO:0001543) angiotensin mediated vasoconstriction involved in regulation of systemic arterial blood pressure(GO:0001998) angiotensin-mediated drinking behavior(GO:0003051) regulation of extracellular matrix constituent secretion(GO:0003330) positive regulation of extracellular matrix constituent secretion(GO:0003331) positive regulation of gap junction assembly(GO:1903598) |
| 12.0 | 60.0 | GO:0043152 | induction of bacterial agglutination(GO:0043152) |
| 7.4 | 29.7 | GO:0060335 | positive regulation of response to interferon-gamma(GO:0060332) positive regulation of interferon-gamma-mediated signaling pathway(GO:0060335) |
| 6.6 | 19.9 | GO:1903002 | regulation of lipid transport across blood brain barrier(GO:1903000) positive regulation of lipid transport across blood brain barrier(GO:1903002) |
| 6.6 | 19.7 | GO:0071623 | negative regulation of granulocyte chemotaxis(GO:0071623) negative regulation of neutrophil chemotaxis(GO:0090024) |
| 6.4 | 31.8 | GO:0046813 | receptor-mediated virion attachment to host cell(GO:0046813) |
| 5.9 | 29.7 | GO:0015679 | plasma membrane copper ion transport(GO:0015679) |
| 5.9 | 17.8 | GO:0060545 | positive regulation of necroptotic process(GO:0060545) |
| 5.4 | 10.7 | GO:0060003 | copper ion export(GO:0060003) |
| 5.3 | 106.9 | GO:0042730 | fibrinolysis(GO:0042730) |
| 5.2 | 15.7 | GO:1903165 | response to polycyclic arene(GO:1903165) |
| 5.1 | 20.5 | GO:2001199 | negative regulation of dendritic cell differentiation(GO:2001199) |
| 5.1 | 15.3 | GO:1905204 | negative regulation of connective tissue replacement(GO:1905204) |
| 5.1 | 20.2 | GO:1903413 | negative regulation of iron ion transmembrane transport(GO:0034760) cellular response to bile acid(GO:1903413) |
| 4.9 | 44.5 | GO:0061302 | smooth muscle cell-matrix adhesion(GO:0061302) |
| 4.5 | 13.4 | GO:0060697 | positive regulation of phospholipid catabolic process(GO:0060697) |
| 4.3 | 13.0 | GO:0060300 | regulation of cytokine activity(GO:0060300) negative regulation of sensory perception of pain(GO:1904057) |
| 3.9 | 7.8 | GO:0071307 | cellular response to vitamin K(GO:0071307) |
| 3.8 | 11.5 | GO:0045590 | negative regulation of regulatory T cell differentiation(GO:0045590) |
| 3.7 | 33.6 | GO:0002329 | pre-B cell differentiation(GO:0002329) |
| 3.7 | 11.1 | GO:0045959 | negative regulation of complement activation, classical pathway(GO:0045959) |
| 3.5 | 115.9 | GO:0030212 | hyaluronan metabolic process(GO:0030212) |
| 3.4 | 16.8 | GO:0006526 | arginine biosynthetic process(GO:0006526) |
| 3.2 | 9.5 | GO:1901252 | regulation of intracellular transport of viral material(GO:1901252) |
| 3.0 | 9.1 | GO:0097089 | methyl-branched fatty acid metabolic process(GO:0097089) |
| 2.9 | 11.5 | GO:0023021 | termination of signal transduction(GO:0023021) |
| 2.8 | 8.4 | GO:0046968 | cytosol to ER transport(GO:0046967) peptide antigen transport(GO:0046968) |
| 2.4 | 14.4 | GO:0021759 | globus pallidus development(GO:0021759) |
| 2.4 | 9.5 | GO:0032696 | negative regulation of interleukin-13 production(GO:0032696) |
| 2.4 | 11.8 | GO:0050828 | regulation of liquid surface tension(GO:0050828) |
| 2.3 | 7.0 | GO:2000338 | chemokine (C-X-C motif) ligand 1 production(GO:0072566) regulation of chemokine (C-X-C motif) ligand 1 production(GO:2000338) |
| 2.3 | 6.9 | GO:0010909 | regulation of heparan sulfate proteoglycan biosynthetic process(GO:0010908) positive regulation of heparan sulfate proteoglycan biosynthetic process(GO:0010909) |
| 2.2 | 8.9 | GO:0050713 | negative regulation of interleukin-1 beta secretion(GO:0050713) positive regulation of T-helper 17 type immune response(GO:2000318) |
| 2.2 | 13.1 | GO:0060763 | mammary duct terminal end bud growth(GO:0060763) |
| 2.0 | 27.8 | GO:0010838 | positive regulation of keratinocyte proliferation(GO:0010838) |
| 1.9 | 9.7 | GO:0061364 | negative regulation of negative chemotaxis(GO:0050925) apoptotic process involved in luteolysis(GO:0061364) |
| 1.9 | 24.9 | GO:0001867 | complement activation, lectin pathway(GO:0001867) |
| 1.9 | 3.8 | GO:0032079 | positive regulation of endodeoxyribonuclease activity(GO:0032079) |
| 1.9 | 7.6 | GO:0072719 | cellular response to cisplatin(GO:0072719) |
| 1.9 | 11.3 | GO:0051365 | cellular response to potassium ion starvation(GO:0051365) |
| 1.9 | 9.3 | GO:0089700 | protein kinase D signaling(GO:0089700) |
| 1.9 | 5.6 | GO:0019303 | D-ribose catabolic process(GO:0019303) |
| 1.7 | 5.2 | GO:0006436 | tryptophanyl-tRNA aminoacylation(GO:0006436) |
| 1.7 | 3.5 | GO:0001788 | antibody-dependent cellular cytotoxicity(GO:0001788) |
| 1.6 | 4.9 | GO:0001915 | negative regulation of T cell mediated cytotoxicity(GO:0001915) |
| 1.5 | 8.9 | GO:0032929 | negative regulation of superoxide anion generation(GO:0032929) |
| 1.5 | 10.2 | GO:0006477 | protein sulfation(GO:0006477) |
| 1.4 | 8.5 | GO:1904714 | regulation of chaperone-mediated autophagy(GO:1904714) |
| 1.4 | 4.2 | GO:0006435 | threonyl-tRNA aminoacylation(GO:0006435) |
| 1.4 | 5.6 | GO:1901423 | response to benzene(GO:1901423) |
| 1.4 | 14.0 | GO:0006957 | complement activation, alternative pathway(GO:0006957) |
| 1.4 | 5.5 | GO:0007296 | vitellogenesis(GO:0007296) |
| 1.4 | 12.3 | GO:0071220 | response to bacterial lipopeptide(GO:0070339) cellular response to bacterial lipoprotein(GO:0071220) cellular response to bacterial lipopeptide(GO:0071221) response to diacyl bacterial lipopeptide(GO:0071724) cellular response to diacyl bacterial lipopeptide(GO:0071726) positive regulation of interleukin-8 secretion(GO:2000484) |
| 1.3 | 5.4 | GO:0006419 | alanyl-tRNA aminoacylation(GO:0006419) |
| 1.3 | 5.2 | GO:0040009 | regulation of growth rate(GO:0040009) |
| 1.3 | 7.7 | GO:1903361 | protein localization to basolateral plasma membrane(GO:1903361) |
| 1.2 | 13.3 | GO:0006707 | cholesterol catabolic process(GO:0006707) sterol catabolic process(GO:0016127) |
| 1.2 | 3.6 | GO:0002462 | tolerance induction to nonself antigen(GO:0002462) |
| 1.2 | 19.0 | GO:0006958 | complement activation, classical pathway(GO:0006958) |
| 1.2 | 4.7 | GO:1902261 | positive regulation of delayed rectifier potassium channel activity(GO:1902261) |
| 1.2 | 4.7 | GO:0032919 | spermine acetylation(GO:0032919) |
| 1.2 | 14.1 | GO:0010579 | regulation of adenylate cyclase activity involved in G-protein coupled receptor signaling pathway(GO:0010578) positive regulation of adenylate cyclase activity involved in G-protein coupled receptor signaling pathway(GO:0010579) |
| 1.2 | 3.5 | GO:0003221 | right ventricular cardiac muscle tissue morphogenesis(GO:0003221) |
| 1.2 | 39.3 | GO:0001953 | negative regulation of cell-matrix adhesion(GO:0001953) |
| 1.1 | 9.1 | GO:0045162 | clustering of voltage-gated sodium channels(GO:0045162) |
| 1.1 | 3.4 | GO:0000915 | assembly of actomyosin apparatus involved in cytokinesis(GO:0000912) actomyosin contractile ring assembly(GO:0000915) actomyosin contractile ring organization(GO:0044837) |
| 1.1 | 4.4 | GO:0018214 | peptidyl-glutamic acid carboxylation(GO:0017187) protein carboxylation(GO:0018214) |
| 1.1 | 23.9 | GO:0030574 | collagen catabolic process(GO:0030574) |
| 1.1 | 5.3 | GO:0046477 | glycosylceramide catabolic process(GO:0046477) |
| 1.1 | 2.1 | GO:0070560 | protein secretion by platelet(GO:0070560) |
| 1.0 | 4.1 | GO:0038165 | oncostatin-M-mediated signaling pathway(GO:0038165) |
| 1.0 | 13.1 | GO:0048245 | eosinophil chemotaxis(GO:0048245) |
| 1.0 | 3.0 | GO:1900060 | negative regulation of ceramide biosynthetic process(GO:1900060) |
| 1.0 | 4.9 | GO:0060708 | spongiotrophoblast differentiation(GO:0060708) |
| 1.0 | 10.7 | GO:0072606 | interleukin-8 secretion(GO:0072606) |
| 1.0 | 25.2 | GO:0034340 | response to type I interferon(GO:0034340) |
| 1.0 | 11.5 | GO:0042178 | xenobiotic catabolic process(GO:0042178) |
| 1.0 | 3.8 | GO:1903371 | regulation of endoplasmic reticulum tubular network organization(GO:1903371) |
| 0.9 | 3.8 | GO:0010499 | proteasomal ubiquitin-independent protein catabolic process(GO:0010499) |
| 0.9 | 4.6 | GO:0042276 | error-prone translesion synthesis(GO:0042276) |
| 0.9 | 12.8 | GO:0031340 | positive regulation of vesicle fusion(GO:0031340) |
| 0.9 | 4.5 | GO:0015780 | nucleotide-sugar transport(GO:0015780) |
| 0.9 | 1.8 | GO:0097018 | renal albumin absorption(GO:0097018) regulation of renal albumin absorption(GO:2000532) |
| 0.9 | 30.5 | GO:0035458 | cellular response to interferon-beta(GO:0035458) |
| 0.9 | 11.1 | GO:0038094 | Fc-gamma receptor signaling pathway(GO:0038094) |
| 0.9 | 5.1 | GO:0034201 | response to oleic acid(GO:0034201) |
| 0.8 | 5.9 | GO:0070269 | pyroptosis(GO:0070269) |
| 0.8 | 8.5 | GO:0048280 | vesicle fusion with Golgi apparatus(GO:0048280) |
| 0.8 | 5.7 | GO:0051890 | regulation of cardioblast differentiation(GO:0051890) |
| 0.8 | 13.0 | GO:0001887 | selenium compound metabolic process(GO:0001887) |
| 0.8 | 1.6 | GO:1903588 | negative regulation of blood vessel endothelial cell proliferation involved in sprouting angiogenesis(GO:1903588) |
| 0.8 | 1.6 | GO:0061341 | non-canonical Wnt signaling pathway involved in heart development(GO:0061341) planar cell polarity pathway involved in heart morphogenesis(GO:0061346) |
| 0.8 | 10.9 | GO:0036092 | phosphatidylinositol-3-phosphate biosynthetic process(GO:0036092) |
| 0.8 | 6.2 | GO:0061193 | taste bud development(GO:0061193) |
| 0.8 | 6.9 | GO:0006703 | estrogen biosynthetic process(GO:0006703) |
| 0.8 | 1.5 | GO:0048691 | positive regulation of sprouting of injured axon(GO:0048687) positive regulation of axon extension involved in regeneration(GO:0048691) |
| 0.7 | 1.5 | GO:0010724 | regulation of definitive erythrocyte differentiation(GO:0010724) |
| 0.7 | 3.0 | GO:0006420 | arginyl-tRNA aminoacylation(GO:0006420) |
| 0.7 | 5.2 | GO:1902036 | regulation of hematopoietic stem cell differentiation(GO:1902036) |
| 0.7 | 8.1 | GO:0060012 | synaptic transmission, glycinergic(GO:0060012) |
| 0.7 | 2.8 | GO:0014028 | positive regulation of transcription from RNA polymerase II promoter involved in myocardial precursor cell differentiation(GO:0003257) notochord formation(GO:0014028) |
| 0.7 | 5.6 | GO:0051835 | positive regulation of synapse structural plasticity(GO:0051835) |
| 0.7 | 1.4 | GO:0018312 | peptidyl-serine ADP-ribosylation(GO:0018312) |
| 0.7 | 2.0 | GO:0006431 | methionyl-tRNA aminoacylation(GO:0006431) |
| 0.7 | 5.4 | GO:0006269 | DNA replication, synthesis of RNA primer(GO:0006269) |
| 0.7 | 10.8 | GO:0006744 | ubiquinone biosynthetic process(GO:0006744) quinone biosynthetic process(GO:1901663) |
| 0.7 | 14.1 | GO:0006491 | N-glycan processing(GO:0006491) |
| 0.7 | 0.7 | GO:0046103 | inosine biosynthetic process(GO:0046103) |
| 0.6 | 1.9 | GO:0044240 | multicellular organism lipid catabolic process(GO:0044240) |
| 0.6 | 5.1 | GO:0003344 | pericardium morphogenesis(GO:0003344) |
| 0.6 | 3.2 | GO:0007207 | adenylate cyclase-inhibiting G-protein coupled acetylcholine receptor signaling pathway(GO:0007197) phospholipase C-activating G-protein coupled acetylcholine receptor signaling pathway(GO:0007207) |
| 0.6 | 1.3 | GO:0060369 | positive regulation of Fc receptor mediated stimulatory signaling pathway(GO:0060369) |
| 0.6 | 3.8 | GO:0048539 | bone marrow development(GO:0048539) |
| 0.6 | 7.5 | GO:0031915 | positive regulation of synaptic plasticity(GO:0031915) |
| 0.6 | 1.8 | GO:1901740 | negative regulation of myoblast fusion(GO:1901740) |
| 0.6 | 1.8 | GO:0002949 | tRNA threonylcarbamoyladenosine modification(GO:0002949) |
| 0.6 | 1.8 | GO:0032197 | transposition, RNA-mediated(GO:0032197) |
| 0.6 | 4.1 | GO:0000972 | transcription-dependent tethering of RNA polymerase II gene DNA at nuclear periphery(GO:0000972) |
| 0.6 | 1.8 | GO:1901097 | negative regulation of autophagosome maturation(GO:1901097) |
| 0.6 | 2.3 | GO:0019262 | N-acetylneuraminate catabolic process(GO:0019262) |
| 0.6 | 2.2 | GO:0090289 | regulation of osteoclast proliferation(GO:0090289) positive regulation of osteoclast proliferation(GO:0090290) |
| 0.6 | 5.0 | GO:0070235 | CDP-diacylglycerol biosynthetic process(GO:0016024) regulation of activation-induced cell death of T cells(GO:0070235) negative regulation of activation-induced cell death of T cells(GO:0070236) |
| 0.6 | 2.2 | GO:0003284 | septum primum development(GO:0003284) |
| 0.6 | 2.8 | GO:2000327 | positive regulation of ligand-dependent nuclear receptor transcription coactivator activity(GO:2000327) |
| 0.5 | 0.5 | GO:0045917 | positive regulation of complement activation(GO:0045917) positive regulation of protein activation cascade(GO:2000259) |
| 0.5 | 2.2 | GO:0060298 | positive regulation of sarcomere organization(GO:0060298) |
| 0.5 | 13.7 | GO:0030220 | platelet formation(GO:0030220) |
| 0.5 | 2.2 | GO:0006172 | ADP biosynthetic process(GO:0006172) |
| 0.5 | 2.1 | GO:0000393 | spliceosomal conformational changes to generate catalytic conformation(GO:0000393) |
| 0.5 | 2.1 | GO:0051562 | negative regulation of mitochondrial calcium ion concentration(GO:0051562) |
| 0.5 | 4.7 | GO:0034134 | toll-like receptor 2 signaling pathway(GO:0034134) |
| 0.5 | 1.6 | GO:0038091 | VEGF-activated platelet-derived growth factor receptor signaling pathway(GO:0038086) positive regulation of cell proliferation by VEGF-activated platelet derived growth factor receptor signaling pathway(GO:0038091) |
| 0.5 | 2.1 | GO:1904059 | regulation of locomotor rhythm(GO:1904059) |
| 0.5 | 7.6 | GO:0044130 | negative regulation of growth of symbiont in host(GO:0044130) negative regulation of growth of symbiont involved in interaction with host(GO:0044146) |
| 0.5 | 2.0 | GO:0050812 | regulation of acetyl-CoA biosynthetic process from pyruvate(GO:0010510) regulation of acyl-CoA biosynthetic process(GO:0050812) |
| 0.5 | 1.9 | GO:0034486 | vacuolar transmembrane transport(GO:0034486) chaperone-mediated protein transport involved in chaperone-mediated autophagy(GO:0061741) |
| 0.5 | 10.6 | GO:1903846 | positive regulation of transforming growth factor beta receptor signaling pathway(GO:0030511) positive regulation of cellular response to transforming growth factor beta stimulus(GO:1903846) |
| 0.5 | 5.5 | GO:0046485 | ether lipid metabolic process(GO:0046485) |
| 0.4 | 5.9 | GO:0051934 | dopamine uptake involved in synaptic transmission(GO:0051583) catecholamine uptake involved in synaptic transmission(GO:0051934) |
| 0.4 | 4.5 | GO:0035845 | photoreceptor cell outer segment organization(GO:0035845) |
| 0.4 | 8.9 | GO:0031290 | retinal ganglion cell axon guidance(GO:0031290) |
| 0.4 | 1.2 | GO:0032747 | positive regulation of interleukin-23 production(GO:0032747) |
| 0.4 | 3.6 | GO:0032695 | negative regulation of interleukin-12 production(GO:0032695) |
| 0.4 | 15.3 | GO:0006687 | glycosphingolipid metabolic process(GO:0006687) |
| 0.4 | 2.7 | GO:0090232 | positive regulation of spindle checkpoint(GO:0090232) positive regulation of mitotic cell cycle spindle assembly checkpoint(GO:0090267) |
| 0.4 | 2.7 | GO:0019348 | dolichol metabolic process(GO:0019348) |
| 0.4 | 8.7 | GO:0010575 | positive regulation of vascular endothelial growth factor production(GO:0010575) |
| 0.4 | 4.2 | GO:0000290 | deadenylation-dependent decapping of nuclear-transcribed mRNA(GO:0000290) |
| 0.4 | 1.5 | GO:0071409 | cellular response to cycloheximide(GO:0071409) |
| 0.4 | 0.7 | GO:1990859 | response to endothelin(GO:1990839) cellular response to endothelin(GO:1990859) |
| 0.4 | 38.5 | GO:0031638 | zymogen activation(GO:0031638) |
| 0.4 | 1.1 | GO:0033385 | geranylgeranyl diphosphate metabolic process(GO:0033385) geranylgeranyl diphosphate biosynthetic process(GO:0033386) |
| 0.4 | 1.1 | GO:0070682 | proteasome regulatory particle assembly(GO:0070682) |
| 0.3 | 3.4 | GO:0009650 | UV protection(GO:0009650) |
| 0.3 | 1.7 | GO:1903237 | negative regulation of leukocyte tethering or rolling(GO:1903237) |
| 0.3 | 1.7 | GO:0031547 | brain-derived neurotrophic factor receptor signaling pathway(GO:0031547) |
| 0.3 | 3.1 | GO:0070863 | positive regulation of protein exit from endoplasmic reticulum(GO:0070863) |
| 0.3 | 9.3 | GO:0016242 | negative regulation of macroautophagy(GO:0016242) |
| 0.3 | 8.0 | GO:0014850 | response to muscle activity(GO:0014850) |
| 0.3 | 5.2 | GO:0060992 | response to fungicide(GO:0060992) |
| 0.3 | 3.8 | GO:0043312 | neutrophil degranulation(GO:0043312) |
| 0.3 | 2.3 | GO:0051694 | pointed-end actin filament capping(GO:0051694) |
| 0.3 | 2.6 | GO:0007258 | JUN phosphorylation(GO:0007258) |
| 0.3 | 7.8 | GO:2001224 | positive regulation of neuron migration(GO:2001224) |
| 0.3 | 1.2 | GO:1900227 | positive regulation of NLRP3 inflammasome complex assembly(GO:1900227) |
| 0.3 | 2.3 | GO:0035855 | megakaryocyte development(GO:0035855) |
| 0.3 | 1.4 | GO:0090131 | mesenchyme migration(GO:0090131) |
| 0.3 | 1.7 | GO:0045630 | positive regulation of T-helper 2 cell differentiation(GO:0045630) |
| 0.3 | 1.4 | GO:0052055 | modulation by symbiont of host molecular function(GO:0052055) |
| 0.3 | 3.5 | GO:0016973 | poly(A)+ mRNA export from nucleus(GO:0016973) |
| 0.3 | 0.8 | GO:0090071 | negative regulation of ribosome biogenesis(GO:0090071) |
| 0.3 | 10.2 | GO:0006695 | cholesterol biosynthetic process(GO:0006695) |
| 0.3 | 3.3 | GO:0016338 | calcium-independent cell-cell adhesion via plasma membrane cell-adhesion molecules(GO:0016338) |
| 0.3 | 1.5 | GO:0034475 | U4 snRNA 3'-end processing(GO:0034475) DNA deamination(GO:0045006) polyadenylation-dependent snoRNA 3'-end processing(GO:0071051) |
| 0.2 | 1.5 | GO:0016081 | synaptic vesicle docking(GO:0016081) |
| 0.2 | 3.0 | GO:0030388 | fructose 1,6-bisphosphate metabolic process(GO:0030388) |
| 0.2 | 16.1 | GO:0000186 | activation of MAPKK activity(GO:0000186) |
| 0.2 | 14.1 | GO:0008542 | visual learning(GO:0008542) |
| 0.2 | 2.0 | GO:0051182 | coenzyme transport(GO:0051182) |
| 0.2 | 5.7 | GO:0095500 | acetylcholine receptor signaling pathway(GO:0095500) signal transduction involved in cellular response to ammonium ion(GO:1903831) response to acetylcholine(GO:1905144) cellular response to acetylcholine(GO:1905145) |
| 0.2 | 0.9 | GO:0014835 | myoblast differentiation involved in skeletal muscle regeneration(GO:0014835) |
| 0.2 | 1.6 | GO:0014831 | intestine smooth muscle contraction(GO:0014827) gastro-intestinal system smooth muscle contraction(GO:0014831) |
| 0.2 | 0.7 | GO:0070200 | establishment of protein localization to telomere(GO:0070200) |
| 0.2 | 0.5 | GO:0006824 | cobalt ion transport(GO:0006824) |
| 0.2 | 1.3 | GO:0021764 | amygdala development(GO:0021764) |
| 0.2 | 1.9 | GO:0000055 | ribosomal large subunit export from nucleus(GO:0000055) |
| 0.2 | 49.9 | GO:0010951 | negative regulation of endopeptidase activity(GO:0010951) |
| 0.2 | 0.8 | GO:0002386 | immune response in mucosal-associated lymphoid tissue(GO:0002386) |
| 0.2 | 17.0 | GO:0009062 | fatty acid catabolic process(GO:0009062) |
| 0.2 | 1.9 | GO:2001054 | negative regulation of mesenchymal cell apoptotic process(GO:2001054) |
| 0.2 | 0.8 | GO:2000393 | negative regulation of lamellipodium morphogenesis(GO:2000393) |
| 0.2 | 1.7 | GO:0032836 | glomerular basement membrane development(GO:0032836) |
| 0.2 | 4.9 | GO:0045956 | positive regulation of calcium ion-dependent exocytosis(GO:0045956) |
| 0.2 | 6.5 | GO:0042572 | retinol metabolic process(GO:0042572) |
| 0.2 | 1.5 | GO:0002087 | regulation of respiratory gaseous exchange by neurological system process(GO:0002087) |
| 0.2 | 12.0 | GO:0051965 | positive regulation of synapse assembly(GO:0051965) |
| 0.2 | 0.9 | GO:0010606 | positive regulation of cytoplasmic mRNA processing body assembly(GO:0010606) |
| 0.2 | 4.9 | GO:0071577 | zinc II ion transmembrane transport(GO:0071577) |
| 0.2 | 0.7 | GO:0032485 | regulation of Ral protein signal transduction(GO:0032485) |
| 0.2 | 1.1 | GO:0030321 | transepithelial chloride transport(GO:0030321) |
| 0.2 | 5.7 | GO:0006749 | glutathione metabolic process(GO:0006749) |
| 0.2 | 0.7 | GO:0016198 | axon choice point recognition(GO:0016198) |
| 0.2 | 0.2 | GO:0035280 | miRNA loading onto RISC involved in gene silencing by miRNA(GO:0035280) |
| 0.2 | 2.6 | GO:0070584 | mitochondrion morphogenesis(GO:0070584) |
| 0.2 | 2.0 | GO:0007097 | nuclear migration(GO:0007097) |
| 0.2 | 1.5 | GO:0071688 | striated muscle myosin thick filament assembly(GO:0071688) |
| 0.2 | 2.9 | GO:0042753 | positive regulation of circadian rhythm(GO:0042753) |
| 0.2 | 1.3 | GO:0009235 | cobalamin metabolic process(GO:0009235) |
| 0.2 | 6.1 | GO:0002474 | antigen processing and presentation of peptide antigen via MHC class I(GO:0002474) |
| 0.2 | 0.6 | GO:0032713 | negative regulation of interleukin-4 production(GO:0032713) |
| 0.2 | 3.0 | GO:0032728 | positive regulation of interferon-beta production(GO:0032728) |
| 0.2 | 1.2 | GO:1904116 | CDP-choline pathway(GO:0006657) response to vasopressin(GO:1904116) |
| 0.1 | 0.4 | GO:0070127 | tRNA aminoacylation for mitochondrial protein translation(GO:0070127) |
| 0.1 | 3.4 | GO:1903861 | positive regulation of dendrite extension(GO:1903861) |
| 0.1 | 1.5 | GO:0034720 | histone H3-K4 demethylation(GO:0034720) |
| 0.1 | 3.8 | GO:0030488 | tRNA methylation(GO:0030488) |
| 0.1 | 3.8 | GO:0001580 | detection of chemical stimulus involved in sensory perception of bitter taste(GO:0001580) |
| 0.1 | 0.8 | GO:0042796 | snRNA transcription from RNA polymerase III promoter(GO:0042796) |
| 0.1 | 0.8 | GO:0015791 | polyol transport(GO:0015791) |
| 0.1 | 0.5 | GO:0071025 | RNA surveillance(GO:0071025) |
| 0.1 | 4.4 | GO:0042088 | T-helper 1 type immune response(GO:0042088) |
| 0.1 | 1.7 | GO:0046339 | diacylglycerol metabolic process(GO:0046339) |
| 0.1 | 5.7 | GO:0046928 | regulation of neurotransmitter secretion(GO:0046928) |
| 0.1 | 5.6 | GO:0000413 | protein peptidyl-prolyl isomerization(GO:0000413) |
| 0.1 | 0.4 | GO:1903800 | positive regulation of production of miRNAs involved in gene silencing by miRNA(GO:1903800) |
| 0.1 | 4.9 | GO:0010633 | negative regulation of epithelial cell migration(GO:0010633) |
| 0.1 | 0.7 | GO:0061737 | leukotriene signaling pathway(GO:0061737) |
| 0.1 | 0.7 | GO:0006398 | mRNA 3'-end processing by stem-loop binding and cleavage(GO:0006398) |
| 0.1 | 4.3 | GO:0046839 | phospholipid dephosphorylation(GO:0046839) |
| 0.1 | 4.7 | GO:0010501 | RNA secondary structure unwinding(GO:0010501) |
| 0.1 | 0.7 | GO:0015808 | L-alanine transport(GO:0015808) |
| 0.1 | 2.3 | GO:0010591 | regulation of lamellipodium assembly(GO:0010591) |
| 0.1 | 3.1 | GO:1904659 | hexose transmembrane transport(GO:0035428) glucose transmembrane transport(GO:1904659) |
| 0.1 | 1.9 | GO:0043030 | regulation of macrophage activation(GO:0043030) |
| 0.1 | 1.7 | GO:0080182 | histone H3-K4 trimethylation(GO:0080182) |
| 0.1 | 2.3 | GO:0009214 | cyclic nucleotide catabolic process(GO:0009214) |
| 0.1 | 0.8 | GO:0055059 | asymmetric neuroblast division(GO:0055059) |
| 0.1 | 5.0 | GO:0019882 | antigen processing and presentation(GO:0019882) |
| 0.1 | 2.4 | GO:0031116 | positive regulation of microtubule polymerization(GO:0031116) |
| 0.1 | 2.9 | GO:0007214 | gamma-aminobutyric acid signaling pathway(GO:0007214) |
| 0.1 | 0.5 | GO:0015074 | DNA integration(GO:0015074) |
| 0.1 | 1.7 | GO:0045948 | positive regulation of translational initiation(GO:0045948) |
| 0.1 | 0.7 | GO:0010867 | positive regulation of triglyceride biosynthetic process(GO:0010867) |
| 0.1 | 1.6 | GO:0001964 | startle response(GO:0001964) |
| 0.1 | 1.1 | GO:0046519 | sphingoid metabolic process(GO:0046519) |
| 0.1 | 4.0 | GO:0071277 | cellular response to calcium ion(GO:0071277) |
| 0.1 | 5.1 | GO:0003073 | regulation of systemic arterial blood pressure(GO:0003073) |
| 0.1 | 1.8 | GO:0032012 | regulation of ARF protein signal transduction(GO:0032012) |
| 0.1 | 1.7 | GO:0006904 | vesicle docking involved in exocytosis(GO:0006904) |
| 0.1 | 9.3 | GO:0051607 | defense response to virus(GO:0051607) |
| 0.1 | 0.8 | GO:0007183 | SMAD protein complex assembly(GO:0007183) |
| 0.1 | 8.7 | GO:0001764 | neuron migration(GO:0001764) |
| 0.1 | 0.6 | GO:0007000 | nucleolus organization(GO:0007000) |
| 0.1 | 0.7 | GO:0044872 | lipoprotein transport(GO:0042953) lipoprotein localization(GO:0044872) |
| 0.1 | 0.7 | GO:0060670 | branching involved in labyrinthine layer morphogenesis(GO:0060670) |
| 0.1 | 1.3 | GO:0048266 | behavioral response to pain(GO:0048266) |
| 0.1 | 1.6 | GO:0034314 | Arp2/3 complex-mediated actin nucleation(GO:0034314) |
| 0.1 | 0.5 | GO:0018230 | peptidyl-L-cysteine S-palmitoylation(GO:0018230) peptidyl-S-diacylglycerol-L-cysteine biosynthetic process from peptidyl-cysteine(GO:0018231) |
| 0.1 | 3.1 | GO:0033209 | tumor necrosis factor-mediated signaling pathway(GO:0033209) |
| 0.1 | 0.6 | GO:0097094 | craniofacial suture morphogenesis(GO:0097094) |
| 0.1 | 1.9 | GO:0043550 | regulation of lipid kinase activity(GO:0043550) |
| 0.1 | 1.9 | GO:0021522 | spinal cord motor neuron differentiation(GO:0021522) |
| 0.1 | 4.9 | GO:0045740 | positive regulation of DNA replication(GO:0045740) |
| 0.1 | 1.2 | GO:0006270 | DNA replication initiation(GO:0006270) |
| 0.1 | 0.4 | GO:0001865 | NK T cell differentiation(GO:0001865) |
| 0.1 | 2.5 | GO:0031338 | regulation of vesicle fusion(GO:0031338) |
| 0.1 | 1.6 | GO:0030835 | negative regulation of actin filament depolymerization(GO:0030835) |
| 0.0 | 6.4 | GO:0016485 | protein processing(GO:0016485) |
| 0.0 | 1.2 | GO:0031297 | replication fork processing(GO:0031297) |
| 0.0 | 1.1 | GO:0000027 | ribosomal large subunit assembly(GO:0000027) |
| 0.0 | 0.1 | GO:0036066 | protein O-linked fucosylation(GO:0036066) |
| 0.0 | 1.7 | GO:0000462 | maturation of SSU-rRNA from tricistronic rRNA transcript (SSU-rRNA, 5.8S rRNA, LSU-rRNA)(GO:0000462) |
| 0.0 | 0.2 | GO:1990928 | response to amino acid starvation(GO:1990928) |
| 0.0 | 0.1 | GO:1905216 | positive regulation of mRNA binding(GO:1902416) positive regulation of RNA binding(GO:1905216) |
| 0.0 | 1.0 | GO:0006376 | mRNA splice site selection(GO:0006376) |
| 0.0 | 0.3 | GO:0021516 | dorsal spinal cord development(GO:0021516) |
| 0.0 | 0.4 | GO:0000185 | activation of MAPKKK activity(GO:0000185) |
| 0.0 | 2.5 | GO:0006165 | nucleoside diphosphate phosphorylation(GO:0006165) |
| 0.0 | 0.5 | GO:0035196 | dsRNA fragmentation(GO:0031050) production of miRNAs involved in gene silencing by miRNA(GO:0035196) production of small RNA involved in gene silencing by RNA(GO:0070918) |
| 0.0 | 0.7 | GO:0031935 | regulation of chromatin silencing(GO:0031935) |
| 0.0 | 2.7 | GO:0010921 | regulation of phosphatase activity(GO:0010921) |
| 0.0 | 0.4 | GO:0006880 | intracellular sequestering of iron ion(GO:0006880) sequestering of iron ion(GO:0097577) |
| 0.0 | 0.8 | GO:0015701 | bicarbonate transport(GO:0015701) |
| 0.0 | 0.7 | GO:0006383 | transcription from RNA polymerase III promoter(GO:0006383) |
| 0.0 | 0.9 | GO:0000381 | regulation of alternative mRNA splicing, via spliceosome(GO:0000381) |
| 0.0 | 0.7 | GO:0070527 | platelet aggregation(GO:0070527) |
| 0.0 | 0.1 | GO:0048535 | lymph node development(GO:0048535) |
| 0.0 | 3.1 | GO:0000375 | RNA splicing, via transesterification reactions(GO:0000375) RNA splicing, via transesterification reactions with bulged adenosine as nucleophile(GO:0000377) mRNA splicing, via spliceosome(GO:0000398) |
| 0.0 | 1.0 | GO:0008033 | tRNA processing(GO:0008033) |
| 0.0 | 0.3 | GO:0048147 | negative regulation of fibroblast proliferation(GO:0048147) |
| 0.0 | 0.3 | GO:0008631 | intrinsic apoptotic signaling pathway in response to oxidative stress(GO:0008631) |
| 0.0 | 1.3 | GO:0007200 | phospholipase C-activating G-protein coupled receptor signaling pathway(GO:0007200) |
| 0.0 | 0.8 | GO:0090502 | RNA phosphodiester bond hydrolysis, endonucleolytic(GO:0090502) |
| 0.0 | 0.8 | GO:0042147 | retrograde transport, endosome to Golgi(GO:0042147) |
| 0.0 | 0.8 | GO:0007492 | endoderm development(GO:0007492) |
Gene overrepresentation in cellular component category:
| Log-likelihood per target | Total log-likelihood | Term | Description |
|---|---|---|---|
| 13.3 | 106.4 | GO:0005577 | fibrinogen complex(GO:0005577) |
| 7.4 | 44.5 | GO:0048237 | rough endoplasmic reticulum lumen(GO:0048237) |
| 5.6 | 33.3 | GO:0034363 | intermediate-density lipoprotein particle(GO:0034363) |
| 3.0 | 368.8 | GO:0072562 | blood microparticle(GO:0072562) |
| 2.5 | 12.3 | GO:0046696 | lipopolysaccharide receptor complex(GO:0046696) |
| 2.3 | 6.9 | GO:1990907 | beta-catenin-TCF complex(GO:1990907) |
| 2.2 | 17.8 | GO:0044194 | cytolytic granule(GO:0044194) |
| 2.1 | 8.5 | GO:0098574 | cytoplasmic side of lysosomal membrane(GO:0098574) |
| 2.1 | 12.8 | GO:0042584 | chromaffin granule membrane(GO:0042584) |
| 2.1 | 14.9 | GO:0072559 | NLRP3 inflammasome complex(GO:0072559) |
| 2.0 | 20.2 | GO:0045179 | apical cortex(GO:0045179) |
| 1.7 | 8.6 | GO:1990726 | Lsm1-7-Pat1 complex(GO:1990726) |
| 1.6 | 4.7 | GO:0014701 | junctional sarcoplasmic reticulum membrane(GO:0014701) |
| 1.2 | 7.5 | GO:0070033 | synaptobrevin 2-SNAP-25-syntaxin-1a-complexin II complex(GO:0070033) |
| 1.2 | 23.3 | GO:0042599 | lamellar body(GO:0042599) |
| 1.2 | 8.4 | GO:0042825 | TAP complex(GO:0042825) |
| 1.1 | 14.6 | GO:0005652 | nuclear lamina(GO:0005652) |
| 1.1 | 6.3 | GO:0042567 | insulin-like growth factor ternary complex(GO:0042567) |
| 1.0 | 42.3 | GO:0001772 | immunological synapse(GO:0001772) |
| 1.0 | 5.2 | GO:0034751 | aryl hydrocarbon receptor complex(GO:0034751) |
| 0.9 | 5.6 | GO:1990111 | spermatoproteasome complex(GO:1990111) |
| 0.8 | 2.3 | GO:0098982 | glycine-gated chloride channel complex(GO:0016935) GABA-ergic synapse(GO:0098982) |
| 0.7 | 3.0 | GO:0035339 | SPOTS complex(GO:0035339) |
| 0.7 | 11.1 | GO:0044215 | other organism(GO:0044215) other organism cell(GO:0044216) other organism part(GO:0044217) |
| 0.7 | 8.7 | GO:0008385 | IkappaB kinase complex(GO:0008385) |
| 0.7 | 18.0 | GO:0005640 | nuclear outer membrane(GO:0005640) |
| 0.7 | 2.1 | GO:0071006 | U2-type catalytic step 1 spliceosome(GO:0071006) |
| 0.7 | 8.4 | GO:0032279 | asymmetric synapse(GO:0032279) |
| 0.7 | 23.9 | GO:0030673 | axolemma(GO:0030673) |
| 0.7 | 9.5 | GO:0031045 | dense core granule(GO:0031045) |
| 0.7 | 5.4 | GO:0005658 | alpha DNA polymerase:primase complex(GO:0005658) |
| 0.6 | 3.9 | GO:0005796 | Golgi lumen(GO:0005796) |
| 0.6 | 9.6 | GO:0042612 | MHC class I protein complex(GO:0042612) |
| 0.6 | 15.6 | GO:0032588 | trans-Golgi network membrane(GO:0032588) |
| 0.6 | 1.8 | GO:0005967 | mitochondrial pyruvate dehydrogenase complex(GO:0005967) |
| 0.6 | 1.7 | GO:0044308 | axonal spine(GO:0044308) |
| 0.5 | 3.7 | GO:0031528 | microvillus membrane(GO:0031528) |
| 0.5 | 1.6 | GO:0060187 | cell pole(GO:0060187) |
| 0.5 | 10.9 | GO:0005942 | phosphatidylinositol 3-kinase complex(GO:0005942) |
| 0.5 | 9.1 | GO:0005779 | integral component of peroxisomal membrane(GO:0005779) intrinsic component of peroxisomal membrane(GO:0031231) |
| 0.4 | 6.7 | GO:0030061 | mitochondrial crista(GO:0030061) |
| 0.4 | 2.1 | GO:0016035 | zeta DNA polymerase complex(GO:0016035) |
| 0.4 | 8.8 | GO:0030670 | phagocytic vesicle membrane(GO:0030670) |
| 0.3 | 2.3 | GO:0035748 | myelin sheath abaxonal region(GO:0035748) |
| 0.3 | 7.5 | GO:0005771 | multivesicular body(GO:0005771) |
| 0.3 | 1.5 | GO:0048179 | activin receptor complex(GO:0048179) |
| 0.3 | 1.8 | GO:0097433 | dense body(GO:0097433) |
| 0.3 | 0.9 | GO:1990879 | CST complex(GO:1990879) |
| 0.3 | 1.7 | GO:0089701 | U2AF(GO:0089701) |
| 0.3 | 9.3 | GO:0030131 | clathrin adaptor complex(GO:0030131) |
| 0.3 | 11.6 | GO:0031201 | SNARE complex(GO:0031201) |
| 0.3 | 3.5 | GO:0000124 | SAGA complex(GO:0000124) |
| 0.2 | 27.7 | GO:0005913 | cell-cell adherens junction(GO:0005913) |
| 0.2 | 4.0 | GO:0045334 | clathrin-coated endocytic vesicle(GO:0045334) |
| 0.2 | 3.2 | GO:0030127 | COPII vesicle coat(GO:0030127) |
| 0.2 | 0.7 | GO:0032584 | growth cone membrane(GO:0032584) |
| 0.2 | 4.5 | GO:0044292 | dendrite terminus(GO:0044292) |
| 0.2 | 12.4 | GO:0005788 | endoplasmic reticulum lumen(GO:0005788) |
| 0.2 | 3.8 | GO:0031235 | intrinsic component of the cytoplasmic side of the plasma membrane(GO:0031235) |
| 0.2 | 14.3 | GO:0005793 | endoplasmic reticulum-Golgi intermediate compartment(GO:0005793) |
| 0.2 | 1.5 | GO:0044300 | cerebellar mossy fiber(GO:0044300) |
| 0.2 | 0.8 | GO:1990745 | EARP complex(GO:1990745) |
| 0.2 | 5.1 | GO:0044295 | axonal growth cone(GO:0044295) |
| 0.2 | 24.9 | GO:0055037 | recycling endosome(GO:0055037) |
| 0.2 | 1.5 | GO:0097512 | cardiac myofibril(GO:0097512) |
| 0.2 | 251.0 | GO:0005615 | extracellular space(GO:0005615) |
| 0.2 | 0.7 | GO:0070876 | SOSS complex(GO:0070876) |
| 0.2 | 1.6 | GO:0000808 | origin recognition complex(GO:0000808) nuclear origin of replication recognition complex(GO:0005664) |
| 0.2 | 0.7 | GO:0070436 | Grb2-EGFR complex(GO:0070436) |
| 0.2 | 0.5 | GO:0002178 | palmitoyltransferase complex(GO:0002178) |
| 0.2 | 0.7 | GO:1990769 | proximal neuron projection(GO:1990769) |
| 0.1 | 0.7 | GO:0070695 | FHF complex(GO:0070695) |
| 0.1 | 1.7 | GO:0017101 | aminoacyl-tRNA synthetase multienzyme complex(GO:0017101) |
| 0.1 | 1.5 | GO:0000176 | nuclear exosome (RNase complex)(GO:0000176) |
| 0.1 | 1.6 | GO:0030285 | integral component of synaptic vesicle membrane(GO:0030285) intrinsic component of synaptic vesicle membrane(GO:0098563) |
| 0.1 | 6.9 | GO:0048770 | melanosome(GO:0042470) pigment granule(GO:0048770) |
| 0.1 | 9.7 | GO:0031225 | anchored component of membrane(GO:0031225) |
| 0.1 | 1.1 | GO:0008540 | proteasome regulatory particle, base subcomplex(GO:0008540) |
| 0.1 | 0.5 | GO:1990630 | IRE1-RACK1-PP2A complex(GO:1990630) |
| 0.1 | 0.8 | GO:0016589 | NURF complex(GO:0016589) |
| 0.1 | 0.7 | GO:0000127 | transcription factor TFIIIC complex(GO:0000127) |
| 0.1 | 1.2 | GO:0005885 | Arp2/3 protein complex(GO:0005885) |
| 0.1 | 7.2 | GO:0035097 | histone methyltransferase complex(GO:0035097) |
| 0.1 | 2.1 | GO:0019013 | viral nucleocapsid(GO:0019013) |
| 0.1 | 2.3 | GO:0030687 | preribosome, large subunit precursor(GO:0030687) |
| 0.1 | 58.2 | GO:0005789 | endoplasmic reticulum membrane(GO:0005789) |
| 0.1 | 1.0 | GO:0071004 | U2-type prespliceosome(GO:0071004) |
| 0.1 | 5.6 | GO:0032587 | ruffle membrane(GO:0032587) |
| 0.1 | 0.7 | GO:0043202 | lysosomal lumen(GO:0043202) |
| 0.1 | 2.7 | GO:0034707 | chloride channel complex(GO:0034707) |
| 0.1 | 1.8 | GO:0060077 | inhibitory synapse(GO:0060077) |
| 0.1 | 21.4 | GO:0005925 | focal adhesion(GO:0005925) |
| 0.1 | 2.5 | GO:0016235 | aggresome(GO:0016235) |
| 0.1 | 0.5 | GO:0005786 | signal recognition particle, endoplasmic reticulum targeting(GO:0005786) signal recognition particle(GO:0048500) |
| 0.1 | 0.3 | GO:0031313 | extrinsic component of endosome membrane(GO:0031313) |
| 0.1 | 2.2 | GO:0005912 | adherens junction(GO:0005912) |
| 0.1 | 2.0 | GO:0031526 | brush border membrane(GO:0031526) |
| 0.1 | 57.5 | GO:0005887 | integral component of plasma membrane(GO:0005887) |
| 0.1 | 0.3 | GO:0043527 | tRNA methyltransferase complex(GO:0043527) |
| 0.1 | 6.2 | GO:0042579 | peroxisome(GO:0005777) microbody(GO:0042579) |
| 0.1 | 0.6 | GO:0005736 | DNA-directed RNA polymerase I complex(GO:0005736) |
| 0.0 | 8.5 | GO:0014069 | postsynaptic density(GO:0014069) postsynaptic specialization(GO:0099572) |
| 0.0 | 0.7 | GO:0005847 | mRNA cleavage and polyadenylation specificity factor complex(GO:0005847) |
| 0.0 | 0.3 | GO:0070847 | core mediator complex(GO:0070847) |
| 0.0 | 3.8 | GO:0016363 | nuclear matrix(GO:0016363) |
| 0.0 | 0.9 | GO:0034451 | centriolar satellite(GO:0034451) |
| 0.0 | 0.7 | GO:0030660 | Golgi-associated vesicle membrane(GO:0030660) |
| 0.0 | 1.6 | GO:0043197 | dendritic spine(GO:0043197) |
| 0.0 | 0.2 | GO:0035068 | micro-ribonucleoprotein complex(GO:0035068) |
| 0.0 | 0.4 | GO:0043240 | Fanconi anaemia nuclear complex(GO:0043240) |
| 0.0 | 0.8 | GO:0097517 | stress fiber(GO:0001725) contractile actin filament bundle(GO:0097517) |
| 0.0 | 3.2 | GO:0005681 | spliceosomal complex(GO:0005681) |
| 0.0 | 0.8 | GO:0015030 | Cajal body(GO:0015030) |
| 0.0 | 0.7 | GO:0045171 | intercellular bridge(GO:0045171) |
| 0.0 | 5.2 | GO:0000790 | nuclear chromatin(GO:0000790) |
| 0.0 | 2.0 | GO:0098852 | lysosomal membrane(GO:0005765) lytic vacuole membrane(GO:0098852) |
| 0.0 | 3.2 | GO:0005667 | transcription factor complex(GO:0005667) |
| 0.0 | 0.1 | GO:0071541 | eukaryotic translation initiation factor 3 complex, eIF3m(GO:0071541) |
Gene overrepresentation in molecular function category:
| Log-likelihood per target | Total log-likelihood | Term | Description |
|---|---|---|---|
| 7.0 | 70.2 | GO:0031702 | type 1 angiotensin receptor binding(GO:0031702) |
| 6.6 | 19.9 | GO:0046911 | metal chelating activity(GO:0046911) |
| 6.6 | 19.7 | GO:0001847 | opsonin receptor activity(GO:0001847) |
| 5.2 | 15.7 | GO:0004528 | phosphodiesterase I activity(GO:0004528) |
| 5.0 | 29.7 | GO:0004322 | ferroxidase activity(GO:0004322) oxidoreductase activity, oxidizing metal ions, oxygen as acceptor(GO:0016724) |
| 4.5 | 13.4 | GO:0060230 | lipoprotein lipase activator activity(GO:0060230) |
| 4.4 | 13.3 | GO:0008396 | oxysterol 7-alpha-hydroxylase activity(GO:0008396) |
| 4.2 | 16.8 | GO:0034618 | arginine binding(GO:0034618) |
| 4.0 | 111.1 | GO:0005540 | hyaluronic acid binding(GO:0005540) |
| 3.8 | 11.3 | GO:0004040 | amidase activity(GO:0004040) |
| 3.8 | 11.3 | GO:0047783 | steroid 11-beta-monooxygenase activity(GO:0004507) corticosterone 18-monooxygenase activity(GO:0047783) |
| 3.4 | 10.2 | GO:0004769 | steroid delta-isomerase activity(GO:0004769) |
| 3.3 | 29.7 | GO:0015232 | heme transporter activity(GO:0015232) |
| 3.1 | 40.9 | GO:0030215 | semaphorin receptor binding(GO:0030215) |
| 3.1 | 12.4 | GO:0070568 | guanylyltransferase activity(GO:0070568) |
| 2.9 | 14.6 | GO:0019770 | IgG receptor activity(GO:0019770) |
| 2.9 | 14.5 | GO:0019834 | phospholipase A2 inhibitor activity(GO:0019834) |
| 2.9 | 14.5 | GO:0050785 | advanced glycation end-product receptor activity(GO:0050785) |
| 2.9 | 8.7 | GO:0098603 | selenol Se-methyltransferase activity(GO:0098603) |
| 2.8 | 8.4 | GO:0046980 | peptide antigen-transporting ATPase activity(GO:0015433) tapasin binding(GO:0046980) |
| 2.8 | 27.7 | GO:0003810 | protein-glutamine gamma-glutamyltransferase activity(GO:0003810) |
| 2.6 | 44.8 | GO:0001848 | complement binding(GO:0001848) |
| 2.6 | 12.8 | GO:0030348 | syntaxin-3 binding(GO:0030348) |
| 2.5 | 12.3 | GO:0070891 | lipoteichoic acid binding(GO:0070891) |
| 2.3 | 7.0 | GO:0070976 | TIR domain binding(GO:0070976) |
| 2.3 | 6.9 | GO:0016509 | long-chain-3-hydroxyacyl-CoA dehydrogenase activity(GO:0016509) |
| 2.2 | 44.7 | GO:0030247 | pattern binding(GO:0001871) polysaccharide binding(GO:0030247) |
| 2.2 | 15.2 | GO:0048019 | receptor antagonist activity(GO:0048019) |
| 2.1 | 10.7 | GO:0004008 | copper-exporting ATPase activity(GO:0004008) copper-transporting ATPase activity(GO:0043682) |
| 1.9 | 5.8 | GO:0016971 | flavin-linked sulfhydryl oxidase activity(GO:0016971) |
| 1.9 | 5.8 | GO:0005294 | neutral L-amino acid secondary active transmembrane transporter activity(GO:0005294) |
| 1.9 | 5.6 | GO:0044715 | 8-oxo-dGDP phosphatase activity(GO:0044715) |
| 1.8 | 10.7 | GO:0004568 | chitinase activity(GO:0004568) |
| 1.8 | 5.3 | GO:0004392 | heme oxygenase (decyclizing) activity(GO:0004392) |
| 1.7 | 5.2 | GO:0004830 | tryptophan-tRNA ligase activity(GO:0004830) |
| 1.7 | 5.2 | GO:0004874 | aryl hydrocarbon receptor activity(GO:0004874) |
| 1.7 | 3.4 | GO:0031871 | proteinase activated receptor binding(GO:0031871) |
| 1.6 | 11.5 | GO:0004767 | sphingomyelin phosphodiesterase activity(GO:0004767) |
| 1.6 | 4.7 | GO:0019809 | spermidine binding(GO:0019809) |
| 1.5 | 33.6 | GO:0004012 | phospholipid-translocating ATPase activity(GO:0004012) |
| 1.5 | 5.9 | GO:0005333 | norepinephrine transmembrane transporter activity(GO:0005333) |
| 1.4 | 4.2 | GO:0004829 | threonine-tRNA ligase activity(GO:0004829) |
| 1.4 | 10.9 | GO:0035005 | 1-phosphatidylinositol-4-phosphate 3-kinase activity(GO:0035005) |
| 1.3 | 5.4 | GO:0004813 | alanine-tRNA ligase activity(GO:0004813) |
| 1.3 | 14.1 | GO:0004571 | mannosyl-oligosaccharide 1,2-alpha-mannosidase activity(GO:0004571) |
| 1.3 | 15.3 | GO:0004032 | alditol:NADP+ 1-oxidoreductase activity(GO:0004032) |
| 1.3 | 7.5 | GO:0015016 | [heparan sulfate]-glucosamine N-sulfotransferase activity(GO:0015016) |
| 1.0 | 14.6 | GO:0042043 | neurexin family protein binding(GO:0042043) |
| 1.0 | 5.2 | GO:0004971 | AMPA glutamate receptor activity(GO:0004971) |
| 1.0 | 4.1 | GO:0002046 | opsin binding(GO:0002046) |
| 1.0 | 9.1 | GO:0086080 | protein binding involved in heterotypic cell-cell adhesion(GO:0086080) |
| 1.0 | 3.0 | GO:0004814 | arginine-tRNA ligase activity(GO:0004814) |
| 1.0 | 3.0 | GO:0046979 | TAP binding(GO:0046977) TAP1 binding(GO:0046978) TAP2 binding(GO:0046979) |
| 1.0 | 5.9 | GO:1901612 | cardiolipin binding(GO:1901612) |
| 0.9 | 21.5 | GO:0003950 | NAD+ ADP-ribosyltransferase activity(GO:0003950) |
| 0.9 | 5.5 | GO:0016803 | ether hydrolase activity(GO:0016803) |
| 0.9 | 9.1 | GO:0031957 | very long-chain fatty acid-CoA ligase activity(GO:0031957) |
| 0.9 | 2.7 | GO:0003976 | UDP-N-acetylglucosamine-lysosomal-enzyme N-acetylglucosaminephosphotransferase activity(GO:0003976) |
| 0.9 | 4.5 | GO:0008430 | selenium binding(GO:0008430) |
| 0.9 | 1.8 | GO:0033691 | sialic acid binding(GO:0033691) |
| 0.9 | 11.4 | GO:0047372 | acylglycerol lipase activity(GO:0047372) |
| 0.9 | 9.7 | GO:0008046 | axon guidance receptor activity(GO:0008046) |
| 0.9 | 2.6 | GO:0008476 | protein-tyrosine sulfotransferase activity(GO:0008476) |
| 0.8 | 5.0 | GO:0004366 | glycerol-3-phosphate O-acyltransferase activity(GO:0004366) |
| 0.8 | 4.6 | GO:0004694 | eukaryotic translation initiation factor 2alpha kinase activity(GO:0004694) |
| 0.8 | 6.2 | GO:0005169 | neurotrophin TRKB receptor binding(GO:0005169) |
| 0.8 | 2.3 | GO:0016309 | 1-phosphatidylinositol-5-phosphate 4-kinase activity(GO:0016309) |
| 0.8 | 3.8 | GO:0000702 | oxidized base lesion DNA N-glycosylase activity(GO:0000702) |
| 0.8 | 2.3 | GO:0022852 | glycine-gated chloride ion channel activity(GO:0022852) |
| 0.8 | 4.5 | GO:0005338 | nucleotide-sugar transmembrane transporter activity(GO:0005338) |
| 0.7 | 167.2 | GO:0004252 | serine-type endopeptidase activity(GO:0004252) |
| 0.7 | 17.0 | GO:0004602 | glutathione peroxidase activity(GO:0004602) |
| 0.7 | 7.1 | GO:0070016 | armadillo repeat domain binding(GO:0070016) |
| 0.7 | 2.0 | GO:0004825 | methionine-tRNA ligase activity(GO:0004825) |
| 0.7 | 5.3 | GO:0016936 | galactoside binding(GO:0016936) |
| 0.7 | 3.9 | GO:0043141 | ATP-dependent 5'-3' DNA helicase activity(GO:0043141) |
| 0.6 | 3.2 | GO:0016907 | G-protein coupled acetylcholine receptor activity(GO:0016907) |
| 0.6 | 1.9 | GO:0017098 | UTP binding(GO:0002134) sulfonylurea receptor binding(GO:0017098) pyrimidine ribonucleoside binding(GO:0032551) |
| 0.6 | 2.5 | GO:0004127 | cytidylate kinase activity(GO:0004127) |
| 0.6 | 7.5 | GO:0008191 | metalloendopeptidase inhibitor activity(GO:0008191) |
| 0.6 | 14.4 | GO:0005251 | delayed rectifier potassium channel activity(GO:0005251) |
| 0.6 | 3.6 | GO:0030881 | beta-2-microglobulin binding(GO:0030881) |
| 0.6 | 5.1 | GO:0047760 | butyrate-CoA ligase activity(GO:0047760) |
| 0.5 | 2.2 | GO:0004687 | myosin light chain kinase activity(GO:0004687) |
| 0.5 | 4.9 | GO:0005001 | transmembrane receptor protein tyrosine phosphatase activity(GO:0005001) transmembrane receptor protein phosphatase activity(GO:0019198) |
| 0.5 | 58.4 | GO:0004867 | serine-type endopeptidase inhibitor activity(GO:0004867) |
| 0.5 | 9.3 | GO:0004697 | protein kinase C activity(GO:0004697) |
| 0.5 | 11.4 | GO:0042056 | chemoattractant activity(GO:0042056) |
| 0.5 | 1.6 | GO:0005017 | platelet-derived growth factor-activated receptor activity(GO:0005017) |
| 0.5 | 13.4 | GO:0004709 | MAP kinase kinase kinase activity(GO:0004709) |
| 0.5 | 4.1 | GO:0030274 | LIM domain binding(GO:0030274) |
| 0.5 | 9.2 | GO:0008199 | ferric iron binding(GO:0008199) |
| 0.5 | 2.0 | GO:0004740 | pyruvate dehydrogenase (acetyl-transferring) kinase activity(GO:0004740) |
| 0.5 | 64.9 | GO:0030674 | protein binding, bridging(GO:0030674) |
| 0.5 | 0.5 | GO:0015087 | cobalt ion transmembrane transporter activity(GO:0015087) |
| 0.4 | 4.9 | GO:0045499 | chemorepellent activity(GO:0045499) |
| 0.4 | 2.7 | GO:0042500 | aspartic endopeptidase activity, intramembrane cleaving(GO:0042500) |
| 0.4 | 1.3 | GO:0004839 | ubiquitin activating enzyme activity(GO:0004839) |
| 0.4 | 3.0 | GO:0004332 | fructose-bisphosphate aldolase activity(GO:0004332) |
| 0.4 | 5.7 | GO:0030550 | acetylcholine receptor inhibitor activity(GO:0030550) |
| 0.4 | 2.7 | GO:0004865 | protein serine/threonine phosphatase inhibitor activity(GO:0004865) |
| 0.4 | 1.9 | GO:0003680 | AT DNA binding(GO:0003680) |
| 0.4 | 5.6 | GO:0016493 | C-C chemokine receptor activity(GO:0016493) |
| 0.4 | 7.6 | GO:0043236 | laminin binding(GO:0043236) |
| 0.4 | 1.1 | GO:0071553 | uridine nucleotide receptor activity(GO:0015065) G-protein coupled pyrimidinergic nucleotide receptor activity(GO:0071553) |
| 0.4 | 1.4 | GO:0031750 | D3 dopamine receptor binding(GO:0031750) |
| 0.3 | 4.2 | GO:0050072 | m7G(5')pppN diphosphatase activity(GO:0050072) |
| 0.3 | 2.1 | GO:0004985 | opioid receptor activity(GO:0004985) |
| 0.3 | 3.6 | GO:0004653 | polypeptide N-acetylgalactosaminyltransferase activity(GO:0004653) |
| 0.3 | 1.6 | GO:0016427 | tRNA (cytosine) methyltransferase activity(GO:0016427) |
| 0.3 | 1.6 | GO:0008503 | benzodiazepine receptor activity(GO:0008503) |
| 0.3 | 5.6 | GO:0070628 | proteasome binding(GO:0070628) |
| 0.3 | 2.8 | GO:0043495 | protein anchor(GO:0043495) |
| 0.3 | 20.2 | GO:0005507 | copper ion binding(GO:0005507) |
| 0.3 | 2.4 | GO:0034987 | immunoglobulin receptor binding(GO:0034987) |
| 0.3 | 14.0 | GO:0019905 | syntaxin binding(GO:0019905) |
| 0.3 | 2.3 | GO:0050815 | phosphoserine binding(GO:0050815) |
| 0.3 | 2.6 | GO:0030235 | nitric-oxide synthase regulator activity(GO:0030235) |
| 0.3 | 1.2 | GO:0004045 | aminoacyl-tRNA hydrolase activity(GO:0004045) |
| 0.3 | 3.8 | GO:0001637 | G-protein coupled chemoattractant receptor activity(GO:0001637) |
| 0.3 | 2.2 | GO:0004017 | adenylate kinase activity(GO:0004017) |
| 0.3 | 28.3 | GO:0005178 | integrin binding(GO:0005178) |
| 0.3 | 2.6 | GO:0016909 | JUN kinase activity(GO:0004705) SAP kinase activity(GO:0016909) |
| 0.3 | 5.9 | GO:0004601 | peroxidase activity(GO:0004601) |
| 0.3 | 6.3 | GO:0005520 | insulin-like growth factor binding(GO:0005520) |
| 0.3 | 1.5 | GO:0016361 | activin receptor activity, type I(GO:0016361) |
| 0.3 | 1.5 | GO:0005030 | neurotrophin receptor activity(GO:0005030) |
| 0.2 | 0.7 | GO:0005302 | L-tyrosine transmembrane transporter activity(GO:0005302) |
| 0.2 | 2.7 | GO:0008821 | crossover junction endodeoxyribonuclease activity(GO:0008821) |
| 0.2 | 0.7 | GO:0047045 | testosterone 17-beta-dehydrogenase (NADP+) activity(GO:0047045) |
| 0.2 | 2.0 | GO:0090482 | vitamin transmembrane transporter activity(GO:0090482) |
| 0.2 | 1.2 | GO:0004105 | choline-phosphate cytidylyltransferase activity(GO:0004105) |
| 0.2 | 4.3 | GO:0042288 | MHC class I protein binding(GO:0042288) |
| 0.2 | 0.7 | GO:0004809 | tRNA (guanine-N2-)-methyltransferase activity(GO:0004809) |
| 0.2 | 7.0 | GO:0017075 | syntaxin-1 binding(GO:0017075) |
| 0.2 | 13.5 | GO:0030276 | clathrin binding(GO:0030276) |
| 0.2 | 1.1 | GO:0050733 | RS domain binding(GO:0050733) |
| 0.2 | 4.3 | GO:0017049 | GTP-Rho binding(GO:0017049) |
| 0.2 | 1.1 | GO:0004337 | dimethylallyltranstransferase activity(GO:0004161) geranyltranstransferase activity(GO:0004337) |
| 0.2 | 1.7 | GO:0051525 | NFAT protein binding(GO:0051525) |
| 0.2 | 2.1 | GO:0043325 | phosphatidylinositol-3,4-bisphosphate binding(GO:0043325) |
| 0.2 | 1.5 | GO:0003896 | DNA primase activity(GO:0003896) |
| 0.2 | 1.7 | GO:0044323 | retinoic acid-responsive element binding(GO:0044323) |
| 0.2 | 3.1 | GO:0005351 | sugar:proton symporter activity(GO:0005351) |
| 0.2 | 10.6 | GO:0005160 | transforming growth factor beta receptor binding(GO:0005160) |
| 0.2 | 2.1 | GO:0034450 | ubiquitin-ubiquitin ligase activity(GO:0034450) |
| 0.2 | 2.3 | GO:0016857 | racemase and epimerase activity, acting on carbohydrates and derivatives(GO:0016857) |
| 0.2 | 1.7 | GO:0030628 | pre-mRNA 3'-splice site binding(GO:0030628) |
| 0.2 | 4.9 | GO:0005385 | zinc ion transmembrane transporter activity(GO:0005385) |
| 0.2 | 0.5 | GO:0031728 | CCR3 chemokine receptor binding(GO:0031728) |
| 0.2 | 3.4 | GO:0017056 | structural constituent of nuclear pore(GO:0017056) |
| 0.2 | 9.0 | GO:0030374 | ligand-dependent nuclear receptor transcription coactivator activity(GO:0030374) |
| 0.2 | 0.7 | GO:0035727 | lysophosphatidic acid binding(GO:0035727) |
| 0.2 | 0.7 | GO:0055077 | gap junction hemi-channel activity(GO:0055077) gap junction channel activity involved in cardiac conduction electrical coupling(GO:0086075) gap junction channel activity involved in AV node cell-bundle of His cell electrical coupling(GO:0086077) |
| 0.2 | 5.3 | GO:0001784 | phosphotyrosine binding(GO:0001784) |
| 0.2 | 1.7 | GO:0015386 | potassium:proton antiporter activity(GO:0015386) |
| 0.2 | 14.0 | GO:0001046 | core promoter sequence-specific DNA binding(GO:0001046) |
| 0.1 | 1.5 | GO:0032036 | myosin heavy chain binding(GO:0032036) |
| 0.1 | 2.3 | GO:0005523 | tropomyosin binding(GO:0005523) |
| 0.1 | 0.7 | GO:0008321 | Ral guanyl-nucleotide exchange factor activity(GO:0008321) |
| 0.1 | 1.8 | GO:0005149 | interleukin-1 receptor binding(GO:0005149) |
| 0.1 | 0.7 | GO:0004974 | leukotriene receptor activity(GO:0004974) |
| 0.1 | 8.1 | GO:0003724 | RNA helicase activity(GO:0003724) ATP-dependent RNA helicase activity(GO:0004004) |
| 0.1 | 2.2 | GO:0008175 | tRNA methyltransferase activity(GO:0008175) |
| 0.1 | 18.7 | GO:0052689 | carboxylic ester hydrolase activity(GO:0052689) |
| 0.1 | 5.6 | GO:0003755 | peptidyl-prolyl cis-trans isomerase activity(GO:0003755) |
| 0.1 | 38.3 | GO:0003924 | GTPase activity(GO:0003924) |
| 0.1 | 1.6 | GO:0043047 | single-stranded telomeric DNA binding(GO:0043047) |
| 0.1 | 10.1 | GO:0003725 | double-stranded RNA binding(GO:0003725) |
| 0.1 | 0.2 | GO:0004046 | aminoacylase activity(GO:0004046) |
| 0.1 | 0.6 | GO:0046624 | sphingolipid transporter activity(GO:0046624) |
| 0.1 | 0.5 | GO:0030911 | TPR domain binding(GO:0030911) |
| 0.1 | 1.5 | GO:0032453 | histone demethylase activity (H3-K4 specific)(GO:0032453) |
| 0.1 | 1.7 | GO:0004143 | diacylglycerol kinase activity(GO:0004143) |
| 0.1 | 15.2 | GO:0042626 | ATPase activity, coupled to transmembrane movement of substances(GO:0042626) |
| 0.1 | 5.6 | GO:0005546 | phosphatidylinositol-4,5-bisphosphate binding(GO:0005546) |
| 0.1 | 1.6 | GO:0051378 | serotonin binding(GO:0051378) |
| 0.1 | 1.6 | GO:0003688 | DNA replication origin binding(GO:0003688) |
| 0.1 | 2.2 | GO:0005031 | tumor necrosis factor-activated receptor activity(GO:0005031) death receptor activity(GO:0005035) |
| 0.1 | 4.1 | GO:0031593 | polyubiquitin binding(GO:0031593) |
| 0.1 | 4.4 | GO:0016831 | carboxy-lyase activity(GO:0016831) |
| 0.1 | 3.0 | GO:0001078 | transcriptional repressor activity, RNA polymerase II core promoter proximal region sequence-specific binding(GO:0001078) |
| 0.1 | 5.0 | GO:0016627 | oxidoreductase activity, acting on the CH-CH group of donors(GO:0016627) |
| 0.1 | 9.8 | GO:0070851 | growth factor receptor binding(GO:0070851) |
| 0.1 | 21.9 | GO:0030246 | carbohydrate binding(GO:0030246) |
| 0.1 | 0.4 | GO:0004435 | phosphatidylinositol phospholipase C activity(GO:0004435) |
| 0.1 | 2.9 | GO:0000049 | tRNA binding(GO:0000049) |
| 0.1 | 1.6 | GO:0003785 | actin monomer binding(GO:0003785) |
| 0.1 | 0.5 | GO:0030292 | protein tyrosine kinase inhibitor activity(GO:0030292) |
| 0.1 | 0.4 | GO:0048273 | mitogen-activated protein kinase p38 binding(GO:0048273) |
| 0.1 | 1.9 | GO:0042800 | histone methyltransferase activity (H3-K4 specific)(GO:0042800) |
| 0.1 | 0.4 | GO:0002151 | G-quadruplex RNA binding(GO:0002151) |
| 0.1 | 2.0 | GO:0051539 | 4 iron, 4 sulfur cluster binding(GO:0051539) |
| 0.1 | 1.8 | GO:0005086 | ARF guanyl-nucleotide exchange factor activity(GO:0005086) |
| 0.1 | 0.6 | GO:0001054 | RNA polymerase I activity(GO:0001054) |
| 0.1 | 0.7 | GO:0004000 | adenosine deaminase activity(GO:0004000) |
| 0.1 | 2.4 | GO:0004532 | exoribonuclease activity(GO:0004532) |
| 0.1 | 0.5 | GO:0043023 | ribosomal large subunit binding(GO:0043023) |
| 0.1 | 1.3 | GO:0004890 | GABA-A receptor activity(GO:0004890) |
| 0.1 | 1.4 | GO:0008483 | transaminase activity(GO:0008483) |
| 0.1 | 2.0 | GO:0048365 | Rac GTPase binding(GO:0048365) |
| 0.1 | 1.2 | GO:0043539 | protein serine/threonine kinase activator activity(GO:0043539) |
| 0.0 | 21.7 | GO:0000978 | RNA polymerase II core promoter proximal region sequence-specific DNA binding(GO:0000978) |
| 0.0 | 2.6 | GO:0008138 | protein tyrosine/serine/threonine phosphatase activity(GO:0008138) |
| 0.0 | 2.3 | GO:0030551 | cyclic nucleotide binding(GO:0030551) |
| 0.0 | 0.7 | GO:0005545 | 1-phosphatidylinositol binding(GO:0005545) |
| 0.0 | 0.8 | GO:0015106 | bicarbonate transmembrane transporter activity(GO:0015106) |
| 0.0 | 5.8 | GO:0008022 | protein C-terminus binding(GO:0008022) |
| 0.0 | 1.5 | GO:0008083 | growth factor activity(GO:0008083) |
| 0.0 | 3.2 | GO:0016616 | oxidoreductase activity, acting on the CH-OH group of donors, NAD or NADP as acceptor(GO:0016616) |
| 0.0 | 14.9 | GO:0005509 | calcium ion binding(GO:0005509) |
| 0.0 | 1.1 | GO:0048306 | calcium-dependent protein binding(GO:0048306) |
| 0.0 | 0.9 | GO:0019706 | protein-cysteine S-palmitoyltransferase activity(GO:0019706) protein-cysteine S-acyltransferase activity(GO:0019707) |
| 0.0 | 0.5 | GO:0017134 | fibroblast growth factor binding(GO:0017134) |
| 0.0 | 0.4 | GO:0008195 | phosphatidate phosphatase activity(GO:0008195) |
| 0.0 | 2.6 | GO:0020037 | heme binding(GO:0020037) |
| 0.0 | 26.3 | GO:0003723 | RNA binding(GO:0003723) |
| 0.0 | 0.8 | GO:0017112 | Rab guanyl-nucleotide exchange factor activity(GO:0017112) |
| 0.0 | 0.1 | GO:0046976 | histone methyltransferase activity (H3-K27 specific)(GO:0046976) |
| 0.0 | 0.4 | GO:0004715 | non-membrane spanning protein tyrosine kinase activity(GO:0004715) |
| 0.0 | 0.5 | GO:0008094 | DNA-dependent ATPase activity(GO:0008094) |
Gene overrepresentation in curated gene sets: canonical pathways category:
| Log-likelihood per target | Total log-likelihood | Term | Description |
|---|---|---|---|
| 4.3 | 134.1 | PID INTEGRIN2 PATHWAY | Beta2 integrin cell surface interactions |
| 2.4 | 36.6 | PID INTEGRIN5 PATHWAY | Beta5 beta6 beta7 and beta8 integrin cell surface interactions |
| 2.4 | 70.2 | PID PRL SIGNALING EVENTS PATHWAY | Signaling events mediated by PRL |
| 1.3 | 295.3 | NABA ECM REGULATORS | Genes encoding enzymes and their regulators involved in the remodeling of the extracellular matrix |
| 0.9 | 19.3 | PID TOLL ENDOGENOUS PATHWAY | Endogenous TLR signaling |
| 0.8 | 29.5 | PID AMB2 NEUTROPHILS PATHWAY | amb2 Integrin signaling |
| 0.8 | 14.0 | ST G ALPHA S PATHWAY | G alpha s Pathway |
| 0.8 | 17.8 | SA CASPASE CASCADE | Apoptosis is mediated by caspases, cysteine proteases arranged in a proteolytic cascade. |
| 0.8 | 0.8 | SA FAS SIGNALING | The TNF-type receptor Fas induces apoptosis on ligand binding. |
| 0.7 | 112.4 | NABA ECM AFFILIATED | Genes encoding proteins affiliated structurally or functionally to extracellular matrix proteins |
| 0.7 | 11.1 | SA MMP CYTOKINE CONNECTION | Cytokines can induce activation of matrix metalloproteinases, which degrade extracellular matrix. |
| 0.6 | 29.6 | ST PHOSPHOINOSITIDE 3 KINASE PATHWAY | PI3K Pathway |
| 0.6 | 4.7 | PID INTEGRIN A9B1 PATHWAY | Alpha9 beta1 integrin signaling events |
| 0.6 | 23.9 | PID SYNDECAN 1 PATHWAY | Syndecan-1-mediated signaling events |
| 0.5 | 11.5 | PID TRAIL PATHWAY | TRAIL signaling pathway |
| 0.5 | 29.2 | PID IL4 2PATHWAY | IL4-mediated signaling events |
| 0.5 | 20.5 | PID HNF3A PATHWAY | FOXA1 transcription factor network |
| 0.5 | 16.4 | SIG CD40PATHWAYMAP | Genes related to CD40 signaling |
| 0.5 | 34.8 | PID HIF1 TFPATHWAY | HIF-1-alpha transcription factor network |
| 0.5 | 7.5 | ST DIFFERENTIATION PATHWAY IN PC12 CELLS | Differentiation Pathway in PC12 Cells; this is a specific case of PAC1 Receptor Pathway. |
| 0.4 | 11.5 | PID IFNG PATHWAY | IFN-gamma pathway |
| 0.4 | 10.8 | PID TCR CALCIUM PATHWAY | Calcium signaling in the CD4+ TCR pathway |
| 0.4 | 5.0 | PID P38 MKK3 6PATHWAY | p38 MAPK signaling pathway |
| 0.3 | 3.4 | ST GA12 PATHWAY | G alpha 12 Pathway |
| 0.3 | 1.9 | SA PTEN PATHWAY | PTEN is a tumor suppressor that dephosphorylates the lipid messenger phosphatidylinositol triphosphate. |
| 0.3 | 5.3 | PID TCPTP PATHWAY | Signaling events mediated by TCPTP |
| 0.3 | 10.2 | SIG PIP3 SIGNALING IN CARDIAC MYOCTES | Genes related to PIP3 signaling in cardiac myocytes |
| 0.3 | 4.4 | SIG PIP3 SIGNALING IN B LYMPHOCYTES | Genes related to PIP3 signaling in B lymphocytes |
| 0.2 | 13.7 | PID MYC REPRESS PATHWAY | Validated targets of C-MYC transcriptional repression |
| 0.2 | 1.9 | PID HIF1A PATHWAY | Hypoxic and oxygen homeostasis regulation of HIF-1-alpha |
| 0.2 | 7.8 | ST JNK MAPK PATHWAY | JNK MAPK Pathway |
| 0.2 | 1.6 | PID PDGFRA PATHWAY | PDGFR-alpha signaling pathway |
| 0.2 | 5.8 | PID NCADHERIN PATHWAY | N-cadherin signaling events |
| 0.2 | 3.5 | PID WNT NONCANONICAL PATHWAY | Noncanonical Wnt signaling pathway |
| 0.2 | 6.2 | PID AJDISS 2PATHWAY | Posttranslational regulation of adherens junction stability and dissassembly |
| 0.1 | 1.0 | PID ANGIOPOIETIN RECEPTOR PATHWAY | Angiopoietin receptor Tie2-mediated signaling |
| 0.1 | 1.5 | PID ALK2 PATHWAY | ALK2 signaling events |
| 0.1 | 1.5 | ST ERK1 ERK2 MAPK PATHWAY | ERK1/ERK2 MAPK Pathway |
| 0.1 | 4.2 | PID ATR PATHWAY | ATR signaling pathway |
| 0.1 | 1.7 | PID RETINOIC ACID PATHWAY | Retinoic acid receptors-mediated signaling |
| 0.1 | 2.1 | SIG REGULATION OF THE ACTIN CYTOSKELETON BY RHO GTPASES | Genes related to regulation of the actin cytoskeleton |
| 0.1 | 2.0 | PID LIS1 PATHWAY | Lissencephaly gene (LIS1) in neuronal migration and development |
| 0.1 | 2.1 | PID FAK PATHWAY | Signaling events mediated by focal adhesion kinase |
| 0.1 | 3.3 | PID DELTA NP63 PATHWAY | Validated transcriptional targets of deltaNp63 isoforms |
| 0.1 | 1.6 | PID ECADHERIN STABILIZATION PATHWAY | Stabilization and expansion of the E-cadherin adherens junction |
| 0.1 | 1.3 | PID RAS PATHWAY | Regulation of Ras family activation |
| 0.0 | 1.2 | PID RAC1 PATHWAY | RAC1 signaling pathway |
| 0.0 | 8.4 | NABA ECM GLYCOPROTEINS | Genes encoding structural ECM glycoproteins |
| 0.0 | 1.4 | PID TELOMERASE PATHWAY | Regulation of Telomerase |
| 0.0 | 3.7 | PID P53 DOWNSTREAM PATHWAY | Direct p53 effectors |
| 0.0 | 2.3 | PID HDAC CLASSI PATHWAY | Signaling events mediated by HDAC Class I |
| 0.0 | 1.4 | PID TRKR PATHWAY | Neurotrophic factor-mediated Trk receptor signaling |
| 0.0 | 0.8 | PID TGFBR PATHWAY | TGF-beta receptor signaling |
| 0.0 | 0.4 | PID BARD1 PATHWAY | BARD1 signaling events |
Gene overrepresentation in curated gene sets: REACTOME pathways category:
| Log-likelihood per target | Total log-likelihood | Term | Description |
|---|---|---|---|
| 9.2 | 147.5 | REACTOME COMMON PATHWAY | Genes involved in Common Pathway |
| 7.2 | 43.4 | REACTOME GAMMA CARBOXYLATION TRANSPORT AND AMINO TERMINAL CLEAVAGE OF PROTEINS | Genes involved in Gamma-carboxylation, transport, and amino-terminal cleavage of proteins |
| 3.1 | 39.7 | REACTOME REGULATION OF COMPLEMENT CASCADE | Genes involved in Regulation of Complement cascade |
| 2.7 | 29.3 | REACTOME CREATION OF C4 AND C2 ACTIVATORS | Genes involved in Creation of C4 and C2 activators |
| 2.3 | 40.9 | REACTOME OTHER SEMAPHORIN INTERACTIONS | Genes involved in Other semaphorin interactions |
| 2.0 | 33.3 | REACTOME CHYLOMICRON MEDIATED LIPID TRANSPORT | Genes involved in Chylomicron-mediated lipid transport |
| 1.9 | 22.4 | REACTOME SYNTHESIS OF BILE ACIDS AND BILE SALTS VIA 24 HYDROXYCHOLESTEROL | Genes involved in Synthesis of bile acids and bile salts via 24-hydroxycholesterol |
| 1.4 | 37.7 | REACTOME DEGRADATION OF THE EXTRACELLULAR MATRIX | Genes involved in Degradation of the extracellular matrix |
| 1.4 | 12.3 | REACTOME IKK COMPLEX RECRUITMENT MEDIATED BY RIP1 | Genes involved in IKK complex recruitment mediated by RIP1 |
| 1.3 | 13.8 | REACTOME RIP MEDIATED NFKB ACTIVATION VIA DAI | Genes involved in RIP-mediated NFkB activation via DAI |
| 1.2 | 18.5 | REACTOME DOPAMINE NEUROTRANSMITTER RELEASE CYCLE | Genes involved in Dopamine Neurotransmitter Release Cycle |
| 1.2 | 34.6 | REACTOME METAL ION SLC TRANSPORTERS | Genes involved in Metal ion SLC transporters |
| 1.1 | 19.4 | REACTOME HYALURONAN METABOLISM | Genes involved in Hyaluronan metabolism |
| 1.1 | 19.4 | REACTOME INTRINSIC PATHWAY | Genes involved in Intrinsic Pathway |
| 1.1 | 11.3 | REACTOME ENDOGENOUS STEROLS | Genes involved in Endogenous sterols |
| 1.1 | 63.5 | REACTOME INTERFERON GAMMA SIGNALING | Genes involved in Interferon gamma signaling |
| 0.9 | 44.3 | REACTOME ION TRANSPORT BY P TYPE ATPASES | Genes involved in Ion transport by P-type ATPases |
| 0.9 | 7.0 | REACTOME TRAF6 MEDIATED IRF7 ACTIVATION IN TLR7 8 OR 9 SIGNALING | Genes involved in TRAF6 mediated IRF7 activation in TLR7/8 or 9 signaling |
| 0.8 | 13.5 | REACTOME IONOTROPIC ACTIVITY OF KAINATE RECEPTORS | Genes involved in Ionotropic activity of Kainate Receptors |
| 0.8 | 8.9 | REACTOME THE NLRP3 INFLAMMASOME | Genes involved in The NLRP3 inflammasome |
| 0.7 | 11.6 | REACTOME ANTIGEN PRESENTATION FOLDING ASSEMBLY AND PEPTIDE LOADING OF CLASS I MHC | Genes involved in Antigen Presentation: Folding, assembly and peptide loading of class I MHC |
| 0.6 | 11.3 | REACTOME CHOLESTEROL BIOSYNTHESIS | Genes involved in Cholesterol biosynthesis |
| 0.6 | 22.8 | REACTOME INTRINSIC PATHWAY FOR APOPTOSIS | Genes involved in Intrinsic Pathway for Apoptosis |
| 0.5 | 65.6 | REACTOME PPARA ACTIVATES GENE EXPRESSION | Genes involved in PPARA Activates Gene Expression |
| 0.5 | 9.2 | REACTOME POST CHAPERONIN TUBULIN FOLDING PATHWAY | Genes involved in Post-chaperonin tubulin folding pathway |
| 0.5 | 16.8 | REACTOME GLYCOSPHINGOLIPID METABOLISM | Genes involved in Glycosphingolipid metabolism |
| 0.4 | 6.3 | REACTOME IL 7 SIGNALING | Genes involved in Interleukin-7 signaling |
| 0.4 | 6.9 | REACTOME SYNTHESIS OF VERY LONG CHAIN FATTY ACYL COAS | Genes involved in Synthesis of very long-chain fatty acyl-CoAs |
| 0.4 | 6.3 | REACTOME REGULATION OF INSULIN LIKE GROWTH FACTOR IGF ACTIVITY BY INSULIN LIKE GROWTH FACTOR BINDING PROTEINS IGFBPS | Genes involved in Regulation of Insulin-like Growth Factor (IGF) Activity by Insulin-like Growth Factor Binding Proteins (IGFBPs) |
| 0.4 | 11.3 | REACTOME CYTOSOLIC TRNA AMINOACYLATION | Genes involved in Cytosolic tRNA aminoacylation |
| 0.4 | 14.1 | REACTOME TRANSPORT TO THE GOLGI AND SUBSEQUENT MODIFICATION | Genes involved in Transport to the Golgi and subsequent modification |
| 0.4 | 7.5 | REACTOME SYNTHESIS OF PIPS AT THE GOLGI MEMBRANE | Genes involved in Synthesis of PIPs at the Golgi membrane |
| 0.4 | 11.5 | REACTOME GLUTATHIONE CONJUGATION | Genes involved in Glutathione conjugation |
| 0.3 | 5.2 | REACTOME UNBLOCKING OF NMDA RECEPTOR GLUTAMATE BINDING AND ACTIVATION | Genes involved in Unblocking of NMDA receptor, glutamate binding and activation |
| 0.3 | 6.5 | REACTOME GLUCAGON TYPE LIGAND RECEPTORS | Genes involved in Glucagon-type ligand receptors |
| 0.3 | 5.3 | REACTOME METABOLISM OF PORPHYRINS | Genes involved in Metabolism of porphyrins |
| 0.3 | 3.2 | REACTOME REGULATION OF INSULIN SECRETION BY ACETYLCHOLINE | Genes involved in Regulation of Insulin Secretion by Acetylcholine |
| 0.3 | 6.6 | REACTOME DESTABILIZATION OF MRNA BY KSRP | Genes involved in Destabilization of mRNA by KSRP |
| 0.3 | 5.5 | REACTOME MITOCHONDRIAL TRNA AMINOACYLATION | Genes involved in Mitochondrial tRNA aminoacylation |
| 0.3 | 3.4 | REACTOME PHOSPHORYLATION OF CD3 AND TCR ZETA CHAINS | Genes involved in Phosphorylation of CD3 and TCR zeta chains |
| 0.3 | 3.9 | REACTOME TERMINATION OF O GLYCAN BIOSYNTHESIS | Genes involved in Termination of O-glycan biosynthesis |
| 0.3 | 20.1 | REACTOME INTEGRIN CELL SURFACE INTERACTIONS | Genes involved in Integrin cell surface interactions |
| 0.3 | 14.4 | REACTOME REGULATION OF INSULIN SECRETION BY GLUCAGON LIKE PEPTIDE1 | Genes involved in Regulation of Insulin Secretion by Glucagon-like Peptide-1 |
| 0.3 | 7.5 | REACTOME HS GAG BIOSYNTHESIS | Genes involved in HS-GAG biosynthesis |
| 0.3 | 8.3 | REACTOME IMMUNOREGULATORY INTERACTIONS BETWEEN A LYMPHOID AND A NON LYMPHOID CELL | Genes involved in Immunoregulatory interactions between a Lymphoid and a non-Lymphoid cell |
| 0.3 | 4.7 | REACTOME METABOLISM OF POLYAMINES | Genes involved in Metabolism of polyamines |
| 0.2 | 2.4 | REACTOME SEMA3A PAK DEPENDENT AXON REPULSION | Genes involved in Sema3A PAK dependent Axon repulsion |
| 0.2 | 1.9 | REACTOME TETRAHYDROBIOPTERIN BH4 SYNTHESIS RECYCLING SALVAGE AND REGULATION | Genes involved in Tetrahydrobiopterin (BH4) synthesis, recycling, salvage and regulation |
| 0.2 | 2.6 | REACTOME ACTIVATION OF THE AP1 FAMILY OF TRANSCRIPTION FACTORS | Genes involved in Activation of the AP-1 family of transcription factors |
| 0.2 | 2.4 | REACTOME SULFUR AMINO ACID METABOLISM | Genes involved in Sulfur amino acid metabolism |
| 0.2 | 9.7 | REACTOME SIGNALING BY ROBO RECEPTOR | Genes involved in Signaling by Robo receptor |
| 0.2 | 1.9 | REACTOME ACTIVATION OF NF KAPPAB IN B CELLS | Genes involved in Activation of NF-kappaB in B Cells |
| 0.2 | 5.9 | REACTOME IL1 SIGNALING | Genes involved in Interleukin-1 signaling |
| 0.2 | 9.7 | REACTOME METABOLISM OF VITAMINS AND COFACTORS | Genes involved in Metabolism of vitamins and cofactors |
| 0.2 | 3.1 | REACTOME FACILITATIVE NA INDEPENDENT GLUCOSE TRANSPORTERS | Genes involved in Facilitative Na+-independent glucose transporters |
| 0.2 | 5.0 | REACTOME ION CHANNEL TRANSPORT | Genes involved in Ion channel transport |
| 0.2 | 8.7 | REACTOME PHASE II CONJUGATION | Genes involved in Phase II conjugation |
| 0.2 | 5.0 | REACTOME SYNTHESIS OF PA | Genes involved in Synthesis of PA |
| 0.2 | 4.9 | REACTOME TIGHT JUNCTION INTERACTIONS | Genes involved in Tight junction interactions |
| 0.1 | 2.0 | REACTOME REGULATION OF PYRUVATE DEHYDROGENASE PDH COMPLEX | Genes involved in Regulation of pyruvate dehydrogenase (PDH) complex |
| 0.1 | 1.6 | REACTOME E2F ENABLED INHIBITION OF PRE REPLICATION COMPLEX FORMATION | Genes involved in E2F-enabled inhibition of pre-replication complex formation |
| 0.1 | 5.7 | REACTOME NUCLEAR SIGNALING BY ERBB4 | Genes involved in Nuclear signaling by ERBB4 |
| 0.1 | 1.9 | REACTOME FGFR1 LIGAND BINDING AND ACTIVATION | Genes involved in FGFR1 ligand binding and activation |
| 0.1 | 1.6 | REACTOME SEROTONIN RECEPTORS | Genes involved in Serotonin receptors |
| 0.1 | 1.5 | REACTOME INHIBITION OF REPLICATION INITIATION OF DAMAGED DNA BY RB1 E2F1 | Genes involved in Inhibition of replication initiation of damaged DNA by RB1/E2F1 |
| 0.1 | 5.5 | REACTOME FORMATION OF THE TERNARY COMPLEX AND SUBSEQUENTLY THE 43S COMPLEX | Genes involved in Formation of the ternary complex, and subsequently, the 43S complex |
| 0.1 | 1.9 | REACTOME G0 AND EARLY G1 | Genes involved in G0 and Early G1 |
| 0.1 | 1.1 | REACTOME P2Y RECEPTORS | Genes involved in P2Y receptors |
| 0.1 | 5.2 | REACTOME CYCLIN E ASSOCIATED EVENTS DURING G1 S TRANSITION | Genes involved in Cyclin E associated events during G1/S transition |
| 0.1 | 3.0 | REACTOME GLYCOLYSIS | Genes involved in Glycolysis |
| 0.1 | 2.8 | REACTOME O LINKED GLYCOSYLATION OF MUCINS | Genes involved in O-linked glycosylation of mucins |
| 0.1 | 1.7 | REACTOME EFFECTS OF PIP2 HYDROLYSIS | Genes involved in Effects of PIP2 hydrolysis |
| 0.1 | 1.2 | REACTOME ABCA TRANSPORTERS IN LIPID HOMEOSTASIS | Genes involved in ABCA transporters in lipid homeostasis |
| 0.1 | 1.4 | REACTOME SMOOTH MUSCLE CONTRACTION | Genes involved in Smooth Muscle Contraction |
| 0.1 | 1.0 | REACTOME INCRETIN SYNTHESIS SECRETION AND INACTIVATION | Genes involved in Incretin Synthesis, Secretion, and Inactivation |
| 0.0 | 2.4 | REACTOME LOSS OF NLP FROM MITOTIC CENTROSOMES | Genes involved in Loss of Nlp from mitotic centrosomes |
| 0.0 | 1.5 | REACTOME RNA POL III TRANSCRIPTION | Genes involved in RNA Polymerase III Transcription |
| 0.0 | 0.7 | REACTOME PURINE SALVAGE | Genes involved in Purine salvage |
| 0.0 | 0.7 | REACTOME GAP JUNCTION ASSEMBLY | Genes involved in Gap junction assembly |
| 0.0 | 0.7 | REACTOME PROCESSING OF INTRONLESS PRE MRNAS | Genes involved in Processing of Intronless Pre-mRNAs |
| 0.0 | 2.0 | REACTOME DOWNSTREAM SIGNAL TRANSDUCTION | Genes involved in Downstream signal transduction |
| 0.0 | 0.8 | REACTOME DOWNREGULATION OF TGF BETA RECEPTOR SIGNALING | Genes involved in Downregulation of TGF-beta receptor signaling |
| 0.0 | 0.8 | REACTOME POST TRANSLATIONAL MODIFICATION SYNTHESIS OF GPI ANCHORED PROTEINS | Genes involved in Post-translational modification: synthesis of GPI-anchored proteins |
| 0.0 | 0.7 | REACTOME AMINO ACID TRANSPORT ACROSS THE PLASMA MEMBRANE | Genes involved in Amino acid transport across the plasma membrane |
| 0.0 | 0.7 | REACTOME TRANSPORT OF VITAMINS NUCLEOSIDES AND RELATED MOLECULES | Genes involved in Transport of vitamins, nucleosides, and related molecules |
| 0.0 | 0.8 | REACTOME SPHINGOLIPID DE NOVO BIOSYNTHESIS | Genes involved in Sphingolipid de novo biosynthesis |
| 0.0 | 0.5 | REACTOME FANCONI ANEMIA PATHWAY | Genes involved in Fanconi Anemia pathway |
| 0.0 | 1.6 | REACTOME SRP DEPENDENT COTRANSLATIONAL PROTEIN TARGETING TO MEMBRANE | Genes involved in SRP-dependent cotranslational protein targeting to membrane |
| 0.0 | 1.0 | REACTOME NUCLEAR RECEPTOR TRANSCRIPTION PATHWAY | Genes involved in Nuclear Receptor transcription pathway |
| 0.0 | 0.2 | REACTOME MICRORNA MIRNA BIOGENESIS | Genes involved in MicroRNA (miRNA) Biogenesis |