Project
GSE53960: rat RNA-Seq transcriptomic Bodymap
Navigation
Downloads
Results for Sox6_Sox9
Z-value: 1.03
Motif logo
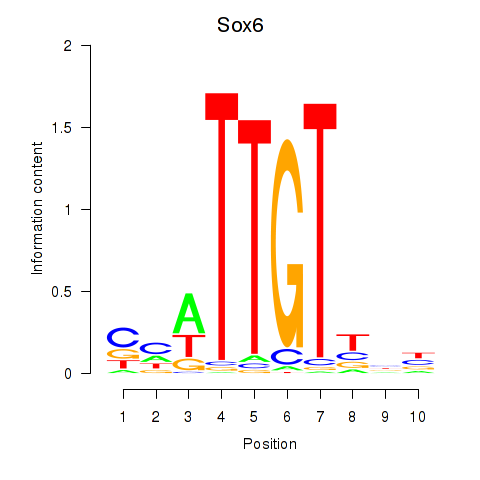
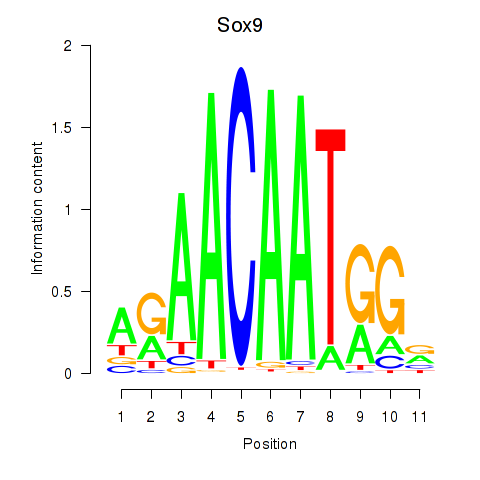
Transcription factors associated with Sox6_Sox9
| Gene Symbol | Gene ID | Gene Info |
|---|---|---|
|
Sox6
|
ENSRNOG00000020514 | SRY box 6 |
|
Sox9
|
ENSRNOG00000002607 | SRY box 9 |
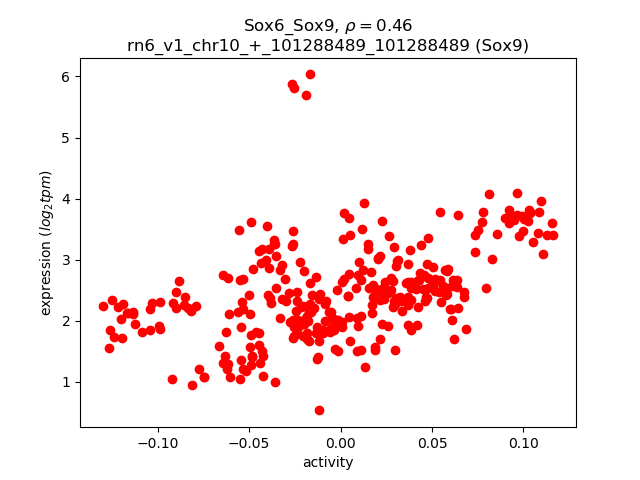
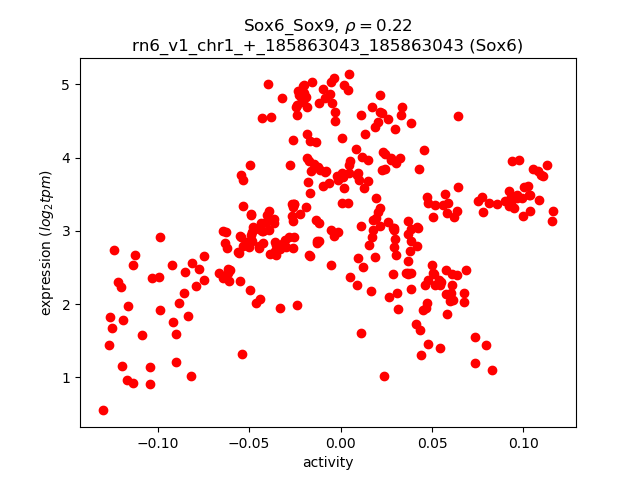
Activity-expression correlation:
| Gene | Promoter | Pearson corr. coef. | P-value | Plot |
|---|---|---|---|---|
| Sox9 | rn6_v1_chr10_+_101288489_101288489 | 0.46 | 4.9e-18 | Click! |
| Sox6 | rn6_v1_chr1_+_185863043_185863043 | 0.22 | 7.7e-05 | Click! |
Activity profile of Sox6_Sox9 motif
Sorted Z-values of Sox6_Sox9 motif
| Promoter | Log-likelihood | Transcript | Gene | Gene Info |
|---|---|---|---|---|
| chr3_+_35014538 | 48.64 |
ENSRNOT00000006341
|
Kif5c
|
kinesin family member 5C |
| chr18_+_79406381 | 47.86 |
ENSRNOT00000022303
ENSRNOT00000058295 ENSRNOT00000058296 ENSRNOT00000022280 |
Mbp
|
myelin basic protein |
| chr4_-_39102807 | 44.11 |
ENSRNOT00000052063
|
Thsd7a
|
thrombospondin type 1 domain containing 7A |
| chr5_+_64326733 | 35.00 |
ENSRNOT00000065775
|
Tmeff1
|
transmembrane protein with EGF-like and two follistatin-like domains 1 |
| chr8_+_128824508 | 34.12 |
ENSRNOT00000025343
|
Mobp
|
myelin-associated oligodendrocyte basic protein |
| chr6_+_147876237 | 32.47 |
ENSRNOT00000056649
|
Tmem196
|
transmembrane protein 196 |
| chr3_+_92640752 | 32.00 |
ENSRNOT00000007604
|
Slc1a2
|
solute carrier family 1 member 2 |
| chr6_+_147876557 | 30.15 |
ENSRNOT00000080090
|
Tmem196
|
transmembrane protein 196 |
| chr9_-_100253609 | 25.61 |
ENSRNOT00000036061
|
Kif1a
|
kinesin family member 1A |
| chr18_+_30562178 | 24.46 |
ENSRNOT00000040998
|
LOC108348771
|
protocadherin beta-16-like |
| chr7_-_136853957 | 21.17 |
ENSRNOT00000008985
|
Nell2
|
neural EGFL like 2 |
| chr15_+_43007908 | 20.20 |
ENSRNOT00000084753
ENSRNOT00000091567 ENSRNOT00000087709 |
Stmn4
|
stathmin 4 |
| chr18_+_30023828 | 20.14 |
ENSRNOT00000079008
|
Pcdha4
|
protocadherin alpha 4 |
| chr3_-_10602672 | 19.79 |
ENSRNOT00000011648
|
Ncs1
|
neuronal calcium sensor 1 |
| chr3_-_168018410 | 19.75 |
ENSRNOT00000087579
|
Bcas1
|
breast carcinoma amplified sequence 1 |
| chr10_+_3411380 | 19.61 |
ENSRNOT00000004346
|
RGD1305733
|
similar to RIKEN cDNA 2900011O08 |
| chr3_+_48082935 | 18.82 |
ENSRNOT00000087711
ENSRNOT00000067545 |
Slc4a10
|
solute carrier family 4 member 10 |
| chr20_+_10123651 | 17.26 |
ENSRNOT00000001559
|
Pde9a
|
phosphodiesterase 9A |
| chr2_+_17616401 | 17.04 |
ENSRNOT00000064991
|
Edil3
|
EGF like repeats and discoidin domains 3 |
| chr2_+_58448917 | 15.62 |
ENSRNOT00000082562
|
Ranbp3l
|
RAN binding protein 3-like |
| chr10_-_45534570 | 15.61 |
ENSRNOT00000058362
|
Gjc2
|
gap junction protein, gamma 2 |
| chr7_-_136853154 | 15.49 |
ENSRNOT00000087376
|
Nell2
|
neural EGFL like 2 |
| chr18_+_30574627 | 15.36 |
ENSRNOT00000060484
|
Pcdhb19
|
protocadherin beta 19 |
| chr4_-_11610518 | 15.17 |
ENSRNOT00000066643
|
Magi2
|
membrane associated guanylate kinase, WW and PDZ domain containing 2 |
| chr5_+_152680407 | 15.05 |
ENSRNOT00000076864
|
Stmn1
|
stathmin 1 |
| chr11_+_74834050 | 14.95 |
ENSRNOT00000002333
|
Atp13a4
|
ATPase 13A4 |
| chr18_+_30387937 | 14.29 |
ENSRNOT00000027210
|
Pcdhb4
|
protocadherin beta 4 |
| chr8_-_82533689 | 14.25 |
ENSRNOT00000014124
|
Tmod2
|
tropomodulin 2 |
| chr3_-_104504204 | 13.94 |
ENSRNOT00000049582
|
Ryr3
|
ryanodine receptor 3 |
| chr3_-_104502471 | 13.69 |
ENSRNOT00000040306
|
Ryr3
|
ryanodine receptor 3 |
| chr18_+_30826260 | 13.31 |
ENSRNOT00000065235
|
Pcdhgb1
|
protocadherin gamma subfamily B, 1 |
| chr18_+_30435119 | 13.20 |
ENSRNOT00000027190
|
Pcdhb8
|
protocadherin beta 8 |
| chr2_-_187401786 | 13.09 |
ENSRNOT00000025624
|
Hapln2
|
hyaluronan and proteoglycan link protein 2 |
| chr16_+_56247659 | 12.83 |
ENSRNOT00000017452
|
Tusc3
|
tumor suppressor candidate 3 |
| chr10_+_82823918 | 12.72 |
ENSRNOT00000005519
|
Samd14
|
sterile alpha motif domain containing 14 |
| chr18_+_15467870 | 12.54 |
ENSRNOT00000091696
|
B4galt6
|
beta-1,4-galactosyltransferase 6 |
| chr4_-_108008484 | 12.52 |
ENSRNOT00000007971
|
Ctnna2
|
catenin alpha 2 |
| chr4_+_84423653 | 12.46 |
ENSRNOT00000012655
|
Chn2
|
chimerin 2 |
| chr14_-_84106997 | 12.30 |
ENSRNOT00000065501
|
Osbp2
|
oxysterol binding protein 2 |
| chr9_+_6966908 | 12.21 |
ENSRNOT00000072796
|
St6gal2
|
ST6 beta-galactoside alpha-2,6-sialyltransferase 2 |
| chr14_+_71542057 | 12.16 |
ENSRNOT00000082592
ENSRNOT00000083701 ENSRNOT00000084322 |
Prom1
|
prominin 1 |
| chr8_+_113105814 | 12.07 |
ENSRNOT00000016749
|
Cpne4
|
copine 4 |
| chr6_+_110624856 | 11.84 |
ENSRNOT00000014017
|
Vash1
|
vasohibin 1 |
| chr18_+_30550877 | 11.70 |
ENSRNOT00000027164
|
LOC108348201
|
protocadherin beta-7-like |
| chr1_+_142679345 | 11.62 |
ENSRNOT00000034267
|
Zscan2
|
zinc finger and SCAN domain containing 2 |
| chr1_+_177093387 | 11.54 |
ENSRNOT00000021858
|
Mical2
|
microtubule associated monooxygenase, calponin and LIM domain containing 2 |
| chr12_+_2534212 | 11.08 |
ENSRNOT00000001399
|
Ctxn1
|
cortexin 1 |
| chr3_+_11114551 | 11.05 |
ENSRNOT00000013507
|
Plpp7
|
phospholipid phosphatase 7 |
| chrX_+_70596576 | 10.86 |
ENSRNOT00000045082
ENSRNOT00000003741 ENSRNOT00000076079 |
Dlg3
|
discs large MAGUK scaffold protein 3 |
| chr13_-_111581018 | 10.83 |
ENSRNOT00000083072
ENSRNOT00000077981 |
Sertad4
|
SERTA domain containing 4 |
| chr13_+_113692131 | 10.69 |
ENSRNOT00000057160
|
Cd34
|
CD34 molecule |
| chr7_-_134722215 | 10.62 |
ENSRNOT00000036750
|
Prickle1
|
prickle planar cell polarity protein 1 |
| chr6_-_42473738 | 10.41 |
ENSRNOT00000033327
|
Kcnf1
|
potassium voltage-gated channel modifier subfamily F member 1 |
| chr1_+_236580034 | 10.16 |
ENSRNOT00000074939
|
Gcnt1
|
glucosaminyl (N-acetyl) transferase 1, core 2 |
| chr8_-_22270647 | 10.12 |
ENSRNOT00000028380
|
S1pr5
|
sphingosine-1-phosphate receptor 5 |
| chr6_-_94980004 | 10.11 |
ENSRNOT00000006373
|
Rtn1
|
reticulon 1 |
| chr18_+_30474947 | 10.09 |
ENSRNOT00000027188
|
Pcdhb9
|
protocadherin beta 9 |
| chrX_+_62727755 | 9.82 |
ENSRNOT00000077055
|
Pcyt1b
|
phosphate cytidylyltransferase 1, choline, beta |
| chr9_-_28973246 | 9.62 |
ENSRNOT00000091865
ENSRNOT00000015453 |
Rims1
|
regulating synaptic membrane exocytosis 1 |
| chr4_-_184096806 | 9.55 |
ENSRNOT00000055433
|
LOC100362344
|
mKIAA1238 protein-like |
| chr4_+_158088505 | 9.43 |
ENSRNOT00000026643
|
Vwf
|
von Willebrand factor |
| chr8_-_62987182 | 9.25 |
ENSRNOT00000070885
|
Islr2
|
immunoglobulin superfamily containing leucine-rich repeat 2 |
| chrX_+_159158194 | 9.25 |
ENSRNOT00000043820
ENSRNOT00000001169 ENSRNOT00000083502 |
Fhl1
|
four and a half LIM domains 1 |
| chr1_+_12915734 | 9.21 |
ENSRNOT00000089066
|
Txlnb
|
taxilin beta |
| chr9_-_5329305 | 9.11 |
ENSRNOT00000078055
|
Slc5a7
|
solute carrier family 5 member 7 |
| chr14_-_82287108 | 8.95 |
ENSRNOT00000023144
|
Fgfr3
|
fibroblast growth factor receptor 3 |
| chr8_-_87282156 | 8.86 |
ENSRNOT00000087874
|
Filip1
|
filamin A interacting protein 1 |
| chr7_-_107223047 | 8.76 |
ENSRNOT00000007250
ENSRNOT00000084875 |
Lrrc6
|
leucine rich repeat containing 6 |
| chr6_+_95205153 | 8.75 |
ENSRNOT00000007339
|
Lrrc9
|
leucine rich repeat containing 9 |
| chr13_+_24823488 | 8.72 |
ENSRNOT00000019907
|
Cdh20
|
cadherin 20 |
| chr6_-_41039437 | 8.57 |
ENSRNOT00000005774
|
Trib2
|
tribbles pseudokinase 2 |
| chr20_+_44521279 | 8.45 |
ENSRNOT00000085987
|
Fyn
|
FYN proto-oncogene, Src family tyrosine kinase |
| chr1_+_268189277 | 8.39 |
ENSRNOT00000065001
|
Sorcs3
|
sortilin-related VPS10 domain containing receptor 3 |
| chr2_-_227207584 | 8.38 |
ENSRNOT00000065361
ENSRNOT00000080215 |
Myoz2
|
myozenin 2 |
| chr6_+_55371738 | 8.32 |
ENSRNOT00000006652
|
Agr3
|
anterior gradient 3, protein disulphide isomerase family member |
| chr2_-_62634785 | 8.30 |
ENSRNOT00000017937
|
Pdzd2
|
PDZ domain containing 2 |
| chr2_-_96520137 | 8.28 |
ENSRNOT00000066966
|
Zc2hc1a
|
zinc finger, C2HC-type containing 1A |
| chr19_+_27404712 | 8.00 |
ENSRNOT00000023657
|
Mylk3
|
myosin light chain kinase 3 |
| chr2_-_117454769 | 7.93 |
ENSRNOT00000068381
|
Mecom
|
MDS1 and EVI1 complex locus |
| chr19_-_26053762 | 7.51 |
ENSRNOT00000004646
|
MAST1
|
microtubule associated serine/threonine kinase 1 |
| chrX_-_134866210 | 7.46 |
ENSRNOT00000005331
|
Apln
|
apelin |
| chr10_-_103340922 | 7.23 |
ENSRNOT00000004191
|
Btbd17
|
BTB domain containing 17 |
| chr2_-_28799266 | 7.22 |
ENSRNOT00000089293
|
Tmem171
|
transmembrane protein 171 |
| chr8_-_39551700 | 7.15 |
ENSRNOT00000091894
ENSRNOT00000076025 |
Pknox2
|
PBX/knotted 1 homeobox 2 |
| chr3_+_176102351 | 7.01 |
ENSRNOT00000013105
|
Col9a3
|
collagen type IX alpha 3 chain |
| chr18_+_30909490 | 7.01 |
ENSRNOT00000026967
|
Pcdhgb8
|
protocadherin gamma subfamily B, 8 |
| chr18_+_29993361 | 6.98 |
ENSRNOT00000075810
|
Pcdha4
|
protocadherin alpha 4 |
| chr8_+_69971778 | 6.77 |
ENSRNOT00000058007
ENSRNOT00000037941 ENSRNOT00000050649 |
Megf11
|
multiple EGF-like-domains 11 |
| chrX_-_105622156 | 6.75 |
ENSRNOT00000029511
|
Armcx2
|
armadillo repeat containing, X-linked 2 |
| chr11_+_86520992 | 6.72 |
ENSRNOT00000040954
|
Gp1bb
|
glycoprotein Ib platelet beta subunit |
| chr5_+_58661049 | 6.72 |
ENSRNOT00000078274
|
Unc13b
|
unc-13 homolog B |
| chr1_+_234363994 | 6.66 |
ENSRNOT00000018137
|
Rorb
|
RAR-related orphan receptor B |
| chr12_-_13668515 | 6.60 |
ENSRNOT00000086847
|
Fscn1
|
fascin actin-bundling protein 1 |
| chr7_-_70467915 | 6.34 |
ENSRNOT00000088995
|
Slc26a10
|
solute carrier family 26, member 10 |
| chr3_+_2396143 | 6.21 |
ENSRNOT00000012388
|
Nrarp
|
Notch-regulated ankyrin repeat protein |
| chr10_-_90393317 | 6.14 |
ENSRNOT00000028563
|
Fam171a2
|
family with sequence similarity 171, member A2 |
| chr16_-_71319449 | 6.07 |
ENSRNOT00000029284
|
Fgfr1
|
Fibroblast growth factor receptor 1 |
| chr18_+_30913842 | 6.01 |
ENSRNOT00000026947
|
Pcdhgc3
|
protocadherin gamma subfamily C, 3 |
| chr9_-_28972835 | 6.01 |
ENSRNOT00000086967
ENSRNOT00000079684 |
Rims1
|
regulating synaptic membrane exocytosis 1 |
| chrX_-_115175299 | 5.96 |
ENSRNOT00000074322
|
Dcx
|
doublecortin |
| chr18_+_30869628 | 5.89 |
ENSRNOT00000060470
|
Pcdhgb4
|
protocadherin gamma subfamily B, 4 |
| chr9_-_80167033 | 5.75 |
ENSRNOT00000023530
|
Igfbp5
|
insulin-like growth factor binding protein 5 |
| chr11_+_16826399 | 5.69 |
ENSRNOT00000050701
|
Cxadr
|
coxsackie virus and adenovirus receptor |
| chr17_-_81187739 | 5.65 |
ENSRNOT00000063911
|
Hacd1
|
3-hydroxyacyl-CoA dehydratase 1 |
| chr18_+_30880020 | 5.63 |
ENSRNOT00000060468
|
Pcdhgb5
|
protocadherin gamma subfamily B, 5 |
| chr5_+_104394119 | 5.60 |
ENSRNOT00000093557
ENSRNOT00000093462 |
Adamtsl1
|
ADAMTS-like 1 |
| chr16_+_39909270 | 5.60 |
ENSRNOT00000081994
|
Wdr17
|
WD repeat domain 17 |
| chr6_+_44225233 | 5.53 |
ENSRNOT00000066593
|
Kidins220
|
kinase D-interacting substrate 220 |
| chr14_+_114126943 | 5.51 |
ENSRNOT00000041638
ENSRNOT00000006443 ENSRNOT00000006957 |
Rtn4
|
reticulon 4 |
| chr4_+_113968995 | 5.48 |
ENSRNOT00000079511
|
Rtkn
|
rhotekin |
| chr7_-_63407241 | 5.47 |
ENSRNOT00000024679
|
Tbc1d30
|
TBC1 domain family, member 30 |
| chr7_-_107768072 | 5.45 |
ENSRNOT00000093189
|
Ndrg1
|
N-myc downstream regulated 1 |
| chr2_+_208749996 | 5.33 |
ENSRNOT00000086321
|
Chia
|
chitinase, acidic |
| chr18_-_38088457 | 5.31 |
ENSRNOT00000077814
|
Jakmip2
|
janus kinase and microtubule interacting protein 2 |
| chr6_-_1942972 | 5.30 |
ENSRNOT00000048711
|
Cdc42ep3
|
CDC42 effector protein 3 |
| chr18_+_30890869 | 5.29 |
ENSRNOT00000060466
|
Pcdhgb6
|
protocadherin gamma subfamily B, 6 |
| chr19_+_56220755 | 5.28 |
ENSRNOT00000023452
|
Tubb3
|
tubulin, beta 3 class III |
| chrX_+_28593405 | 5.24 |
ENSRNOT00000071708
|
Tmsb4x
|
thymosin beta 4, X-linked |
| chr16_+_2670618 | 5.17 |
ENSRNOT00000030102
|
Il17rd
|
interleukin 17 receptor D |
| chr7_-_15301382 | 5.16 |
ENSRNOT00000081512
|
Zfp763
|
zinc finger protein 763 |
| chr15_+_41927241 | 5.03 |
ENSRNOT00000012035
|
Trim13
|
tripartite motif-containing 13 |
| chr5_+_90338795 | 4.96 |
ENSRNOT00000077864
ENSRNOT00000058882 |
LOC298139
|
similar to RIKEN cDNA 2310003M01 |
| chr2_+_203768117 | 4.92 |
ENSRNOT00000080176
|
Igsf3
|
immunoglobulin superfamily, member 3 |
| chr18_+_30875011 | 4.76 |
ENSRNOT00000027009
|
Pcdhga8
|
protocadherin gamma subfamily A, 8 |
| chr14_-_44845218 | 4.67 |
ENSRNOT00000004003
|
Klhl5
|
kelch-like family member 5 |
| chr4_-_88565292 | 4.61 |
ENSRNOT00000008948
|
Lancl2
|
LanC like 2 |
| chr14_+_84150908 | 4.58 |
ENSRNOT00000005516
|
Dusp18
|
dual specificity phosphatase 18 |
| chr16_-_19791832 | 4.44 |
ENSRNOT00000040393
|
Ushbp1
|
USH1 protein network component harmonin binding protein 1 |
| chr13_+_106751625 | 4.36 |
ENSRNOT00000004992
|
Ush2a
|
usherin |
| chr18_+_30900291 | 4.33 |
ENSRNOT00000060461
|
Pcdhgb7
|
protocadherin gamma subfamily B, 7 |
| chr4_+_83713666 | 4.32 |
ENSRNOT00000086473
|
Creb5
|
cAMP responsive element binding protein 5 |
| chr16_-_71319052 | 4.25 |
ENSRNOT00000050980
|
Fgfr1
|
Fibroblast growth factor receptor 1 |
| chr3_+_103773459 | 4.19 |
ENSRNOT00000079727
|
Slc12a6
|
solute carrier family 12, member 6 |
| chr5_+_78483893 | 4.05 |
ENSRNOT00000059183
ENSRNOT00000059181 |
Rgs3
|
regulator of G-protein signaling 3 |
| chrX_+_33443186 | 3.86 |
ENSRNOT00000005622
|
S100g
|
S100 calcium binding protein G |
| chr20_+_42966140 | 3.86 |
ENSRNOT00000000707
|
Marcks
|
myristoylated alanine rich protein kinase C substrate |
| chr20_-_38985036 | 3.78 |
ENSRNOT00000001066
|
Serinc1
|
serine incorporator 1 |
| chr1_-_126211439 | 3.78 |
ENSRNOT00000014988
|
Tjp1
|
tight junction protein 1 |
| chr10_+_92018562 | 3.77 |
ENSRNOT00000006483
|
Arf2
|
ADP-ribosylation factor 2 |
| chr3_+_3767394 | 3.70 |
ENSRNOT00000067840
|
Gpsm1
|
G-protein signaling modulator 1 |
| chr14_-_72122158 | 3.68 |
ENSRNOT00000064495
|
C1qtnf7
|
C1q and tumor necrosis factor related protein 7 |
| chr1_-_167911961 | 3.60 |
ENSRNOT00000025097
|
Olr59
|
olfactory receptor 59 |
| chrX_+_40363646 | 3.59 |
ENSRNOT00000010135
|
Sms
|
spermine synthase |
| chr7_-_140640953 | 3.58 |
ENSRNOT00000083156
|
Tuba1a
|
tubulin, alpha 1A |
| chr3_+_123031307 | 3.52 |
ENSRNOT00000080379
|
Ptpra
|
protein tyrosine phosphatase, receptor type, A |
| chrX_+_65566047 | 3.51 |
ENSRNOT00000092103
|
Heph
|
hephaestin |
| chr13_-_95250235 | 3.49 |
ENSRNOT00000085648
|
Akt3
|
AKT serine/threonine kinase 3 |
| chr3_+_116899878 | 3.48 |
ENSRNOT00000090802
ENSRNOT00000066101 |
Sema6d
|
semaphorin 6D |
| chr6_-_51019407 | 3.46 |
ENSRNOT00000011659
|
Gpr22
|
G protein-coupled receptor 22 |
| chr3_-_160038078 | 3.41 |
ENSRNOT00000013445
|
Serinc3
|
serine incorporator 3 |
| chr17_+_23116661 | 3.38 |
ENSRNOT00000067374
|
Nedd9
|
neural precursor cell expressed, developmentally down-regulated 9 |
| chr18_+_25613831 | 3.28 |
ENSRNOT00000091040
|
Tslp
|
thymic stromal lymphopoietin |
| chr20_+_48335540 | 3.21 |
ENSRNOT00000000352
|
Cd24
|
CD24 molecule |
| chr5_+_113725717 | 3.11 |
ENSRNOT00000032248
|
Tek
|
TEK receptor tyrosine kinase |
| chr17_+_18151982 | 3.10 |
ENSRNOT00000066447
|
Kif13a
|
kinesin family member 13A |
| chr1_+_13595295 | 3.09 |
ENSRNOT00000079250
|
Nhsl1
|
NHS-like 1 |
| chr11_+_57265732 | 3.02 |
ENSRNOT00000093174
|
Phldb2
|
pleckstrin homology-like domain, family B, member 2 |
| chr6_-_79306443 | 3.01 |
ENSRNOT00000030706
|
Clec14a
|
C-type lectin domain family 14, member A |
| chr7_+_120891940 | 3.00 |
ENSRNOT00000018787
|
Cby1
|
chibby family member 1, beta catenin antagonist |
| chr9_+_47134034 | 2.98 |
ENSRNOT00000020108
|
Il1rl1
|
interleukin 1 receptor-like 1 |
| chr5_-_124642569 | 2.96 |
ENSRNOT00000010680
|
Prkaa2
|
protein kinase AMP-activated catalytic subunit alpha 2 |
| chr8_-_109576353 | 2.94 |
ENSRNOT00000010320
|
Ppp2r3a
|
protein phosphatase 2, regulatory subunit B'', alpha |
| chr14_-_81399353 | 2.89 |
ENSRNOT00000018340
|
Add1
|
adducin 1 |
| chr1_+_264741911 | 2.85 |
ENSRNOT00000019956
|
Sema4g
|
semaphorin 4G |
| chr7_-_59514939 | 2.82 |
ENSRNOT00000085579
|
Kcnmb4
|
potassium calcium-activated channel subfamily M regulatory beta subunit 4 |
| chr3_-_8615532 | 2.79 |
ENSRNOT00000021132
|
Wdr34
|
WD repeat domain 34 |
| chr4_-_72143748 | 2.77 |
ENSRNOT00000024428
|
Tcaf1
|
TRPM8 channel-associated factor 1 |
| chr13_+_51972974 | 2.77 |
ENSRNOT00000008164
|
Arl8a
|
ADP-ribosylation factor like GTPase 8A |
| chr12_-_31629881 | 2.72 |
ENSRNOT00000001238
|
Piwil1
|
piwi-like RNA-mediated gene silencing 1 |
| chr2_+_22909569 | 2.72 |
ENSRNOT00000073871
|
Homer1
|
homer scaffolding protein 1 |
| chr2_-_158156444 | 2.61 |
ENSRNOT00000088559
|
Veph1
|
ventricular zone expressed PH domain-containing 1 |
| chr8_+_113939886 | 2.57 |
ENSRNOT00000079562
|
Aste1
|
asteroid homolog 1 (Drosophila) |
| chr1_-_277902279 | 2.55 |
ENSRNOT00000078416
|
Ablim1
|
actin-binding LIM protein 1 |
| chr18_+_60392376 | 2.55 |
ENSRNOT00000023890
|
Nedd4l
|
neural precursor cell expressed, developmentally down-regulated 4-like, E3 ubiquitin protein ligase |
| chr15_+_7871497 | 2.46 |
ENSRNOT00000046879
|
Ube2e2
|
ubiquitin-conjugating enzyme E2E 2 |
| chr12_+_10254951 | 2.43 |
ENSRNOT00000061129
|
Gpr12
|
G protein-coupled receptor 12 |
| chr1_+_264059374 | 2.33 |
ENSRNOT00000075397
|
Scd2
|
stearoyl-Coenzyme A desaturase 2 |
| chrX_+_152885246 | 2.27 |
ENSRNOT00000087074
|
AABR07042326.3
|
|
| chr14_-_6786144 | 2.23 |
ENSRNOT00000091558
|
Mepe
|
matrix extracellular phosphoglycoprotein |
| chr6_+_132510757 | 2.18 |
ENSRNOT00000080230
|
Evl
|
Enah/Vasp-like |
| chr18_-_26211445 | 2.17 |
ENSRNOT00000027739
|
Nrep
|
neuronal regeneration related protein |
| chr18_-_16497886 | 2.13 |
ENSRNOT00000021624
|
Rprd1a
|
regulation of nuclear pre-mRNA domain containing 1A |
| chr14_+_81858737 | 2.13 |
ENSRNOT00000029784
ENSRNOT00000058068 ENSRNOT00000058067 |
Poln
|
DNA polymerase nu |
| chr3_+_148510779 | 2.06 |
ENSRNOT00000012156
|
Xkr7
|
XK related 7 |
| chr3_-_137969658 | 2.06 |
ENSRNOT00000007727
|
Bfsp1
|
beaded filament structural protein 1 |
| chr4_-_166803127 | 1.98 |
ENSRNOT00000067909
|
RGD1306750
|
LOC362451 |
| chr6_+_91595823 | 1.95 |
ENSRNOT00000006223
|
Klhdc2
|
kelch domain containing 2 |
| chr3_+_20993205 | 1.94 |
ENSRNOT00000010465
|
Olr419
|
olfactory receptor 419 |
| chr3_+_155160481 | 1.90 |
ENSRNOT00000021133
|
Ppp1r16b
|
protein phosphatase 1, regulatory subunit 16B |
| chr5_+_133865331 | 1.85 |
ENSRNOT00000035409
|
Tal1
|
TAL bHLH transcription factor 1, erythroid differentiation factor |
| chr14_-_84189266 | 1.84 |
ENSRNOT00000005934
|
Tcn2
|
transcobalamin 2 |
| chr6_-_135877883 | 1.81 |
ENSRNOT00000079092
|
AABR07065589.1
|
|
| chr10_-_74119009 | 1.79 |
ENSRNOT00000085712
ENSRNOT00000006926 |
Dhx40
|
DEAH-box helicase 40 |
| chr2_+_189865915 | 1.78 |
ENSRNOT00000077362
|
Ilf2
|
interleukin enhancer binding factor 2 |
| chr10_-_16731898 | 1.76 |
ENSRNOT00000028186
|
Crebrf
|
CREB3 regulatory factor |
| chr9_-_14551519 | 1.75 |
ENSRNOT00000067623
|
Oard1
|
O-acyl-ADP-ribose deacylase 1 |
| chr10_+_82775691 | 1.72 |
ENSRNOT00000030737
|
Hils1
|
histone linker H1 domain, spermatid-specific 1 |
| chr14_-_104960141 | 1.68 |
ENSRNOT00000056944
|
Aftph
|
aftiphilin |
| chrX_-_157172068 | 1.66 |
ENSRNOT00000087962
|
Dusp9
|
dual specificity phosphatase 9 |
| chr5_+_173340487 | 1.64 |
ENSRNOT00000078306
|
Acap3
|
ArfGAP with coiled-coil, ankyrin repeat and PH domains 3 |
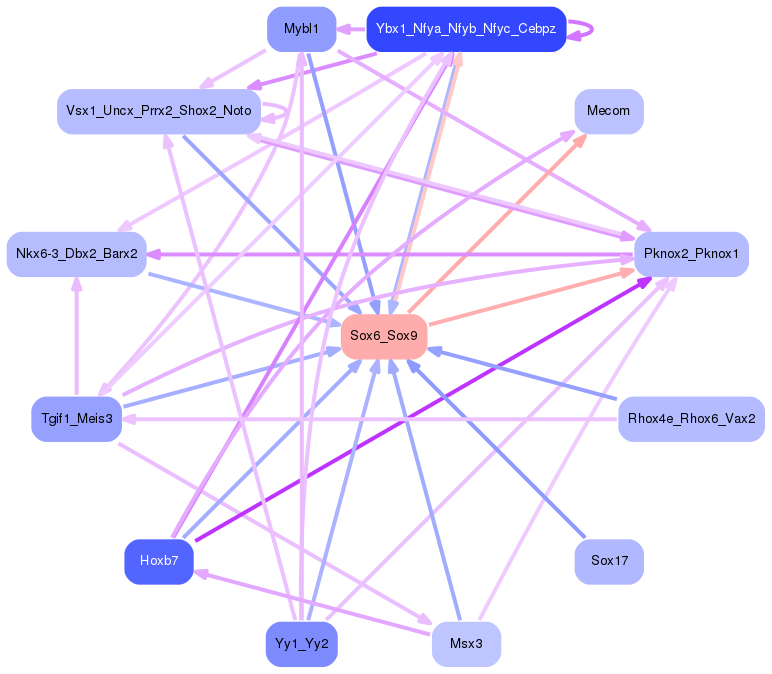
Network of associatons between targets according to the STRING database.

First level regulatory network of Sox6_Sox9
Gene Ontology Analysis
Gene overrepresentation in biological process category:
| Log-likelihood per target | Total log-likelihood | Term | Description |
|---|---|---|---|
| 16.0 | 47.9 | GO:1904209 | regulation of chemokine (C-C motif) ligand 2 secretion(GO:1904207) positive regulation of chemokine (C-C motif) ligand 2 secretion(GO:1904209) positive regulation of metalloendopeptidase activity(GO:1904685) |
| 12.2 | 48.6 | GO:0098963 | dendritic transport of ribonucleoprotein complex(GO:0098961) dendritic transport of messenger ribonucleoprotein complex(GO:0098963) anterograde dendritic transport of messenger ribonucleoprotein complex(GO:0098964) |
| 6.4 | 32.0 | GO:0070777 | D-aspartate transport(GO:0070777) D-aspartate import(GO:0070779) |
| 5.2 | 15.6 | GO:0031632 | positive regulation of synaptic vesicle fusion to presynaptic membrane(GO:0031632) |
| 4.9 | 19.6 | GO:1903976 | negative regulation of glial cell migration(GO:1903976) |
| 3.8 | 11.5 | GO:0019417 | sulfur oxidation(GO:0019417) |
| 3.8 | 15.4 | GO:0072139 | glomerular parietal epithelial cell differentiation(GO:0072139) |
| 3.6 | 10.7 | GO:0072209 | mesangial cell-matrix adhesion(GO:0035759) positive regulation of granulocyte colony-stimulating factor production(GO:0071657) metanephric mesangial cell differentiation(GO:0072209) metanephric glomerular mesangial cell differentiation(GO:0072254) positive regulation of macrophage colony-stimulating factor production(GO:1901258) |
| 3.4 | 10.3 | GO:0048377 | lateral mesodermal cell fate commitment(GO:0048372) lateral mesodermal cell fate specification(GO:0048377) regulation of lateral mesodermal cell fate specification(GO:0048378) |
| 3.1 | 36.7 | GO:0046543 | development of secondary female sexual characteristics(GO:0046543) |
| 3.0 | 11.8 | GO:1901491 | negative regulation of lymphangiogenesis(GO:1901491) |
| 2.1 | 8.6 | GO:0042091 | interleukin-10 biosynthetic process(GO:0042091) regulation of interleukin-10 biosynthetic process(GO:0045074) |
| 1.9 | 15.2 | GO:0097118 | neuroligin clustering involved in postsynaptic membrane assembly(GO:0097118) |
| 1.9 | 5.7 | GO:0071529 | cementum mineralization(GO:0071529) |
| 1.9 | 7.5 | GO:0043397 | corticotropin-releasing hormone secretion(GO:0043396) regulation of corticotropin-releasing hormone secretion(GO:0043397) |
| 1.8 | 9.1 | GO:0008292 | acetylcholine biosynthetic process(GO:0008292) acetate ester biosynthetic process(GO:1900620) |
| 1.8 | 8.9 | GO:0061144 | alveolar secondary septum development(GO:0061144) |
| 1.8 | 14.2 | GO:0051694 | pointed-end actin filament capping(GO:0051694) |
| 1.7 | 6.7 | GO:0010808 | positive regulation of synaptic vesicle priming(GO:0010808) |
| 1.6 | 13.1 | GO:0008065 | establishment of blood-nerve barrier(GO:0008065) |
| 1.6 | 8.0 | GO:0060298 | positive regulation of sarcomere organization(GO:0060298) |
| 1.5 | 4.6 | GO:1901421 | positive regulation of response to alcohol(GO:1901421) |
| 1.4 | 5.7 | GO:1904204 | regulation of skeletal muscle hypertrophy(GO:1904204) |
| 1.4 | 8.4 | GO:1902951 | negative regulation of dendritic spine maintenance(GO:1902951) |
| 1.4 | 4.2 | GO:0071477 | hypotonic salinity response(GO:0042539) cellular hypotonic salinity response(GO:0071477) |
| 1.4 | 12.5 | GO:0021942 | radial glia guided migration of Purkinje cell(GO:0021942) |
| 1.3 | 17.3 | GO:0046069 | cGMP catabolic process(GO:0046069) |
| 1.3 | 3.8 | GO:1904219 | regulation of CDP-diacylglycerol-serine O-phosphatidyltransferase activity(GO:1904217) positive regulation of CDP-diacylglycerol-serine O-phosphatidyltransferase activity(GO:1904219) positive regulation of serine C-palmitoyltransferase activity(GO:1904222) |
| 1.2 | 23.4 | GO:0021860 | pyramidal neuron development(GO:0021860) |
| 1.2 | 3.6 | GO:1900135 | positive regulation of renin secretion into blood stream(GO:1900135) |
| 1.2 | 10.6 | GO:0051890 | regulation of cardioblast differentiation(GO:0051890) |
| 1.1 | 3.4 | GO:0009597 | detection of virus(GO:0009597) |
| 1.1 | 9.8 | GO:1904116 | response to vasopressin(GO:1904116) |
| 1.1 | 5.3 | GO:0006030 | chitin metabolic process(GO:0006030) chitin catabolic process(GO:0006032) |
| 1.0 | 9.4 | GO:0070417 | cellular response to cold(GO:0070417) |
| 1.0 | 3.1 | GO:0048014 | Tie signaling pathway(GO:0048014) |
| 1.0 | 3.0 | GO:0038172 | interleukin-33-mediated signaling pathway(GO:0038172) |
| 1.0 | 10.9 | GO:0046710 | GDP metabolic process(GO:0046710) |
| 1.0 | 2.9 | GO:0090249 | cell motility involved in somitogenic axis elongation(GO:0090247) regulation of cell motility involved in somitogenic axis elongation(GO:0090249) |
| 1.0 | 8.8 | GO:0060287 | epithelial cilium movement involved in determination of left/right asymmetry(GO:0060287) |
| 1.0 | 143.0 | GO:0007156 | homophilic cell adhesion via plasma membrane adhesion molecules(GO:0007156) |
| 1.0 | 27.6 | GO:0051481 | negative regulation of cytosolic calcium ion concentration(GO:0051481) |
| 0.9 | 5.7 | GO:0098904 | regulation of AV node cell action potential(GO:0098904) |
| 0.9 | 6.6 | GO:0030035 | microspike assembly(GO:0030035) cellular response to cell-matrix adhesion(GO:0071460) |
| 0.9 | 10.2 | GO:0060352 | cell adhesion molecule production(GO:0060352) |
| 0.9 | 12.8 | GO:0015693 | magnesium ion transport(GO:0015693) magnesium ion transmembrane transport(GO:1903830) |
| 0.9 | 6.0 | GO:0021553 | olfactory nerve development(GO:0021553) |
| 0.8 | 15.0 | GO:0031115 | negative regulation of microtubule polymerization(GO:0031115) |
| 0.8 | 12.5 | GO:0006688 | glycosphingolipid biosynthetic process(GO:0006688) |
| 0.8 | 3.9 | GO:1900020 | regulation of protein kinase C activity(GO:1900019) positive regulation of protein kinase C activity(GO:1900020) |
| 0.8 | 3.0 | GO:1903690 | negative regulation of wound healing, spreading of epidermal cells(GO:1903690) |
| 0.7 | 5.2 | GO:2000483 | negative regulation of interleukin-8 secretion(GO:2000483) |
| 0.7 | 8.1 | GO:0002043 | blood vessel endothelial cell proliferation involved in sprouting angiogenesis(GO:0002043) |
| 0.7 | 12.5 | GO:0001675 | acrosome assembly(GO:0001675) |
| 0.7 | 2.9 | GO:1903142 | positive regulation of endothelial cell development(GO:1901552) positive regulation of establishment of endothelial barrier(GO:1903142) |
| 0.7 | 12.2 | GO:0097503 | sialylation(GO:0097503) |
| 0.7 | 10.1 | GO:0003376 | sphingosine-1-phosphate signaling pathway(GO:0003376) |
| 0.6 | 2.5 | GO:2001288 | positive regulation of caveolin-mediated endocytosis(GO:2001288) |
| 0.6 | 4.4 | GO:0048496 | maintenance of organ identity(GO:0048496) |
| 0.6 | 1.9 | GO:0060375 | positive regulation of chromatin assembly or disassembly(GO:0045799) regulation of mast cell differentiation(GO:0060375) |
| 0.6 | 1.8 | GO:1902211 | regulation of prolactin signaling pathway(GO:1902211) |
| 0.6 | 2.3 | GO:1903964 | monounsaturated fatty acid metabolic process(GO:1903964) monounsaturated fatty acid biosynthetic process(GO:1903966) |
| 0.6 | 3.9 | GO:0071000 | response to magnetism(GO:0071000) |
| 0.6 | 15.6 | GO:0045663 | positive regulation of myoblast differentiation(GO:0045663) |
| 0.6 | 6.7 | GO:0046548 | retinal rod cell development(GO:0046548) retinal cone cell development(GO:0046549) |
| 0.5 | 4.9 | GO:0090336 | positive regulation of brown fat cell differentiation(GO:0090336) |
| 0.5 | 3.1 | GO:0072386 | plus-end-directed vesicle transport along microtubule(GO:0072383) plus-end-directed organelle transport along microtubule(GO:0072386) |
| 0.5 | 12.7 | GO:0010832 | negative regulation of myotube differentiation(GO:0010832) |
| 0.5 | 5.5 | GO:0038180 | nerve growth factor signaling pathway(GO:0038180) |
| 0.5 | 8.5 | GO:1902358 | sulfate transmembrane transport(GO:1902358) |
| 0.5 | 5.4 | GO:0032287 | peripheral nervous system myelin maintenance(GO:0032287) |
| 0.5 | 2.5 | GO:0032020 | ISG15-protein conjugation(GO:0032020) |
| 0.5 | 5.3 | GO:0031274 | positive regulation of pseudopodium assembly(GO:0031274) |
| 0.4 | 4.9 | GO:0032808 | lacrimal gland development(GO:0032808) |
| 0.4 | 1.3 | GO:0010908 | regulation of heparan sulfate proteoglycan biosynthetic process(GO:0010908) positive regulation of heparan sulfate proteoglycan biosynthetic process(GO:0010909) regulation of centriole-centriole cohesion(GO:0030997) embryonic skeletal limb joint morphogenesis(GO:0036023) anagen(GO:0042640) regulation of anagen(GO:0051884) oviduct development(GO:0060066) foregut regionalization(GO:0060423) lung field specification(GO:0060424) lung induction(GO:0060492) positive regulation of epithelial cell proliferation involved in prostate gland development(GO:0060769) fungiform papilla formation(GO:0061198) canonical Wnt signaling pathway involved in positive regulation of cardiac outflow tract cell proliferation(GO:0061324) regulation of centromeric sister chromatid cohesion(GO:0070602) renal outer medulla development(GO:0072054) regulation of cell proliferation involved in outflow tract morphogenesis(GO:1901963) |
| 0.4 | 2.1 | GO:0070940 | dephosphorylation of RNA polymerase II C-terminal domain(GO:0070940) |
| 0.4 | 6.8 | GO:0010842 | retina layer formation(GO:0010842) |
| 0.4 | 5.5 | GO:1902018 | negative regulation of cilium assembly(GO:1902018) |
| 0.4 | 8.4 | GO:1900452 | regulation of long term synaptic depression(GO:1900452) |
| 0.4 | 2.8 | GO:1901529 | positive regulation of anion channel activity(GO:1901529) |
| 0.4 | 2.7 | GO:0010529 | regulation of transposition(GO:0010528) negative regulation of transposition(GO:0010529) |
| 0.4 | 1.8 | GO:0015889 | cobalamin transport(GO:0015889) |
| 0.4 | 20.2 | GO:0007019 | microtubule depolymerization(GO:0007019) |
| 0.4 | 3.6 | GO:0008215 | spermine metabolic process(GO:0008215) |
| 0.3 | 4.6 | GO:0035970 | peptidyl-threonine dephosphorylation(GO:0035970) |
| 0.3 | 1.5 | GO:0061303 | cornea development in camera-type eye(GO:0061303) |
| 0.3 | 5.0 | GO:1902187 | negative regulation of viral release from host cell(GO:1902187) |
| 0.2 | 0.7 | GO:0034436 | glycoprotein transport(GO:0034436) |
| 0.2 | 1.5 | GO:2000303 | regulation of sphingolipid biosynthetic process(GO:0090153) regulation of membrane lipid metabolic process(GO:1905038) regulation of ceramide biosynthetic process(GO:2000303) |
| 0.2 | 9.2 | GO:0043268 | positive regulation of potassium ion transport(GO:0043268) |
| 0.2 | 2.7 | GO:2001256 | regulation of store-operated calcium entry(GO:2001256) |
| 0.2 | 19.8 | GO:0045921 | positive regulation of exocytosis(GO:0045921) |
| 0.2 | 2.8 | GO:0005513 | detection of calcium ion(GO:0005513) |
| 0.2 | 2.2 | GO:1900028 | negative regulation of ruffle assembly(GO:1900028) |
| 0.2 | 3.0 | GO:0045821 | positive regulation of glycolytic process(GO:0045821) |
| 0.2 | 9.2 | GO:0045773 | positive regulation of axon extension(GO:0045773) |
| 0.2 | 0.5 | GO:1902966 | protein localization to early endosome(GO:1902946) regulation of protein localization to early endosome(GO:1902965) positive regulation of protein localization to early endosome(GO:1902966) |
| 0.2 | 3.5 | GO:0048714 | positive regulation of oligodendrocyte differentiation(GO:0048714) |
| 0.2 | 0.9 | GO:1903361 | protein localization to basolateral plasma membrane(GO:1903361) |
| 0.2 | 2.1 | GO:0019985 | translesion synthesis(GO:0019985) |
| 0.1 | 17.2 | GO:0010811 | positive regulation of cell-substrate adhesion(GO:0010811) |
| 0.1 | 1.4 | GO:0031468 | nuclear envelope reassembly(GO:0031468) |
| 0.1 | 2.2 | GO:0030502 | negative regulation of bone mineralization(GO:0030502) |
| 0.1 | 25.6 | GO:0007018 | microtubule-based movement(GO:0007018) |
| 0.1 | 0.3 | GO:0090283 | regulation of protein glycosylation in Golgi(GO:0090283) |
| 0.1 | 0.3 | GO:0034141 | positive regulation of toll-like receptor 3 signaling pathway(GO:0034141) |
| 0.1 | 3.5 | GO:0021591 | ventricular system development(GO:0021591) |
| 0.1 | 3.5 | GO:0048854 | brain morphogenesis(GO:0048854) |
| 0.1 | 3.0 | GO:0002042 | cell migration involved in sprouting angiogenesis(GO:0002042) |
| 0.1 | 1.1 | GO:0033141 | regulation of peptidyl-serine phosphorylation of STAT protein(GO:0033139) positive regulation of peptidyl-serine phosphorylation of STAT protein(GO:0033141) |
| 0.1 | 12.3 | GO:0007286 | spermatid development(GO:0007286) |
| 0.1 | 1.7 | GO:0000188 | inactivation of MAPK activity(GO:0000188) |
| 0.1 | 1.4 | GO:0007035 | vacuolar acidification(GO:0007035) |
| 0.1 | 1.1 | GO:0097435 | fibril organization(GO:0097435) |
| 0.1 | 0.6 | GO:0044821 | meiotic telomere tethering at nuclear periphery(GO:0044821) meiotic attachment of telomere to nuclear envelope(GO:0070197) chromosome attachment to the nuclear envelope(GO:0097240) |
| 0.1 | 0.6 | GO:0015727 | lactate transport(GO:0015727) lactate transmembrane transport(GO:0035873) |
| 0.1 | 0.9 | GO:0035313 | wound healing, spreading of epidermal cells(GO:0035313) |
| 0.1 | 1.8 | GO:0034260 | negative regulation of GTPase activity(GO:0034260) |
| 0.1 | 1.7 | GO:0030261 | chromosome condensation(GO:0030261) |
| 0.1 | 0.1 | GO:0051692 | cellular oligosaccharide catabolic process(GO:0051692) |
| 0.1 | 0.7 | GO:0006977 | DNA damage response, signal transduction by p53 class mediator resulting in cell cycle arrest(GO:0006977) |
| 0.1 | 0.4 | GO:0002087 | regulation of respiratory gaseous exchange by neurological system process(GO:0002087) |
| 0.1 | 2.2 | GO:0031103 | axon regeneration(GO:0031103) |
| 0.1 | 8.7 | GO:0071805 | cellular potassium ion transport(GO:0071804) potassium ion transmembrane transport(GO:0071805) |
| 0.0 | 2.6 | GO:0030032 | lamellipodium assembly(GO:0030032) |
| 0.0 | 11.9 | GO:0070588 | calcium ion transmembrane transport(GO:0070588) |
| 0.0 | 0.8 | GO:0030517 | negative regulation of axon extension(GO:0030517) |
| 0.0 | 1.0 | GO:0006221 | pyrimidine nucleotide biosynthetic process(GO:0006221) |
| 0.0 | 0.7 | GO:0032012 | regulation of ARF protein signal transduction(GO:0032012) |
| 0.0 | 5.0 | GO:0060271 | cilium morphogenesis(GO:0060271) |
| 0.0 | 0.3 | GO:0006607 | NLS-bearing protein import into nucleus(GO:0006607) |
| 0.0 | 3.1 | GO:0006874 | cellular calcium ion homeostasis(GO:0006874) |
| 0.0 | 0.9 | GO:2000648 | positive regulation of stem cell proliferation(GO:2000648) |
| 0.0 | 0.4 | GO:0060416 | response to growth hormone(GO:0060416) |
| 0.0 | 0.4 | GO:0048025 | negative regulation of mRNA splicing, via spliceosome(GO:0048025) |
| 0.0 | 1.3 | GO:0008585 | female gonad development(GO:0008585) |
| 0.0 | 1.8 | GO:0007411 | axon guidance(GO:0007411) |
Gene overrepresentation in cellular component category:
| Log-likelihood per target | Total log-likelihood | Term | Description |
|---|---|---|---|
| 8.0 | 47.9 | GO:0033269 | internode region of axon(GO:0033269) |
| 3.2 | 48.6 | GO:0035253 | ciliary rootlet(GO:0035253) |
| 3.1 | 18.8 | GO:0097441 | basilar dendrite(GO:0097441) |
| 3.1 | 27.6 | GO:0030314 | junctional membrane complex(GO:0030314) |
| 3.0 | 12.2 | GO:0071914 | prominosome(GO:0071914) |
| 2.3 | 7.0 | GO:0005594 | collagen type IX trimer(GO:0005594) |
| 2.2 | 6.6 | GO:0044393 | microspike(GO:0044393) |
| 2.0 | 15.6 | GO:0098831 | presynaptic active zone cytoplasmic component(GO:0098831) |
| 1.6 | 9.4 | GO:0033093 | Weibel-Palade body(GO:0033093) |
| 1.5 | 15.2 | GO:0036056 | filtration diaphragm(GO:0036056) slit diaphragm(GO:0036057) |
| 1.2 | 19.8 | GO:0031045 | dense core granule(GO:0031045) |
| 1.0 | 3.9 | GO:0044307 | germinal vesicle(GO:0042585) dendritic branch(GO:0044307) |
| 1.0 | 6.7 | GO:0044305 | calyx of Held(GO:0044305) |
| 1.0 | 5.7 | GO:0042567 | insulin-like growth factor ternary complex(GO:0042567) |
| 0.9 | 32.0 | GO:0030673 | axolemma(GO:0030673) |
| 0.8 | 12.8 | GO:0008250 | oligosaccharyltransferase complex(GO:0008250) |
| 0.7 | 15.6 | GO:0005922 | connexon complex(GO:0005922) |
| 0.7 | 4.4 | GO:0002142 | stereocilia ankle link complex(GO:0002142) USH2 complex(GO:1990696) |
| 0.6 | 1.3 | GO:0071664 | catenin-TCF7L2 complex(GO:0071664) |
| 0.6 | 4.6 | GO:0031314 | extrinsic component of mitochondrial inner membrane(GO:0031314) |
| 0.5 | 12.3 | GO:0097440 | apical dendrite(GO:0097440) |
| 0.5 | 28.7 | GO:0005871 | kinesin complex(GO:0005871) |
| 0.5 | 1.4 | GO:1990730 | VCP-NSFL1C complex(GO:1990730) |
| 0.4 | 9.5 | GO:0016327 | apicolateral plasma membrane(GO:0016327) |
| 0.4 | 1.7 | GO:0030121 | AP-1 adaptor complex(GO:0030121) |
| 0.4 | 24.7 | GO:0032580 | Golgi cisterna membrane(GO:0032580) |
| 0.4 | 17.8 | GO:0045171 | intercellular bridge(GO:0045171) |
| 0.4 | 10.2 | GO:0031985 | Golgi cisterna(GO:0031985) |
| 0.3 | 10.9 | GO:0032281 | AMPA glutamate receptor complex(GO:0032281) |
| 0.3 | 9.1 | GO:0045334 | clathrin-coated endocytic vesicle(GO:0045334) |
| 0.3 | 2.9 | GO:0008290 | F-actin capping protein complex(GO:0008290) |
| 0.3 | 2.7 | GO:0097433 | dense body(GO:0097433) |
| 0.3 | 5.0 | GO:0097038 | perinuclear endoplasmic reticulum(GO:0097038) |
| 0.2 | 42.7 | GO:0043204 | perikaryon(GO:0043204) |
| 0.2 | 46.9 | GO:0043209 | myelin sheath(GO:0043209) |
| 0.2 | 3.0 | GO:0045180 | basal cortex(GO:0045180) |
| 0.2 | 36.3 | GO:0014069 | postsynaptic density(GO:0014069) |
| 0.2 | 3.2 | GO:0031528 | microvillus membrane(GO:0031528) |
| 0.2 | 26.4 | GO:0030426 | growth cone(GO:0030426) |
| 0.2 | 13.2 | GO:0008076 | voltage-gated potassium channel complex(GO:0008076) |
| 0.2 | 3.0 | GO:0031588 | nucleotide-activated protein kinase complex(GO:0031588) |
| 0.2 | 5.1 | GO:0005790 | smooth endoplasmic reticulum(GO:0005790) |
| 0.2 | 2.8 | GO:0051233 | spindle midzone(GO:0051233) |
| 0.2 | 155.8 | GO:0005887 | integral component of plasma membrane(GO:0005887) |
| 0.1 | 3.6 | GO:0000159 | protein phosphatase type 2A complex(GO:0000159) |
| 0.1 | 9.8 | GO:0000118 | histone deacetylase complex(GO:0000118) |
| 0.1 | 3.7 | GO:0005581 | collagen trimer(GO:0005581) |
| 0.1 | 2.8 | GO:0005868 | cytoplasmic dynein complex(GO:0005868) |
| 0.1 | 1.1 | GO:0001527 | microfibril(GO:0001527) fibril(GO:0043205) |
| 0.1 | 2.8 | GO:0005905 | clathrin-coated pit(GO:0005905) |
| 0.1 | 23.5 | GO:0005874 | microtubule(GO:0005874) |
| 0.1 | 0.6 | GO:0034991 | nuclear meiotic cohesin complex(GO:0034991) |
| 0.1 | 1.7 | GO:0001673 | male germ cell nucleus(GO:0001673) |
| 0.1 | 8.5 | GO:0036064 | ciliary basal body(GO:0036064) |
| 0.1 | 0.4 | GO:0030877 | beta-catenin destruction complex(GO:0030877) |
| 0.1 | 4.7 | GO:0031463 | Cul3-RING ubiquitin ligase complex(GO:0031463) |
| 0.1 | 1.0 | GO:0034709 | methylosome(GO:0034709) |
| 0.1 | 5.3 | GO:0030018 | Z disc(GO:0030018) |
| 0.0 | 1.4 | GO:0034707 | chloride channel complex(GO:0034707) |
| 0.0 | 19.2 | GO:0031012 | extracellular matrix(GO:0031012) |
| 0.0 | 4.6 | GO:0005770 | late endosome(GO:0005770) |
| 0.0 | 3.0 | GO:0016323 | basolateral plasma membrane(GO:0016323) |
| 0.0 | 5.3 | GO:0005925 | focal adhesion(GO:0005925) |
| 0.0 | 1.3 | GO:0000922 | spindle pole(GO:0000922) |
| 0.0 | 4.0 | GO:0045177 | apical part of cell(GO:0045177) |
| 0.0 | 8.7 | GO:0015630 | microtubule cytoskeleton(GO:0015630) |
| 0.0 | 1.4 | GO:0043235 | receptor complex(GO:0043235) |
| 0.0 | 0.2 | GO:0060170 | ciliary membrane(GO:0060170) |
| 0.0 | 62.5 | GO:0016021 | integral component of membrane(GO:0016021) |
Gene overrepresentation in molecular function category:
| Log-likelihood per target | Total log-likelihood | Term | Description |
|---|---|---|---|
| 6.9 | 27.6 | GO:0005219 | ryanodine-sensitive calcium-release channel activity(GO:0005219) |
| 6.8 | 82.0 | GO:0019911 | structural constituent of myelin sheath(GO:0019911) |
| 6.4 | 32.0 | GO:0005314 | high-affinity glutamate transmembrane transporter activity(GO:0005314) |
| 4.9 | 19.8 | GO:0008427 | calcium-dependent protein kinase inhibitor activity(GO:0008427) |
| 4.9 | 48.6 | GO:0034190 | apolipoprotein receptor binding(GO:0034190) |
| 4.2 | 12.5 | GO:0001565 | phorbol ester receptor activity(GO:0001565) |
| 3.8 | 15.2 | GO:0070699 | type II activin receptor binding(GO:0070699) |
| 3.2 | 9.6 | GO:0072590 | N-acetyl-L-aspartate-L-glutamate ligase activity(GO:0072590) |
| 3.1 | 12.5 | GO:0008489 | UDP-galactose:glucosylceramide beta-1,4-galactosyltransferase activity(GO:0008489) |
| 3.1 | 12.2 | GO:0003835 | beta-galactoside alpha-2,6-sialyltransferase activity(GO:0003835) |
| 2.2 | 17.9 | GO:0005007 | fibroblast growth factor-activated receptor activity(GO:0005007) |
| 2.1 | 8.4 | GO:0042610 | CD8 receptor binding(GO:0042610) |
| 2.0 | 8.0 | GO:0004687 | myosin light chain kinase activity(GO:0004687) |
| 2.0 | 9.8 | GO:0004105 | choline-phosphate cytidylyltransferase activity(GO:0004105) |
| 1.8 | 9.1 | GO:0015220 | choline transmembrane transporter activity(GO:0015220) |
| 1.7 | 8.4 | GO:0051373 | FATZ binding(GO:0051373) |
| 1.3 | 10.7 | GO:0043199 | sulfate binding(GO:0043199) |
| 1.3 | 6.7 | GO:0008502 | melatonin receptor activity(GO:0008502) |
| 1.3 | 15.6 | GO:0005243 | gap junction channel activity(GO:0005243) |
| 1.2 | 17.3 | GO:0047555 | 3',5'-cyclic-GMP phosphodiesterase activity(GO:0047555) |
| 1.2 | 9.5 | GO:0071253 | connexin binding(GO:0071253) |
| 1.2 | 1.2 | GO:0008271 | secondary active sulfate transmembrane transporter activity(GO:0008271) |
| 1.1 | 10.9 | GO:0004385 | guanylate kinase activity(GO:0004385) |
| 1.0 | 4.2 | GO:0035827 | rubidium ion transmembrane transporter activity(GO:0035827) |
| 1.0 | 10.1 | GO:0038036 | sphingosine-1-phosphate receptor activity(GO:0038036) |
| 1.0 | 11.0 | GO:0042577 | lipid phosphatase activity(GO:0042577) |
| 1.0 | 3.0 | GO:0002114 | interleukin-33 receptor activity(GO:0002114) |
| 0.9 | 5.7 | GO:0046848 | hydroxyapatite binding(GO:0046848) |
| 0.9 | 12.8 | GO:0004579 | oligosaccharyl transferase activity(GO:0004576) dolichyl-diphosphooligosaccharide-protein glycotransferase activity(GO:0004579) |
| 0.9 | 5.3 | GO:0004568 | chitinase activity(GO:0004568) |
| 0.8 | 2.5 | GO:0042296 | ISG15 transferase activity(GO:0042296) |
| 0.8 | 14.1 | GO:0005523 | tropomyosin binding(GO:0005523) |
| 0.7 | 5.2 | GO:1990430 | extracellular matrix protein binding(GO:1990430) |
| 0.7 | 6.7 | GO:0019992 | diacylglycerol binding(GO:0019992) |
| 0.7 | 26.1 | GO:0015301 | anion:anion antiporter activity(GO:0015301) |
| 0.7 | 5.5 | GO:0005095 | GTPase inhibitor activity(GO:0005095) |
| 0.7 | 2.7 | GO:0034584 | piRNA binding(GO:0034584) |
| 0.7 | 15.0 | GO:0005388 | calcium-transporting ATPase activity(GO:0005388) |
| 0.7 | 44.0 | GO:0005080 | protein kinase C binding(GO:0005080) |
| 0.6 | 5.2 | GO:0030368 | interleukin-17 receptor activity(GO:0030368) |
| 0.6 | 3.9 | GO:0005499 | vitamin D binding(GO:0005499) |
| 0.6 | 5.7 | GO:0031995 | insulin-like growth factor II binding(GO:0031995) |
| 0.6 | 7.2 | GO:0022889 | L-serine transmembrane transporter activity(GO:0015194) serine transmembrane transporter activity(GO:0022889) |
| 0.6 | 2.3 | GO:0032896 | stearoyl-CoA 9-desaturase activity(GO:0004768) palmitoyl-CoA 9-desaturase activity(GO:0032896) |
| 0.5 | 2.7 | GO:0031802 | type 5 metabotropic glutamate receptor binding(GO:0031802) |
| 0.5 | 13.1 | GO:0005540 | hyaluronic acid binding(GO:0005540) |
| 0.4 | 11.5 | GO:0071949 | FAD binding(GO:0071949) |
| 0.4 | 2.9 | GO:0042608 | T cell receptor binding(GO:0042608) |
| 0.4 | 2.8 | GO:0045503 | dynein light chain binding(GO:0045503) |
| 0.4 | 6.2 | GO:0017017 | MAP kinase tyrosine/serine/threonine phosphatase activity(GO:0017017) |
| 0.4 | 3.1 | GO:0004716 | receptor signaling protein tyrosine kinase activity(GO:0004716) |
| 0.4 | 8.3 | GO:0002162 | dystroglycan binding(GO:0002162) |
| 0.3 | 28.7 | GO:0003777 | microtubule motor activity(GO:0003777) |
| 0.3 | 5.3 | GO:0017049 | GTP-Rho binding(GO:0017049) |
| 0.3 | 4.6 | GO:0010314 | phosphatidylinositol-5-phosphate binding(GO:0010314) |
| 0.3 | 2.5 | GO:0019871 | sodium channel inhibitor activity(GO:0019871) |
| 0.3 | 12.3 | GO:0015485 | cholesterol binding(GO:0015485) |
| 0.3 | 1.5 | GO:0047493 | sphingomyelin synthase activity(GO:0033188) ceramide cholinephosphotransferase activity(GO:0047493) |
| 0.3 | 3.5 | GO:0030215 | semaphorin receptor binding(GO:0030215) |
| 0.2 | 3.7 | GO:0005092 | GDP-dissociation inhibitor activity(GO:0005092) |
| 0.2 | 1.6 | GO:0043426 | MRF binding(GO:0043426) |
| 0.2 | 3.9 | GO:0031210 | phosphatidylcholine binding(GO:0031210) |
| 0.2 | 1.8 | GO:0031419 | cobalamin binding(GO:0031419) |
| 0.2 | 1.3 | GO:0003847 | 1-alkyl-2-acetylglycerophosphocholine esterase activity(GO:0003847) |
| 0.2 | 0.7 | GO:0034437 | sterol-transporting ATPase activity(GO:0034041) glycoprotein transporter activity(GO:0034437) |
| 0.2 | 1.3 | GO:0017034 | Rap guanyl-nucleotide exchange factor activity(GO:0017034) |
| 0.2 | 10.2 | GO:0008375 | acetylglucosaminyltransferase activity(GO:0008375) |
| 0.2 | 3.2 | GO:0030296 | protein tyrosine kinase activator activity(GO:0030296) |
| 0.2 | 3.0 | GO:0004679 | AMP-activated protein kinase activity(GO:0004679) |
| 0.2 | 28.9 | GO:0044325 | ion channel binding(GO:0044325) |
| 0.2 | 5.4 | GO:0043015 | gamma-tubulin binding(GO:0043015) |
| 0.2 | 9.2 | GO:0042805 | actinin binding(GO:0042805) |
| 0.2 | 18.7 | GO:0005178 | integrin binding(GO:0005178) |
| 0.2 | 6.7 | GO:0071855 | neuropeptide receptor binding(GO:0071855) |
| 0.2 | 2.8 | GO:0015269 | calcium-activated potassium channel activity(GO:0015269) |
| 0.2 | 40.9 | GO:0015631 | tubulin binding(GO:0015631) |
| 0.2 | 9.2 | GO:0019905 | syntaxin binding(GO:0019905) |
| 0.2 | 13.8 | GO:0005200 | structural constituent of cytoskeleton(GO:0005200) |
| 0.2 | 2.2 | GO:0005522 | profilin binding(GO:0005522) |
| 0.1 | 95.5 | GO:0005509 | calcium ion binding(GO:0005509) |
| 0.1 | 2.1 | GO:0008409 | 5'-3' exonuclease activity(GO:0008409) |
| 0.1 | 10.8 | GO:0046332 | SMAD binding(GO:0046332) |
| 0.1 | 3.5 | GO:0008198 | ferrous iron binding(GO:0008198) |
| 0.1 | 10.4 | GO:0005249 | voltage-gated potassium channel activity(GO:0005249) |
| 0.1 | 1.1 | GO:0005132 | type I interferon receptor binding(GO:0005132) |
| 0.1 | 0.2 | GO:0070698 | nodal binding(GO:0038100) type I activin receptor binding(GO:0070698) |
| 0.1 | 9.7 | GO:0051015 | actin filament binding(GO:0051015) |
| 0.1 | 4.4 | GO:0017022 | myosin binding(GO:0017022) |
| 0.1 | 0.6 | GO:0015129 | lactate transmembrane transporter activity(GO:0015129) |
| 0.1 | 1.7 | GO:0030276 | clathrin binding(GO:0030276) |
| 0.1 | 0.3 | GO:0017040 | ceramidase activity(GO:0017040) |
| 0.0 | 1.7 | GO:0019213 | deacetylase activity(GO:0019213) |
| 0.0 | 1.0 | GO:0008327 | methyl-CpG binding(GO:0008327) |
| 0.0 | 5.5 | GO:0017137 | Rab GTPase binding(GO:0017137) |
| 0.0 | 0.2 | GO:1903924 | estradiol binding(GO:1903924) |
| 0.0 | 4.0 | GO:0030165 | PDZ domain binding(GO:0030165) |
| 0.0 | 2.6 | GO:0019888 | protein phosphatase regulator activity(GO:0019888) |
| 0.0 | 0.1 | GO:0017042 | glycosylceramidase activity(GO:0017042) |
| 0.0 | 3.6 | GO:0004725 | protein tyrosine phosphatase activity(GO:0004725) |
| 0.0 | 7.4 | GO:0000287 | magnesium ion binding(GO:0000287) |
| 0.0 | 0.7 | GO:0005086 | ARF guanyl-nucleotide exchange factor activity(GO:0005086) |
| 0.0 | 0.8 | GO:0004693 | cyclin-dependent protein serine/threonine kinase activity(GO:0004693) |
| 0.0 | 1.5 | GO:0003707 | steroid hormone receptor activity(GO:0003707) |
| 0.0 | 0.5 | GO:0042974 | retinoic acid receptor binding(GO:0042974) |
| 0.0 | 1.4 | GO:0051117 | ATPase binding(GO:0051117) |
| 0.0 | 0.4 | GO:0070742 | C2H2 zinc finger domain binding(GO:0070742) |
| 0.0 | 3.3 | GO:0005125 | cytokine activity(GO:0005125) |
| 0.0 | 0.2 | GO:0016888 | endodeoxyribonuclease activity, producing 5'-phosphomonoesters(GO:0016888) |
| 0.0 | 1.4 | GO:0003725 | double-stranded RNA binding(GO:0003725) |
| 0.0 | 1.4 | GO:0005254 | chloride channel activity(GO:0005254) |
| 0.0 | 1.3 | GO:0042826 | histone deacetylase binding(GO:0042826) |
| 0.0 | 2.6 | GO:0004518 | nuclease activity(GO:0004518) |
| 0.0 | 1.4 | GO:0004222 | metalloendopeptidase activity(GO:0004222) |
| 0.0 | 0.3 | GO:0008139 | nuclear localization sequence binding(GO:0008139) |
| 0.0 | 2.0 | GO:0005096 | GTPase activator activity(GO:0005096) |
Gene overrepresentation in curated gene sets: canonical pathways category:
| Log-likelihood per target | Total log-likelihood | Term | Description |
|---|---|---|---|
| 1.2 | 15.0 | PID P38 GAMMA DELTA PATHWAY | Signaling mediated by p38-gamma and p38-delta |
| 1.1 | 12.8 | PID FGF PATHWAY | FGF signaling pathway |
| 0.8 | 17.0 | PID INTEGRIN5 PATHWAY | Beta5 beta6 beta7 and beta8 integrin cell surface interactions |
| 0.7 | 10.1 | PID S1P S1P4 PATHWAY | S1P4 pathway |
| 0.5 | 19.0 | PID GLYPICAN 1PATHWAY | Glypican 1 network |
| 0.3 | 11.3 | ST WNT BETA CATENIN PATHWAY | Wnt/beta-catenin Pathway |
| 0.3 | 17.3 | PID AR TF PATHWAY | Regulation of Androgen receptor activity |
| 0.3 | 55.6 | NABA ECM GLYCOPROTEINS | Genes encoding structural ECM glycoproteins |
| 0.2 | 4.3 | ST G ALPHA S PATHWAY | G alpha s Pathway |
| 0.2 | 12.5 | PID RAC1 REG PATHWAY | Regulation of RAC1 activity |
| 0.2 | 4.0 | PID EPHRINB REV PATHWAY | Ephrin B reverse signaling |
| 0.2 | 6.0 | PID LIS1 PATHWAY | Lissencephaly gene (LIS1) in neuronal migration and development |
| 0.2 | 8.3 | NABA PROTEOGLYCANS | Genes encoding proteoglycans |
| 0.2 | 3.6 | ST DIFFERENTIATION PATHWAY IN PC12 CELLS | Differentiation Pathway in PC12 Cells; this is a specific case of PAC1 Receptor Pathway. |
| 0.1 | 6.3 | SIG REGULATION OF THE ACTIN CYTOSKELETON BY RHO GTPASES | Genes related to regulation of the actin cytoskeleton |
| 0.1 | 3.8 | PID NEPHRIN NEPH1 PATHWAY | Nephrin/Neph1 signaling in the kidney podocyte |
| 0.1 | 10.2 | PID CMYB PATHWAY | C-MYB transcription factor network |
| 0.1 | 3.1 | PID ANGIOPOIETIN RECEPTOR PATHWAY | Angiopoietin receptor Tie2-mediated signaling |
| 0.1 | 13.0 | NABA ECM AFFILIATED | Genes encoding proteins affiliated structurally or functionally to extracellular matrix proteins |
| 0.1 | 1.7 | ST ERK1 ERK2 MAPK PATHWAY | ERK1/ERK2 MAPK Pathway |
| 0.1 | 1.4 | PID INTEGRIN A4B1 PATHWAY | Alpha4 beta1 integrin signaling events |
| 0.1 | 3.0 | PID VEGFR1 2 PATHWAY | Signaling events mediated by VEGFR1 and VEGFR2 |
| 0.1 | 3.5 | PID TRKR PATHWAY | Neurotrophic factor-mediated Trk receptor signaling |
| 0.1 | 3.0 | PID P75 NTR PATHWAY | p75(NTR)-mediated signaling |
| 0.0 | 13.2 | NABA SECRETED FACTORS | Genes encoding secreted soluble factors |
| 0.0 | 2.1 | PID MYC REPRESS PATHWAY | Validated targets of C-MYC transcriptional repression |
| 0.0 | 0.5 | PID WNT NONCANONICAL PATHWAY | Noncanonical Wnt signaling pathway |
| 0.0 | 0.7 | PID ER NONGENOMIC PATHWAY | Plasma membrane estrogen receptor signaling |
Gene overrepresentation in curated gene sets: REACTOME pathways category:
| Log-likelihood per target | Total log-likelihood | Term | Description |
|---|---|---|---|
| 3.0 | 8.9 | REACTOME SIGNALING BY FGFR3 MUTANTS | Genes involved in Signaling by FGFR3 mutants |
| 1.5 | 24.7 | REACTOME ACETYLCHOLINE NEUROTRANSMITTER RELEASE CYCLE | Genes involved in Acetylcholine Neurotransmitter Release Cycle |
| 1.3 | 19.6 | REACTOME PLATELET ADHESION TO EXPOSED COLLAGEN | Genes involved in Platelet Adhesion to exposed collagen |
| 0.9 | 15.6 | REACTOME GAP JUNCTION ASSEMBLY | Genes involved in Gap junction assembly |
| 0.8 | 20.1 | REACTOME CGMP EFFECTS | Genes involved in cGMP effects |
| 0.8 | 10.3 | REACTOME SIGNALING BY ACTIVATED POINT MUTANTS OF FGFR1 | Genes involved in Signaling by activated point mutants of FGFR1 |
| 0.7 | 12.5 | REACTOME N GLYCAN ANTENNAE ELONGATION | Genes involved in N-Glycan antennae elongation |
| 0.7 | 10.9 | REACTOME IONOTROPIC ACTIVITY OF KAINATE RECEPTORS | Genes involved in Ionotropic activity of Kainate Receptors |
| 0.6 | 15.2 | REACTOME NEPHRIN INTERACTIONS | Genes involved in Nephrin interactions |
| 0.6 | 6.7 | REACTOME GLUTAMATE NEUROTRANSMITTER RELEASE CYCLE | Genes involved in Glutamate Neurotransmitter Release Cycle |
| 0.5 | 8.9 | REACTOME POST CHAPERONIN TUBULIN FOLDING PATHWAY | Genes involved in Post-chaperonin tubulin folding pathway |
| 0.5 | 24.9 | REACTOME AMINO ACID AND OLIGOPEPTIDE SLC TRANSPORTERS | Genes involved in Amino acid and oligopeptide SLC transporters |
| 0.5 | 0.9 | REACTOME SIGNALLING TO P38 VIA RIT AND RIN | Genes involved in Signalling to p38 via RIT and RIN |
| 0.4 | 3.5 | REACTOME NEGATIVE REGULATION OF THE PI3K AKT NETWORK | Genes involved in Negative regulation of the PI3K/AKT network |
| 0.4 | 9.8 | REACTOME SYNTHESIS OF PC | Genes involved in Synthesis of PC |
| 0.4 | 3.9 | REACTOME REGULATION OF INSULIN SECRETION BY ACETYLCHOLINE | Genes involved in Regulation of Insulin Secretion by Acetylcholine |
| 0.4 | 5.1 | REACTOME APOPTOTIC CLEAVAGE OF CELL ADHESION PROTEINS | Genes involved in Apoptotic cleavage of cell adhesion proteins |
| 0.3 | 3.0 | REACTOME REGULATION OF RHEB GTPASE ACTIVITY BY AMPK | Genes involved in Regulation of Rheb GTPase activity by AMPK |
| 0.3 | 5.7 | REACTOME REGULATION OF INSULIN LIKE GROWTH FACTOR IGF ACTIVITY BY INSULIN LIKE GROWTH FACTOR BINDING PROTEINS IGFBPS | Genes involved in Regulation of Insulin-like Growth Factor (IGF) Activity by Insulin-like Growth Factor Binding Proteins (IGFBPs) |
| 0.3 | 3.1 | REACTOME TIE2 SIGNALING | Genes involved in Tie2 Signaling |
| 0.2 | 5.0 | REACTOME ARMS MEDIATED ACTIVATION | Genes involved in ARMS-mediated activation |
| 0.2 | 10.2 | REACTOME O LINKED GLYCOSYLATION OF MUCINS | Genes involved in O-linked glycosylation of mucins |
| 0.2 | 3.5 | REACTOME OTHER SEMAPHORIN INTERACTIONS | Genes involved in Other semaphorin interactions |
| 0.2 | 10.4 | REACTOME VOLTAGE GATED POTASSIUM CHANNELS | Genes involved in Voltage gated Potassium channels |
| 0.2 | 3.6 | REACTOME METABOLISM OF POLYAMINES | Genes involved in Metabolism of polyamines |
| 0.2 | 12.8 | REACTOME ASPARAGINE N LINKED GLYCOSYLATION | Genes involved in Asparagine N-linked glycosylation |
| 0.1 | 2.6 | REACTOME DCC MEDIATED ATTRACTIVE SIGNALING | Genes involved in DCC mediated attractive signaling |
| 0.1 | 12.0 | REACTOME SIGNALING BY RHO GTPASES | Genes involved in Signaling by Rho GTPases |
| 0.1 | 1.8 | REACTOME BILE SALT AND ORGANIC ANION SLC TRANSPORTERS | Genes involved in Bile salt and organic anion SLC transporters |
| 0.1 | 5.7 | REACTOME CELL SURFACE INTERACTIONS AT THE VASCULAR WALL | Genes involved in Cell surface interactions at the vascular wall |
| 0.1 | 9.7 | REACTOME L1CAM INTERACTIONS | Genes involved in L1CAM interactions |
| 0.1 | 2.9 | REACTOME CASPASE MEDIATED CLEAVAGE OF CYTOSKELETAL PROTEINS | Genes involved in Caspase-mediated cleavage of cytoskeletal proteins |
| 0.1 | 4.7 | REACTOME NCAM1 INTERACTIONS | Genes involved in NCAM1 interactions |
| 0.1 | 1.5 | REACTOME KERATAN SULFATE BIOSYNTHESIS | Genes involved in Keratan sulfate biosynthesis |
| 0.1 | 6.8 | REACTOME NUCLEAR RECEPTOR TRANSCRIPTION PATHWAY | Genes involved in Nuclear Receptor transcription pathway |
| 0.1 | 0.9 | REACTOME ACTIVATION OF CHAPERONE GENES BY ATF6 ALPHA | Genes involved in Activation of Chaperone Genes by ATF6-alpha |
| 0.1 | 3.7 | REACTOME TRANSPORT OF INORGANIC CATIONS ANIONS AND AMINO ACIDS OLIGOPEPTIDES | Genes involved in Transport of inorganic cations/anions and amino acids/oligopeptides |
| 0.1 | 5.2 | REACTOME RESPONSE TO ELEVATED PLATELET CYTOSOLIC CA2 | Genes involved in Response to elevated platelet cytosolic Ca2+ |
| 0.1 | 2.2 | REACTOME SIGNALING BY ROBO RECEPTOR | Genes involved in Signaling by Robo receptor |
| 0.1 | 0.7 | REACTOME CTNNB1 PHOSPHORYLATION CASCADE | Genes involved in Beta-catenin phosphorylation cascade |
| 0.1 | 10.1 | REACTOME G ALPHA I SIGNALLING EVENTS | Genes involved in G alpha (i) signalling events |
| 0.1 | 1.6 | REACTOME BMAL1 CLOCK NPAS2 ACTIVATES CIRCADIAN EXPRESSION | Genes involved in BMAL1:CLOCK/NPAS2 Activates Circadian Expression |
| 0.1 | 1.6 | REACTOME ASSOCIATION OF TRIC CCT WITH TARGET PROTEINS DURING BIOSYNTHESIS | Genes involved in Association of TriC/CCT with target proteins during biosynthesis |
| 0.1 | 3.8 | REACTOME SIGNALING BY FGFR | Genes involved in Signaling by FGFR |
| 0.0 | 0.7 | REACTOME HDL MEDIATED LIPID TRANSPORT | Genes involved in HDL-mediated lipid transport |
| 0.0 | 0.4 | REACTOME TRANSCRIPTIONAL REGULATION OF WHITE ADIPOCYTE DIFFERENTIATION | Genes involved in Transcriptional Regulation of White Adipocyte Differentiation |
| 0.0 | 1.5 | REACTOME P75 NTR RECEPTOR MEDIATED SIGNALLING | Genes involved in p75 NTR receptor-mediated signalling |
| 0.0 | 0.5 | REACTOME TIGHT JUNCTION INTERACTIONS | Genes involved in Tight junction interactions |
| 0.0 | 0.4 | REACTOME RNA POL III TRANSCRIPTION INITIATION FROM TYPE 3 PROMOTER | Genes involved in RNA Polymerase III Transcription Initiation From Type 3 Promoter |
| 0.0 | 0.2 | REACTOME SIGNALING BY NODAL | Genes involved in Signaling by NODAL |
| 0.0 | 0.3 | REACTOME SPHINGOLIPID DE NOVO BIOSYNTHESIS | Genes involved in Sphingolipid de novo biosynthesis |