Project
GSE53960: rat RNA-Seq transcriptomic Bodymap
Navigation
Downloads
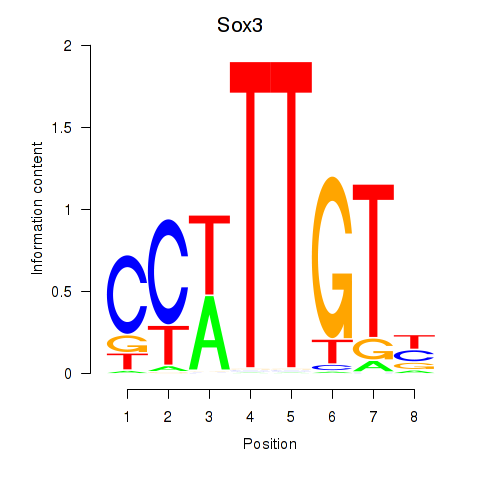
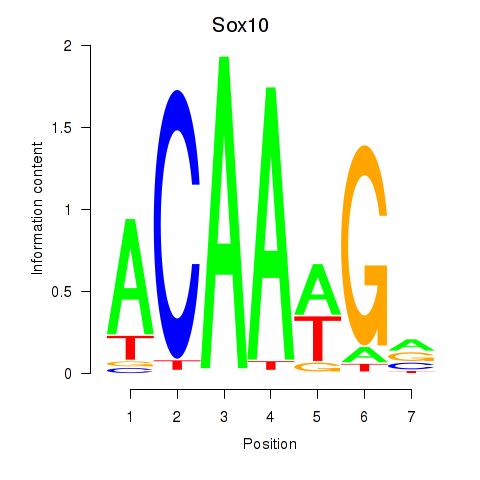
Results for Sox3_Sox10
Z-value: 1.18
Motif logo
Transcription factors associated with Sox3_Sox10
| Gene Symbol | Gene ID | Gene Info |
|---|---|---|
|
Sox10
|
ENSRNOG00000011305 | SRY box 10 |
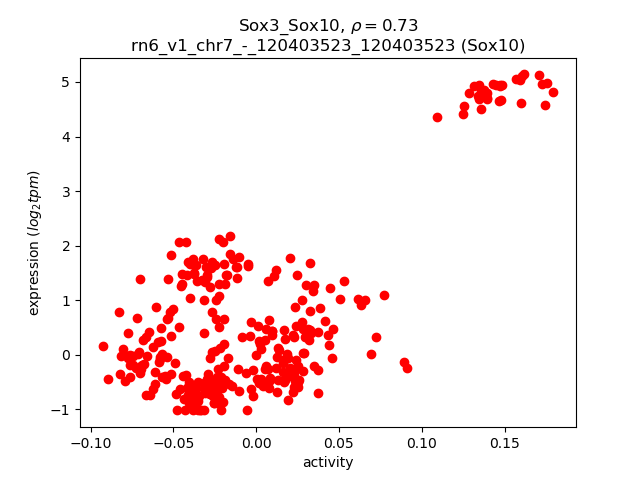
Activity-expression correlation:
| Gene | Promoter | Pearson corr. coef. | P-value | Plot |
|---|---|---|---|---|
| Sox10 | rn6_v1_chr7_-_120403523_120403523 | 0.73 | 1.4e-54 | Click! |
Activity profile of Sox3_Sox10 motif
Sorted Z-values of Sox3_Sox10 motif
| Promoter | Log-likelihood | Transcript | Gene | Gene Info |
|---|---|---|---|---|
| chr18_+_79406381 | 111.88 |
ENSRNOT00000022303
ENSRNOT00000058295 ENSRNOT00000058296 ENSRNOT00000022280 |
Mbp
|
myelin basic protein |
| chr8_+_128824508 | 94.44 |
ENSRNOT00000025343
|
Mobp
|
myelin-associated oligodendrocyte basic protein |
| chr3_+_35014538 | 73.81 |
ENSRNOT00000006341
|
Kif5c
|
kinesin family member 5C |
| chr5_+_49311030 | 71.41 |
ENSRNOT00000010850
|
Cnr1
|
cannabinoid receptor 1 |
| chr9_+_73334618 | 63.70 |
ENSRNOT00000092717
|
Map2
|
microtubule-associated protein 2 |
| chr3_-_44086006 | 56.06 |
ENSRNOT00000034449
ENSRNOT00000082604 |
Ermn
|
ermin |
| chr7_-_136853957 | 54.96 |
ENSRNOT00000008985
|
Nell2
|
neural EGFL like 2 |
| chr16_-_39476025 | 54.95 |
ENSRNOT00000014312
|
Gpm6a
|
glycoprotein m6a |
| chr5_+_64326733 | 54.91 |
ENSRNOT00000065775
|
Tmeff1
|
transmembrane protein with EGF-like and two follistatin-like domains 1 |
| chr7_-_136853154 | 53.79 |
ENSRNOT00000087376
|
Nell2
|
neural EGFL like 2 |
| chrX_-_115175299 | 49.37 |
ENSRNOT00000074322
|
Dcx
|
doublecortin |
| chr18_+_30562178 | 46.36 |
ENSRNOT00000040998
|
LOC108348771
|
protocadherin beta-16-like |
| chr19_+_56220755 | 44.48 |
ENSRNOT00000023452
|
Tubb3
|
tubulin, beta 3 class III |
| chr1_+_72860218 | 42.99 |
ENSRNOT00000024547
|
Syt5
|
synaptotagmin 5 |
| chr9_-_100253609 | 42.04 |
ENSRNOT00000036061
|
Kif1a
|
kinesin family member 1A |
| chr14_-_78308933 | 37.44 |
ENSRNOT00000065334
|
Crmp1
|
collapsin response mediator protein 1 |
| chr18_-_26211445 | 35.66 |
ENSRNOT00000027739
|
Nrep
|
neuronal regeneration related protein |
| chrX_+_144445795 | 35.55 |
ENSRNOT00000048467
|
RGD1561327
|
similar to melanoma antigen family A, 10 |
| chr3_-_51643140 | 32.89 |
ENSRNOT00000006646
|
Scn3a
|
sodium voltage-gated channel alpha subunit 3 |
| chr15_+_40665041 | 32.75 |
ENSRNOT00000018300
|
Amer2
|
APC membrane recruitment protein 2 |
| chr4_+_110700403 | 32.60 |
ENSRNOT00000092379
|
Lrrtm4
|
leucine rich repeat transmembrane neuronal 4 |
| chr7_-_12275609 | 32.28 |
ENSRNOT00000086061
|
Apc2
|
APC2, WNT signaling pathway regulator |
| chr1_+_99762253 | 31.91 |
ENSRNOT00000065876
|
Klk6
|
kallikrein related-peptidase 6 |
| chr15_-_43542939 | 30.48 |
ENSRNOT00000012996
|
Dpysl2
|
dihydropyrimidinase-like 2 |
| chr10_+_3411380 | 29.78 |
ENSRNOT00000004346
|
RGD1305733
|
similar to RIKEN cDNA 2900011O08 |
| chr20_-_54517709 | 27.99 |
ENSRNOT00000076234
|
Grik2
|
glutamate ionotropic receptor kainate type subunit 2 |
| chr9_+_73433252 | 27.77 |
ENSRNOT00000092540
|
Map2
|
microtubule-associated protein 2 |
| chr3_-_2689084 | 26.83 |
ENSRNOT00000020926
|
Ptgds
|
prostaglandin D2 synthase |
| chr15_-_62200837 | 26.59 |
ENSRNOT00000017599
|
Pcdh8
|
protocadherin 8 |
| chr15_+_33600102 | 26.37 |
ENSRNOT00000022664
|
Cmtm5
|
CKLF-like MARVEL transmembrane domain containing 5 |
| chr6_-_147172022 | 26.30 |
ENSRNOT00000080675
|
Itgb8
|
integrin subunit beta 8 |
| chr1_+_264741911 | 26.20 |
ENSRNOT00000019956
|
Sema4g
|
semaphorin 4G |
| chr20_+_40769586 | 25.56 |
ENSRNOT00000001079
|
Fabp7
|
fatty acid binding protein 7 |
| chr3_-_114307250 | 25.45 |
ENSRNOT00000064592
|
Shf
|
Src homology 2 domain containing F |
| chr13_-_107831014 | 24.49 |
ENSRNOT00000003684
|
Kcnk2
|
potassium two pore domain channel subfamily K member 2 |
| chr1_-_103256823 | 23.82 |
ENSRNOT00000018860
|
Ptpn5
|
protein tyrosine phosphatase, non-receptor type 5 |
| chr3_-_176816114 | 22.69 |
ENSRNOT00000079262
ENSRNOT00000018697 |
Stmn3
|
stathmin 3 |
| chr3_-_168018410 | 22.51 |
ENSRNOT00000087579
|
Bcas1
|
breast carcinoma amplified sequence 1 |
| chr6_-_94980004 | 22.36 |
ENSRNOT00000006373
|
Rtn1
|
reticulon 1 |
| chr18_+_29993361 | 21.60 |
ENSRNOT00000075810
|
Pcdha4
|
protocadherin alpha 4 |
| chr1_+_81372650 | 20.91 |
ENSRNOT00000088829
|
Zfp428
|
zinc finger protein 428 |
| chr9_+_9961021 | 20.68 |
ENSRNOT00000075767
|
Tubb4a
|
tubulin, beta 4A class IVa |
| chrX_-_134866210 | 20.39 |
ENSRNOT00000005331
|
Apln
|
apelin |
| chr2_-_187401786 | 20.38 |
ENSRNOT00000025624
|
Hapln2
|
hyaluronan and proteoglycan link protein 2 |
| chr19_-_26053762 | 19.70 |
ENSRNOT00000004646
|
MAST1
|
microtubule associated serine/threonine kinase 1 |
| chrX_+_62754634 | 19.10 |
ENSRNOT00000016669
|
Pcyt1b
|
phosphate cytidylyltransferase 1, choline, beta |
| chr4_+_136512201 | 19.02 |
ENSRNOT00000051645
|
Cntn6
|
contactin 6 |
| chr5_-_167244786 | 18.72 |
ENSRNOT00000051309
|
Car6
|
carbonic anhydrase 6 |
| chr9_-_61810417 | 18.65 |
ENSRNOT00000020910
|
Rftn2
|
raftlin family member 2 |
| chr2_+_74360622 | 18.25 |
ENSRNOT00000014013
|
Cdh18
|
cadherin 18 |
| chr8_+_60709851 | 18.22 |
ENSRNOT00000021817
|
Rcn2
|
reticulocalbin 2 |
| chr3_+_160935709 | 18.08 |
ENSRNOT00000019688
|
Dbndd2
|
dysbindin domain containing 2 |
| chr18_+_15467870 | 17.93 |
ENSRNOT00000091696
|
B4galt6
|
beta-1,4-galactosyltransferase 6 |
| chr14_-_82048251 | 17.91 |
ENSRNOT00000074734
|
Nat8l
|
N-acetyltransferase 8-like |
| chr13_-_91872954 | 17.80 |
ENSRNOT00000004613
ENSRNOT00000079263 |
Cadm3
|
cell adhesion molecule 3 |
| chr18_-_69944632 | 17.63 |
ENSRNOT00000047271
|
Mapk4
|
mitogen-activated protein kinase 4 |
| chr12_+_40018937 | 17.61 |
ENSRNOT00000001697
|
Cux2
|
cut-like homeobox 2 |
| chr5_-_109651730 | 17.51 |
ENSRNOT00000093032
|
Elavl2
|
ELAV like RNA binding protein 2 |
| chr8_+_44136496 | 17.44 |
ENSRNOT00000087022
|
Scn3b
|
sodium voltage-gated channel beta subunit 3 |
| chr6_-_147172813 | 17.42 |
ENSRNOT00000066545
|
Itgb8
|
integrin subunit beta 8 |
| chr11_+_86512797 | 17.06 |
ENSRNOT00000051680
|
Gp1bb
|
glycoprotein Ib platelet beta subunit |
| chr8_-_62987182 | 16.84 |
ENSRNOT00000070885
|
Islr2
|
immunoglobulin superfamily containing leucine-rich repeat 2 |
| chr13_-_82758004 | 16.63 |
ENSRNOT00000003932
|
Atp1b1
|
ATPase Na+/K+ transporting subunit beta 1 |
| chrX_+_62727755 | 16.55 |
ENSRNOT00000077055
|
Pcyt1b
|
phosphate cytidylyltransferase 1, choline, beta |
| chr5_+_152680407 | 16.52 |
ENSRNOT00000076864
|
Stmn1
|
stathmin 1 |
| chr18_+_30010918 | 16.51 |
ENSRNOT00000084132
|
Pcdha4
|
protocadherin alpha 4 |
| chr2_-_41785792 | 16.48 |
ENSRNOT00000015871
|
Rab3c
|
RAB3C, member RAS oncogene family |
| chrX_+_39711201 | 16.39 |
ENSRNOT00000080512
ENSRNOT00000009802 |
Cnksr2
|
connector enhancer of kinase suppressor of Ras 2 |
| chr12_-_35979193 | 16.39 |
ENSRNOT00000071104
|
Tmem132b
|
transmembrane protein 132B |
| chr5_-_48165317 | 16.29 |
ENSRNOT00000088179
|
Ankrd6
|
ankyrin repeat domain 6 |
| chr4_+_113968995 | 16.25 |
ENSRNOT00000079511
|
Rtkn
|
rhotekin |
| chrX_-_29648359 | 16.20 |
ENSRNOT00000086721
ENSRNOT00000006777 |
Gpm6b
|
glycoprotein m6b |
| chr3_+_131351587 | 16.07 |
ENSRNOT00000010835
|
Btbd3
|
BTB domain containing 3 |
| chr3_+_152571121 | 15.87 |
ENSRNOT00000087289
ENSRNOT00000080543 ENSRNOT00000083476 |
Epb41l1
|
erythrocyte membrane protein band 4.1-like 1 |
| chr12_-_13668515 | 15.79 |
ENSRNOT00000086847
|
Fscn1
|
fascin actin-bundling protein 1 |
| chr12_-_29743705 | 15.72 |
ENSRNOT00000001185
|
Caln1
|
calneuron 1 |
| chr18_+_30381322 | 15.53 |
ENSRNOT00000027216
|
Pcdhb3
|
protocadherin beta 3 |
| chr7_-_83670356 | 15.53 |
ENSRNOT00000005584
|
Sybu
|
syntabulin |
| chrX_-_134719097 | 15.53 |
ENSRNOT00000068478
|
Smarca1
|
SWI/SNF related, matrix associated, actin dependent regulator of chromatin, subfamily a, member 1 |
| chr3_+_155160481 | 15.51 |
ENSRNOT00000021133
|
Ppp1r16b
|
protein phosphatase 1, regulatory subunit 16B |
| chr2_-_29768750 | 15.27 |
ENSRNOT00000023460
|
Map1b
|
microtubule-associated protein 1B |
| chr16_+_22250470 | 15.19 |
ENSRNOT00000015799
|
Lzts1
|
leucine zipper tumor suppressor 1 |
| chr20_+_3558827 | 15.06 |
ENSRNOT00000088130
|
Ddr1
|
discoidin domain receptor tyrosine kinase 1 |
| chr4_+_22445414 | 15.02 |
ENSRNOT00000087657
ENSRNOT00000030224 |
Rundc3b
|
RUN domain containing 3B |
| chr5_-_86696388 | 14.99 |
ENSRNOT00000007812
|
Megf9
|
multiple EGF-like-domains 9 |
| chr1_-_170404056 | 14.87 |
ENSRNOT00000024402
|
Apbb1
|
amyloid beta precursor protein binding family B member 1 |
| chr12_+_28381982 | 14.67 |
ENSRNOT00000076101
|
Wbscr17
|
Williams-Beuren syndrome chromosome region 17 |
| chr7_+_64672722 | 14.57 |
ENSRNOT00000064448
ENSRNOT00000005539 |
Grip1
|
glutamate receptor interacting protein 1 |
| chr3_-_64543100 | 14.43 |
ENSRNOT00000025803
|
Zfp385b
|
zinc finger protein 385B |
| chr3_+_159823878 | 14.16 |
ENSRNOT00000011748
|
Gdap1l1
|
ganglioside-induced differentiation-associated protein 1-like 1 |
| chr17_+_31441630 | 14.04 |
ENSRNOT00000083705
ENSRNOT00000023582 |
Tubb2b
|
tubulin, beta 2B class IIb |
| chr2_-_226779266 | 13.97 |
ENSRNOT00000019244
|
Fnbp1l
|
formin binding protein 1-like |
| chr16_+_22361998 | 13.93 |
ENSRNOT00000016193
|
Slc18a1
|
solute carrier family 18 member A1 |
| chr9_-_28973246 | 13.93 |
ENSRNOT00000091865
ENSRNOT00000015453 |
Rims1
|
regulating synaptic membrane exocytosis 1 |
| chr10_+_45289741 | 13.85 |
ENSRNOT00000066190
|
Hist3h2ba
|
histone cluster 3, H2ba |
| chr4_+_110699557 | 13.82 |
ENSRNOT00000030588
ENSRNOT00000092261 |
Lrrtm4
|
leucine rich repeat transmembrane neuronal 4 |
| chr17_+_13670520 | 13.67 |
ENSRNOT00000019442
|
Shc3
|
SHC adaptor protein 3 |
| chr11_+_74834050 | 13.48 |
ENSRNOT00000002333
|
Atp13a4
|
ATPase 13A4 |
| chr7_-_140640953 | 13.45 |
ENSRNOT00000083156
|
Tuba1a
|
tubulin, alpha 1A |
| chr15_+_33600337 | 13.39 |
ENSRNOT00000075965
|
Cmtm5
|
CKLF-like MARVEL transmembrane domain containing 5 |
| chr20_+_10123651 | 13.31 |
ENSRNOT00000001559
|
Pde9a
|
phosphodiesterase 9A |
| chr6_-_51019407 | 13.28 |
ENSRNOT00000011659
|
Gpr22
|
G protein-coupled receptor 22 |
| chr5_-_147412705 | 13.08 |
ENSRNOT00000010688
|
RGD1561149
|
similar to mKIAA1522 protein |
| chr10_-_51576376 | 13.06 |
ENSRNOT00000004829
|
Arhgap44
|
Rho GTPase activating protein 44 |
| chr9_-_28972835 | 12.88 |
ENSRNOT00000086967
ENSRNOT00000079684 |
Rims1
|
regulating synaptic membrane exocytosis 1 |
| chr19_+_38601786 | 12.81 |
ENSRNOT00000087655
|
Zfp90
|
zinc finger protein 90 |
| chr3_+_95715193 | 12.78 |
ENSRNOT00000089525
|
Pax6
|
paired box 6 |
| chr6_+_105364668 | 12.63 |
ENSRNOT00000009513
ENSRNOT00000087090 |
Ttc9
|
tetratricopeptide repeat domain 9 |
| chr20_+_20105047 | 12.62 |
ENSRNOT00000082181
|
Ank3
|
ankyrin 3 |
| chr12_+_25173005 | 12.56 |
ENSRNOT00000033200
ENSRNOT00000091328 |
Clip2
|
CAP-GLY domain containing linker protein 2 |
| chr5_-_9381214 | 12.47 |
ENSRNOT00000039237
|
RGD1561849
|
similar to RIKEN cDNA 3110035E14 |
| chr18_+_30435119 | 12.28 |
ENSRNOT00000027190
|
Pcdhb8
|
protocadherin beta 8 |
| chr13_-_49313940 | 12.24 |
ENSRNOT00000012190
|
Cntn2
|
contactin 2 |
| chrX_+_19243759 | 12.10 |
ENSRNOT00000004238
|
Mageh1
|
MAGE family member H1 |
| chr9_-_71830730 | 12.02 |
ENSRNOT00000019963
|
Cryga
|
crystallin, gamma A |
| chr1_+_234363994 | 11.99 |
ENSRNOT00000018137
|
Rorb
|
RAR-related orphan receptor B |
| chr16_-_81912738 | 11.97 |
ENSRNOT00000087095
|
Mcf2l
|
MCF.2 cell line derived transforming sequence-like |
| chr2_-_23909016 | 11.93 |
ENSRNOT00000084044
|
Scamp1
|
secretory carrier membrane protein 1 |
| chr9_-_75528644 | 11.84 |
ENSRNOT00000019283
|
Erbb4
|
erb-b2 receptor tyrosine kinase 4 |
| chr15_-_65507968 | 11.74 |
ENSRNOT00000046240
|
Calm2
|
calmodulin 2 |
| chr5_+_152681101 | 11.72 |
ENSRNOT00000076052
ENSRNOT00000022574 |
Stmn1
|
stathmin 1 |
| chr4_-_727691 | 11.71 |
ENSRNOT00000008497
|
Shh
|
sonic hedgehog |
| chrX_+_6273733 | 11.67 |
ENSRNOT00000074275
|
Ndp
|
NDP, norrin cystine knot growth factor |
| chr4_-_11610518 | 11.62 |
ENSRNOT00000066643
|
Magi2
|
membrane associated guanylate kinase, WW and PDZ domain containing 2 |
| chr2_+_95008311 | 11.60 |
ENSRNOT00000077270
|
Tpd52
|
tumor protein D52 |
| chr8_-_116893057 | 11.56 |
ENSRNOT00000082113
|
Bsn
|
bassoon (presynaptic cytomatrix protein) |
| chr1_+_25173242 | 11.53 |
ENSRNOT00000016518
|
Clvs2
|
clavesin 2 |
| chrX_+_70596576 | 11.43 |
ENSRNOT00000045082
ENSRNOT00000003741 ENSRNOT00000076079 |
Dlg3
|
discs large MAGUK scaffold protein 3 |
| chr6_-_27024129 | 11.33 |
ENSRNOT00000012273
|
Dpysl5
|
dihydropyrimidinase-like 5 |
| chr7_-_78930832 | 11.11 |
ENSRNOT00000005668
|
Lrp12
|
LDL receptor related protein 12 |
| chr9_+_6966908 | 11.11 |
ENSRNOT00000072796
|
St6gal2
|
ST6 beta-galactoside alpha-2,6-sialyltransferase 2 |
| chr10_-_74376270 | 10.95 |
ENSRNOT00000079311
|
Gdpd1
|
glycerophosphodiester phosphodiesterase domain containing 1 |
| chr3_-_123849788 | 10.86 |
ENSRNOT00000028869
|
Rnf24
|
ring finger protein 24 |
| chr2_+_95008477 | 10.86 |
ENSRNOT00000015327
|
Tpd52
|
tumor protein D52 |
| chr19_+_24329544 | 10.83 |
ENSRNOT00000080934
|
Tbc1d9
|
TBC1 domain family member 9 |
| chr14_-_37770059 | 10.61 |
ENSRNOT00000029721
|
Slc10a4
|
solute carrier family 10, member 4 |
| chr11_+_61531571 | 10.46 |
ENSRNOT00000093467
ENSRNOT00000002727 |
Atp6v1a
|
ATPase H+ transporting V1 subunit A |
| chr7_-_140417530 | 10.44 |
ENSRNOT00000077884
|
Fkbp11
|
FK506 binding protein 11 |
| chr1_+_144070754 | 10.40 |
ENSRNOT00000079989
|
Sh3gl3
|
SH3 domain-containing GRB2-like 3 |
| chr4_+_86275717 | 10.28 |
ENSRNOT00000016414
|
Ppp1r17
|
protein phosphatase 1, regulatory subunit 17 |
| chr7_+_110031696 | 10.24 |
ENSRNOT00000012753
|
Khdrbs3
|
KH RNA binding domain containing, signal transduction associated 3 |
| chr4_-_39102807 | 10.08 |
ENSRNOT00000052063
|
Thsd7a
|
thrombospondin type 1 domain containing 7A |
| chr7_-_59514939 | 9.99 |
ENSRNOT00000085579
|
Kcnmb4
|
potassium calcium-activated channel subfamily M regulatory beta subunit 4 |
| chr18_+_30895831 | 9.89 |
ENSRNOT00000026985
|
Pcdhga10
|
protocadherin gamma subfamily A, 10 |
| chrX_-_152641679 | 9.83 |
ENSRNOT00000080277
|
Gabra3
|
gamma-aminobutyric acid type A receptor alpha3 subunit |
| chr5_-_34813116 | 9.78 |
ENSRNOT00000017479
|
Nkain3
|
Sodium/potassium transporting ATPase interacting 3 |
| chr16_+_54765325 | 9.76 |
ENSRNOT00000065327
ENSRNOT00000086899 |
Mtmr7
|
myotubularin related protein 7 |
| chr13_-_95250235 | 9.73 |
ENSRNOT00000085648
|
Akt3
|
AKT serine/threonine kinase 3 |
| chr14_-_41786084 | 9.63 |
ENSRNOT00000059439
|
Grxcr1
|
glutaredoxin and cysteine rich domain containing 1 |
| chr6_+_73358112 | 9.60 |
ENSRNOT00000041373
|
Arhgap5
|
Rho GTPase activating protein 5 |
| chr6_+_73553210 | 9.57 |
ENSRNOT00000006562
|
Akap6
|
A-kinase anchoring protein 6 |
| chr19_+_56136904 | 9.48 |
ENSRNOT00000022823
|
Spire2
|
spire-type actin nucleation factor 2 |
| chr18_+_30574627 | 9.46 |
ENSRNOT00000060484
|
Pcdhb19
|
protocadherin beta 19 |
| chr15_-_108120279 | 9.35 |
ENSRNOT00000090572
|
Dock9
|
dedicator of cytokinesis 9 |
| chr8_+_33239139 | 9.33 |
ENSRNOT00000011589
|
Arhgap32
|
Rho GTPase activating protein 32 |
| chr10_+_43768708 | 9.30 |
ENSRNOT00000086218
|
Sh3bp5l
|
SH3 binding domain protein 5 like |
| chr11_+_61531416 | 9.22 |
ENSRNOT00000093263
|
Atp6v1a
|
ATPase H+ transporting V1 subunit A |
| chr6_+_44009872 | 9.22 |
ENSRNOT00000082657
|
Mboat2
|
membrane bound O-acyltransferase domain containing 2 |
| chr2_-_226779440 | 9.21 |
ENSRNOT00000055669
|
Fnbp1l
|
formin binding protein 1-like |
| chr13_-_43566680 | 9.16 |
ENSRNOT00000073921
|
LOC100909582
|
alpha-1,6-mannosylglycoprotein 6-beta-N-acetylglucosaminyltransferase A-like |
| chr14_-_21128505 | 9.01 |
ENSRNOT00000004776
|
Rufy3
|
RUN and FYVE domain containing 3 |
| chr5_-_62186372 | 8.94 |
ENSRNOT00000089789
|
Coro2a
|
coronin 2A |
| chrX_-_123662350 | 8.69 |
ENSRNOT00000092624
|
Sept6
|
septin 6 |
| chr3_+_176102351 | 8.56 |
ENSRNOT00000013105
|
Col9a3
|
collagen type IX alpha 3 chain |
| chr6_+_147876557 | 8.52 |
ENSRNOT00000080090
|
Tmem196
|
transmembrane protein 196 |
| chr6_+_43001948 | 8.33 |
ENSRNOT00000007374
|
Hpcal1
|
hippocalcin-like 1 |
| chr5_-_12541019 | 8.31 |
ENSRNOT00000091649
|
St18
|
suppression of tumorigenicity 18 |
| chrX_+_135348436 | 8.28 |
ENSRNOT00000008868
|
Rab33a
|
RAB33A, member RAS oncogene family |
| chr1_-_165382216 | 8.25 |
ENSRNOT00000023648
|
Ppme1
|
protein phosphatase methylesterase 1 |
| chr10_-_47453442 | 8.24 |
ENSRNOT00000050061
|
Usp22
|
ubiquitin specific peptidase 22 |
| chr12_-_19114399 | 8.19 |
ENSRNOT00000073099
|
Cyp3a9
|
cytochrome P450, family 3, subfamily a, polypeptide 9 |
| chr5_-_82168347 | 8.12 |
ENSRNOT00000084959
ENSRNOT00000084147 |
Astn2
|
astrotactin 2 |
| chr11_-_88092756 | 8.12 |
ENSRNOT00000002542
|
Ydjc
|
YdjC homolog (bacterial) |
| chr3_-_15278645 | 8.11 |
ENSRNOT00000032204
|
Ttll11
|
tubulin tyrosine ligase like11 |
| chr13_-_1946508 | 7.98 |
ENSRNOT00000043890
|
Dsel
|
dermatan sulfate epimerase-like |
| chr10_-_56167426 | 7.98 |
ENSRNOT00000013955
|
Efnb3
|
ephrin B3 |
| chr11_+_73738433 | 7.92 |
ENSRNOT00000002353
|
Tmem44
|
transmembrane protein 44 |
| chr10_-_85974644 | 7.84 |
ENSRNOT00000006098
ENSRNOT00000082974 |
Cacnb1
|
calcium voltage-gated channel auxiliary subunit beta 1 |
| chr6_+_145546595 | 7.76 |
ENSRNOT00000007112
|
Rapgef5
|
Rap guanine nucleotide exchange factor 5 |
| chr19_+_755460 | 7.75 |
ENSRNOT00000076560
|
Dync1li2
|
dynein, cytoplasmic 1 light intermediate chain 2 |
| chr10_+_92288910 | 7.75 |
ENSRNOT00000006947
ENSRNOT00000045127 |
Mapt
|
microtubule-associated protein tau |
| chr5_+_147714163 | 7.74 |
ENSRNOT00000012663
|
Marcksl1
|
MARCKS-like 1 |
| chr14_-_81399353 | 7.69 |
ENSRNOT00000018340
|
Add1
|
adducin 1 |
| chr2_-_186245771 | 7.68 |
ENSRNOT00000066004
ENSRNOT00000079954 |
Dclk2
|
doublecortin-like kinase 2 |
| chr6_+_147876237 | 7.67 |
ENSRNOT00000056649
|
Tmem196
|
transmembrane protein 196 |
| chr10_-_88670430 | 7.66 |
ENSRNOT00000025547
|
Hcrt
|
hypocretin neuropeptide precursor |
| chr2_-_96520137 | 7.63 |
ENSRNOT00000066966
|
Zc2hc1a
|
zinc finger, C2HC-type containing 1A |
| chr1_-_213981317 | 7.61 |
ENSRNOT00000086238
ENSRNOT00000054869 |
Slc25a22
|
solute carrier family 25 member 22 |
| chr4_-_150616895 | 7.58 |
ENSRNOT00000073562
|
Ankrd26
|
ankyrin repeat domain 26 |
| chr9_+_49479023 | 7.51 |
ENSRNOT00000050922
ENSRNOT00000077111 |
Pou3f3
|
POU class 3 homeobox 3 |
| chr16_+_48121430 | 7.48 |
ENSRNOT00000090839
|
Stox2
|
storkhead box 2 |
| chr14_-_21127868 | 7.40 |
ENSRNOT00000020608
ENSRNOT00000092172 |
Rufy3
|
RUN and FYVE domain containing 3 |
| chr18_+_14757679 | 7.40 |
ENSRNOT00000071364
|
Mapre2
|
microtubule-associated protein, RP/EB family, member 2 |
| chr13_-_51076852 | 7.33 |
ENSRNOT00000078993
|
Adora1
|
adenosine A1 receptor |
| chrX_-_15553720 | 7.28 |
ENSRNOT00000012646
|
Gripap1
|
GRIP1 associated protein 1 |
| chr15_+_18399733 | 7.26 |
ENSRNOT00000061158
|
Fam107a
|
family with sequence similarity 107, member A |
| chr2_+_112868707 | 7.14 |
ENSRNOT00000017805
|
Nceh1
|
neutral cholesterol ester hydrolase 1 |
| chr15_-_6587367 | 7.12 |
ENSRNOT00000038449
|
Zfp385d
|
zinc finger protein 385D |
| chr4_+_84194347 | 7.09 |
ENSRNOT00000084256
|
Chn2
|
chimerin 2 |
| chr3_+_148510779 | 7.05 |
ENSRNOT00000012156
|
Xkr7
|
XK related 7 |
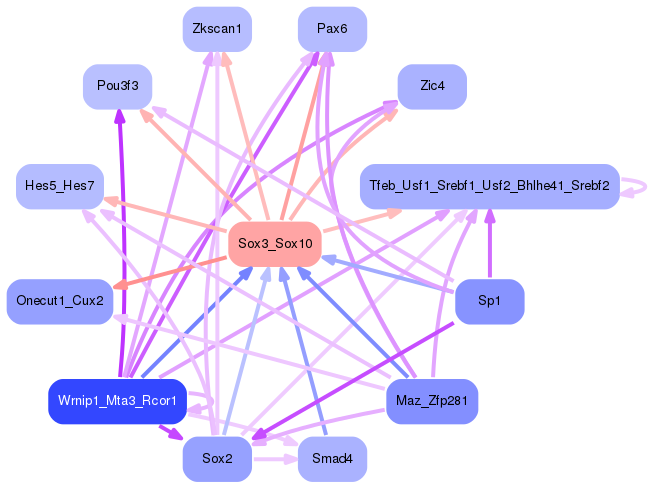
Network of associatons between targets according to the STRING database.

First level regulatory network of Sox3_Sox10
Gene Ontology Analysis
Gene overrepresentation in biological process category:
| Log-likelihood per target | Total log-likelihood | Term | Description |
|---|---|---|---|
| 37.3 | 111.9 | GO:1904209 | regulation of chemokine (C-C motif) ligand 2 secretion(GO:1904207) positive regulation of chemokine (C-C motif) ligand 2 secretion(GO:1904209) positive regulation of metalloendopeptidase activity(GO:1904685) |
| 23.8 | 71.4 | GO:0099552 | trans-synaptic signaling by lipid, modulating synaptic transmission(GO:0099552) trans-synaptic signaling by endocannabinoid, modulating synaptic transmission(GO:0099553) |
| 18.5 | 73.8 | GO:0098961 | dendritic transport of ribonucleoprotein complex(GO:0098961) dendritic transport of messenger ribonucleoprotein complex(GO:0098963) anterograde dendritic transport of messenger ribonucleoprotein complex(GO:0098964) |
| 9.1 | 108.7 | GO:0046543 | development of secondary female sexual characteristics(GO:0046543) |
| 8.9 | 26.8 | GO:0031632 | positive regulation of synaptic vesicle fusion to presynaptic membrane(GO:0031632) |
| 8.7 | 34.7 | GO:1904529 | regulation of actin filament binding(GO:1904529) regulation of actin binding(GO:1904616) |
| 8.2 | 24.5 | GO:1900039 | positive regulation of cellular response to hypoxia(GO:1900039) |
| 7.1 | 21.2 | GO:0070495 | regulation of thrombin receptor signaling pathway(GO:0070494) negative regulation of thrombin receptor signaling pathway(GO:0070495) |
| 6.7 | 26.8 | GO:2000255 | negative regulation of male germ cell proliferation(GO:2000255) |
| 6.0 | 30.1 | GO:0051612 | negative regulation of neurotransmitter uptake(GO:0051581) regulation of serotonin uptake(GO:0051611) negative regulation of serotonin uptake(GO:0051612) |
| 5.8 | 5.8 | GO:0010643 | cell communication by chemical coupling(GO:0010643) |
| 5.5 | 16.6 | GO:1903281 | positive regulation of calcium:sodium antiporter activity(GO:1903281) |
| 5.2 | 15.5 | GO:1902309 | negative regulation of peptidyl-serine dephosphorylation(GO:1902309) |
| 5.1 | 20.4 | GO:0043396 | corticotropin-releasing hormone secretion(GO:0043396) regulation of corticotropin-releasing hormone secretion(GO:0043397) |
| 4.8 | 19.1 | GO:1903976 | negative regulation of glial cell migration(GO:1903976) |
| 4.6 | 13.9 | GO:0060769 | positive regulation of epithelial cell proliferation involved in prostate gland development(GO:0060769) |
| 4.5 | 17.9 | GO:0051586 | positive regulation of neurotransmitter uptake(GO:0051582) positive regulation of dopamine uptake involved in synaptic transmission(GO:0051586) positive regulation of catecholamine uptake involved in synaptic transmission(GO:0051944) |
| 4.3 | 12.8 | GO:0021917 | pancreatic A cell development(GO:0003322) forebrain-midbrain boundary formation(GO:0021905) somatic motor neuron fate commitment(GO:0021917) regulation of transcription from RNA polymerase II promoter involved in somatic motor neuron fate commitment(GO:0021918) sensory neuron migration(GO:1904937) |
| 4.1 | 37.0 | GO:1904116 | response to vasopressin(GO:1904116) |
| 4.1 | 12.2 | GO:0060167 | clustering of voltage-gated potassium channels(GO:0045163) regulation of adenosine receptor signaling pathway(GO:0060167) |
| 4.0 | 23.8 | GO:2001025 | positive regulation of response to drug(GO:2001025) |
| 3.9 | 15.8 | GO:0030035 | microspike assembly(GO:0030035) |
| 3.7 | 7.3 | GO:0042323 | negative regulation of circadian sleep/wake cycle, non-REM sleep(GO:0042323) negative regulation of mucus secretion(GO:0070256) |
| 3.6 | 35.7 | GO:0035021 | negative regulation of Rac protein signal transduction(GO:0035021) |
| 3.6 | 46.4 | GO:0097113 | AMPA glutamate receptor clustering(GO:0097113) |
| 3.3 | 23.2 | GO:0030050 | vesicle transport along actin filament(GO:0030050) |
| 3.2 | 9.5 | GO:0070649 | formin-nucleated actin cable assembly(GO:0070649) |
| 3.2 | 12.6 | GO:0010650 | positive regulation of cell communication by electrical coupling(GO:0010650) maintenance of protein location in membrane(GO:0072658) maintenance of protein location in plasma membrane(GO:0072660) positive regulation of membrane depolarization during cardiac muscle cell action potential(GO:1900827) |
| 3.1 | 31.1 | GO:0046684 | response to pyrethroid(GO:0046684) |
| 3.1 | 18.6 | GO:0033227 | dsRNA transport(GO:0033227) |
| 3.0 | 21.3 | GO:0060316 | positive regulation of ryanodine-sensitive calcium-release channel activity(GO:0060316) |
| 3.0 | 115.5 | GO:0007026 | negative regulation of microtubule depolymerization(GO:0007026) |
| 2.7 | 8.1 | GO:0048104 | establishment of body hair or bristle planar orientation(GO:0048104) establishment of body hair planar orientation(GO:0048105) |
| 2.6 | 10.5 | GO:0036515 | serotonergic neuron axon guidance(GO:0036515) |
| 2.6 | 20.5 | GO:0008065 | establishment of blood-nerve barrier(GO:0008065) |
| 2.5 | 48.3 | GO:0021860 | pyramidal neuron development(GO:0021860) |
| 2.5 | 17.4 | GO:0060373 | regulation of ventricular cardiac muscle cell membrane depolarization(GO:0060373) |
| 2.5 | 24.5 | GO:0006688 | glycosphingolipid biosynthetic process(GO:0006688) |
| 2.4 | 43.7 | GO:0001573 | ganglioside metabolic process(GO:0001573) |
| 2.4 | 7.3 | GO:1905244 | regulation of modification of synaptic structure(GO:1905244) |
| 2.3 | 16.3 | GO:2000096 | positive regulation of Wnt signaling pathway, planar cell polarity pathway(GO:2000096) |
| 2.3 | 11.6 | GO:0097118 | neuroligin clustering involved in postsynaptic membrane assembly(GO:0097118) |
| 2.3 | 6.9 | GO:0018201 | peptidyl-glycine modification(GO:0018201) |
| 2.1 | 6.4 | GO:2000978 | auditory receptor cell fate determination(GO:0042668) negative regulation of pro-B cell differentiation(GO:2000974) negative regulation of forebrain neuron differentiation(GO:2000978) |
| 2.0 | 8.2 | GO:0009822 | lipid hydroxylation(GO:0002933) alkaloid catabolic process(GO:0009822) |
| 2.0 | 14.1 | GO:1900454 | positive regulation of long term synaptic depression(GO:1900454) |
| 2.0 | 8.0 | GO:0016198 | axon choice point recognition(GO:0016198) |
| 2.0 | 11.8 | GO:0007262 | STAT protein import into nucleus(GO:0007262) |
| 1.9 | 5.8 | GO:0002572 | pro-T cell differentiation(GO:0002572) |
| 1.9 | 11.6 | GO:0098928 | presynaptic signal transduction(GO:0098928) presynapse to nucleus signaling pathway(GO:0099526) |
| 1.9 | 26.9 | GO:0035414 | negative regulation of catenin import into nucleus(GO:0035414) |
| 1.9 | 7.5 | GO:0072021 | ascending thin limb development(GO:0072021) metanephric ascending thin limb development(GO:0072218) |
| 1.9 | 3.7 | GO:0050717 | positive regulation of interleukin-1 alpha secretion(GO:0050717) |
| 1.9 | 20.5 | GO:0061302 | smooth muscle cell-matrix adhesion(GO:0061302) |
| 1.8 | 3.7 | GO:0060399 | positive regulation of growth hormone receptor signaling pathway(GO:0060399) |
| 1.8 | 5.5 | GO:1990402 | embryonic liver development(GO:1990402) |
| 1.7 | 28.0 | GO:0051967 | negative regulation of synaptic transmission, glutamatergic(GO:0051967) |
| 1.7 | 1.7 | GO:0001998 | angiotensin mediated vasoconstriction involved in regulation of systemic arterial blood pressure(GO:0001998) |
| 1.7 | 25.6 | GO:0060134 | prepulse inhibition(GO:0060134) |
| 1.7 | 30.5 | GO:0014049 | positive regulation of glutamate secretion(GO:0014049) |
| 1.6 | 9.6 | GO:0048664 | neuron fate determination(GO:0048664) |
| 1.6 | 8.0 | GO:0030205 | dermatan sulfate metabolic process(GO:0030205) |
| 1.6 | 15.6 | GO:0018095 | protein polyglutamylation(GO:0018095) |
| 1.6 | 6.2 | GO:1901491 | negative regulation of lymphangiogenesis(GO:1901491) |
| 1.5 | 54.9 | GO:0051491 | positive regulation of filopodium assembly(GO:0051491) |
| 1.5 | 4.6 | GO:0046952 | polyprenol biosynthetic process(GO:0016094) ketone body catabolic process(GO:0046952) |
| 1.5 | 4.5 | GO:0019086 | regulation of transcription from RNA polymerase II promoter by glucose(GO:0000430) positive regulation of transcription from RNA polymerase II promoter by glucose(GO:0000432) late viral transcription(GO:0019086) positive regulation of transcription by glucose(GO:0046016) |
| 1.5 | 9.0 | GO:1901898 | negative regulation of relaxation of cardiac muscle(GO:1901898) |
| 1.5 | 20.7 | GO:0031111 | negative regulation of microtubule polymerization or depolymerization(GO:0031111) |
| 1.5 | 4.4 | GO:0060762 | regulation of branching involved in mammary gland duct morphogenesis(GO:0060762) |
| 1.4 | 6.9 | GO:0044691 | tooth eruption(GO:0044691) |
| 1.4 | 4.1 | GO:0032472 | Golgi calcium ion transport(GO:0032472) |
| 1.3 | 39.8 | GO:0045662 | negative regulation of myoblast differentiation(GO:0045662) |
| 1.3 | 27.8 | GO:0045745 | positive regulation of G-protein coupled receptor protein signaling pathway(GO:0045745) |
| 1.3 | 10.4 | GO:0016191 | synaptic vesicle uncoating(GO:0016191) |
| 1.3 | 7.7 | GO:0051970 | negative regulation of transmission of nerve impulse(GO:0051970) |
| 1.3 | 5.1 | GO:0042339 | keratan sulfate metabolic process(GO:0042339) |
| 1.3 | 17.6 | GO:0007614 | short-term memory(GO:0007614) |
| 1.3 | 6.3 | GO:0048096 | chromatin-mediated maintenance of transcription(GO:0048096) |
| 1.2 | 4.8 | GO:0046726 | positive regulation by virus of viral protein levels in host cell(GO:0046726) |
| 1.2 | 5.8 | GO:0050975 | sensory perception of touch(GO:0050975) |
| 1.2 | 3.5 | GO:0009609 | response to symbiotic bacterium(GO:0009609) |
| 1.1 | 11.4 | GO:0046710 | GDP metabolic process(GO:0046710) |
| 1.1 | 13.3 | GO:0046069 | cGMP catabolic process(GO:0046069) |
| 1.1 | 4.4 | GO:0009597 | detection of virus(GO:0009597) |
| 1.1 | 162.8 | GO:0007156 | homophilic cell adhesion via plasma membrane adhesion molecules(GO:0007156) |
| 1.1 | 5.4 | GO:1903142 | positive regulation of endothelial cell development(GO:1901552) positive regulation of establishment of endothelial barrier(GO:1903142) |
| 1.1 | 3.3 | GO:0043314 | negative regulation of neutrophil degranulation(GO:0043314) |
| 1.0 | 4.1 | GO:1904428 | negative regulation of tubulin deacetylation(GO:1904428) |
| 1.0 | 16.2 | GO:0008090 | retrograde axonal transport(GO:0008090) |
| 1.0 | 12.0 | GO:0046548 | retinal rod cell development(GO:0046548) |
| 1.0 | 9.9 | GO:0035865 | cellular response to potassium ion(GO:0035865) |
| 1.0 | 36.0 | GO:0048488 | synaptic vesicle endocytosis(GO:0048488) |
| 1.0 | 4.8 | GO:0035509 | negative regulation of myosin-light-chain-phosphatase activity(GO:0035509) |
| 1.0 | 5.8 | GO:1901621 | negative regulation of smoothened signaling pathway involved in dorsal/ventral neural tube patterning(GO:1901621) |
| 1.0 | 2.9 | GO:0006651 | diacylglycerol biosynthetic process(GO:0006651) |
| 1.0 | 3.8 | GO:0090361 | platelet-derived growth factor production(GO:0090360) regulation of platelet-derived growth factor production(GO:0090361) |
| 0.9 | 2.8 | GO:2001160 | regulation of histone H3-K79 methylation(GO:2001160) |
| 0.9 | 2.8 | GO:0051037 | regulation of transcription involved in meiotic cell cycle(GO:0051037) |
| 0.9 | 3.6 | GO:0038026 | reelin-mediated signaling pathway(GO:0038026) |
| 0.9 | 2.6 | GO:0051490 | negative regulation of filopodium assembly(GO:0051490) positive regulation of phospholipid catabolic process(GO:0060697) |
| 0.8 | 6.6 | GO:0098903 | regulation of membrane repolarization during action potential(GO:0098903) |
| 0.8 | 19.4 | GO:2000114 | regulation of establishment of cell polarity(GO:2000114) |
| 0.8 | 14.4 | GO:0097503 | sialylation(GO:0097503) |
| 0.8 | 6.3 | GO:0090315 | negative regulation of protein targeting to membrane(GO:0090315) |
| 0.8 | 10.0 | GO:0005513 | detection of calcium ion(GO:0005513) |
| 0.8 | 2.3 | GO:0045751 | regulation of Toll signaling pathway(GO:0008592) negative regulation of Toll signaling pathway(GO:0045751) |
| 0.8 | 7.5 | GO:0002098 | tRNA wobble uridine modification(GO:0002098) |
| 0.8 | 9.8 | GO:0046855 | inositol phosphate dephosphorylation(GO:0046855) |
| 0.7 | 2.2 | GO:0021986 | epithalamus development(GO:0021538) habenula development(GO:0021986) |
| 0.7 | 5.2 | GO:0000103 | sulfate assimilation(GO:0000103) |
| 0.7 | 2.8 | GO:0048022 | negative regulation of melanin biosynthetic process(GO:0048022) negative regulation of secondary metabolite biosynthetic process(GO:1900377) |
| 0.7 | 6.3 | GO:0060012 | synaptic transmission, glycinergic(GO:0060012) |
| 0.7 | 4.1 | GO:1903361 | protein localization to basolateral plasma membrane(GO:1903361) |
| 0.7 | 6.8 | GO:2000042 | negative regulation of double-strand break repair via homologous recombination(GO:2000042) |
| 0.6 | 18.8 | GO:0030866 | cortical actin cytoskeleton organization(GO:0030866) |
| 0.6 | 1.9 | GO:0097252 | oligodendrocyte apoptotic process(GO:0097252) |
| 0.6 | 19.7 | GO:0015991 | ATP hydrolysis coupled proton transport(GO:0015991) |
| 0.6 | 35.5 | GO:0031103 | axon regeneration(GO:0031103) |
| 0.6 | 2.4 | GO:0021502 | neural fold elevation formation(GO:0021502) |
| 0.6 | 2.9 | GO:0036438 | maintenance of lens transparency(GO:0036438) |
| 0.6 | 7.5 | GO:0010839 | negative regulation of keratinocyte proliferation(GO:0010839) |
| 0.6 | 2.3 | GO:0070086 | ubiquitin-dependent endocytosis(GO:0070086) |
| 0.5 | 7.6 | GO:0001675 | acrosome assembly(GO:0001675) |
| 0.5 | 1.1 | GO:2000049 | positive regulation of cell-cell adhesion mediated by cadherin(GO:2000049) |
| 0.5 | 5.6 | GO:2000311 | regulation of alpha-amino-3-hydroxy-5-methyl-4-isoxazole propionate selective glutamate receptor activity(GO:2000311) |
| 0.5 | 2.0 | GO:0010157 | epidermal cell fate specification(GO:0009957) response to chlorate(GO:0010157) |
| 0.5 | 7.6 | GO:0089711 | L-glutamate transmembrane transport(GO:0089711) |
| 0.5 | 15.2 | GO:0016242 | negative regulation of macroautophagy(GO:0016242) |
| 0.5 | 2.0 | GO:0036265 | RNA (guanine-N7)-methylation(GO:0036265) |
| 0.5 | 11.7 | GO:0015721 | bile acid and bile salt transport(GO:0015721) |
| 0.5 | 4.9 | GO:0090331 | negative regulation of platelet aggregation(GO:0090331) |
| 0.5 | 13.6 | GO:0034260 | negative regulation of GTPase activity(GO:0034260) |
| 0.5 | 15.8 | GO:0045747 | positive regulation of Notch signaling pathway(GO:0045747) |
| 0.4 | 1.8 | GO:0021637 | trigeminal nerve morphogenesis(GO:0021636) trigeminal nerve structural organization(GO:0021637) trunk segmentation(GO:0035290) trunk neural crest cell migration(GO:0036484) ventral trunk neural crest cell migration(GO:0036486) sympathetic neuron projection extension(GO:0097490) sympathetic neuron projection guidance(GO:0097491) semaphorin-plexin signaling pathway involved in axon guidance(GO:1902287) |
| 0.4 | 1.3 | GO:0043382 | defense response to nematode(GO:0002215) memory T cell activation(GO:0035709) positive regulation of memory T cell differentiation(GO:0043382) regulation of memory T cell activation(GO:2000567) positive regulation of memory T cell activation(GO:2000568) |
| 0.4 | 5.6 | GO:1900122 | positive regulation of receptor binding(GO:1900122) |
| 0.4 | 1.7 | GO:0042091 | interleukin-10 biosynthetic process(GO:0042091) regulation of interleukin-10 biosynthetic process(GO:0045074) |
| 0.4 | 11.8 | GO:0001580 | detection of chemical stimulus involved in sensory perception of bitter taste(GO:0001580) |
| 0.4 | 4.6 | GO:0043374 | CD8-positive, alpha-beta T cell differentiation(GO:0043374) |
| 0.4 | 2.9 | GO:0000160 | phosphorelay signal transduction system(GO:0000160) |
| 0.4 | 12.1 | GO:0048011 | neurotrophin TRK receptor signaling pathway(GO:0048011) |
| 0.4 | 3.3 | GO:0043587 | tongue morphogenesis(GO:0043587) |
| 0.4 | 4.2 | GO:0070236 | negative regulation of activation-induced cell death of T cells(GO:0070236) |
| 0.4 | 1.7 | GO:0045578 | negative regulation of B cell differentiation(GO:0045578) |
| 0.4 | 6.9 | GO:0045793 | positive regulation of cell size(GO:0045793) |
| 0.4 | 4.0 | GO:0048148 | behavioral response to cocaine(GO:0048148) |
| 0.4 | 14.3 | GO:0045773 | positive regulation of axon extension(GO:0045773) |
| 0.4 | 10.7 | GO:2000785 | regulation of autophagosome assembly(GO:2000785) |
| 0.4 | 3.2 | GO:1904424 | regulation of GTP binding(GO:1904424) |
| 0.4 | 1.2 | GO:1901091 | regulation of protein tetramerization(GO:1901090) negative regulation of protein tetramerization(GO:1901091) regulation of protein homotetramerization(GO:1901093) negative regulation of protein homotetramerization(GO:1901094) |
| 0.4 | 3.5 | GO:0098880 | maintenance of postsynaptic specialization structure(GO:0098880) maintenance of postsynaptic density structure(GO:0099562) |
| 0.4 | 1.6 | GO:1904008 | response to monosodium glutamate(GO:1904008) |
| 0.4 | 7.6 | GO:0046621 | negative regulation of organ growth(GO:0046621) |
| 0.4 | 1.9 | GO:1900020 | regulation of protein kinase C activity(GO:1900019) positive regulation of protein kinase C activity(GO:1900020) |
| 0.4 | 9.6 | GO:0060122 | inner ear receptor stereocilium organization(GO:0060122) |
| 0.4 | 2.2 | GO:0036465 | synaptic vesicle recycling(GO:0036465) |
| 0.4 | 2.2 | GO:0035426 | extracellular matrix-cell signaling(GO:0035426) |
| 0.4 | 0.7 | GO:0044268 | multicellular organismal protein metabolic process(GO:0044268) |
| 0.4 | 54.2 | GO:0007411 | axon guidance(GO:0007411) |
| 0.3 | 2.1 | GO:0035330 | regulation of hippo signaling(GO:0035330) |
| 0.3 | 6.9 | GO:0003417 | growth plate cartilage development(GO:0003417) |
| 0.3 | 5.9 | GO:0045947 | negative regulation of translational initiation(GO:0045947) |
| 0.3 | 2.0 | GO:1902746 | regulation of lens fiber cell differentiation(GO:1902746) |
| 0.3 | 9.8 | GO:0007214 | gamma-aminobutyric acid signaling pathway(GO:0007214) |
| 0.3 | 2.3 | GO:0009838 | abscission(GO:0009838) |
| 0.3 | 2.2 | GO:1902083 | negative regulation of peptidyl-cysteine S-nitrosylation(GO:1902083) |
| 0.3 | 13.5 | GO:0000413 | protein peptidyl-prolyl isomerization(GO:0000413) |
| 0.3 | 1.2 | GO:0033132 | negative regulation of glucokinase activity(GO:0033132) negative regulation of hexokinase activity(GO:1903300) |
| 0.3 | 12.4 | GO:0035249 | synaptic transmission, glutamatergic(GO:0035249) |
| 0.3 | 1.5 | GO:0042989 | sequestering of actin monomers(GO:0042989) |
| 0.3 | 2.1 | GO:0071000 | response to magnetism(GO:0071000) |
| 0.3 | 2.9 | GO:0071985 | multivesicular body sorting pathway(GO:0071985) |
| 0.3 | 0.9 | GO:0060816 | random inactivation of X chromosome(GO:0060816) regulation of dosage compensation by inactivation of X chromosome(GO:1900095) |
| 0.3 | 1.9 | GO:0071910 | determination of pancreatic left/right asymmetry(GO:0035469) determination of liver left/right asymmetry(GO:0071910) |
| 0.3 | 12.0 | GO:0043392 | negative regulation of DNA binding(GO:0043392) |
| 0.3 | 6.3 | GO:0046839 | phospholipid dephosphorylation(GO:0046839) |
| 0.3 | 2.3 | GO:0035900 | response to isolation stress(GO:0035900) |
| 0.3 | 1.0 | GO:0030581 | intracellular transport of viral protein in host cell(GO:0019060) symbiont intracellular protein transport in host(GO:0030581) intracellular protein transport in other organism involved in symbiotic interaction(GO:0051708) |
| 0.3 | 2.6 | GO:0006488 | dolichol-linked oligosaccharide biosynthetic process(GO:0006488) |
| 0.3 | 2.8 | GO:0006527 | arginine catabolic process(GO:0006527) |
| 0.2 | 2.5 | GO:0043162 | ubiquitin-dependent protein catabolic process via the multivesicular body sorting pathway(GO:0043162) |
| 0.2 | 27.2 | GO:0030705 | cytoskeleton-dependent intracellular transport(GO:0030705) |
| 0.2 | 14.7 | GO:0021987 | cerebral cortex development(GO:0021987) |
| 0.2 | 2.2 | GO:0032534 | regulation of microvillus assembly(GO:0032534) |
| 0.2 | 8.4 | GO:0007340 | acrosome reaction(GO:0007340) |
| 0.2 | 2.4 | GO:0031468 | nuclear envelope reassembly(GO:0031468) |
| 0.2 | 25.9 | GO:0008360 | regulation of cell shape(GO:0008360) |
| 0.2 | 6.6 | GO:1904659 | hexose transmembrane transport(GO:0035428) glucose transmembrane transport(GO:1904659) |
| 0.2 | 3.5 | GO:1901385 | regulation of voltage-gated calcium channel activity(GO:1901385) |
| 0.2 | 5.3 | GO:0002053 | positive regulation of mesenchymal cell proliferation(GO:0002053) |
| 0.2 | 0.6 | GO:0002949 | tRNA threonylcarbamoyladenosine modification(GO:0002949) |
| 0.2 | 4.2 | GO:0090162 | establishment of epithelial cell polarity(GO:0090162) |
| 0.2 | 18.8 | GO:0001764 | neuron migration(GO:0001764) |
| 0.2 | 7.9 | GO:0006482 | protein demethylation(GO:0006482) protein dealkylation(GO:0008214) |
| 0.2 | 1.0 | GO:0045743 | positive regulation of fibroblast growth factor receptor signaling pathway(GO:0045743) |
| 0.2 | 10.4 | GO:0031338 | regulation of vesicle fusion(GO:0031338) |
| 0.2 | 1.3 | GO:1903608 | protein localization to cytoplasmic stress granule(GO:1903608) |
| 0.2 | 1.0 | GO:2000323 | negative regulation of glucocorticoid receptor signaling pathway(GO:2000323) |
| 0.2 | 1.5 | GO:2000480 | negative regulation of cAMP-dependent protein kinase activity(GO:2000480) |
| 0.2 | 1.2 | GO:0090051 | negative regulation of cell migration involved in sprouting angiogenesis(GO:0090051) |
| 0.2 | 3.3 | GO:0032897 | negative regulation of viral transcription(GO:0032897) |
| 0.2 | 1.2 | GO:0014067 | negative regulation of phosphatidylinositol 3-kinase signaling(GO:0014067) |
| 0.2 | 9.6 | GO:0090090 | negative regulation of canonical Wnt signaling pathway(GO:0090090) |
| 0.1 | 0.7 | GO:0002035 | brain renin-angiotensin system(GO:0002035) |
| 0.1 | 0.7 | GO:0010991 | regulation of SMAD protein complex assembly(GO:0010990) negative regulation of SMAD protein complex assembly(GO:0010991) |
| 0.1 | 0.9 | GO:0048539 | bone marrow development(GO:0048539) |
| 0.1 | 3.9 | GO:0008608 | attachment of spindle microtubules to kinetochore(GO:0008608) |
| 0.1 | 0.4 | GO:0036451 | cap mRNA methylation(GO:0036451) |
| 0.1 | 2.2 | GO:1904355 | positive regulation of telomere capping(GO:1904355) |
| 0.1 | 1.7 | GO:0032988 | ribonucleoprotein complex disassembly(GO:0032988) |
| 0.1 | 1.3 | GO:0090084 | negative regulation of inclusion body assembly(GO:0090084) |
| 0.1 | 13.1 | GO:0019882 | antigen processing and presentation(GO:0019882) |
| 0.1 | 4.7 | GO:2000649 | regulation of sodium ion transmembrane transporter activity(GO:2000649) |
| 0.1 | 2.1 | GO:0031954 | positive regulation of protein autophosphorylation(GO:0031954) |
| 0.1 | 1.5 | GO:0051601 | exocyst localization(GO:0051601) |
| 0.1 | 3.1 | GO:0033120 | positive regulation of RNA splicing(GO:0033120) |
| 0.1 | 5.5 | GO:2000177 | regulation of neural precursor cell proliferation(GO:2000177) |
| 0.1 | 1.9 | GO:0032274 | gonadotropin secretion(GO:0032274) |
| 0.1 | 0.7 | GO:0051013 | microtubule severing(GO:0051013) |
| 0.1 | 1.5 | GO:0060670 | branching involved in labyrinthine layer morphogenesis(GO:0060670) |
| 0.1 | 1.1 | GO:0072502 | cellular phosphate ion homeostasis(GO:0030643) cellular trivalent inorganic anion homeostasis(GO:0072502) |
| 0.1 | 0.9 | GO:0014047 | glutamate secretion(GO:0014047) |
| 0.1 | 4.2 | GO:0016574 | histone ubiquitination(GO:0016574) |
| 0.1 | 2.9 | GO:0048678 | response to axon injury(GO:0048678) |
| 0.1 | 0.2 | GO:0061357 | positive regulation of Wnt protein secretion(GO:0061357) |
| 0.1 | 1.6 | GO:1990126 | retrograde transport, endosome to plasma membrane(GO:1990126) |
| 0.1 | 1.4 | GO:0006895 | Golgi to endosome transport(GO:0006895) |
| 0.1 | 7.2 | GO:0007605 | sensory perception of sound(GO:0007605) |
| 0.1 | 6.8 | GO:0072332 | intrinsic apoptotic signaling pathway by p53 class mediator(GO:0072332) |
| 0.1 | 0.3 | GO:0038028 | insulin receptor signaling pathway via phosphatidylinositol 3-kinase(GO:0038028) |
| 0.1 | 1.2 | GO:0035404 | histone-serine phosphorylation(GO:0035404) |
| 0.1 | 2.6 | GO:0006509 | membrane protein ectodomain proteolysis(GO:0006509) |
| 0.1 | 2.5 | GO:0034766 | negative regulation of ion transmembrane transport(GO:0034766) |
| 0.1 | 1.1 | GO:0042036 | negative regulation of cytokine biosynthetic process(GO:0042036) |
| 0.1 | 0.5 | GO:0098789 | pre-mRNA cleavage required for polyadenylation(GO:0098789) |
| 0.1 | 0.2 | GO:0016598 | protein arginylation(GO:0016598) |
| 0.1 | 0.4 | GO:0070417 | cellular response to cold(GO:0070417) |
| 0.1 | 1.0 | GO:0032967 | positive regulation of collagen biosynthetic process(GO:0032967) |
| 0.1 | 2.0 | GO:0046854 | phosphatidylinositol phosphorylation(GO:0046854) |
| 0.1 | 10.0 | GO:0018105 | peptidyl-serine phosphorylation(GO:0018105) |
| 0.1 | 2.8 | GO:0001895 | retina homeostasis(GO:0001895) |
| 0.0 | 0.2 | GO:0021794 | thalamus development(GO:0021794) |
| 0.0 | 0.1 | GO:0000105 | histidine biosynthetic process(GO:0000105) |
| 0.0 | 0.3 | GO:0006398 | mRNA 3'-end processing by stem-loop binding and cleavage(GO:0006398) |
| 0.0 | 0.7 | GO:0043981 | histone H4-K5 acetylation(GO:0043981) histone H4-K8 acetylation(GO:0043982) |
| 0.0 | 0.4 | GO:0033262 | regulation of nuclear cell cycle DNA replication(GO:0033262) |
| 0.0 | 0.9 | GO:1900087 | positive regulation of G1/S transition of mitotic cell cycle(GO:1900087) |
| 0.0 | 1.3 | GO:0000186 | activation of MAPKK activity(GO:0000186) |
| 0.0 | 0.1 | GO:0070574 | cadmium ion transport(GO:0015691) cadmium ion transmembrane transport(GO:0070574) |
| 0.0 | 1.0 | GO:0006506 | GPI anchor biosynthetic process(GO:0006506) |
| 0.0 | 0.8 | GO:0018345 | protein palmitoylation(GO:0018345) |
| 0.0 | 2.3 | GO:0008654 | phospholipid biosynthetic process(GO:0008654) |
| 0.0 | 0.8 | GO:0018149 | peptide cross-linking(GO:0018149) |
| 0.0 | 0.1 | GO:1902544 | regulation of DNA N-glycosylase activity(GO:1902544) |
| 0.0 | 0.1 | GO:1900363 | regulation of mRNA polyadenylation(GO:1900363) |
| 0.0 | 0.6 | GO:0080171 | lysosome organization(GO:0007040) lytic vacuole organization(GO:0080171) |
| 0.0 | 2.4 | GO:0006887 | exocytosis(GO:0006887) |
Gene overrepresentation in cellular component category:
| Log-likelihood per target | Total log-likelihood | Term | Description |
|---|---|---|---|
| 31.4 | 188.6 | GO:0033269 | internode region of axon(GO:0033269) |
| 14.6 | 43.7 | GO:0034686 | integrin alphav-beta8 complex(GO:0034686) |
| 10.2 | 91.5 | GO:0097442 | CA3 pyramidal cell dendrite(GO:0097442) |
| 8.6 | 43.0 | GO:1990769 | proximal neuron projection(GO:1990769) |
| 5.0 | 14.9 | GO:1990761 | growth cone lamellipodium(GO:1990761) growth cone filopodium(GO:1990812) |
| 4.9 | 73.8 | GO:0035253 | ciliary rootlet(GO:0035253) |
| 4.8 | 38.4 | GO:0098831 | presynaptic active zone cytoplasmic component(GO:0098831) |
| 4.8 | 14.4 | GO:0005594 | collagen type IX trimer(GO:0005594) |
| 4.7 | 28.0 | GO:0032983 | kainate selective glutamate receptor complex(GO:0032983) |
| 4.1 | 12.3 | GO:0060187 | cell pole(GO:0060187) |
| 3.9 | 15.8 | GO:0044393 | microspike(GO:0044393) |
| 3.5 | 14.1 | GO:0045298 | tubulin complex(GO:0045298) |
| 3.5 | 24.5 | GO:0044305 | calyx of Held(GO:0044305) |
| 3.2 | 9.6 | GO:0014701 | junctional sarcoplasmic reticulum membrane(GO:0014701) |
| 2.9 | 8.7 | GO:0032173 | septin collar(GO:0032173) |
| 2.5 | 50.3 | GO:0001518 | voltage-gated sodium channel complex(GO:0001518) |
| 2.4 | 7.3 | GO:0098837 | postsynaptic recycling endosome(GO:0098837) |
| 2.4 | 23.8 | GO:1990635 | proximal dendrite(GO:1990635) |
| 1.9 | 63.5 | GO:0032281 | AMPA glutamate receptor complex(GO:0032281) |
| 1.8 | 18.3 | GO:0097433 | dense body(GO:0097433) |
| 1.8 | 23.6 | GO:0016342 | catenin complex(GO:0016342) |
| 1.7 | 64.6 | GO:0044295 | axonal growth cone(GO:0044295) |
| 1.6 | 19.7 | GO:0033180 | proton-transporting V-type ATPase, V1 domain(GO:0033180) |
| 1.5 | 24.9 | GO:0033268 | node of Ranvier(GO:0033268) |
| 1.4 | 5.7 | GO:1990357 | terminal web(GO:1990357) |
| 1.4 | 16.6 | GO:0005890 | sodium:potassium-exchanging ATPase complex(GO:0005890) |
| 1.2 | 110.7 | GO:0042734 | presynaptic membrane(GO:0042734) |
| 1.2 | 4.8 | GO:0031021 | interphase microtubule organizing center(GO:0031021) |
| 1.2 | 11.6 | GO:0036057 | filtration diaphragm(GO:0036056) slit diaphragm(GO:0036057) |
| 1.1 | 8.9 | GO:0016589 | NURF complex(GO:0016589) |
| 1.0 | 2.9 | GO:1990826 | nucleoplasmic periphery of the nuclear pore complex(GO:1990826) |
| 0.9 | 5.6 | GO:0032059 | bleb(GO:0032059) |
| 0.8 | 15.3 | GO:0043196 | varicosity(GO:0043196) |
| 0.8 | 10.3 | GO:0000124 | SAGA complex(GO:0000124) |
| 0.8 | 7.7 | GO:0008290 | F-actin capping protein complex(GO:0008290) |
| 0.7 | 9.6 | GO:0060091 | kinocilium(GO:0060091) |
| 0.7 | 29.4 | GO:0031941 | filamentous actin(GO:0031941) |
| 0.7 | 2.2 | GO:0008537 | proteasome activator complex(GO:0008537) |
| 0.7 | 29.8 | GO:0005891 | voltage-gated calcium channel complex(GO:0005891) |
| 0.7 | 38.0 | GO:0005871 | kinesin complex(GO:0005871) |
| 0.7 | 5.0 | GO:0097524 | sperm plasma membrane(GO:0097524) |
| 0.7 | 3.5 | GO:0044530 | supraspliceosomal complex(GO:0044530) |
| 0.7 | 18.9 | GO:0030867 | rough endoplasmic reticulum membrane(GO:0030867) |
| 0.7 | 219.5 | GO:0005874 | microtubule(GO:0005874) |
| 0.7 | 19.3 | GO:0035371 | microtubule plus-end(GO:0035371) |
| 0.7 | 11.9 | GO:0042589 | zymogen granule membrane(GO:0042589) |
| 0.6 | 17.0 | GO:0032588 | trans-Golgi network membrane(GO:0032588) |
| 0.6 | 16.6 | GO:0048786 | presynaptic active zone(GO:0048786) |
| 0.6 | 100.0 | GO:0043204 | perikaryon(GO:0043204) |
| 0.6 | 17.6 | GO:0005790 | smooth endoplasmic reticulum(GO:0005790) |
| 0.6 | 2.2 | GO:0070876 | SOSS complex(GO:0070876) |
| 0.5 | 5.8 | GO:0031143 | pseudopodium(GO:0031143) |
| 0.5 | 4.2 | GO:0032426 | stereocilium tip(GO:0032426) |
| 0.5 | 1.6 | GO:0005899 | insulin receptor complex(GO:0005899) |
| 0.5 | 20.2 | GO:0043198 | dendritic shaft(GO:0043198) |
| 0.5 | 1.5 | GO:0098592 | cytoplasmic side of apical plasma membrane(GO:0098592) |
| 0.5 | 29.7 | GO:0005791 | rough endoplasmic reticulum(GO:0005791) |
| 0.5 | 85.4 | GO:0043209 | myelin sheath(GO:0043209) |
| 0.5 | 29.0 | GO:0032580 | Golgi cisterna membrane(GO:0032580) |
| 0.5 | 2.3 | GO:0002142 | stereocilia ankle link complex(GO:0002142) |
| 0.5 | 1.4 | GO:1990723 | cytoplasmic periphery of the nuclear pore complex(GO:1990723) |
| 0.4 | 1.7 | GO:0071008 | B cell receptor complex(GO:0019815) U2-type post-mRNA release spliceosomal complex(GO:0071008) |
| 0.4 | 13.8 | GO:0032154 | cleavage furrow(GO:0032154) cell surface furrow(GO:0097610) |
| 0.4 | 3.2 | GO:0097197 | tetraspanin-enriched microdomain(GO:0097197) |
| 0.4 | 6.4 | GO:0051233 | spindle midzone(GO:0051233) |
| 0.4 | 22.1 | GO:0031901 | early endosome membrane(GO:0031901) |
| 0.4 | 71.0 | GO:0014069 | postsynaptic density(GO:0014069) |
| 0.4 | 1.5 | GO:0070436 | Grb2-EGFR complex(GO:0070436) |
| 0.4 | 7.9 | GO:1902711 | GABA-A receptor complex(GO:1902711) |
| 0.3 | 20.5 | GO:0005788 | endoplasmic reticulum lumen(GO:0005788) |
| 0.3 | 2.4 | GO:0000815 | ESCRT III complex(GO:0000815) |
| 0.3 | 4.1 | GO:0035686 | sperm fibrous sheath(GO:0035686) |
| 0.3 | 2.5 | GO:0000813 | ESCRT I complex(GO:0000813) |
| 0.3 | 2.2 | GO:1990316 | ATG1/ULK1 kinase complex(GO:1990316) |
| 0.3 | 1.1 | GO:1990851 | Wnt-Frizzled-LRP5/6 complex(GO:1990851) |
| 0.3 | 3.8 | GO:0034709 | methylosome(GO:0034709) |
| 0.3 | 1.3 | GO:0097165 | nuclear stress granule(GO:0097165) |
| 0.2 | 2.8 | GO:0000812 | Swr1 complex(GO:0000812) |
| 0.2 | 3.0 | GO:0031932 | TORC2 complex(GO:0031932) |
| 0.2 | 1.1 | GO:0002189 | ribose phosphate diphosphokinase complex(GO:0002189) |
| 0.2 | 21.5 | GO:0030427 | site of polarized growth(GO:0030427) |
| 0.2 | 206.5 | GO:0005887 | integral component of plasma membrane(GO:0005887) |
| 0.2 | 1.3 | GO:0036513 | Derlin-1 retrotranslocation complex(GO:0036513) |
| 0.2 | 2.1 | GO:0046581 | intercellular canaliculus(GO:0046581) |
| 0.2 | 2.8 | GO:0071565 | nBAF complex(GO:0071565) |
| 0.2 | 0.6 | GO:0000408 | EKC/KEOPS complex(GO:0000408) |
| 0.1 | 8.8 | GO:0031463 | Cul3-RING ubiquitin ligase complex(GO:0031463) |
| 0.1 | 5.7 | GO:0045171 | intercellular bridge(GO:0045171) |
| 0.1 | 38.0 | GO:0043025 | neuronal cell body(GO:0043025) |
| 0.1 | 2.0 | GO:0005845 | mRNA cap binding complex(GO:0005845) |
| 0.1 | 9.3 | GO:0019005 | SCF ubiquitin ligase complex(GO:0019005) |
| 0.1 | 2.3 | GO:0010369 | chromocenter(GO:0010369) |
| 0.1 | 10.9 | GO:0000786 | nucleosome(GO:0000786) |
| 0.1 | 10.0 | GO:0008021 | synaptic vesicle(GO:0008021) |
| 0.1 | 2.3 | GO:0043197 | dendritic spine(GO:0043197) |
| 0.1 | 5.5 | GO:0005758 | mitochondrial intermembrane space(GO:0005758) |
| 0.1 | 5.0 | GO:0005903 | brush border(GO:0005903) |
| 0.1 | 0.4 | GO:0033093 | Weibel-Palade body(GO:0033093) |
| 0.1 | 1.2 | GO:0031588 | nucleotide-activated protein kinase complex(GO:0031588) |
| 0.1 | 7.8 | GO:0005802 | trans-Golgi network(GO:0005802) |
| 0.1 | 1.2 | GO:0005782 | peroxisomal matrix(GO:0005782) microbody lumen(GO:0031907) |
| 0.1 | 4.1 | GO:0055037 | recycling endosome(GO:0055037) |
| 0.1 | 7.0 | GO:0001650 | fibrillar center(GO:0001650) |
| 0.1 | 2.4 | GO:0016592 | mediator complex(GO:0016592) |
| 0.0 | 3.5 | GO:0045095 | keratin filament(GO:0045095) |
| 0.0 | 0.5 | GO:0005847 | mRNA cleavage and polyadenylation specificity factor complex(GO:0005847) |
| 0.0 | 0.3 | GO:0032045 | guanyl-nucleotide exchange factor complex(GO:0032045) |
| 0.0 | 2.2 | GO:0048475 | membrane coat(GO:0030117) coated membrane(GO:0048475) |
| 0.0 | 1.2 | GO:0000307 | cyclin-dependent protein kinase holoenzyme complex(GO:0000307) |
| 0.0 | 1.4 | GO:0016323 | basolateral plasma membrane(GO:0016323) |
| 0.0 | 0.2 | GO:0090665 | dystrophin-associated glycoprotein complex(GO:0016010) glycoprotein complex(GO:0090665) |
Gene overrepresentation in molecular function category:
| Log-likelihood per target | Total log-likelihood | Term | Description |
|---|---|---|---|
| 17.9 | 71.4 | GO:0004949 | cannabinoid receptor activity(GO:0004949) |
| 17.2 | 206.3 | GO:0019911 | structural constituent of myelin sheath(GO:0019911) |
| 7.4 | 73.8 | GO:0034190 | apolipoprotein receptor binding(GO:0034190) |
| 7.1 | 35.6 | GO:0004105 | choline-phosphate cytidylyltransferase activity(GO:0004105) |
| 5.5 | 43.7 | GO:1990430 | extracellular matrix protein binding(GO:1990430) |
| 4.9 | 24.5 | GO:0022841 | potassium ion leak channel activity(GO:0022841) |
| 4.6 | 13.9 | GO:0015222 | serotonin transmembrane transporter activity(GO:0015222) |
| 4.5 | 17.9 | GO:0008489 | UDP-galactose:glucosylceramide beta-1,4-galactosyltransferase activity(GO:0008489) |
| 4.1 | 94.3 | GO:0002162 | dystroglycan binding(GO:0002162) |
| 4.0 | 28.0 | GO:0015277 | kainate selective glutamate receptor activity(GO:0015277) |
| 3.9 | 11.7 | GO:0099567 | N-terminal myristoylation domain binding(GO:0031997) calcium ion binding involved in regulation of postsynaptic cytosolic calcium ion concentration(GO:0099567) |
| 3.5 | 14.1 | GO:0099609 | microtubule lateral binding(GO:0099609) |
| 2.9 | 20.5 | GO:0038062 | protein tyrosine kinase collagen receptor activity(GO:0038062) |
| 2.9 | 11.6 | GO:0070699 | type II activin receptor binding(GO:0070699) |
| 2.8 | 11.1 | GO:0003835 | beta-galactoside alpha-2,6-sialyltransferase activity(GO:0003835) |
| 2.7 | 16.2 | GO:0005095 | GTPase inhibitor activity(GO:0005095) |
| 2.7 | 8.0 | GO:0047757 | chondroitin-glucuronate 5-epimerase activity(GO:0047757) |
| 2.4 | 16.8 | GO:0045504 | dynein heavy chain binding(GO:0045504) |
| 2.4 | 12.0 | GO:0008502 | melatonin receptor activity(GO:0008502) |
| 2.4 | 7.1 | GO:0001565 | phorbol ester receptor activity(GO:0001565) |
| 2.3 | 11.7 | GO:0043237 | laminin-1 binding(GO:0043237) |
| 2.3 | 16.4 | GO:0045503 | dynein light chain binding(GO:0045503) |
| 2.3 | 9.2 | GO:0030144 | alpha-1,6-mannosylglycoprotein 6-beta-N-acetylglucosaminyltransferase activity(GO:0030144) |
| 2.2 | 17.4 | GO:0086006 | voltage-gated sodium channel activity involved in cardiac muscle cell action potential(GO:0086006) |
| 2.1 | 46.4 | GO:0043395 | heparan sulfate proteoglycan binding(GO:0043395) |
| 2.0 | 8.1 | GO:0043533 | inositol 1,3,4,5 tetrakisphosphate binding(GO:0043533) |
| 1.9 | 5.8 | GO:0031893 | vasopressin receptor binding(GO:0031893) |
| 1.9 | 7.5 | GO:0016300 | tRNA (uracil) methyltransferase activity(GO:0016300) |
| 1.9 | 5.6 | GO:0070679 | inositol 1,4,5 trisphosphate binding(GO:0070679) |
| 1.8 | 18.4 | GO:0036310 | annealing helicase activity(GO:0036310) |
| 1.8 | 39.3 | GO:0005248 | voltage-gated sodium channel activity(GO:0005248) |
| 1.8 | 10.6 | GO:0008508 | bile acid:sodium symporter activity(GO:0008508) |
| 1.7 | 5.2 | GO:0004781 | adenylylsulfate kinase activity(GO:0004020) sulfate adenylyltransferase activity(GO:0004779) sulfate adenylyltransferase (ATP) activity(GO:0004781) |
| 1.7 | 108.7 | GO:0005080 | protein kinase C binding(GO:0005080) |
| 1.7 | 33.1 | GO:0031005 | filamin binding(GO:0031005) |
| 1.6 | 6.6 | GO:0001733 | galactosylceramide sulfotransferase activity(GO:0001733) |
| 1.6 | 4.8 | GO:0102344 | 3-hydroxy-behenoyl-CoA dehydratase activity(GO:0102344) 3-hydroxy-lignoceroyl-CoA dehydratase activity(GO:0102345) |
| 1.5 | 7.6 | GO:0005314 | high-affinity glutamate transmembrane transporter activity(GO:0005314) |
| 1.5 | 4.6 | GO:0016453 | C-acetyltransferase activity(GO:0016453) |
| 1.5 | 7.3 | GO:0032795 | heterotrimeric G-protein binding(GO:0032795) |
| 1.4 | 18.7 | GO:0004089 | carbonate dehydratase activity(GO:0004089) |
| 1.3 | 7.9 | GO:0015189 | L-lysine transmembrane transporter activity(GO:0015189) |
| 1.3 | 10.3 | GO:0004865 | protein serine/threonine phosphatase inhibitor activity(GO:0004865) |
| 1.3 | 11.5 | GO:0004716 | receptor signaling protein tyrosine kinase activity(GO:0004716) |
| 1.3 | 16.6 | GO:0005391 | sodium:potassium-exchanging ATPase activity(GO:0005391) |
| 1.2 | 3.7 | GO:0022840 | leak channel activity(GO:0022840) narrow pore channel activity(GO:0022842) |
| 1.2 | 10.6 | GO:0017034 | Rap guanyl-nucleotide exchange factor activity(GO:0017034) |
| 1.2 | 11.5 | GO:0003680 | AT DNA binding(GO:0003680) |
| 1.1 | 11.4 | GO:0004385 | guanylate kinase activity(GO:0004385) |
| 1.1 | 121.5 | GO:0005200 | structural constituent of cytoskeleton(GO:0005200) |
| 1.1 | 73.3 | GO:0005546 | phosphatidylinositol-4,5-bisphosphate binding(GO:0005546) |
| 1.0 | 4.0 | GO:0031802 | type 5 metabotropic glutamate receptor binding(GO:0031802) |
| 1.0 | 52.7 | GO:0005504 | fatty acid binding(GO:0005504) |
| 1.0 | 13.3 | GO:0047555 | 3',5'-cyclic-GMP phosphodiesterase activity(GO:0047555) |
| 0.9 | 2.8 | GO:0052724 | inositol hexakisphosphate 1-kinase activity(GO:0052723) inositol hexakisphosphate 3-kinase activity(GO:0052724) |
| 0.9 | 19.7 | GO:0046961 | proton-transporting ATPase activity, rotational mechanism(GO:0046961) |
| 0.9 | 2.8 | GO:0016403 | dimethylargininase activity(GO:0016403) |
| 0.9 | 14.6 | GO:0030159 | receptor signaling complex scaffold activity(GO:0030159) |
| 0.9 | 11.5 | GO:0080025 | phosphatidylinositol-3,5-bisphosphate binding(GO:0080025) |
| 0.9 | 225.9 | GO:0008017 | microtubule binding(GO:0008017) |
| 0.9 | 2.6 | GO:0070976 | TIR domain binding(GO:0070976) |
| 0.8 | 5.1 | GO:0001517 | N-acetylglucosamine 6-O-sulfotransferase activity(GO:0001517) |
| 0.8 | 17.5 | GO:0005388 | calcium-transporting ATPase activity(GO:0005388) |
| 0.8 | 14.9 | GO:0048156 | tau protein binding(GO:0048156) |
| 0.8 | 14.4 | GO:0008331 | high voltage-gated calcium channel activity(GO:0008331) |
| 0.7 | 2.9 | GO:0008109 | N-acetyllactosaminide beta-1,6-N-acetylglucosaminyltransferase activity(GO:0008109) |
| 0.7 | 17.5 | GO:0005112 | Notch binding(GO:0005112) |
| 0.7 | 3.6 | GO:0008035 | high-density lipoprotein particle binding(GO:0008035) very-low-density lipoprotein particle receptor activity(GO:0030229) |
| 0.7 | 26.4 | GO:0071855 | neuropeptide receptor binding(GO:0071855) |
| 0.7 | 9.6 | GO:0008179 | adenylate cyclase binding(GO:0008179) |
| 0.7 | 2.0 | GO:0005119 | smoothened binding(GO:0005119) |
| 0.7 | 3.3 | GO:0001665 | alpha-N-acetylgalactosaminide alpha-2,6-sialyltransferase activity(GO:0001665) |
| 0.7 | 15.3 | GO:0031489 | myosin V binding(GO:0031489) |
| 0.7 | 57.3 | GO:0015631 | tubulin binding(GO:0015631) |
| 0.6 | 5.0 | GO:0047372 | acylglycerol lipase activity(GO:0047372) |
| 0.6 | 4.2 | GO:0043426 | MRF binding(GO:0043426) |
| 0.6 | 59.0 | GO:0005262 | calcium channel activity(GO:0005262) |
| 0.6 | 5.9 | GO:0005412 | glucose:sodium symporter activity(GO:0005412) |
| 0.6 | 2.9 | GO:0003846 | 2-acylglycerol O-acyltransferase activity(GO:0003846) diacylglycerol O-acyltransferase activity(GO:0004144) |
| 0.6 | 6.3 | GO:0042577 | lipid phosphatase activity(GO:0042577) |
| 0.5 | 7.1 | GO:0042301 | phosphate ion binding(GO:0042301) |
| 0.5 | 11.0 | GO:0004622 | lysophospholipase activity(GO:0004622) |
| 0.5 | 76.3 | GO:0051015 | actin filament binding(GO:0051015) |
| 0.5 | 21.2 | GO:0051019 | mitogen-activated protein kinase binding(GO:0051019) |
| 0.5 | 6.3 | GO:0005092 | GDP-dissociation inhibitor activity(GO:0005092) |
| 0.5 | 12.5 | GO:0004707 | MAP kinase activity(GO:0004707) |
| 0.5 | 6.3 | GO:0005283 | sodium:amino acid symporter activity(GO:0005283) |
| 0.5 | 3.1 | GO:0050786 | RAGE receptor binding(GO:0050786) |
| 0.5 | 5.9 | GO:0008190 | eukaryotic initiation factor 4E binding(GO:0008190) |
| 0.5 | 5.4 | GO:0042043 | neurexin family protein binding(GO:0042043) |
| 0.5 | 2.9 | GO:0031698 | beta-2 adrenergic receptor binding(GO:0031698) |
| 0.5 | 13.1 | GO:0005540 | hyaluronic acid binding(GO:0005540) |
| 0.5 | 3.4 | GO:0016018 | cyclosporin A binding(GO:0016018) |
| 0.4 | 9.1 | GO:0005545 | 1-phosphatidylinositol binding(GO:0005545) |
| 0.4 | 9.6 | GO:0015035 | protein disulfide oxidoreductase activity(GO:0015035) |
| 0.4 | 2.9 | GO:0004673 | phosphorelay sensor kinase activity(GO:0000155) protein histidine kinase activity(GO:0004673) |
| 0.4 | 2.1 | GO:0071253 | connexin binding(GO:0071253) |
| 0.4 | 2.4 | GO:0045295 | gamma-catenin binding(GO:0045295) |
| 0.4 | 3.5 | GO:0098919 | structural constituent of postsynaptic specialization(GO:0098879) structural constituent of synapse(GO:0098918) structural constituent of postsynaptic density(GO:0098919) |
| 0.4 | 1.1 | GO:0000822 | inositol hexakisphosphate binding(GO:0000822) |
| 0.4 | 4.4 | GO:0015194 | L-serine transmembrane transporter activity(GO:0015194) serine transmembrane transporter activity(GO:0022889) |
| 0.4 | 10.0 | GO:0015269 | calcium-activated potassium channel activity(GO:0015269) |
| 0.4 | 5.0 | GO:0031210 | phosphatidylcholine binding(GO:0031210) |
| 0.3 | 9.8 | GO:0052866 | phosphatidylinositol phosphate phosphatase activity(GO:0052866) |
| 0.3 | 1.4 | GO:0005499 | vitamin D binding(GO:0005499) |
| 0.3 | 6.1 | GO:0017080 | sodium channel regulator activity(GO:0017080) |
| 0.3 | 2.4 | GO:0008174 | mRNA methyltransferase activity(GO:0008174) |
| 0.3 | 2.6 | GO:0035005 | 1-phosphatidylinositol-4-phosphate 3-kinase activity(GO:0035005) |
| 0.3 | 12.7 | GO:0005109 | frizzled binding(GO:0005109) |
| 0.3 | 2.2 | GO:0061133 | endopeptidase activator activity(GO:0061133) |
| 0.3 | 7.9 | GO:0004890 | GABA-A receptor activity(GO:0004890) |
| 0.3 | 0.9 | GO:0008311 | double-stranded DNA 3'-5' exodeoxyribonuclease activity(GO:0008311) |
| 0.3 | 1.5 | GO:0005168 | neurotrophin TRKA receptor binding(GO:0005168) |
| 0.3 | 8.2 | GO:0008395 | steroid hydroxylase activity(GO:0008395) |
| 0.3 | 4.7 | GO:0017160 | Ral GTPase binding(GO:0017160) |
| 0.3 | 2.2 | GO:0098505 | G-rich strand telomeric DNA binding(GO:0098505) |
| 0.3 | 10.1 | GO:0003755 | peptidyl-prolyl cis-trans isomerase activity(GO:0003755) |
| 0.2 | 26.6 | GO:0044325 | ion channel binding(GO:0044325) |
| 0.2 | 1.2 | GO:0005052 | peroxisome matrix targeting signal-1 binding(GO:0005052) |
| 0.2 | 13.8 | GO:0019888 | protein phosphatase regulator activity(GO:0019888) |
| 0.2 | 4.5 | GO:0008327 | methyl-CpG binding(GO:0008327) |
| 0.2 | 2.4 | GO:0070700 | BMP receptor binding(GO:0070700) |
| 0.2 | 3.1 | GO:0005246 | calcium channel regulator activity(GO:0005246) |
| 0.2 | 0.9 | GO:0005113 | patched binding(GO:0005113) |
| 0.2 | 0.7 | GO:0004711 | ribosomal protein S6 kinase activity(GO:0004711) |
| 0.2 | 1.1 | GO:0015198 | oligopeptide transporter activity(GO:0015198) |
| 0.2 | 3.6 | GO:0005229 | intracellular calcium activated chloride channel activity(GO:0005229) |
| 0.2 | 0.7 | GO:0003989 | acetyl-CoA carboxylase activity(GO:0003989) |
| 0.2 | 101.8 | GO:0005509 | calcium ion binding(GO:0005509) |
| 0.2 | 2.0 | GO:0004861 | cyclin-dependent protein serine/threonine kinase inhibitor activity(GO:0004861) |
| 0.2 | 4.7 | GO:0016769 | transferase activity, transferring nitrogenous groups(GO:0016769) |
| 0.2 | 1.8 | GO:0045499 | chemorepellent activity(GO:0045499) |
| 0.2 | 2.3 | GO:0046527 | glucosyltransferase activity(GO:0046527) |
| 0.1 | 2.8 | GO:0070577 | lysine-acetylated histone binding(GO:0070577) |
| 0.1 | 11.1 | GO:0002039 | p53 binding(GO:0002039) |
| 0.1 | 3.0 | GO:0004602 | glutathione peroxidase activity(GO:0004602) |
| 0.1 | 1.1 | GO:0016308 | 1-phosphatidylinositol-4-phosphate 5-kinase activity(GO:0016308) |
| 0.1 | 1.3 | GO:1904264 | ubiquitin protein ligase activity involved in ERAD pathway(GO:1904264) |
| 0.1 | 1.1 | GO:0004749 | ribose phosphate diphosphokinase activity(GO:0004749) |
| 0.1 | 1.7 | GO:0008301 | DNA binding, bending(GO:0008301) |
| 0.1 | 0.3 | GO:0009378 | four-way junction helicase activity(GO:0009378) |
| 0.1 | 5.2 | GO:0030544 | Hsp70 protein binding(GO:0030544) |
| 0.1 | 1.5 | GO:0004862 | cAMP-dependent protein kinase inhibitor activity(GO:0004862) |
| 0.1 | 2.5 | GO:0005031 | tumor necrosis factor-activated receptor activity(GO:0005031) death receptor activity(GO:0005035) |
| 0.1 | 4.3 | GO:0001205 | transcriptional activator activity, RNA polymerase II distal enhancer sequence-specific binding(GO:0001205) |
| 0.1 | 20.6 | GO:0005543 | phospholipid binding(GO:0005543) |
| 0.1 | 0.4 | GO:0016647 | oxidoreductase activity, acting on the CH-NH group of donors, oxygen as acceptor(GO:0016647) |
| 0.1 | 0.2 | GO:0031852 | mu-type opioid receptor binding(GO:0031852) |
| 0.1 | 2.3 | GO:0017022 | myosin binding(GO:0017022) |
| 0.1 | 17.8 | GO:0004252 | serine-type endopeptidase activity(GO:0004252) |
| 0.1 | 1.1 | GO:0003708 | retinoic acid receptor activity(GO:0003708) |
| 0.1 | 0.8 | GO:0003810 | protein-glutamine gamma-glutamyltransferase activity(GO:0003810) |
| 0.1 | 1.2 | GO:0019789 | SUMO transferase activity(GO:0019789) |
| 0.1 | 1.2 | GO:0004679 | AMP-activated protein kinase activity(GO:0004679) |
| 0.1 | 0.7 | GO:0043995 | histone acetyltransferase activity (H4-K5 specific)(GO:0043995) histone acetyltransferase activity (H4-K8 specific)(GO:0043996) histone acetyltransferase activity (H4-K16 specific)(GO:0046972) |
| 0.1 | 5.8 | GO:0004843 | thiol-dependent ubiquitin-specific protease activity(GO:0004843) |
| 0.1 | 4.6 | GO:0003724 | RNA helicase activity(GO:0003724) ATP-dependent RNA helicase activity(GO:0004004) |
| 0.1 | 0.4 | GO:0001075 | transcription factor activity, RNA polymerase II core promoter sequence-specific binding involved in preinitiation complex assembly(GO:0001075) |
| 0.1 | 3.2 | GO:0043621 | protein self-association(GO:0043621) |
| 0.1 | 0.8 | GO:0005351 | sugar:proton symporter activity(GO:0005351) cation:sugar symporter activity(GO:0005402) |
| 0.1 | 0.3 | GO:1990226 | histone methyltransferase binding(GO:1990226) |
| 0.1 | 3.0 | GO:0043022 | ribosome binding(GO:0043022) |
| 0.1 | 3.2 | GO:0003725 | double-stranded RNA binding(GO:0003725) |
| 0.0 | 11.0 | GO:0003924 | GTPase activity(GO:0003924) |
| 0.0 | 4.7 | GO:0016503 | pheromone receptor activity(GO:0016503) |
| 0.0 | 0.1 | GO:0004487 | methylenetetrahydrofolate dehydrogenase (NAD+) activity(GO:0004487) |
| 0.0 | 3.2 | GO:0005516 | calmodulin binding(GO:0005516) |
| 0.0 | 3.8 | GO:0005525 | GTP binding(GO:0005525) |
| 0.0 | 0.1 | GO:0035614 | snRNA stem-loop binding(GO:0035614) |
| 0.0 | 0.8 | GO:0019707 | protein-cysteine S-palmitoyltransferase activity(GO:0019706) protein-cysteine S-acyltransferase activity(GO:0019707) |
| 0.0 | 4.1 | GO:0000287 | magnesium ion binding(GO:0000287) |
| 0.0 | 1.7 | GO:0016616 | oxidoreductase activity, acting on the CH-OH group of donors, NAD or NADP as acceptor(GO:0016616) |
| 0.0 | 0.2 | GO:0016755 | transferase activity, transferring amino-acyl groups(GO:0016755) |
| 0.0 | 0.3 | GO:0030546 | receptor activator activity(GO:0030546) |
Gene overrepresentation in curated gene sets: canonical pathways category:
| Log-likelihood per target | Total log-likelihood | Term | Description |
|---|---|---|---|
| 3.3 | 42.3 | PID P38 GAMMA DELTA PATHWAY | Signaling mediated by p38-gamma and p38-delta |
| 2.1 | 43.7 | PID INTEGRIN5 PATHWAY | Beta5 beta6 beta7 and beta8 integrin cell surface interactions |
| 1.7 | 66.6 | PID LIS1 PATHWAY | Lissencephaly gene (LIS1) in neuronal migration and development |
| 1.3 | 85.4 | PID LKB1 PATHWAY | LKB1 signaling events |
| 1.1 | 23.4 | PID PDGFRA PATHWAY | PDGFR-alpha signaling pathway |
| 0.9 | 36.9 | PID NCADHERIN PATHWAY | N-cadherin signaling events |
| 0.9 | 18.7 | PID HEDGEHOG 2PATHWAY | Signaling events mediated by the Hedgehog family |
| 0.9 | 8.0 | PID EPHB FWD PATHWAY | EPHB forward signaling |
| 0.9 | 29.4 | ST WNT BETA CATENIN PATHWAY | Wnt/beta-catenin Pathway |
| 0.7 | 11.8 | PID ERBB NETWORK PATHWAY | ErbB receptor signaling network |
| 0.6 | 35.9 | PID TRKR PATHWAY | Neurotrophic factor-mediated Trk receptor signaling |
| 0.6 | 25.6 | PID ALPHA SYNUCLEIN PATHWAY | Alpha-synuclein signaling |
| 0.6 | 15.0 | PID PI3K PLC TRK PATHWAY | Trk receptor signaling mediated by PI3K and PLC-gamma |
| 0.6 | 17.1 | ST DIFFERENTIATION PATHWAY IN PC12 CELLS | Differentiation Pathway in PC12 Cells; this is a specific case of PAC1 Receptor Pathway. |
| 0.5 | 20.4 | NABA PROTEOGLYCANS | Genes encoding proteoglycans |
| 0.5 | 5.4 | PID SYNDECAN 3 PATHWAY | Syndecan-3-mediated signaling events |
| 0.5 | 3.3 | SA B CELL RECEPTOR COMPLEXES | Antigen binding to B cell receptors activates protein tyrosine kinases, such as the Src family, which ultimate activate MAP kinases. |
| 0.5 | 9.6 | PID RAC1 PATHWAY | RAC1 signaling pathway |
| 0.4 | 9.4 | PID CDC42 REG PATHWAY | Regulation of CDC42 activity |
| 0.3 | 8.8 | PID CXCR3 PATHWAY | CXCR3-mediated signaling events |
| 0.3 | 7.1 | PID RAC1 REG PATHWAY | Regulation of RAC1 activity |
| 0.2 | 13.4 | PID CDC42 PATHWAY | CDC42 signaling events |
| 0.2 | 14.0 | PID NOTCH PATHWAY | Notch signaling pathway |
| 0.2 | 9.8 | PID AR TF PATHWAY | Regulation of Androgen receptor activity |
| 0.2 | 2.1 | PID NEPHRIN NEPH1 PATHWAY | Nephrin/Neph1 signaling in the kidney podocyte |
| 0.2 | 6.3 | SIG CHEMOTAXIS | Genes related to chemotaxis |
| 0.1 | 21.6 | NABA ECM AFFILIATED | Genes encoding proteins affiliated structurally or functionally to extracellular matrix proteins |
| 0.1 | 1.1 | PID BETA CATENIN DEG PATHWAY | Degradation of beta catenin |
| 0.1 | 1.5 | PID ERBB2 ERBB3 PATHWAY | ErbB2/ErbB3 signaling events |
| 0.1 | 20.9 | NABA ECM GLYCOPROTEINS | Genes encoding structural ECM glycoproteins |
| 0.1 | 4.6 | PID P75 NTR PATHWAY | p75(NTR)-mediated signaling |
| 0.1 | 2.8 | PID MTOR 4PATHWAY | mTOR signaling pathway |
| 0.1 | 2.1 | PID BARD1 PATHWAY | BARD1 signaling events |
| 0.1 | 0.7 | PID AJDISS 2PATHWAY | Posttranslational regulation of adherens junction stability and dissassembly |
| 0.1 | 1.0 | SIG INSULIN RECEPTOR PATHWAY IN CARDIAC MYOCYTES | Genes related to the insulin receptor pathway |
| 0.0 | 0.7 | PID EPHRINB REV PATHWAY | Ephrin B reverse signaling |
| 0.0 | 0.9 | PID HIF2PATHWAY | HIF-2-alpha transcription factor network |
| 0.0 | 2.4 | PID ERA GENOMIC PATHWAY | Validated nuclear estrogen receptor alpha network |
| 0.0 | 1.1 | PID RXR VDR PATHWAY | RXR and RAR heterodimerization with other nuclear receptor |
| 0.0 | 0.2 | PID UPA UPAR PATHWAY | Urokinase-type plasminogen activator (uPA) and uPAR-mediated signaling |
| 0.0 | 0.5 | ST FAS SIGNALING PATHWAY | Fas Signaling Pathway |
| 0.0 | 0.3 | PID LPA4 PATHWAY | LPA4-mediated signaling events |
| 0.0 | 0.7 | PID REG GR PATHWAY | Glucocorticoid receptor regulatory network |
Gene overrepresentation in curated gene sets: REACTOME pathways category:
| Log-likelihood per target | Total log-likelihood | Term | Description |
|---|---|---|---|
| 5.1 | 91.6 | REACTOME POST CHAPERONIN TUBULIN FOLDING PATHWAY | Genes involved in Post-chaperonin tubulin folding pathway |
| 4.4 | 79.3 | REACTOME CRMPS IN SEMA3A SIGNALING | Genes involved in CRMPs in Sema3A signaling |
| 3.2 | 51.2 | REACTOME IONOTROPIC ACTIVITY OF KAINATE RECEPTORS | Genes involved in Ionotropic activity of Kainate Receptors |
| 1.9 | 26.8 | REACTOME NOREPINEPHRINE NEUROTRANSMITTER RELEASE CYCLE | Genes involved in Norepinephrine Neurotransmitter Release Cycle |
| 1.9 | 24.5 | REACTOME TANDEM PORE DOMAIN POTASSIUM CHANNELS | Genes involved in Tandem pore domain potassium channels |
| 1.4 | 35.6 | REACTOME SYNTHESIS OF PC | Genes involved in Synthesis of PC |
| 1.2 | 9.7 | REACTOME NEGATIVE REGULATION OF THE PI3K AKT NETWORK | Genes involved in Negative regulation of the PI3K/AKT network |
| 1.0 | 12.3 | REACTOME PLATELET ADHESION TO EXPOSED COLLAGEN | Genes involved in Platelet Adhesion to exposed collagen |
| 1.0 | 15.2 | REACTOME SIGNAL ATTENUATION | Genes involved in Signal attenuation |
| 1.0 | 10.9 | REACTOME SYNTHESIS OF PIPS AT THE LATE ENDOSOME MEMBRANE | Genes involved in Synthesis of PIPs at the late endosome membrane |
| 1.0 | 20.2 | REACTOME NA CL DEPENDENT NEUROTRANSMITTER TRANSPORTERS | Genes involved in Na+/Cl- dependent neurotransmitter transporters |
| 0.9 | 20.8 | REACTOME NCAM1 INTERACTIONS | Genes involved in NCAM1 interactions |
| 0.9 | 23.3 | REACTOME CGMP EFFECTS | Genes involved in cGMP effects |
| 0.9 | 94.2 | REACTOME L1CAM INTERACTIONS | Genes involved in L1CAM interactions |
| 0.8 | 14.4 | REACTOME N GLYCAN ANTENNAE ELONGATION | Genes involved in N-Glycan antennae elongation |
| 0.8 | 12.6 | REACTOME SYNTHESIS SECRETION AND INACTIVATION OF GIP | Genes involved in Synthesis, Secretion, and Inactivation of Glucose-dependent Insulinotropic Polypeptide (GIP) |
| 0.8 | 21.5 | REACTOME TRAFFICKING OF AMPA RECEPTORS | Genes involved in Trafficking of AMPA receptors |
| 0.8 | 19.7 | REACTOME INSULIN RECEPTOR RECYCLING | Genes involved in Insulin receptor recycling |
| 0.8 | 20.0 | REACTOME BASIGIN INTERACTIONS | Genes involved in Basigin interactions |
| 0.8 | 6.9 | REACTOME MEMBRANE BINDING AND TARGETTING OF GAG PROTEINS | Genes involved in Membrane binding and targetting of GAG proteins |
| 0.8 | 15.2 | REACTOME RNA POL III CHAIN ELONGATION | Genes involved in RNA Polymerase III Chain Elongation |
| 0.7 | 53.6 | REACTOME REGULATION OF INSULIN SECRETION | Genes involved in Regulation of Insulin Secretion |
| 0.6 | 16.7 | REACTOME CASPASE MEDIATED CLEAVAGE OF CYTOSKELETAL PROTEINS | Genes involved in Caspase-mediated cleavage of cytoskeletal proteins |
| 0.6 | 11.0 | REACTOME SHC1 EVENTS IN ERBB4 SIGNALING | Genes involved in SHC1 events in ERBB4 signaling |
| 0.6 | 9.8 | REACTOME GABA A RECEPTOR ACTIVATION | Genes involved in GABA A receptor activation |
| 0.5 | 26.7 | REACTOME GOLGI ASSOCIATED VESICLE BIOGENESIS | Genes involved in Golgi Associated Vesicle Biogenesis |
| 0.5 | 9.0 | REACTOME DARPP 32 EVENTS | Genes involved in DARPP-32 events |
| 0.5 | 8.2 | REACTOME NEPHRIN INTERACTIONS | Genes involved in Nephrin interactions |
| 0.4 | 2.6 | REACTOME G ALPHA Z SIGNALLING EVENTS | Genes involved in G alpha (z) signalling events |
| 0.4 | 18.0 | REACTOME O LINKED GLYCOSYLATION OF MUCINS | Genes involved in O-linked glycosylation of mucins |
| 0.4 | 67.6 | REACTOME G ALPHA I SIGNALLING EVENTS | Genes involved in G alpha (i) signalling events |
| 0.4 | 5.1 | REACTOME KERATAN SULFATE BIOSYNTHESIS | Genes involved in Keratan sulfate biosynthesis |
| 0.4 | 9.2 | REACTOME ACYL CHAIN REMODELLING OF PE | Genes involved in Acyl chain remodelling of PE |
| 0.3 | 3.7 | REACTOME THE NLRP3 INFLAMMASOME | Genes involved in The NLRP3 inflammasome |
| 0.3 | 5.2 | REACTOME ENDOSOMAL SORTING COMPLEX REQUIRED FOR TRANSPORT ESCRT | Genes involved in Endosomal Sorting Complex Required For Transport (ESCRT) |
| 0.3 | 7.4 | REACTOME ADHERENS JUNCTIONS INTERACTIONS | Genes involved in Adherens junctions interactions |
| 0.3 | 9.4 | REACTOME GENERIC TRANSCRIPTION PATHWAY | Genes involved in Generic Transcription Pathway |
| 0.2 | 4.3 | REACTOME REGULATION OF GENE EXPRESSION IN BETA CELLS | Genes involved in Regulation of gene expression in beta cells |
| 0.2 | 2.3 | REACTOME ALPHA LINOLENIC ACID ALA METABOLISM | Genes involved in alpha-linolenic acid (ALA) metabolism |
| 0.2 | 15.7 | REACTOME CLASS B 2 SECRETIN FAMILY RECEPTORS | Genes involved in Class B/2 (Secretin family receptors) |
| 0.2 | 3.8 | REACTOME ACTIVATED NOTCH1 TRANSMITS SIGNAL TO THE NUCLEUS | Genes involved in Activated NOTCH1 Transmits Signal to the Nucleus |
| 0.1 | 5.0 | REACTOME ABC FAMILY PROTEINS MEDIATED TRANSPORT | Genes involved in ABC-family proteins mediated transport |
| 0.1 | 7.6 | REACTOME LOSS OF NLP FROM MITOTIC CENTROSOMES | Genes involved in Loss of Nlp from mitotic centrosomes |
| 0.1 | 3.0 | REACTOME SIGNALING BY FGFR1 FUSION MUTANTS | Genes involved in Signaling by FGFR1 fusion mutants |
| 0.1 | 1.6 | REACTOME RORA ACTIVATES CIRCADIAN EXPRESSION | Genes involved in RORA Activates Circadian Expression |
| 0.1 | 7.2 | REACTOME NUCLEAR RECEPTOR TRANSCRIPTION PATHWAY | Genes involved in Nuclear Receptor transcription pathway |
| 0.1 | 4.0 | REACTOME GLYCOSPHINGOLIPID METABOLISM | Genes involved in Glycosphingolipid metabolism |
| 0.1 | 7.7 | REACTOME PEPTIDE LIGAND BINDING RECEPTORS | Genes involved in Peptide ligand-binding receptors |
| 0.1 | 1.7 | REACTOME METABOLISM OF CARBOHYDRATES | Genes involved in Metabolism of carbohydrates |
| 0.1 | 12.9 | REACTOME SIGNALING BY RHO GTPASES | Genes involved in Signaling by Rho GTPases |
| 0.1 | 2.6 | REACTOME SYNTHESIS OF PIPS AT THE PLASMA MEMBRANE | Genes involved in Synthesis of PIPs at the plasma membrane |
| 0.1 | 1.5 | REACTOME INSULIN SYNTHESIS AND PROCESSING | Genes involved in Insulin Synthesis and Processing |
| 0.1 | 6.0 | REACTOME TRANSMISSION ACROSS CHEMICAL SYNAPSES | Genes involved in Transmission across Chemical Synapses |
| 0.1 | 2.9 | REACTOME VOLTAGE GATED POTASSIUM CHANNELS | Genes involved in Voltage gated Potassium channels |
| 0.1 | 1.4 | REACTOME PIP3 ACTIVATES AKT SIGNALING | Genes involved in PIP3 activates AKT signaling |
| 0.1 | 0.8 | REACTOME FACILITATIVE NA INDEPENDENT GLUCOSE TRANSPORTERS | Genes involved in Facilitative Na+-independent glucose transporters |
| 0.1 | 1.0 | REACTOME SYNTHESIS OF GLYCOSYLPHOSPHATIDYLINOSITOL GPI | Genes involved in Synthesis of glycosylphosphatidylinositol (GPI) |
| 0.0 | 0.7 | REACTOME INTEGRATION OF ENERGY METABOLISM | Genes involved in Integration of energy metabolism |
| 0.0 | 1.9 | REACTOME NOTCH1 INTRACELLULAR DOMAIN REGULATES TRANSCRIPTION | Genes involved in NOTCH1 Intracellular Domain Regulates Transcription |
| 0.0 | 1.5 | REACTOME CROSS PRESENTATION OF SOLUBLE EXOGENOUS ANTIGENS ENDOSOMES | Genes involved in Cross-presentation of soluble exogenous antigens (endosomes) |
| 0.0 | 1.8 | REACTOME TRANSCRIPTIONAL REGULATION OF WHITE ADIPOCYTE DIFFERENTIATION | Genes involved in Transcriptional Regulation of White Adipocyte Differentiation |
| 0.0 | 1.5 | REACTOME RESPONSE TO ELEVATED PLATELET CYTOSOLIC CA2 | Genes involved in Response to elevated platelet cytosolic Ca2+ |
| 0.0 | 0.3 | REACTOME REGULATION OF INSULIN LIKE GROWTH FACTOR IGF ACTIVITY BY INSULIN LIKE GROWTH FACTOR BINDING PROTEINS IGFBPS | Genes involved in Regulation of Insulin-like Growth Factor (IGF) Activity by Insulin-like Growth Factor Binding Proteins (IGFBPs) |
| 0.0 | 1.2 | REACTOME PHASE II CONJUGATION | Genes involved in Phase II conjugation |
| 0.0 | 0.9 | REACTOME MHC CLASS II ANTIGEN PRESENTATION | Genes involved in MHC class II antigen presentation |
| 0.0 | 0.4 | REACTOME MEMBRANE TRAFFICKING | Genes involved in Membrane Trafficking |